Q4 2017 Operations Report -...
47
4Q & FULL-YEAR 2017 February 20, 2018 OPERATIONS REPORT
Transcript of Q4 2017 Operations Report -...

4Q & FULL-YEAR 2017
February 20, 2018
OPERATIONS
REPORT

FORWARD-LOOKING STATEMENTSThis presentation contains forward-looking statements within the meaning of the federal securities laws. Although these statements reflect the current views,assumptions and expectations of our management, the matters addressed herein involve certain assumptions, risks and uncertainties that could cause actual
activities, performance, outcomes and results to differ materially from those indicated herein. Therefore, you should not rely on any of these forward-lookingstatements. All statements, other than statements of historical fact, included in this presentation constitute forward-looking statements, including but notlimited to statements identified by the words “forecast,” “may,” “believe,” “will,” “should,” “plan,” “predict,” “anticipate,” “intend,” “estimate” and “expect”and similar expressions. Such forward-looking statements include, but are not limited to, statements about guidance, projected or forecasted financial andoperating results, when additional capacity will be operational, operational results of our customers, results in certain basins, future rig count information,objectives, project timing, expectations and intentions and other statements that are not historical facts. Factors that could result in such differences orotherwise materially affect our financial condition, results of operations and cash flows include, without limitation, (a) the dependence on Devon for asubstantial portion of the natural gas that we gather, process and transport, (b) developments that materially and adversely affect Devon or our othercustomers, (c) adverse developments in the midstream business may reduce our ability to make distributions, (d) our vulnerability to having a significantportion of our operations concentrated in the Barnett Shale, (e) the amount of hydrocarbons transported in our gathering and transmission lines and the levelof our processing and fractionation operations, (f) impairments to goodwill, long-lived assets and equity method investments, (g) our ability to balance ourpurchases and sales, (h) fluctuations in oil, natural gas and NGL prices, (i) construction risks in our major development projects, (j) conducting certain of ouroperations through joint ventures, (k) reductions in our credit ratings, (l) our debt levels and restrictions contained in our debt documents, (m) our ability toconsummate future acquisitions, successfully integrate any acquired businesses, realize any cost savings and other synergies from any acquisition, (n) changesin the availability and cost of capital, (o) competitive conditions in our industry and their impact on our ability to connect hydrocarbon supplies to our assets,(p) operating hazards, natural disasters, weather-related delays, casualty losses and other matters beyond our control, (q) a failure in our computing systemsor a cyber-attack on our systems, and (r) the effects of existing and future laws and gov ernmental regulations, including env ironmental and climate changerequirements and other uncertainties. These and other applicable uncertainties, factors and risks are described more fully in EnLink Midstream Partners, LP’sand EnLink Midstream, LLC’s filings (collectively, “EnLink Midstream”) with the Securities and Exchange Commission, including EnLink Midstream Partners, LP’sand EnLink Midstream, LLC’s Annual Reports on Form 10-K, Quarterly Reports on Form 10-Q and Current Reports on Form 8-K. Neither EnLink Midstream Partners,LP nor EnLink Midstream, LLC assumes any obligation to update any forward-looking statements.
The assumptions and estimates underlying the forecasted financial information included in the guidance information in this presentation are inherentlyuncertain and, though considered reasonable by the EnLink Midstream management team as of the date of its preparation, are subject to a wide variety ofsignificant business, economic, and competitive risks and uncertainties that could cause actual results to differ materially from those contained in theforecasted financial information. Accordingly, there can be no assurance that the forecasted results are indicativ e of EnLinkMidstream’s future performanceor that actual results will not differ materially from those presented in the forecasted financial information. Inclusion of the forecasted financial information inthis presentation should not be regarded as a representation by any person that the results contained in the forecasted financial information will be achiev ed.
EnLink Midstream 4Q 2017 Operations Report 2

NON-GAAP FINANCIAL INFORMATION AND OTHER DEFINITIONSThis presentat ion contains non generally accepted account ing principles (GAAP) financial measures that w e refer to as gross operating margin, adjusted EBITDA, distributable cash flow available tocommon unit holders (“distributable cash flow ”), and EnLink Midstream, LLC (ENLC) cash available for distribution. Each of the foregoing measures is defined below . EnLink Midstream believes thesemeasures are useful to investors because they may provide users of this financial informationw ith meaningful comparisons betw een current results and prior-reported results and a meaningful measureof EnLink Midstream's cash flow after sat isfact ion of the capital and related requirements of their respect ive operations. Adjusted EBITDA achievement is a primary metric used in the EnLink MidstreamPartners, LP (“ENLK” or “the Partnership”) credit facility and short-term incentive program for compensating its employees.
Adjusted EBITDA, gross operat ing margin, dist ributable cash flow , and ENLC cash available for distribution, as defined below , are not measures of financial performance or liquidity under GAAP. Theyshould not be considered in isolation or as an indicator of EnLink Midstream’s performance. Furthermore, they should not be seen as a substitute for metrics prepared in accordancew ith GAAP.Reconciliat ions of these measures totheir most directly comparable GAAP measures for the periods that are presented in this presentat ion are included in the Appendix tothis presentat ion. See ENLK’sand ENLC’s filingsw ith the Securities and ExchangeCommission for more information.
Definit ions ofnon-GAAP measures usedin this presentation:1) Gross operating margin - revenue less cost of sales2) Adjusted EBITDA - net income (loss) plus interest expense, provision (benefit) for income taxes, depreciation and amort izat ion ex pense, impairments, unit -based compensation, (gain) loss on non-
cash derivatives, (gain) loss on disposit ion of assets, (gain) loss on extinguishment of debt, successful acquisit ion transact ion costs, accretion expense associatedw ith asset retirement obligations,reimbursed employee costs, non-cash rent and dist ribut ions from unconsolidated affiliate investments, less payments under onerous performance obligations, non-controlling interest, and (income)loss from unconsolidated affiliate investments
3) Dist ributable cash flow - adjusted EBITDA (as defined above), net to the Partnership, less interest expense (excluding amortizat ion of the EnLink Oklahoma Gas Processing, LP (together w ith itssubsidiaries, “EnLink Oklahoma T.O.”) acquisit ion installment payable discount), lit igat ion settlement adjustment, adjustments for the redeemable non-controlling interest, interest rate sw aps, currentincome taxes and other non-distributable cash flow s, accrued cash distribut ions on Series B Preferred Units and Series C Preferred Units paid or expected to be paid, and maintenance capitalex penditures, excluding maintenance capitalexpenditures thatw erecontributed by other entities and relateto the non-controlling interest ofour consolidatedentities
4) ENLC’s cash available for distribution - net income (loss) of ENLC less the net income (loss) attributable to ENLK, w hich is consolidated into ENLC’s net income (loss), plus ENLC’s (i) share ofdistributions from ENLK, (ii) share of EnLink Oklahoma T.O. non-cash expenses, (iii) deferred income tax (benefit) expense, (iv) corporate goodw ill impairment, (v) acquisition transact ion costsattributable to its share of the EnLink Oklahoma T.O. acquisition, less ENLC’s interest share in maintenance capital expenditures of EnLink Oklahoma T.O. and less third-party non-controlling interestshare of net income(loss) from consolidatedaffiliates
Other definitions and explanations of terms usedin this presentation:1) ENLK’s Adjusted EBITDA is net to ENLK after non-controlling interest2) ENLK’s Distribution Coverage is defined as ENLK’s Distributable Cash Flow dividedby ENLK’s totaldistributions declared3) ENLK’s Debt toAdjusted EBITDA, leverageratio, is defined by theENLK credit facility4) ENLC’s Growth Capital Expenditures reflect ENLC’s share ofEnLink Oklahoma T.O. growth capital expenditures5) ENLC’s Distribution Coverageis defined as ENLC’s Cash Available for Distribution dividedby ENLC’s totaldistributions declared6) Grow th capital expenditures (GCE) generally include capital expenditures made for acquisit ions or capital improvements that w e expect w ill increase our asset base, operating income or
operat ing capacityover the long-term7) Maintenance capital expenditures (MCX) include capital expenditures madeto replace part ially or fully depreciated assets in order to maintainthe existing operating capacity of the assets andto
ex tend their useful lives8) Segment profit (loss) is defined as operating income (loss) plus general and administrative expenses, depreciat ion and amort izat ion, (gain) loss on disposit ion of assets, impairments and (gain) loss
on litigation sett lement. Segment profit (loss) includes non-cash compensation expenses reflected in operating expenses. See “Item 1. Financial Statements – Note 14 Segment Information” inENLK’s Quarterly Report on Form 10-Q for the quarter ended September 30, 2017, andw hen available, “Item 8. Financial Statements and Supplementary Data – Note 15 Segment Information” inENLK’s AnnualReport on Form 10-K for theyear ended December 31, 2017, for further information about segment profit (loss)
9) Minimum volume commitments (MVC) are contractual obligations for customers to ship and/or process a minimum volume of production on our systems over an agreed t ime period, and if thecustomer fails to meet the minimum volume, the customer is obligated to pay a contractually -determined fee. See “Item 7. Management’s Discussion and Analysis of Financial Condit ion andResults ofOperations – Results of Operations” in ENLK’s Annual Report on Form 10-K for theyear ended December 31, 2017, for further information
10) Gathering is defined as a pipeline that transports hydrocarbons from a production facility to a transmission line or processing facility. Transportat ion is defined to include pipelines connected togathering lines or a facility. Gathering and transportation are referredtoas “G&T”
11) Gathering and processing arereferred to as “G&P” EnLink Midstream 4Q 2017 Operations Report 3

RIGHT
PLAN
EXECUTION
EXCELLENCERIGHT
PARTNERS
RIGHT
PLACES
2017 ACCOMPLISHMENTS

ENLK 2017 PERFORMANCE
ACHIEVING TARGETS - COMMITMENT TO FINANCIAL TENETS & EXECUTION EXCELLENCE
EnLink Midstream 4Q 2017 Operations Report 5
2017 ENLK GUIDANCE1 OUTPERFORMANCE ON KEY GUIDANCE METRICS
Net Income $116MM – $148MM ✓ -Realized $154.8MM2
FY2017 Adjusted EBITDA $840MM – $880MM ✓-Achieved $872.8MM, ~13% growth over 2016
4Q17 Adjusted EBITDA Exit Run-Rate $925MM – $950MM ✓-Achieved $238.7MM for 4Q17, $954.8MM annualized
Debt / Adjusted EBITDA 3.75x – 4.00x ✓-Delivered attractive leverage of ~3.58x3
Distribution Coverage >1.0x ✓-Achieved 4Q17 coverage of 1.07x, FY2017 coverage of 1.02x
1 As reaffirmed October 31, 2017. 2 Actual includes ~$25MM deferred tax benefit due to federal tax rate reductions from the tax legislation enacted in December 2017. 3 As of December 31, 2017. 4 For the year ended December 31,
2017. 5 Top 50 customers are defined as a percentage of revenue. IG is defined by internal or external metrics.
~94% FEE-BASED% of 2017 Gross Operating Margin3
~90% IG COUNTERPARTIES(Investment Grade)
2017 Top 50 Customers 4,5
90%
10%
IG Counterparties Other
94%
6%
Fee-Based Commodity
Similar mix expected in 2018

ENLC 2017 PERFORMANCE
STRONG CASH FLOW GROWTH SUPPORTS STABLE DISTRIBUTION INCREASE
EnLink Midstream 4Q 2017 Operations Report 6
1 2017 Guidance as provided on January 23, 2017. 2 Actual includes ~$211MM deferred tax benefit due to federal tax rate reduct ions from the tax legislation enacted in December 2017. 3 Calculated as 2018 declared distributions divided
by 2017 declared distributions. The payment and amount of dist ributions, if any , are subject to approval by the Board of Directors of ENLC and to economic conditions and other factors existing during the time of determination.
2017 ENLC GUIDANCE 1 ONGOING COMMITMENT TO UNITHOLDER VALUE
Net Income $45MM – $105MM ✓ -Recognized $320.0MM2
Cash Available for Distribution $215MM - $225MM ✓-Reached $216.5MM
Distribution Coverage 1.1x – 1.2x ✓-Achieved 4Q17 coverage of 1.23x, FY2017 coverage 1.16x
1.04
1.07
1.10
1.13
1.09
1.13
1.17
1.23
1Q16A 2Q16A 3Q16A 4Q16A 1Q17A 2Q17A 3Q17A 4Q17A
Delivered ~6% Growth
2017 over 2016
4Q17A 1Q18E 2Q18E 3Q18E 4Q18E
Expect ~5% Growth
FY2018 over FY2017
ENLC has demonstrated ~9% growth in quarterly
distribution coverage, 4Q17 over 4Q16, exiting 2017 at >1.2x
Confidence in business performance and growth in
ENLC distribution coverage supports ~5% annual 2018 over 2017 as-declared distribution growth.3

2017: EXECUTION ON OUR 7 STRATEGIES
DELIVERED ON OPERATIONAL PRIORITIES
EnLink Midstream 4Q 2017 Operations Report 7
STRATEGIC OBJECTIVE 2017: EXECUTION EXCELLENCE
OKLAHOMAMaximizestrategic position
✓ 1 Bcf/d gas processing serving diverse STACK and Merge producer customers
✓ >40% 2017 over 2016 average gas processing volume growth
MIDLAND BASINIncrease asset utilization
✓ >15% 2017 over 2016 average gas G&P volume growth
✓ 1st full year: Chickadee in-service, added capital-efficient bolt-on projects
DELAWARE BASIN Achieve scale✓ ~300% 2017 over 2016 average gas G&P volumes growth
✓ 155 MMcf/d processing capacity YE17
GULF COAST NGLs Drive growth✓ Increased NGLs from EnLink’s Permian and Oklahoma assets filled Cajun Sibon 4Q17
✓ >10% 2017 over 2016 fractionation volume growth
LOUISIANA GASCapture incremental opportunities
✓ ~20% 2017 over 2016 average G&T volume growth
✓ Record-setting G&T volumes of ~2 Bcf/d on average in 2017
LOUISIANARepurpose redundant infrastructure
✓ Capital efficient project opportunities identified for existing infrastructure utilization
✓ Evaluated crude, NGL, and gas market growth opportunities
BARNETT SHALEProactiveparticipation in redevelopment
✓ 1-2 drilling rigs consistently active on our footprint for the first time since 2015
✓ Devon engaged in successful pilot programs with 12 well refracs and 6 new wells

RIG GROWTH ON ENLINK SYSTEMS EXCEEDS U.S. RATE
~ 32%
8
✓ U.S. rig count has strengthened with the
trend in crude prices
✓ U.S. rig count has continued to rise as producers enhance production
economics
✓ Superior economics in Central OK,
Delaware and Midland Basins has driv en rig growth that has outpaced the U.S. rig
growth rate
✓ EnLink operates in these basins v ia a strategically adv antaged asset position
✓ EnLink’s producer customers’ rig activ ities
outpaced av erage activ ity in both the U.S. and the Core Basins
✓ Rig count reflects acreage and v olume
dedications, both of which will deliv er v olumes to EnLink’s systems in 2018 and
beyond
741
975
Feb '17 Feb '18
403
555
Feb '17 Feb '18
39
57
Feb '17 Feb '18
U.S. RIG COUNT1 RIGS IN CORE BASINS1 RIGS ON OUR SYSTEMS1
1 February 2017 rig count according to October 2017 EnLink Operations Report. February 2018 rig count is as of February 9, 2018. All rig data is according to RigData. Rig count include rigs on assets w ith partial ownership. EnLink Midstream 4Q 2017 Operations Report
YEAR-OVER-YEAR RIG GROWTH
~ 38% ~ 46%~ 32%
EXECUTION
EXCELLENCERIGHT
PARTNERS
RIGHT
PLACES
RIGHT
PLAN
2018 RIGHT PLAN:
7 GROWTH STRATEGIES
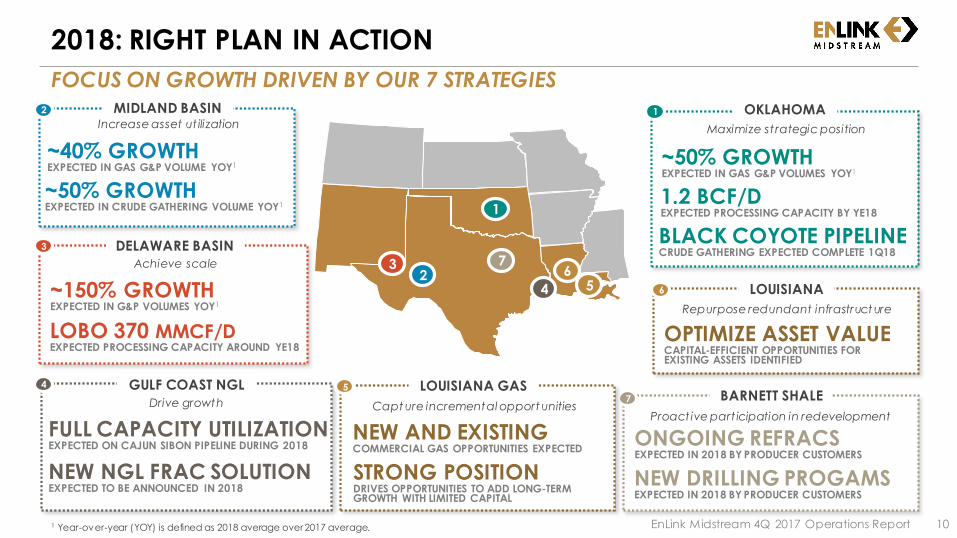
2018: RIGHT PLAN IN ACTION
FOCUS ON GROWTH DRIVEN BY OUR 7 STRATEGIES
EnLink Midstream 4Q 2017 Operations Report
DELAWARE BASIN
~150% GROWTHEXPECTED IN G&P VOLUMES YOY1
LOBO 370 MMCF/DEXPECTED PROCESSING CAPACITY AROUND YE18
3
Achieve scale
BARNETT SHALE7
Proact ive part icipation in redevelopment
NEW DRILLING PROGAMSEXPECTED IN 2018 BY PRODUCER CUSTOMERS
ONGOING REFRACSEXPECTED IN 2018 BY PRODUCER CUSTOMERS
GULF COAST NGL
FULL CAPACITY UTILIZATIONEXPECTED ON CAJUN SIBON PIPELINE DURING 2018
4
Drive growth
NEW NGL FRAC SOLUTIONEXPECTED TO BE ANNOUNCED IN 2018
OKLAHOMA
1.2 BCF/DEXPECTED PROCESSING CAPACITY BY YE18
~50% GROWTHEXPECTED IN GAS G&P VOLUMES YOY1
1
Maximize st rategic position
BLACK COYOTE PIPELINECRUDE GATHERING EXPECTED COMPLETE 1Q18
32
1
7
4 56
LOUISIANA
Repurpose redundant infrastructure
OPTIMIZE ASSET VALUECAPITAL-EFFICIENT OPPORTUNITIES FOR EXISTING ASSETS IDENTIFIED
6
1 Year-over-year (YOY) is defined as 2018 average over 2017 average.
LOUISIANA GAS
Capture incremental opportunities
STRONG POSITIONDRIVES OPPORTUNITIES TO ADD LONG-TERM GROWTH WITH LIMITED CAPITAL
NEW AND EXISTINGCOMMERCIAL GAS OPPORTUNITIES EXPECTED
5
MIDLAND BASIN
~40% GROWTHEXPECTED IN GAS G&P VOLUME YOY1
2
Increase asset ut ilization
~50% GROWTHEXPECTED IN CRUDE GATHERING VOLUME YOY1
10

2018 VOLUME & SEGMENT PROFIT GUIDANCE
EnLink Midstream 4Q 2017 Operations Report 11
SIGNIFICANT VOLUME GROWTH IN OKLAHOMA & PERMIAN DRIVING CASH FLOW
Expect a further strengthened financial position▪ Coverage build at ENLK ▪ Resumption of ENLC distribution growth ▪ Ongoing commitment to Investment
Grade rating
2018 adjusted EBITDA growth, of >10% over 2017, expect volume growth across our key growth basins as the primary driver ▪ Growth in Oklahoma and Permian
expected to more than offset NTX decline beyond 2018
▪ Multi-commodity growth in Central Oklahoma expected to translate directly into strategic crude and NGL growth
Expect another year of attractive adjusted EBITDA growth in 2019, based upon 2018 expansions underway
HIGHLIGHTS
1 Includes volumes associated w ith non-controlling interests. 2 Est imate for 2018.
Segment Profit and Volume Outlook1 2017
Actuals2018 Guidance
Range2
~% r 2018
Guidance Mid-
point vs 2017
2018 Average
MMBtu /
Mcf Conversion
Oklahoma
(Volume in 1,000 MMBtu/d)
Segment Profit ($MM) $287 $405 - $445 ~50%
Processing 810 1,135 - 1,245 ~50% 1.21
Gas Gathering & Transmission 829 1,160 - 1,275 ~50%
Texas
(Volume in 1,000 MMBtu/d)
Segment Profit ($MM) $421 $425 - $465 ~5%
Processing – Permian 385 610 - 670 ~65% 1.33
Gas Gathering – Permian 361 600 - 650 ~70%
Processing – North TX 799 730 - 780 ~(6%) 1.16
Gas Gathering & Transmission – North TX 1,902 1,740 - 1,810 ~(7%)
Louisiana
(Volume in 1,000 MMBtu/d unless noted)
Segment Profit ($MM) $212 $200 - $220 ~0%
NGL Fractionation (1,000 Bbl/d) 137 142 - 152 ~5%
Gas Processing 453 360 - 380 ~(20%) 1.09
Gas Gathering & Transmission 1,996 1,800 - 2,100 ~0%
Crude & Condensate
(Volume in 1,000 Bbl/d)
Segment Profit ($MM) $43 $45 - $55 ~15%
Total Volume 108 140 - 160 ~40%

RIGHT
PLAN
EXECUTION
EXCELLENCERIGHT
PARTNERS
RIGHT
PLACES
FOCUS ON CORE ASSETS
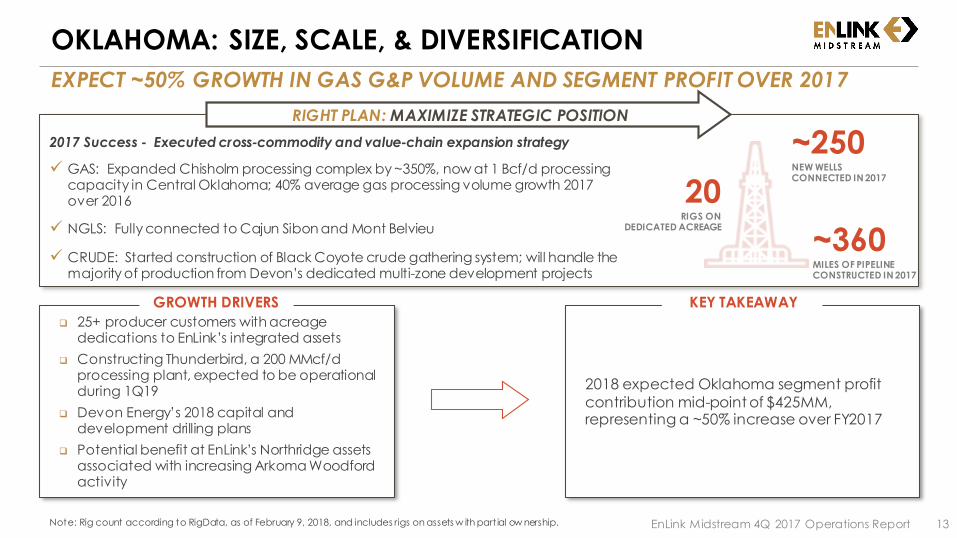
2018 expected Oklahoma segment profit
contribution mid-point of $425MM, representing a ~50% increase over FY2017
25+ producer customers with acreage dedications to EnLink’s integrated assets
Constructing Thunderbird, a 200 MMcf/d processing plant, expected to be operational during 1Q19
Devon Energy’s 2018 capital and development drilling plans
Potential benefit at EnLink’s Northridge assets associated with increasing Arkoma Woodford activity
KEY TAKEAWAY GROWTH DRIVERS
OKLAHOMA: SIZE, SCALE, & DIVERSIFICATION
EXPECT ~50% GROWTH IN GAS G&P VOLUME AND SEGMENT PROFIT OVER 2017
EnLink Midstream 4Q 2017 Operations Report 13Note: Rig count according to RigData, as of February 9, 2018, and includes rigs on assets w ith part ial ow nership.
~250NEW WELLS CONNECTED IN 2017
~360MILES OF PIPELINE CONSTRUCTED IN 2017
2017 Success - Executed cross-commodity and value-chain expansion strategy
✓ GAS: Expanded Chisholm processing complex by ~350%, now at 1 Bcf/d processing capacity in Central Oklahoma; 40% average gas processing volume growth 2017 over 2016
✓ NGLS: Fully connected to Cajun Sibon and Mont Belvieu
✓ CRUDE: Started construction of Black Coyote crude gathering system; will handle the majority of production from Devon’s dedicated multi-zone development projects
RIGHT PLAN: MAXIMIZE STRATEGIC POSITION
20RIGS ON
DEDICATED ACREAGE

Devon announced $700MM of planned E&P capital in the STACK in 2018, including:
7 large scale, multi-zone development projects
>100 new operated STACK wells online, with ~60% related to multi-zone development
Showboat, Devon’s initial multi-zone STACK development, consists of 24 wells
• Devon’s production is fully dedicated to EnLink
• Completion crew activity began early February
• Initial production expected in 2Q18
ENLINK GROWTH DRIVERS DEVON DEVELOPMENT PROJECT TIMELINE
DEVON ENERGY STACK DEVELOPMENT UPDATE
CONNECTING TO OPERATIONAL MOMENTUM
EnLink Midstream 4Q 2017 Operations Report 14Note: Details above sourced from Devon Energy Corp. Please see the Investors’ section of the Devon w ebsite for further details.
4Q17 Highlights - Devon announced several well productivity successes
✓ Devon’s top 30 operated wells in 4Q averaged 30-day IP rates of >2,500 Boe/d (~60% oil)
✓ 12 STACK wells in the over-pressured oil window achieved average 30-day rates of ~3,200 Boe/d (~55% oil)
✓ 5 STACK wells attained 30-day rates of >4,000 Boe/d, successfully testing 5 different landing intervals
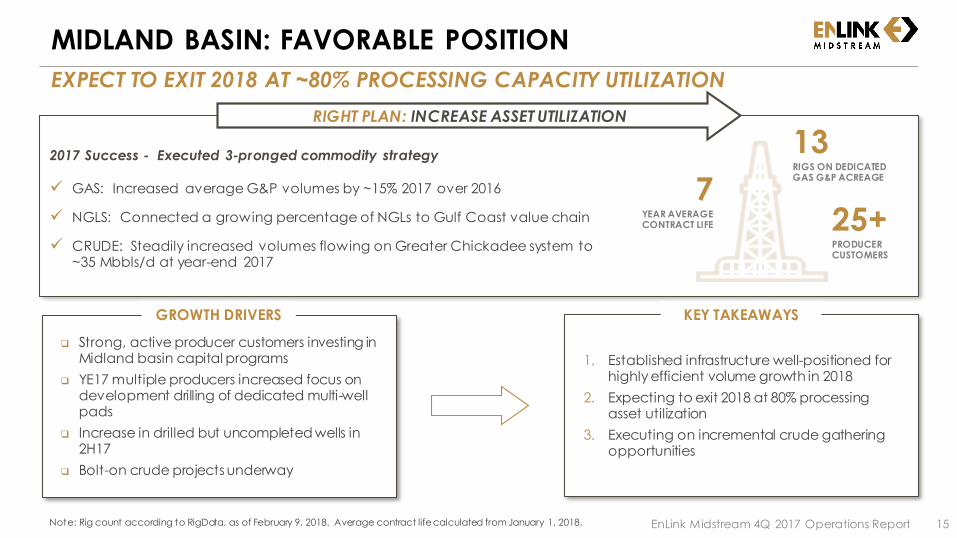
MIDLAND BASIN: FAVORABLE POSITION
EXPECT TO EXIT 2018 AT ~80% PROCESSING CAPACITY UTILIZATION
EnLink Midstream 4Q 2017 Operations Report 15Note: Rig count according to RigData, as of February 9, 2018. Average contract life calculated from January 1, 2018.
13RIGS ON DEDICATEDGAS G&P ACREAGE
25+PRODUCERCUSTOMERS
2017 Success - Executed 3-pronged commodity strategy
✓ GAS: Increased average G&P volumes by ~15% 2017 over 2016
✓ NGLS: Connected a growing percentage of NGLs to Gulf Coast value chain
✓ CRUDE: Steadily increased volumes flowing on Greater Chickadee system to ~35 Mbbls/d at year-end 2017
RIGHT PLAN: INCREASE ASSET UTILIZATION
7YEAR AVERAGE CONTRACT LIFE
1. Established infrastructure well-positioned for highly efficient volume growth in 2018
2. Expecting to exit 2018 at 80% processing asset utilization
3. Executing on incremental crude gathering opportunities
Strong, active producer customers investing in Midland basin capital programs
YE17 multiple producers increased focus on development drilling of dedicated multi-well pads
Increase in drilled but uncompleted wells in 2H17
Bolt-on crude projects underway
KEY TAKEAWAYS GROWTH DRIVERS

DELAWARE BASIN: LOBO LOCATED IN THE CORE
EXPANDING ATTRACTIVE DELAWARE GATHERING & PROCESSING PLATFORM
EnLink Midstream 4Q 2017 Operations Report 16Note: Rig count according to RigData, as of February 9, 2018, and includes rigs on assets w ith part ial ow nership. Delaw are assets are 49.9% owned by Natural Gas Partners (NGP).
23RIGS DRILLING ON ENLINK’S CAPTURE AREA7
PRODUCERCUSTOMERS
2017 Success - Achieved strong volume growth and asset expansion
✓ Increased average volumes processed and gathered by ~300% 2017 over 2016
✓ Gained significant commercial momentum by adding 5 new producer customers, increasing diversification and accelerating volume growth
RIGHT PLAN: ACHIEVE SCALE
1. Focus on organic growth around our core footprint in Texas and New Mexico
2. Core producers’ wells results continue to improve
3. ~150% average volume growth projected for 2018 over 2017
4. Lobo expansion in-service around YE18
Active producer customers drilling wells across acreage committed to EnLink’s G&P assets
Core producer customers with the ability to fund significant capital programs
Location of gathering lines and processing plants in core Delaware basin
KEY TAKEAWAYS GROWTH DRIVERS

GULF COAST NGLS: LEVERAGING THE VALUE CHAIN
NGL ASSETS LINK OKLAHOMA & PERMIAN NGL VOLUMES TO GULF COAST DEMAND
EnLink Midstream 4Q 2017 Operations Report 17
RIGHT PLAN: DRIVE GROWTH IN GULF COAST NGL PLATFORM
~80%LOUISIANA Y-GRADE
FRACTIONATION CAPACITY
UTILIZATION FY17
~90%CAJUN SIBON PIPELINE
UTILIZATION FY17
2017 Success - Achieved strong volume and profit growth
✓ Increased average fractionation volumes by >10% over 2016
✓ Increased contribution to Louisiana segment profit by >20% over 2016
✓ Realized ~15% increase in average throughput volumes 2017 over 2016
1. Projecting full capacity utilization of Cajun
Sibon during 2018
2. Determining next phase solutions for NGL
Gulf Coast platform; new fractionation
solution expected to be announced in
2018
Preferentially shipping NGL supply from
EnLink’s Oklahoma and Permian G&P assets to both Cajun Sibon and Mont Belvieu
Equity volumes enable maximizing
incremental value from NGL value chain:
transportation, fractionation, storage, export, and sale
KEY TAKEAWAYS GROWTH DRIVERS

LOUISIANA GAS: PREMIER MARKET FOOTPRINT
ONE OF THE LARGEST GAS PIPELINE SYSTEMS IN LOUISIANA
EnLink Midstream 4Q 2017 Operations Report 18
RIGHT PLAN: CAPTURE SIGNIFICANT INCREMENTAL GAS OPPORTUNITIES
2017 Success - Achieved record volumes
✓ Averaged ~2 Bcf/d of gas throughput during 2017
✓ Achieved peak day throughput of over 2.5 Bcf/d in 4Q17
✓ Increased average gathering and transmission volumes by ~20%
2017 over 2016
1. Continuing to execute on capital-efficient
bolt-on projects to:
• Capture and secure new gas demand
• Expand delivery reach
• Increase supply options
2. Capture increasing market share of LNG and Mississippi River market growth
Record setting transmission volumes in 2017, expected to result in ongoing opportunities
for new and existing customers
Grow supply options in conjunction with
increasing customer demand across the footprint
Direct access to LNG corridor and
Mississippi River market growth
KEY TAKEAWAYS GROWTH DRIVERS
~20%GAS G&T VOLUME GROWTH
2017 OVER 2016 >2BCF/D NAT. GAS
G&T THROUGHPUT 2H17

• Third Party refining capacity in Louisiana is
~3.3 million bbl/d
• Third Party petchem & industrial facility consumption in Louisiana is ~3 Bcf/d
• Third Party LNG facility capacity in Louisiana
has been ~3.2 Bcf/d on peak days in 2018,
with additional demand of ~2.5 Bcf/d
expected by YE19
DEMAND MARKET POTENTIAL1
LOUISIANA: TRANSFORMING EXISTING ASSETS
SEEKING HIGHEST VALUE UTILIZATION OF EXISTING ASSETS
EnLink Midstream 4Q 2017 Operations Report 19
UNIQUE OPPORTUNITY to ADD VALUE & DIVERSIFY service offerings via potentially REPURPOSING under -utilized infrastructure
✓ Refinery, petchem, industrial, power generation, and LNG export demand located in proximity to existing pipeline footprint
✓ Pursuing value added opportunities to enhance services provided to market participants
✓ Alternate utilization should entail limited, if any, impact on current or anticipated market area service capabilities
RIGHT PLAN: REPURPOSE REDUNDANT PIPELINE INFRASTRUCTURE
1 Refining, Petchem, and Industrial facility capacity information w as sourced from the EIA w ebsite, and is as of 2016. LNG facility capacity is sourced from Cheniere and Sempra public company informat ion.

Redevelopment and new well activity
projected to reduce annual volume decline in 2018 over 2017
KEY TAKEAWAY
Producer customers increasing activity in
the area, expected to benefit from new producing wells and incremental horizontal
refracs in 2018
Devon allocating $50MM of 2018 E&P
capital in the basin Devon announced advanced negotiations
with its preferred buyer of select Johnson
County assets, with a sale announcement
expected by the end of 1Q18
UPSIDE DRIVERS
BARNETT SHALE: REDEVELOPMENT PROGRESSES
SIZE AND SCALE IN ESTABLISHED BASIN
EnLink Midstream 4Q 2017 Operations Report 20
RIGHT PLAN: PROACTIVE PARTICIPATION IN REDEVELOPMENT
Note: Details above sourced from Devon Energy. Please see the Investors’ section of the Devon w ebsite for further details.
>100PRODUCER
CUSTOMERS
1-2RIGS ON DEDICATED
ACREAGE PROJECTED
THROUGHOUT 2018
MultipleACTIVE
PRODUCER CUSTOMERS
2017 Success – Strengthen long-term basin outlook
✓ Encouraged by recent increase in producer customer drilling and recompletion activity
o Key producer customer, Devon Energy, announced its positive 2017 6-well drilling pilot results: initial 30-day production rates up to 6.5 MMcf/d and capital costs of ~$3MM per well
✓ EnLink continuously optimizes operating pressure to increase volumes, while working to reduce operating costs

RIGHT
PLAN
EXECUTION
EXCELLENCERIGHT
PARTNERS
RIGHT
PLACES
APPENDIX
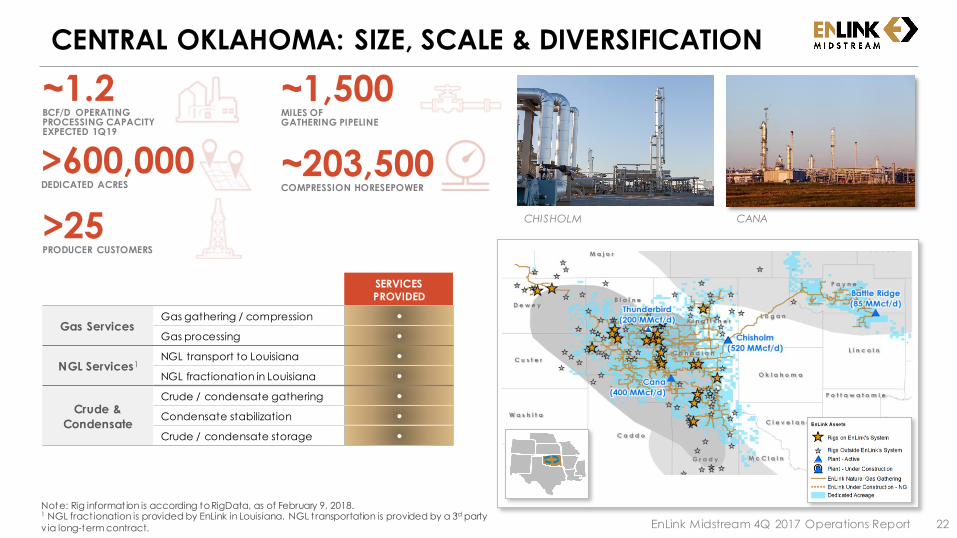
CENTRAL OKLAHOMA: SIZE, SCALE & DIVERSIFICATION
CHISHOLM CANA
~1,500 MILES OF GATHERING PIPELINE
>600,000DEDICATED ACRES
~203,500 COMPRESSION HORESEPOWER
~1.2BCF/D OPERATING PROCESSING CAPACITY EXPECTED 1Q19
Note: Rig information is according to RigData, as of February 9, 2018. 1 NGL fract ionation is provided by EnLink in Louisiana. NGL t ransportation is provided by a 3rd party
via long-term contract. EnLink Midstream 4Q 2017 Operations Report 22
SERVICES
PROVIDED
Gas ServicesGas gathering / compression ●
Gas processing ●
NGL Services1NGL transport to Louisiana ●
NGL fractionation in Louisiana ●
Crude &
Condensate
Crude / condensate gathering ●
Condensate stabilization ●
Crude / condensate storage ●
>25PRODUCER CUSTOMERS

SERVICES
PROVIDED
Gas ServicesGas gathering / compression ●
Gas processing ●
NGL Services NGL fractionation ●
Crude &
Condensate
Crude / condensate gathering ●
Crude trucking ●
Condensate stabilization ●
Crude / condensate storage ●
MIDLAND BASIN: GAS & CRUDE GATHERING FOOTPRINT
EnLink Midstream 4Q 2017 Operations Report 23
RIPTIDE DEADWOOD
Note: Rig information is according to RigData, as of February 9, 2018.
~700MILES OF GAS GATHERING PIPELINE
~440,000DEDICATED ACRES
408MMCF/D OPERATING PROCESSING CAPACITY
~360MILES OF CRUDEGATHERING PIPELINE
50TRACTOR TRAILERS
~103,500COMPRESSION HORESEPOWER
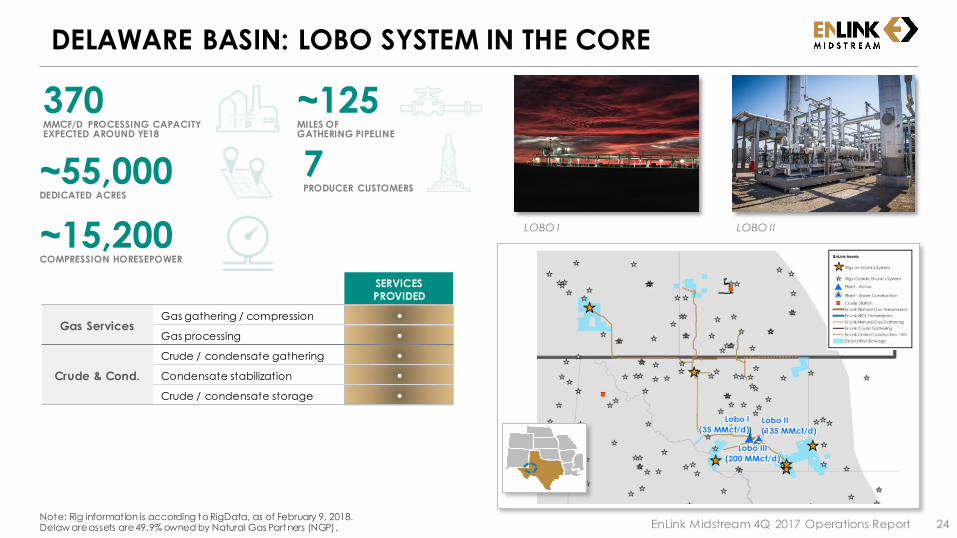
DELAWARE BASIN: LOBO SYSTEM IN THE CORE
EnLink Midstream 4Q 2017 Operations Report 24Note: Rig information is according to RigData, as of February 9, 2018. Delaw are assets are 49.9% owned by Natural Gas Partners (NGP).
LOBO I LOBO II
SERVICES
PROVIDED
Gas ServicesGas gathering / compression ●
Gas processing ●
Crude & Cond.
Crude / condensate gathering ●
Condensate stabilization ●
Crude / condensate storage ●
~125MILES OF GATHERING PIPELINE
~55,000DEDICATED ACRES
370MMCF/D PROCESSING CAPACITY EXPECTED AROUND YE18
7PRODUCER CUSTOMERS
~15,200 COMPRESSION HORESEPOWER

SERVICES
PROVIDED
NGL Services
NGL gathering ●
NGL transportation ●
NGL fractionation ●
NGL storage ●
Truck, rail & barge terminal ●
LPG Exports ●
Crude &
CondensateCrude / condensate storage ●
LOUISIANA NGL: VALUE CHAIN GROWTH
EnLink Midstream 4Q 2017 Operations Report 25Note: Ascension Pipeline is 50% ow ned by Marathon Petroleum Corp. subsidiary through a joint venture.
~130MBBL/D CURRENT CAPACITY CAJUN SIBON Y-GRADE PIPELINE
~4.4MMBBLS WORKING LIQUIDS STORAGE
175MBBL/D FRACTIONATION CAPACITY
~130MBBL/D MAXIMUM CAPACITY ASCENSION BUTANE & NATURAL GASOLINE PIPELINE
~790MILES OF Y-GRADE TRANSMISSION PIPELINE
PLAQUEMINE RIVERSIDE
SERVICES
PROVIDED
Gas Services
Gas gathering / treating ●
Gas processing ●
Gas transportation ●
Gas storage ●
Gas sales & marketing ●
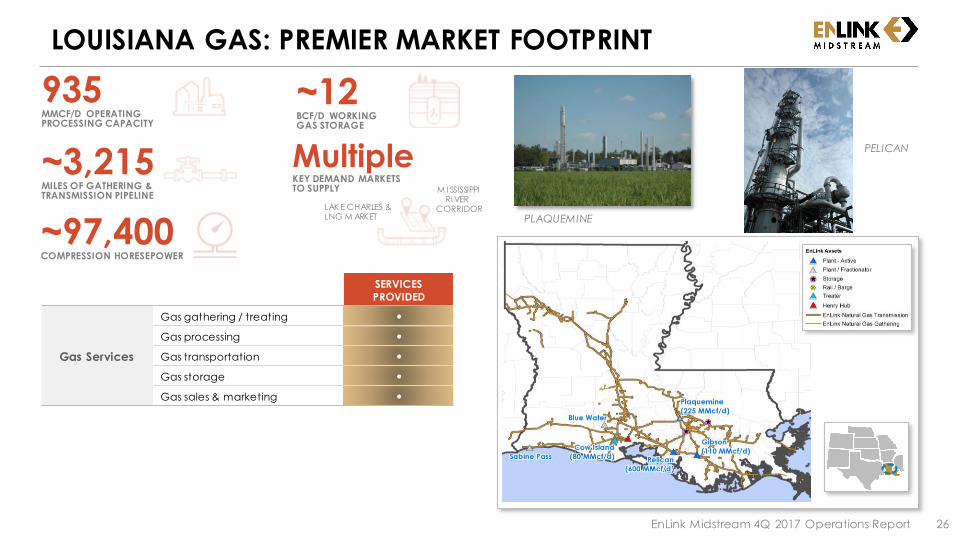
LOUISIANA GAS: PREMIER MARKET FOOTPRINT
EnLink Midstream 4Q 2017 Operations Report 26
M I SSISSIPPI RI VER
CORRIDORLAK E CHARLES & LNG M ARKET PLAQUEMINE
PELICAN
~3,215 MILES OF GATHERING & TRANSMISSION PIPELINE
~12BCF/D WORKING GAS STORAGE
MultipleKEY DEMAND MARKETSTO SUPPLY
935MMCF/D OPERATING PROCESSING CAPACITY
~97,400 COMPRESSION HORESEPOWER

SERVICES
PROVIDED
Gas Services
Gas gathering / compression ●
Gas processing ●
Gas transportation ●
Gas storage ●
NGL ServicesNGL transportation ●
NGL fractionation ●
Crude &
CondensateCondensate stabilization ●
NORTH TEXAS: SUBSTANTIAL CASH FLOW IN THE BARNETT
EnLink Midstream 4Q 2017 Operations Report 27
BRIDGEPORT SILVER CREEK
~1.1BCF/D OPERATING PROCESSING CAPACITY
15,000BBL/D FRACTIONATIONCAPACITY
~3,980MILES OF GATHERING & TRANSMISSION PIPELINE
>100PRODUCER CUSTOMERS
~341,600COMPRESSION HORESEPOWER
Note: Rig information is according to RigData, as of February 9, 2018.

✓ Maintain desirable position in key supply basins and critical demand regions; portfolio of supply-push and demand-pull assets provides diversification, stability, and value-chain margin opportunities
SUSTAINABILITY AND GROWTH DRIVERS
CORE ASSET INTEGRATION ACROSS PRODUCTS, BASINS & SERVICES
EnLink Midstream 4Q 2017 Operations Report 28
✓ Continue developing a suite of integrated midstream
solutions across commodities, basins and services; proactively growing scale and increasing utilization
✓ Further organically develop and extend our strategic
asset portfolio in top U.S. supply basins and demand regions
✓ Focused execution on organic growth projects in our
growing supply and demand areas
7FRACTIONATORS
~260MBBL/D FRACTIONATION CAPACITY
20PROCESSING FACILITIES
~4.8BCF/D PROCESSING CAPACITY
~11K MILES OF PIPELINE
~1,500EMPLOYEES OPERATING ASSETS IN 7 STATES
Note: Assets above include those w ith partial ow nership.
RIGHT PLACES RIGHT PLAN

2017 GROWTH CAPITAL EXPENDITURES
CAPITAL SPEND REMAINS WITHIN GUIDANCE
29
Growth Capital
Expenditures
JV Partner
Contributions
ENLC's Share of
EnLink
Oklahoma T.O.
Growth Capital
Expenditures
ENLK Growth
Capital
Expenditures
Guidance
2017 NET CAPITAL OUTLAY GUIDANCE ($MM) 2017 GROWTH CAPITAL EXPENDITURES ($MM)
Growth Capital
Expenditures
JV Partner
Contributions
ENLC's Share of
EnLink
Oklahoma T.O.
Growth Capital
Expenditures
ENLK Growth
Capital
Expenditures
Segment Oklahoma Texas LouisianaCrude &
CondensateCorporate
Total Growth
Capital
Maintenance
Capex
FY 2017 Guidance $360 – $460 $110 – $140 $88 – $102 $35 – $45 $17 – $23 $610 – $770 $38 – $48
FY 2017 Actual $435 $126 $69 $76 $24 $730 $32
2017 GROWTH CAPITAL EXPENDITURES BY SEGMENT
Note: Neither 2017 Net Capital Out lay Guidance nor 2017 Growth Capital Expenditures include capitalized interest. EnLink Midstream 4Q 2017 Operations Report
505-645
610-770
(60)-(70)(45)-(55)
609
730
(64)(57)

QUARTERLY VOLUMES & SEGMENT PROFIT
EnLink Midstream 4Q 2017 Operations Report 30
1 Tex as segment profit in 2016 includes $1.3MM in Q4, attributable to North Texas Pipeline (NTPL), w hich w as divested in Q4 2016. Tex as segment volumes in 2016 include (in 1,000 MMBtu/d) 232 in Q4, which w ere associated w ith NTPL.
Note: Includes volumes associated w ith non-controlling interests.
Three Months Ended Year Ended
In $ millions unless otherwise notedDec. 31,
2016Mar. 31,
2017
Jun. 30,
2017
Sept. 30,
2017Dec. 31,
2017Dec. 31,
2017
Texas1
Segment Profit $103.2 $101.4 $105.6 $107.6 $106.3 420.9
Gross Operating Margin $146.5 $145.3 $148.5 $148.7 $151.1 593.6
Gathering and Transportation (MMBtu/d) 2,518,100 2,274,100 2,272,100 2,251,700 2,254,100 2,262,900
Processing (MMBtu/d) 1,128,200 1,162,100 1,179,700 1,194,300 1,201,100 1,184,400
LouisianaSegment Profit $48.9 $46.7 $45.4 $51.0 $69.1 212.2
Gross Operating Margin $73.3 $72.1 $70.0 $75.8 $95.6 313.5
Gathering and Transportation (MMBtu/d) 1,897,600 1,931,300 1,939,500 2,009,300 2,101,200 1,995,800
Processing (MMBtu/d) 472,100 467,800 446,500 443,400 455,700 453,300
NGL Fractionation (Gals/d) 5,204,300 5,245,500 5,819,600 5,814,800 6,200,500 5,772,800
OklahomaSegment Profit $52.7 $53.4 $68.8 $79.1 $86.0 287.3
Gross Operating Margin $67.6 $67.5 $83.5 $96.2 $104.7 351.9
Gathering and Transportation (MMBtu/d) 644,200 705,500 765,500 889,200 953,600 829,300
Processing (MMBtu/d) 584,100 652,800 733,100 872,200 978,700 810,300
Crude & CondensateSegment Profit $13.7 $11.2 $7.2 $10.4 $14.4 43.2
Gross Operating Margin $33.3 $31.9 $27.6 $29.5 $34.3 123.3
Crude Oil Handling (Bbls/d) 81,200 110,400 107,600 95,700 119,200 108,200
Brine Disposal (Bbls/d) 3,800 4,300 4,800 4,800 2,900 4,200

278 341 362 408 427
850 821 818 786 774
1,128 1,162 1,180 1,194 1,201
4Q16 1Q17 2Q17 3Q17 4Q17
LOUISIANA GAS LIQUIDS
QUARTERLY VOLUMES1
EnLink Midstream 4Q 2017 Operations Report 31
OKLAHOMA TEXAS2
GATHERING & TRANSMISSION (1,000 M MBtu/d)
PROCESSING(1,000 M MBtu/d)
GATHERING & TRANSMISSION(1,000 M MBtu/d)
CRUDE & CONDENSATE(1,000 bbls/d)
North TXPermian NTPL North TXPermian
1 Includes volumes associated w ith non-controlling interests. 2 Tex as volumes in 2016 include 232 (in 1,000s of MMBtu/d) in Q4 related to the NTPL, w hich w as divested in Q4 2016.
PROCESSING(1,000 M MBtu/d)
GATHERING & TRANSMISSION(1,000 M MBtu/d)
PROCESSING(1,000 M MBtu/d)
644 706 766889
954
4Q16 1Q17 2Q17 3Q17 4Q17
584653
733872
979
4Q16 1Q17 2Q17 3Q17 4Q17
258 313 341 385 405
2,028 1,961 1,931 1,867 1,849
232
2,5182,274 2,272 2,252 2,254
4Q16 1Q17 2Q17 3Q17 4Q17
81110 108
96119
4Q16 1Q17 2Q17 3Q17 4Q17
LOUISIANA NGL FRACTIONATION (1,000 bbls/d)
1,898 1,931 1,940 2,009 2,101
4Q16 1Q17 2Q17 3Q17 4Q17
124 125139 138 148
4Q16 1Q17 2Q17 3Q17 4Q17
472 468 447 443 456
4Q16 1Q17 2Q17 3Q17 4Q17

CRUDE & CONDENSATELOUISIANA
SEGMENT PROFIT1 (IN $MM)
EnLink Midstream 4Q 2017 Operations Report 32
TEXAS2
1 Includes profit associated w ith non-controlling interests. 2 Texas segment profit in 2016 includes $1.3MM in Q4 related to the NTPL, w hich w as divested in Q4 2016.
52.7 53.4
68.8
79.186.0
4Q16 1Q17 2Q17 3Q17 4Q17
15.1 13.2 14.7 17.8 16.5
86.8 88.2 90.9 89.8 89.8
1.3
103.2 101.4 105.6 107.6 106.3
4Q16 1Q17 2Q17 3Q17 4Q17
32.6 27.6 31.3 33.253.5
16.3 19.1 14.1 17.8
15.648.9 46.7 45.4 51.0
69.1
4Q16 1Q17 2Q17 3Q17 4Q17
13.711.2
7.2
10.4
14.4
4Q16 1Q17 2Q17 3Q17 4Q17
North TXPermian NTPL
NGLGas
OKLAHOMA

KEY FINANCIAL METRIC SUMMARY
EnLink Midstream 4Q 2017 Operations Report 33
In $ millions unless otherwise noted 4Q16 1Q17 2Q17 3Q17 4Q17 FY2017
EnLink Midstream Partners, LP (ENLK)
Net Income (Loss) Attributable to ENLK ($28.6) $18.1 $29.6 $25.5 $75.7 $148.9
Net Cash Provided by Operating Activities $153.4 $174.2 $158.0 $200.8 $173.5 $706.5
Adjusted EBITDA $194.7 $207.6 $209.7 $216.8 $238.7 $872.8
Debt to Adjusted EBITDA (x) ~3.70x ~3.99x ~3.99x ~3.72x ~3.58x ~3.58x
Distribution Coverage (x) 0.98x 1.01x 1.02x 0.99x 1.07x 1.02x
Distribution per Unit ($/unit) $0.390 $0.390 $0.390 $0.390 $0.390 $1.560
EnLink Midstream LLC (ENLC)
Net Income (Loss) of ENLC ($29.2) $9.3 $27.1 $24.1 $259.5 $320.0
Net Income (Loss) Attributable to ENLC ($3.9) ($1.9) $5.9 $6.2 $202.6 $212.8
Cash Available for Distribution $52.4 $51.0 $52.6 $54.8 $58.1 $216.5
Distribution Coverage (x) 1.13x 1.09x 1.13x 1.17x 1.23x 1.16x
Distribution per Unit ($/unit) $0.255 $0.255 $0.255 $0.255 $0.259 $1.024
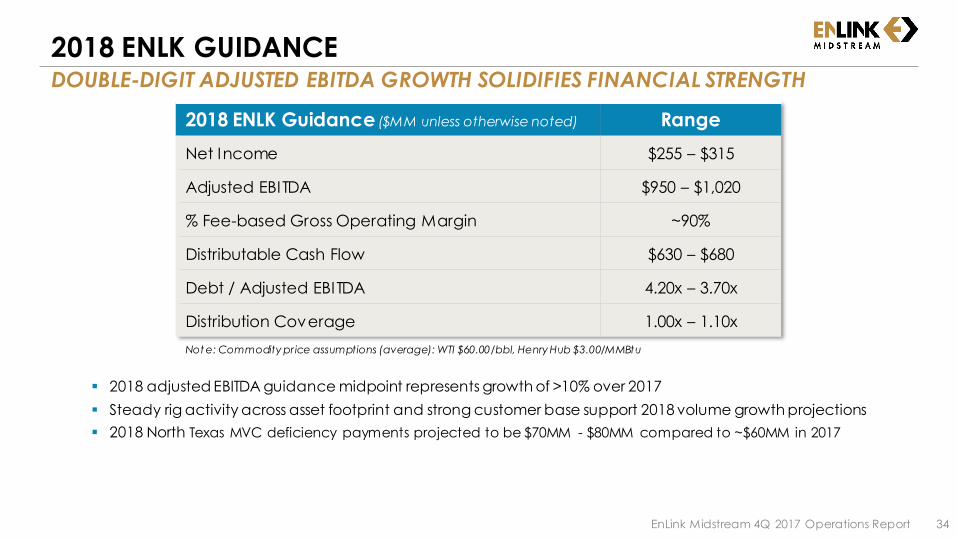
2018 ENLK GUIDANCEDOUBLE-DIGIT ADJUSTED EBITDA GROWTH SOLIDIFIES FINANCIAL STRENGTH
▪ 2018 adjusted EBITDA guidance midpoint represents growth of >10% over 2017
▪ Steady rig activity across asset footprint and strong customer base support 2018 volume growth projections
▪ 2018 North Texas MVC deficiency payments projected to be $70MM - $80MM compared to ~$60MM in 2017
EnLink Midstream 4Q 2017 Operations Report 34
2018 ENLK Guidance ($MM unless otherwise noted) Range
Net Income $255 – $315
Adjusted EBITDA $950 – $1,020
% Fee-based Gross Operating Margin ~90%
Distributable Cash Flow $630 – $680
Debt / Adjusted EBITDA 4.20x – 3.70x
Distribution Coverage 1.00x – 1.10x
Not e: Commodity pr ice assumptions (average): WTI $60.00/bbl, Henry Hub $3.00/MMBtu

2018 ENLC GUIDANCEDISTRIBUTION GROWTH RESUMES, STRONG COVERAGE CONTINUES
▪ Distribution coverage ratio assumes as-declared distribution growth of ~5% for 2018 over 2017
▪ ENLC projected to self-fund ~75% of its 2018 growth capital expenditures with excess cash; remaining ~25% funded with debt
▪ Cash available for distribution contribution in 2018 from ~16% ownership in EnLink Oklahoma T.O. assets projected to be $40MM – $50MM
2018 Financial and Operational Guidance 35
2018 ENLC Guidance ($MM unless otherwise noted) Range
Net Income $233 – $291
Cash Available for Distribution $230 – $240
Distribution Coverage 1.16x – 1.22x
Distribution Growth ~5%
Growth Capital Expenditures $45 – $55
Cash Income Taxes ~$2
Not e: Commodity pr ice assumptions (average): WTI $60.00/bbl, Henry Hub $3.00/MMBtu

54%
21%16%
6%
1%
Oklahoma
Texas
Louisana
Crude & Condensate
Corporate
2018 GROWTH CAPITAL EXPENDITURES GUIDANCECAPITAL DEPLOYED STRATEGICALLY ACROSS FOOTPRINT
2018 Financial and Operational Guidance 36
Segment Oklahoma Texas LouisianaCrude &
CondensateCorp. Total GCE MCX
$MM 340 - 420 210 - 250 105 - 125 40 - 50 5 - 15 700 - 860 55 - 60
2018 Projected Growth Capital Expenditures by Segment
2018 Growth Capital Expenditures (GCE)
Guidance ($MM)
EnLink Funded Consolidated GCE
by Segment
400
1,500
550
750
500350
450 500
Cash Utilization
Sources of Cash ($MM)
Debt Funding $ 460
Preferred C Units (Issued 2017)2 250
Asset Sales & ATM Equity 190
Total Sources of Cash $ 900
Uses of Cash ($MM)
ENLK Funded GCE (midpoint) $ 650
2018 Final Installment Payment (paid in January 2018)
250
Total Uses of Cash $ 900
Debt Maturity1 ($MM)
1 $1.5 billion in 2020 reflects the total capacity of the ENLK revolving bank facility, w hich matures in 2020.2 I ssued $400MM Preferred C Securities 3Q17 to prefund 2018 Final Installment Payment; init ial proceeds used to reduce
amounts outstanding on the ENLK revolving facility.
700 – 860
630 - 770
585 - 715
70 – 90
45 – 55
GrowthCapital
Expenditures
JV PartnersContributions
EnLink FundedConsolidated
GCE
ENLC's Shareof EnLink
Oklahoma T.O.GCE
ENLK FundedGCE
Guidance

2018 FOCUS: EXECUTING IN CORE AREASLARGE SUITE OF CAPITAL-EFFICIENT PROJECTS UNDER DEVELOPMENT
NGL BOLT-ON PROJECTS – enhancing value chain opportunities
o $35MM – $50MM expected 2018 capital spend
LA GAS – increasing commercial gas opportunities
o $10MM – $20MM expected 2018 capital spend
LOUISIANA
LOBO III – 200 MMcf/d gas processing facility
o $45MM – $55MM expected 2018 ENLK capital spend
o 2H18 expected operational
DELAWARE GAS – increasing G&P system volumes
o $25MM – $35MM expected 2018 ENLK capital spend, well connects & field compression
MIDLAND GAS – increasing G&P system volumes
o $45MM - $55MM expected 2018 well connects & field compression
PERMIAN BASIN1
✓ CHISHOLM III – 200 MMcf/d gas processing facility
o 4Q17 operational, fully in-line with expectations
THUNDERBIRD – 200 MMcf/d gas processing facility
o $100MM – $120MM EnLink expected 2018 capital spend
o 1Q19 expected operational
CENTRAL OKLAHOMA – increasing G&P system volumes
o $160MM – $200MM expected 2018 well connects & field compression
BLACK COYOTE – crude gathering
o $10MM – $15MM EnLink expected 2018 capital spend
o 1Q18 expected complete
OKLAHOMA
2018 Financial and Operational Guidance1 Delaw are assets are 49.9% ow ned by NGP. 37

ENLC ow ns 100%
of IDRs
ENLINK ORGANIZATIONAL CHART1
EnLink Midstream 4Q 2017 Operations Report 38
1 Information on this slide is as of December 31, 2017. 2 Represents TPG Capital and funds managed by the Merchant Banking Div ision of Goldman Sachs. 3 Series C Preferred Units are perpetual preferred units that are not convertible into ENLK common
units, and therefore, are not factored into the percent ow nership calculations for the limited partner and general partner ow nership percentages presented on this slide. 4 The limited partner and general partner ownership percentages presented on
this slide factor in the general partner interest, ENLK common units and Series B Preferred Units, w hich are convertible intoENLK common units on a one-for-one basis. 5 Represents current Incentive Distribution Rights (IDR) split level plus GP ow nership.
IDR Splits
Dist. / Q Split Level5
< $0.2500 0.4% / 99.6%
< $0.3125 13.4% / 86.6%
< $0.3750 23.4% / 76.6%
> $0.3750 48.4% / 51.6%
Devon Energy
Corp.NYSE: DVN
(BBB+/BBB/Ba1)
Public
Unitholders
EnLink Midstream, LLCGeneral Partner
NYSE: ENLC
~ 64% ~ 36%
~ 84%
~ 0.4% GP
~ 22% LP
~ 23% LP~ 41% LP
~ 14% LP
~ 16%
EnLink OklahomaGas Processing, LP
TPG Capital &Goldman Sachs2
Series B Preferred Equity Owners
EnLink Midstream Partners, LP4
Master Limited PartnershipNYSE: ENLK
(BBB-/BBB-/Ba1)
Public UnitholdersSeries C Preferred Equity Owners3
~ 100%
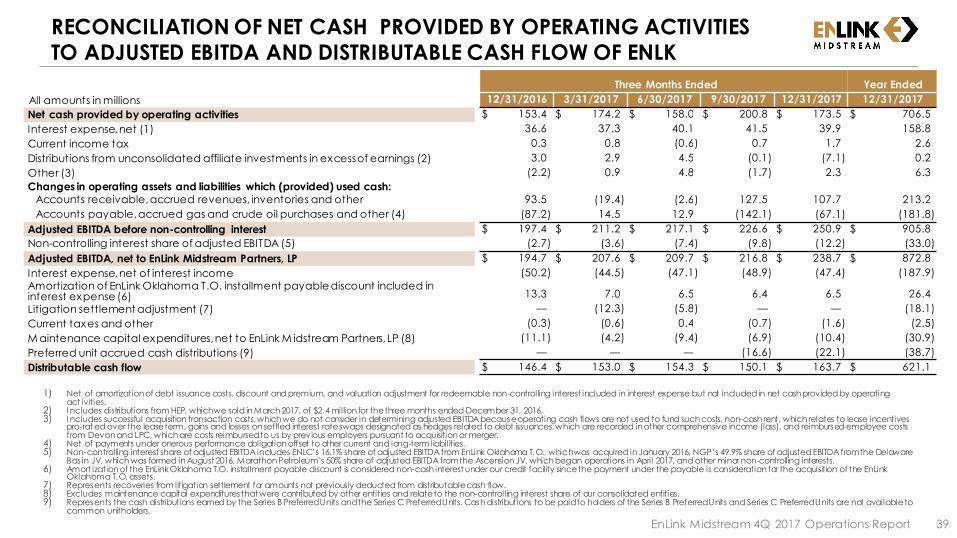
1) Net of amortization of debt issuance costs, discount and premium, and valuation adjustment for redeemable non-controlling interest included in interest expense but not included in net cash provided by operating act ivities.
2) I ncludes distributions from HEP, which we sold in March 2017, of $2.4 million for the three months ended December 31, 2016. 3) I ncludes successful acquisition transaction costs, which we do not consider in determining adjusted EBITDA because operating cash flows are not used to fund such costs, non-cash rent, which relates to lease incentives
pro-rat ed over the lease term, gains and losses on settled interest rate swaps designated as hedges related to debt issuances, which are recorded in other comprehensive income (loss), and reimbursed employee costs from Devon and LPC, which are costs reimbursed to us by previous employers pursuant to acquisition or merger.
4) Net of payments under onerous performance obligation offset to other current and long-term liabilities. 5) Non-controlling interest share of adjusted EBITDA includes ENLC’s 16.1% share of adjusted EBITDA from EnLink Oklahoma T.O., which was acquired in January 2016, NGP’s 49.9% share of adjusted EBITDA from the Delaware
Bas in JV, which was formed in August 2016, Marathon Petroleum’s 50% share of adjusted EBITDA from the Ascension JV, which began operations in April 2017, and other minor non-controlling interests. 6) Amort izat ion of the EnLink Oklahoma T.O. installment payable discount is considered non-cash interest under our credit facility since the payment under the payable is consideration for the acquisition of the EnLink
Oklahoma T.O. assets. 7) Represents recoveries from litigation settlement for amounts not previously deducted from distributable cash flow. 8) Excludes maintenance capital expenditures that were contributed by other entities and relate to the non-controlling interest share of our consolidated entities. 9) Represents the cash distributions earned by the Series B Preferred Units and the Series C Preferred Units. Cash distributions to be paid to holders of the Series B Preferred Units and Series C Preferred Units are not available to
common unitholders.
RECONCILIATION OF NET CASH PROVIDED BY OPERATING ACTIVITIES
TO ADJUSTED EBITDA AND DISTRIBUTABLE CASH FLOW OF ENLK
All amounts in millions
EnLink Midstream 4Q 2017 Operations Report 39
Three Months Ended Year Ended
12/31/2016 3/31/2017 6/30/2017 9/30/2017 12/31/2017 12/31/2017
Net cash provided by operating activities $ 153.4 $ 174.2 $ 158.0 $ 200.8 $ 173.5 $ 706.5
Interest expense, net (1) 36.6 37.3 40.1 41.5 39.9 158.8
Current income tax 0.3 0.8 (0.6) 0.7 1.7 2.6
Distributions from unconsolidated affiliate investments in excess of earnings (2) 3.0 2.9 4.5 (0.1) (7.1) 0.2
Other (3) (2.2) 0.9 4.8 (1.7) 2.3 6.3
Changes in operating assets and liabilities which (provided) used cash:
Accounts receivable, accrued revenues, inventories and other 93.5 (19.4) (2.6) 127.5 107.7 213.2
Accounts payable, accrued gas and crude oil purchases and other (4) (87.2) 14.5 12.9 (142.1) (67.1) (181.8)
Adjusted EBITDA before non-controlling interest $ 197.4 $ 211.2 $ 217.1 $ 226.6 $ 250.9 $ 905.8
Non-controlling interest share of adjusted EBITDA (5) (2.7) (3.6) (7.4) (9.8) (12.2) (33.0)
Adjusted EBITDA, net to EnLink Midstream Partners, LP $ 194.7 $ 207.6 $ 209.7 $ 216.8 $ 238.7 $ 872.8
Interest expense, net of interest income (50.2) (44.5) (47.1) (48.9) (47.4) (187.9)
Amortization of EnLink Oklahoma T.O. installment payable discount included in interest expense (6) 13.3 7.0 6.5 6.4 6.5 26.4
Litigation settlement adjustment (7) — (12.3) (5.8) — — (18.1)
Current taxes and other (0.3) (0.6) 0.4 (0.7) (1.6) (2.5)
M aintenance capital expenditures, net to EnLink M idstream Partners, LP (8) (11.1) (4.2) (9.4) (6.9) (10.4) (30.9)
Preferred unit accrued cash distributions (9) — — — (16.6) (22.1) (38.7)
Distributable cash flow $ 146.4 $ 153.0 $ 154.3 $ 150.1 $ 163.7 $ 621.1

1) Represents distributions paid by ENLK to ENLC on February 13, 2018, November13, 2017, August 11, 2017, May 12, 2017, and February 13, 2017.2) Includes depreciation and amort ization and unit -based compensation expense allocated to EnLink Oklahoma T.O.3) Represents ENLC’s stand-alone deferred taxes. 4) Represents NGP Natural Resources XI , L.P.’s (“NGP”) 49.9% share of adjusted EBITDA from the Delaware Basin JV, which w as formed in August 2016, Marathon Petroleum’s 50% share of
adjusted EBITDA from the Ascension JV, w hich began operations in April 2017, and other minor non-controlling interests. 5) Represents ENLC’s interest in EnLink Oklahoma T.O. 's maintenance capital expenditures (which is netted against the monthly disbursement of EnLink Oklahoma T.O. 's adjusted EBITDA), and
other non-cash items not included in cash available for distribution.
RECONCILIATION OF NET INCOME (LOSS) OF ENLC TO ENLC CASH AVAILABLE FOR DISTRIBUTION
EnLink Midstream 4Q 2017 Operations Report 40
Three Months Ended Year Ended
All amounts in millions 12/31/2016 3/31/2017 6/30/2017 9/30/2017 12/31/2017 12/31/2017
Net income (loss) of ENLC $ (29.2) $ 9.3 $ 27.1 $ 24.1 $ 259.5 $ 320.0
Less: Net income (loss) attributable to ENLK (28.6) 18.1 29.6 25.5 75.7 148.9
Net income (loss) of ENLC excluding ENLK $ (0.6) $ (8.8) $ (2.5) $ (1.4) $ 183.8 $ 171.1
ENLC's share of distributions from ENLK (1) 49.5 49.8 49.9 49.9 49.9 199.5
ENLC's interest in EnLink Oklahoma T.O. non-cash expenses (2) 3.9 4.0 4.2 4.6 4.6 17.4
ENLC deferred income tax (benefit) expense (3) (1.9) 2.5 3.3 2.5 (178.9) (170.6)
Non-controlling interest share of ENLK's net (income) loss (4) 1.5 3.4 (2.2) (0.9) (1.4) (1.1)
Other items (5) — 0.1 (0.1) 0.1 0.1 0.2
ENLC cash available for distribution $ 52.4 $ 51.0 $ 52.6 $ 54.8 $ 58.1 $ 216.5

1) The loss for the three months ended December 31, 2016 includes an impairment loss of $20.1 million related to our December 2016 agreement to sell our investment in HEP. In March 2017, w e finalized our sale of HEP for proceeds of $189.7 million and recorded a loss on disposition of $3.4 million for the three months ended March 31, 2017.
2) Includes accretion expense associated w ith asset retirement obligations; reimbursed employee costs from Devon and LPC; succes sful acquisition t ransaction costs, w hich w e do not consider in determining adjusted EBITDA because operating cash flow s are not used to fund such costs; and non-cash rent, w hich relates to lease incentives pro-rated over the lease term.
3) Non-controlling interest share of adjusted EBITDA includes ENLC’s 16.1% share of adjusted EBITDA from EnLink Oklahoma T.O., w hich w as acquired in January 2016, NGP’s 49.9% share of adjusted EBITDA from the Delaware Basin JV, w hich w as formed in August 2016, Marathon Petroleum’s 50% share of adjusted EBITD A from the Ascension JV, w hich began operations in April 2017, and other minor non-controlling interests.
RECONCILIATION OF NET INCOME (LOSS) TO ADJUSTED EBITDA OF ENLK
EnLink Midstream 4Q 2017 Operations Report 41
Three Months Ended Year Ended
All amounts in millions 12/31/2016 3/31/2017 6/30/2017 9/30/2017 12/31/2017 12/31/2017
Net income (loss) $ (31.1) $ 13.3 $ 32.7 $ 28.7 $ 80.1 $ 154.8
Interest expense, net of interest income 50.2 44.5 47.1 48.9 47.4 187.9
Depreciation and amortization 130.9 128.3 142.5 136.3 138.2 545.3
Impairments — 7.0 — 1.8 8.3 17.1
(Income) loss from unconsolidated affiliates (1) 19.4 (0.7) 0.1 (4.4) (4.6) (9.6)
Distribution from unconsolidated affiliates 5.5 2.9 4.5 4.0 2.1 13.5
(Gain) loss on disposition of assets 16.1 5.1 (5.4) 1.1 (0.8) —
Gain on extinguishment of debt — — (9.0) — — (9.0)
Unit-based compensation 7.5 19.3 9.3 10.1 9.1 47.8
Income tax prov ision (benefit) — 0.5 (0.3) 0.5 (24.7) (24.0)
(Gain) loss on non-cash deriv ativ es 4.2 (5.3) (1.8) 3.3 (0.9) (4.7)
Payments under onerous performance obligation offset to other current and long-term liabilities (4.4) (4.5) (4.5) (4.5) (4.4) (17.9)
Other (2) (0.9) 0.8 1.9 0.8 1.1 4.6
Adjusted EBITDA before non-controlling interest $ 197.4 $ 211.2 $ 217.1 $ 226.6 $ 250.9 $ 905.8
Non-controlling interest share of adjusted EBITDA (3) (2.7) (3.6) (7.4) (9.8) (12.2) (33.0)
Adjusted EBITDA, net to EnLink Midstream Partners, LP $ 194.7 $ 207.6 $ 209.7 $ 216.8 $ 238.7 $ 872.8

Year ended 12/31/2017 Texas Louisiana Oklahoma Crude and Condensate Corporate Totals
Operating income (loss) $ 299.5
General and administ rat ive expenses 123.5
Depreciat ion and amort ization 545.3
(Gain) loss on disposition of assets —
Impairments 17.1
Gain on lit igat ion settlement (26.0)
Segment profit (loss) $ 420.9 $ 212.2 $ 287.3 $ 43.2 $ (4.2) $ 959.4
Operat ing expenses 172.7 101.3 64.6 80.1 — 418.7
Gross operating margin $ 593.6 $ 313.5 $ 351.9 $ 123.3 $ (4.2) $ 1,378.1
Q4 2017 Texas Louisiana Oklahoma Crude and Condensate Corporate Totals
Operating income (loss) $ 98.1
General and administ rat ive expenses 28.9
Depreciat ion and amort ization 138.2
(Gain) loss on disposition of assets (0.8)
Impairments 8.3
Segment profit (loss) $ 106.3 $ 69.1 $ 86.0 $ 14.4 $ (3.1) $ 272.7
Operat ing expenses 44.8 26.5 18.7 19.9 — 109.9
Gross operating margin $ 151.1 $ 95.6 $ 104.7 $ 34.3 $ (3.1) $ 382.6
Q3 2017 Texas Louisiana Oklahoma Crude and Condensate Corporate Totals
Operating income (loss) $ 73.4
General and administ rat ive expenses 30.0
Depreciat ion and amort ization 136.3
(Gain) loss on disposition of assets 1.1
Impairments 1.8
Segment profit (loss) $ 107.6 $ 51.0 $ 79.1 $ 10.4 $ (5.5) $ 242.6
Operat ing expenses 41.1 24.8 17.1 19.1 — 102.1
Gross operating margin $ 148.7 $ 75.8 $ 96.2 $ 29.5 $ (5.5) $ 344.7
RECONCILIATION OF ENLK’S OPERATING INCOME (LOSS) TO GROSS
OPERATING MARGIN OF ENLK
EnLink Midstream 4Q 2017 Operations Report 42
All amounts in millions

1) Total operat ing expenses for the three months ended March 31, 2017 included $2.0 million of unit -based compensat ion expense paid as bonus, w hich w as granted and immediately vested in March 2017.
RECONCILIATION OF ENLK’S OPERATING INCOME (LOSS) TO GROSS
OPERATING MARGIN OF ENLK (CONT.)
EnLink Midstream 4Q 2017 Operations Report 43
Q2 2017 Texas Louisiana Oklahoma Crude and Condensate Corporate Totals
Operating income (loss) $ 70.4
General and administ rat ive expenses 29.6
Depreciat ion and amort ization 142.5
(Gain) loss on disposition of assets (5.4)
Impairments —
Gain on lit igat ion settlement (8.5)
Segment profit (loss) $ 105.6 $ 45.4 $ 68.8 $ 7.2 $ 1.6 $ 228.6
Operat ing expenses 42.9 24.6 14.7 20.4 — 102.6
Gross operating margin $ 148.5 $ 70.0 $ 83.5 $ 27.6 $ 1.6 $ 331.2
Q1 2017 Texas Louisiana Oklahoma Crude and Condensate Corporate Totals
Operating income (loss) $ 57.6
General and administ rat ive expenses 35.0
Depreciat ion and amort ization 128.3
(Gain) loss on disposition of assets 5.1
Impairments 7.0
Gain on lit igat ion settlement (17.5)
Segment profit (loss) $ 101.4 $ 46.7 $ 53.4 $ 11.2 $ 2.8 $ 215.5
Operat ing expenses (1) 43.9 25.4 14.1 20.7 — 104.1
Gross operating margin $ 145.3 $ 72.1 $ 67.5 $ 31.9 $ 2.8 $ 319.6
Q4 2016 Texas Louisiana Oklahoma Crude and Condensate Corporate Totals
Operating income (loss) $ 38.3
General and administ rat ive expenses 28.7
Depreciat ion and amort ization 130.9
(Gain) loss on disposition of assets 16.1
Segment profit (loss) $ 103.2 $ 48.9 $ 52.7 $ 13.7 $ (4.5) $ 214.0
Operat ing expenses 43.3 24.4 14.9 19.6 — 102.2
Gross operating margin $ 146.5 $ 73.3 $ 67.6 $ 33.3 $ (4.5) $ 316.2
All amounts in millions
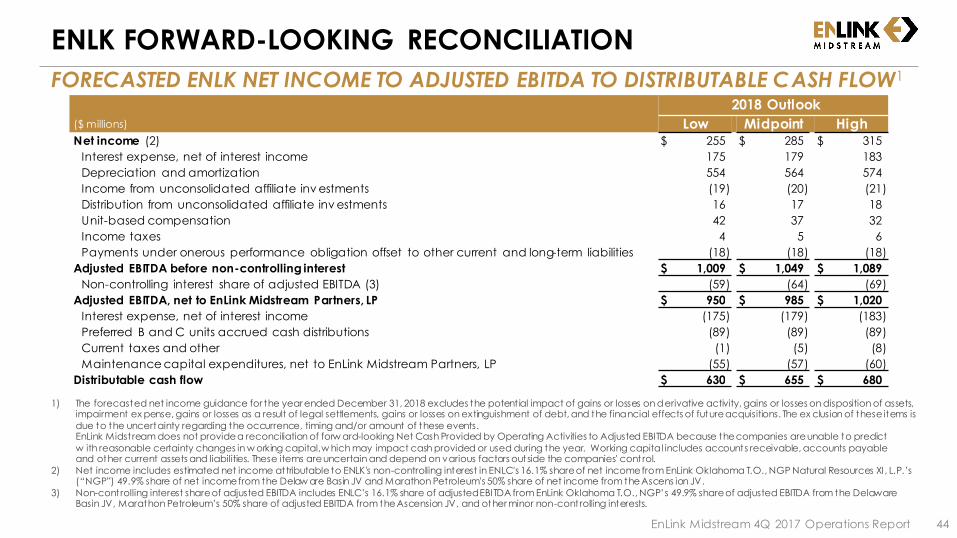
ENLK FORWARD-LOOKING RECONCILIATION
FORECASTED ENLK NET INCOME TO ADJUSTED EBITDA TO DISTRIBUTABLE CASH FLOW1
EnLink Midstream 4Q 2017 Operations Report 44
2018 Outlook
($ millions) Low Midpoint HighNet income (2) $ 255 $ 285 $ 315
Interest expense, net of interest income 175 179 183
Depreciation and amortization 554 564 574
Income from unconsolidated affiliate inv estments (19) (20) (21)
Distribution from unconsolidated affiliate inv estments 16 17 18
Unit-based compensation 42 37 32
Income taxes 4 5 6
Payments under onerous performance obligation offset to other current and long-term liabilities (18) (18) (18)
Adjusted EBITDA before non-controlling interest $ 1,009 $ 1,049 $ 1,089
Non-controlling interest share of adjusted EBITDA (3) (59) (64) (69)
Adjusted EBITDA, net to EnLink Midstream Partners, LP $ 950 $ 985 $ 1,020
Interest expense, net of interest income (175) (179) (183)
Preferred B and C units accrued cash distributions (89) (89) (89)
Current taxes and other (1) (5) (8)
Maintenance capital expenditures, net to EnLink Midstream Partners, LP (55) (57) (60)
Distributable cash flow $ 630 $ 655 $ 680
1) The forecasted net income guidance for the year ended December 31, 2018 excludes the potent ial impact of gains or losses on derivative activity, gains or losses on disposition of assets, impairment ex pense, gains or losses as a result of legal settlements, gains or losses on extinguishment of debt, and the financial effects of future acquisitions. The ex clusion of these items is
due to the uncertainty regarding the occurrence, timing and/or amount of these events.EnLink Midstream does not provide a reconciliation of forw ard-looking Net Cash Provided by Operating Activities to Adjusted EBITDA because the companies are unable to predict
w ith reasonable certainty changes in w orking capital, w hich may impact cash provided or used during the year. Working capital includes accounts receivable, accounts payable and other current assets and liabilities. These items are uncertain and depend on various factors outside the companies' cont rol.
2) Net income includes estimated net income attributable to ENLK's non-controlling interest in ENLC's 16.1% share of net income from EnLink Oklahoma T.O., NGP Natural Resources XI , L.P.’s (“NGP”) 49.9% share of net income from the Delaw are Basin JV and Marathon Petroleum's 50% share of net income from the Ascens ion JV.
3) Non-controlling interest share of adjusted EBITDA includes ENLC’s 16.1% share of adjusted EBITDA from EnLink Oklahoma T.O., NGP’s 49.9% share of adjusted EBITDA from the Delaware Basin JV, Marathon Petroleum’s 50% share of adjusted EBITDA from the Ascension JV, and other minor non-controlling interests.

ENLK FORWARD-LOOKING RECONCILIATION
RECONCILIATION OF ENLK'S OPERATING INCOME TO SEGMENT PROFIT OF ENLK
EnLink Midstream 4Q 2017 Operations Report 45
Low-End Outlook
Year ended 12/31/2018 Texas Louisiana OklahomaCrude and
Condensate Corporate Totals
Operating income $ 415.0
General and administrativ e expenses 106.0
Depreciation and amortization 554.0
Segment profit $ 425.0 $ 200.0 $ 405.0 $ 45.0 $ — $ 1,075.0
High-End Outlook
Year ended 12/31/2018 Texas Louisiana OklahomaCrude and
Condensate Corporate Totals
Operating income $ 483.0
General and administrativ e expenses 128.0
Depreciation and amortization 574.0
Segment profit $ 465.0 $ 220.0 $ 445.0 $ 55.0 $ — $ 1,185.0
All amounts in millions

ENLC FORWARD-LOOKING RECONCILIATION
EnLink Midstream 4Q 2017 Operations Report 46
1) The forecasted net income guidance for the year ended December 31, 2018 excludes the potential impact of gains or losses on d erivative activity, gains or losses on disposition of assets, impairment expense, gains or losses as a result of legal settlements, gains or losses on extinguishment of debt, and the financial effects of future acquisitions. The exclusion of these items is due to the uncertainty regarding the occurrence, timing and/or amount of these events.
2) Net income of ENLC includes estimated net income attributable to ENLC's non-controlling interest in ENLK. 3) Net income attributable to ENLK is net of the estimated non-controlling interest share attributable to the Delaware Basin JV, Ascension JV and EnLink Oklahoma
T.O. 4) Represents quarterly distributions estimated to be paid to ENLC by ENLK for 2018. 5) Represents estimated net income for NGP’s 49.9% share of the Delaw are Basin JV, M arathon Petroleum’s 50% share of the Ascension JV and other minor non-
controlling interests. 6) Represents ENLC's estimated stand-alone deferred taxes for 2018. 7) Represents 2018 maintenance capital expenditures attributable to ENLC’s share of EnLink Oklahoma T.O.
2018 Outlook
($MM) Low Midpoint High
Net income of ENLC (2) $ 233 $ 262 $ 291
Less: Net income attributable to ENLK (3) (225) (250) (275)
Net income of ENLC excluding ENLK $ 8 $ 12 $ 16
ENLC's share of distributions from ENLK (4) 201 201 201
ENLC's interest in EnLink Oklahoma T.O. depreciation 19 19 19
Non-controlling interest share of ENLK's net income (5) (11) (11) (11)
ENLC deferred income tax expense (6) 14 15 16
Maintenance capital expenditures (7) (1) (1) (1)
ENLC cash available for distribution $ 230 $ 235 $ 240
FORECASTED ENLC NET INCOME TO CASH AVAILABLE FOR DISTRIBUTION1

FOCUS ON PEOPLE | STRIVE FOR EXCELLENCE | BE ETHICAL | DELIVER RESULTS | BE GOOD STEWARDS
ENLINK.COM