
Q3 2014/15 Report Quarterly
20
Delivering a better railway for a better Britain Q3 Quarterly Report 2014/15
Transcript of Q3 2014/15 Report Quarterly

Delivering a better railway for a better Britain
Q3 Quarterly Report 2014/15

Left: We are transforming London Bridge station, creating new platforms for more trains, building a new concourse, and creating a much bigger and better station.

Welcome to our latest quarterly report for 2014/15. This is the second report for Control Period 5 (2014-19), and is intended to provide clear information on how we are doing against our key targets.
Network Rail Quarterly Report Q3 2014/15
Contents 2 Introduction
3 Summary
4 Chief executive’s report – dashboard
6 How we are doing – key measures
17 Glossary
1

Introduction
Welcome to Network Rail’s latest quarterly report, which covers quarter 3 of the 2014/15 financial year.
The quarter was, to some extent, dominated by events over Christmas. Overruns at Paddington and King’s Cross caused significant inconvenience to passengers on
27 December, and I repeat the apology I gave at the time.
However, just as importantly, we sought to understand why these events took place, and what we have to do to reduce the chances of any repetition. So we committed to
producing a report into what happened and publishing that report little more than a fortnight after the events themselves.
Publication was on 12 January, and set out in detail what happened and why. My decision to provide this report so quickly reflects my commitment that we should
be as transparent as possible about our performance.
These quarterly reports are produced with the same principle in mind. Of the thousands of metrics we are measured on, these are the ones that matter the most, whether they
relate to safety, train punctuality, delivery of our major projects or the satisfaction of passengers and our customers.
So we want people to see how we are doing, and to report performance in as open a fashion as we can. This may prompt some difficult questions, but they are questions we
understand we must be willing to answer.
Mark Carne Chief executive, Network Rail
Mark CarneChief executive, Network Rail
2 Network Rail Quarterly Report Q3 2014/15

This report covers quarter 3 of the 2014/15 financial year. Note that, due to the railway year being divided into 13 four-week periods, this quarter covers period 7 to period 10 inclusive, and is therefore four weeks longer than the other quarters.
The following are the key points to note from the report about our performance.
Safety• We have been making good progress on
workforce safety performance, with a reduction in the number of injuries that resulted in lost working time among our staff and contractors compared to the same point in 2013/14.
• It is still possible that we will meet our target to reduce the key LTIFR (Lost time injury frequency rate) measure by 15 per cent over the year.
• The number of close calls has been significantly above our target for the year – however, we are missing our target of closing out these close calls within 28 days.
• We set ourselves a target to reduce the passenger component of train accident risk where Network Rail is the risk controller by 10 per cent over the year, and it is still possible we will meet this target.
• On level crossing safety, risk is reducing in line with the regulatory target, though we set ourselves a stretch internal target that we do not expect to meet this year.
Reliability • We remain one per cent behind our
overall network-wide target for train punctuality, and we are not forecasting that this will change significantly in the remainder of the year.
• We expect that between 10 and 15 individual train operators are likely to miss their individual PPM or CaSL (cancellations and significant lateness) regulatory floors (2 per cent below target for PPM and 0.2 per cent below target for CaSL), or both, by the end of the year.
• Freight performance is currently 94.1 per cent against a regulatory target of 92.5 per cent, and we are forecasting 94.3 per cent by year end.
• We are now forecasting that the Composite Reliability Index (CRI), which measures the overall reliability of our assets, will be 5.2 per cent by the end of the year, against a target of 5.7 per cent, which is closer to our target than we had previously been forecasting.
Capacity• We are currently forecasting we will
deliver eight of our 10 key project milestones by the end of the year; but that we will only deliver 57 of the 87 regulatory project milestones for the year as a whole.
• Current forecasts are that we will not meet our targets for any of our seven key asset renewal volumes by the end of the year.
Cost• Our current forecast for our financial
performance is that we will end the year £116m adverse to our budget.
• This is largely driven by worse than expected train performance leading to higher Schedule 8 costs; predicted savings that have not been realised; and investment in a number of new initiatives including the tidy railway and accelerated vegetation clearance.
The remainder of this report provides more detail on our performance and forecasts for the remainder of 2014/15, beginning with the latest version of our corporate dashboard.
Summary
“We have been making good progress on workforce safety performance.”
“Freight performance is currently 94.1 per cent against a regulatory target of 92.5 per cent, and we are forecasting 94.3 per cent by year end.”
“We are currently forecasting we will deliver eight of our 10 key project milestones by the end of the year.”
3Network Rail Quarterly Report Q3 2014/15

Target
Area Performance measure Full year forecast
Safety Current period MAA Worse than target Target Better than target
Workforce safety Lost time injury frequency rate (LTIFR)
0.558 0.515 0.511 0.486 0.458
Workforce safety Workforce Close Calls
2,437 35,000 40,000 45,000 60,000
YTD Close Calls closed within 28 days (%) – 1 Period in arrears
45% 45% 50%
Passenger safety Train accident risk – 1 Period in arrears
2.216 2.206 2.181 2.158 2.110
Level crossing risk reduction
Level crossing risk indicator model
TBC 11.99 11.36 11.11 10.73
Train performance Prior period MAA Worse than target Target Better than target
PPM National
87.7% 89.8% 90.0% 91.1% 91.6%
Freight Freight delivery metric (FDM)
94.1% 92.0% 92.5% 94.7% 9.0%
Chief executive’s report – dashboard quarter 3 BetterAverageWorseTo Date
4 Network Rail Quarterly Report Q3 2014/15

Area Performance measure Full year forecast
Financial performance Current period MAA Worse than target Target Better than target
Financial performance measure Total efficiency generated (£m)
-45 -£157m -116 0 +£157m
Investment Current year to date Worse than target Target Better than target
Top 10 Infrastructure Projects renewals and enhancement milestones
Key milestones of top 10 renewals and enhancement projects
6 6 8 10
All Delivery Plan Enhancement milestones (%)
Interim and completion milestones of all enhancement projects
63% 60% 67% 80% 100%
Asset management Current period MAA Worse than target Target Better than target
CRI (Composite reliability index) Total
4.21% 0.87% 5.20% 5.71% 10.26%
Renewals (seven key volumes) Volumes (period and YTD actual not MMA)
X ✓ ✓ ✓ ✓ ✓ ✓ ✓ ✓
✓ ✓ ✓ ✓ ✓ ✓ ✓
Satisfaction Current period MAA Worse than target Target Better than target
Customer Survey results
N/A 3.15 3.32 3.49
Passenger Survey results
N/A 81.0% 81% 83.3% 86.0%
Chief executive’s report – dashboard quarter 3 (continued)Target BetterAverageWorseTo Date
5Network Rail Quarterly Report Q3 2014/15

0
10
20
30
40
50
60
0.000
0.100
0.200
0.300
0.400
0.500
0.600
Num
ber o
f Inj
urie
s
LTIFR
-3 year -2 year -1 year P1 P2 P3 P4 P5 P6 P7 P8 P9 P10 P11 P12 P13 +1 year +2 year +3 year +4 year
How we are doing – Key measures
Workforce Safety
How are we doing?At this point in 2013/14, there had been 520 injuries that resulted in lost working time amongst our staff and contractors. The comparable number for 2014/15 to date is 457. There has also been a steady period on period improvement since Period 4.
Over the year, we set ourselves a target to reduce the LTIFR by 15 per cent and, as it stands, it is still possible we will meet this. We need to have no more than 154 injuries in the last quarter of the year to meet our target for reducing such incidents. This would compare to a total of 199 over the same period in 2013/14.
What are our plans?We have made good progress on the majority of the initiatives we have underway to improve workforce safety, including the Planning and Delivering Safe Work programme, where we have now begun the process of training thousands of people in the new methods of working.
Fatalities RIDDOR specified injuries 7+ Day RIDDOR minor injuries Non-RIDDOR reportable lost time injuries Actual LTIFR (RH axis)
LTIFR target (RH axis)
6 Network Rail Quarterly Report Q3 2014/15

0
1,000
2,000
3,000
4,000
5,000
7,000
0,000
7,500
15,000
22,500
30,000
37,500
52,500
Num
ber o
f Clo
se C
alls
Cumulative Close Calls Raised
-3 year -2 year -1 year P1 P2 P3 P4 P5 P6 P7 P8 P9 P10 P11 P12 P13 +1 year +2 year +3 year +4 year
47%39%
43%45%
45% 47%49%
48%
44%42%
46%
45,0006,000
How are we doing?Our target over the quarter was for 12,308 close calls to be reported. The actual total over that time was 18,301, and the target was beaten in each of the four week periods in the quarter.
The year to date total of 47,469 already significantly exceeds the full year target of 40,000, and we are now forecasting that over 60,000 will have been reported by the end of the year. Each one of these has the potential of helping us to identify ways to reduce the risk of incidents.
However, our rate of closing out these close calls is still not where we want it to be. Our target is that 50 per cent of all those reported should be closed out within 28 days. At the
end of the quarter, this stood at 44 per cent, though it should be noted that this closed out total only includes Network Rail staff and not those of our contractors.
What are our plans?For us to achieve our end of year target for closing our close calls that have been raised, over 60 per cent of those raised in the last quarter would need to be closed out, and we will not achieve this.
Renewed efforts are being made, on the back of the ‘Your Call’ communications campaign launched in November.
Close Calls
Key measures (continued)
Close Calls raised (Infrastructure Projects) Close Calls (non-Infrastructure Projects) Close Calls closed within 28 days (currently does not include IP) Cumulative Close Calls raised actual (IP & Non-IP) Cumulative Close Calls raised target (IP & Non-IP) Cumulative Close Calls closed within 28 days actual (currently does not include IP)
7Network Rail Quarterly Report Q3 2014/15

0.00
0.50
1.00
1.50
2.00
2.50
3.00
Num
ber o
f Inj
urie
s
-3 year -2 year -1 year P1 P2 P3 P4 P5 P6 P7 P8 P9 P10 P11 P12 P13 +1 year +2 year +3 year +4 year
How are we doing?Over the five years to March 2019, we have set ourselves a target to reduce the passenger component of train accident risk, where this risk is within our control, by 50 per cent. For 2014/15, this involves a reduction of 10 per cent in the industry’s Precursor Indicator Model, which measures that risk.
In the year to date, we have seen the PIM closely matching our target reduction. However, our detailed forecasts, which are based on both the current position and an analysis of the predicted impact of the actions we will take before the end of the year, indicate that it is possible that the full 10 per cent target may be met.
What are our plans?A series of workshops on passenger safety were held in September and October 2014. At these workshops, 83 initiatives or activities were identified that will contribute to a reduction in the underlying risk over the five years to March 2019.
Each of these 83 initiatives or activities has an individual who is accountable for taking them forward. All of these individuals have identified their programme milestones, and all of these milestones have then been captured in our corporate Safety Integrated Plan.
Major milestones include the implementation of eddy current testing across the network; and use of track recording vehicles.
Train Accident Risk – passenger
Key measures (continued)
Actual Target
8 Network Rail Quarterly Report Q3 2014/15

0
3
6
9
12
0
4
8
12
16
Num
ber o
f Fat
aliti
es
Fatalities and Weighted Injuries per Year
-3 year -2 year -1 year P1 P2 P3 P4 P5 P6 P7 P8 P9 P10 P11 P12 P13 +1 year +2 year +3 year +4 year
How are we doing?So far in 2014/15, we have closed 107 level crossings, and a further nine have been downgraded in legal status. Closing crossings is, by definition, the best way to reduce risk, though closure can sometimes be difficult to achieve. These closures, along with other risk reduction measures, have reduced risk by 0.31 in terms of Fatalities and Weighted Injuries per year.
We are aiming to maximise risk reduction from the £99m dedicated fund. To date, although risk is reducing, we are slightly behind target, though it is still possible we will meet our end of year target.
There were three pedestrian fatalities at level crossings over the quarter.
What are our plans?A key forthcoming initiative is the full integration of the various level crossing and safety management IT systems. This will enable fully automated reporting and the harmonisation of data.
Other initiatives due early in 2015 include new red light safety cameras becoming operational at 28 level crossings; and replacement of filament bulbs with brighter LEDs in road traffic lights at 494 crossings.
We are currently forecasting, over the five years of the control period as a whole, to reduce level crossing risk by 32 per cent.
Level Crossing Risk Indicator Model
Key measures (continued)
LX fatalities (vehicle users) – LH axis LX fatalities (pedestrians) – LH axis Actual LCRIM – RH axis Target LCRIM – RH axis
9Network Rail Quarterly Report Q3 2014/15

80.0%
84.0%
88.0%
92.0%
96.0%
100.0%
PPM
by
perio
d –
natio
nal
-3 year -2 year -1 year P1 P2 P3 P4 P5 P6 P7 P8 P9 P10 P11 P12 P13 +1 year +2 year +3 year +4 year
How are we doing?Despite a relatively strong performance in the second half of the quarter, as we were closer to our targets, we remain behind our overall target, and we do not expect this to change significantly. In England and Wales, we are forecasting we will be 1.4 per cent behind our target for the year end. In Scotland, the equivalent is 0.7 per cent.
At individual train operator level, too many are likely to fall below the regulatory floor of more than 2 per cent and 0.2 per cent below the target for both punctuality and cancellations or significant lateness respectively. This is a national issue, but particularly acute in London and the South East. We are continuing to develop a series of plans in partnership with train operators to improve punctuality.
What are our plans?The latest on the five key areas we are focussing on to improve performance is as follows:
1. The number of Temporary Speed Restrictions has reduced to 257, and we expect to meet our target of below 200 by the end of 2014/15.
2. We are currently meeting reliability targets in the majority of asset categories. The exceptions are track and telecoms. The latter is being addressed through a series of measures designed to improve GSM-R reliability. However, these are complex and will not provide a quick solution.
3. A lot of work was put in preparing for autumn, by removing trees and other vegetation by the tracks. The results were positive, with a stronger performance in the latter half of the quarter in particular.
4. Our Performance Planning Reform Programme will improve timetables that do not reflect reality, and have a significant impact on our ability to run trains on time. This programme will only begin to realise its full benefits towards the end of the control period.
5. Secondary, or reactionary, delays are those caused as a result of the knock on effect of a specific incident. The deployment of traffic management systems (TMS) will help significantly, as the system will determine the most effective response rather than an individual signaller.
Public Performance Measure (PPM) Period actual Period forecast Period target
MAA actual MAA forecast
MAA target
Key measures (continued)
10 Network Rail Quarterly Report Q3 2014/15

80.0%
84.0%
88.0%
92.0%
96.0%
100.0%
FDM
by
Perio
d
-3 year -2 year -1 year P1 P2 P3 P4 P5 P6 P7 P8 P9 P10 P11 P12 P13 +1 year +2 year +3 year +4 year
How are we doing?At Period 10, the moving annual average (MAA) for the Freight Delivery Metric (FDM) is 94.1 per cent against a regulatory target of 92.5 per cent. This is better than target and we are currently forecasting to deliver our year end forecast of 94.3 per cent.
Autumn is particularly challenging given the rail conditions and the risk of heavier freight trains on steeply graded routes slipping to stand. So, as part of our autumn preparedness initiative, we worked with freight operators to identify high risk sites, based on historical records, and implemented initiatives such as clear run policies and installation of track gel applicators. This has been strengthened with the support provided from the Freight Service Delivery Managers (FSDMs), who provide real time
focus on service recovery and review the worst performing freight services, identifying repeated trends and any intervention required.
Over the quarter, we have also seen delay caused by freight operators reduced as a result of greater focus on right time starts from terminals. This further supports the improvement in FDM, as it enables more arrivals at destination within 15 minutes of their booked time.
What are our plans?During the first three quarters of CP5, we have achieved our regulatory target. Our challenge is to maintain this and deliver our FDM forecast of 94.3 per cent for the end of the year. Our plans to manage this include:
• Continued focus on strategic freight corridors, in particular focussing efforts on corridors which are being adversely affected by network issues;
• Continued work with the industry on our approach to the expression of access rights, where we want to see more flexibility in access contacts to allow better use to be made of network capacity and improved performance whilst supporting rail freight growth; and
• A continued drive to improve right time departures from ports and terminals.
In addition, we have developed and are delivering an action plan focussed on reducing the delay caused by freight services to passenger services. The principal causes of such delays are late starts from terminals and train failures and we are continuing to work with our freight operator customers to better understand and manage these issues.
Freight Delivery Metric (FDM)
Key measures (continued)
Period actual Period forecast Period target
MAA actual MAA forecast
MAA target
11Network Rail Quarterly Report Q3 2014/15
0
30
60
90
120
Fina
ncia
l Per
form
ance
Mea
sure
(Ful
l Yea
r For
ecas
t)U
nder
perf
orm
ance
(£m
)
Tidy railwayFPM target Vegetationprogramme
BusinessCritical Rules
Bonusprovisionrelease
E�cienciesnot realised
Otheropex
Schedule 8 Schedule 4 Income Track unit costs
Signallingrenewals
Enhancements Latest forecast
20
8
925
37
12
44
10 68
10
21
116
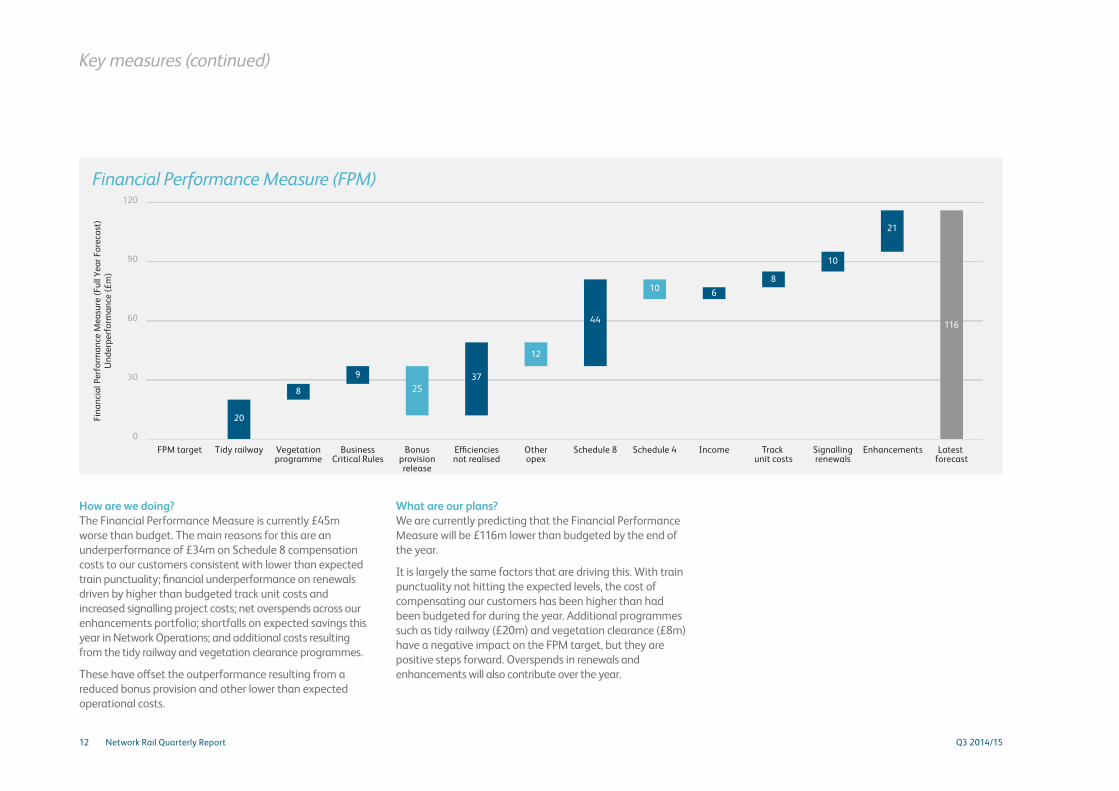
How are we doing?The Financial Performance Measure is currently £45m worse than budget. The main reasons for this are an underperformance of £34m on Schedule 8 compensation costs to our customers consistent with lower than expected train punctuality; financial underperformance on renewals driven by higher than budgeted track unit costs and increased signalling project costs; net overspends across our enhancements portfolio; shortfalls on expected savings this year in Network Operations; and additional costs resulting from the tidy railway and vegetation clearance programmes.
These have offset the outperformance resulting from a reduced bonus provision and other lower than expected operational costs.
What are our plans?We are currently predicting that the Financial Performance Measure will be £116m lower than budgeted by the end of the year.
It is largely the same factors that are driving this. With train punctuality not hitting the expected levels, the cost of compensating our customers has been higher than had been budgeted for during the year. Additional programmes such as tidy railway (£20m) and vegetation clearance (£8m) have a negative impact on the FPM target, but they are positive steps forward. Overspends in renewals and enhancements will also contribute over the year.
Financial Performance Measure (FPM)
Key measures (continued)
12 Network Rail Quarterly Report Q3 2014/15

0
5
10
15
20
Mile
ston
es p
rogr
ess
by p
erio
d(G
RIP
leve
l 3 &
6+
only
) – C
P5 D
eliv
ery
Plan
P2P1 P3 P4 P5 P6 P7 P8 P9 P10 P11 P12 P13
How are we doing?We are forecasting to deliver eight of the 10 key milestones by the end of the year. Of the two remaining, we expect that the one related to the Great Western Electrification will be delivered in May with little impact on the overall programme. The other, related to North West Electrification, is currently subject to an intensive review with the contractors.
Overall, there are 87 regulatory investment milestones in 2014/15. To date, we have been late in delivering 16 of 64, and we are forecasting overall milestone delivery at year end to be 57 of 87. This is clearly an ongoing matter of concern and action.
Overruns at two key sites over Christmas also had a significant negative impact, and overshadowed the many successes at Christmas including the completion of the Stockley flyover, resignalling at Watford and a 16-day blockade at London Bridge.
What are our plans?We have increased scrutiny of milestone adherence in our business reviews at all levels of governance, and we have engaged even more than before with our supply chain so they understand the importance attached to these regulated milestones.
In addition, we are sharpening accountability internally so there is clarity throughout the lifecycle of our projects. This will enable more effective management of our portfolio as a whole.
Investment milestones On Target Missed/Forecast Missed
Key measures (continued)
13Network Rail Quarterly Report Q3 2014/15

0.00%
2.00%
4.00%
6.00%
8.00%
Com
posi
te R
elia
bilit
y In
dex
P1 P2 P3 P4 P5 P6 P7 P8 P9 P10 P11 P12 P13 +1 year +2 year +3 year +4 year
How are we doing?The Composite Reliability Index measures the overall reliability of our assets. In the year to date, it remains worse than target, though this has been substantially driven by the unreliability of GSM-R and the impact of commissioning new fleets of trains, where a series of mitigation measures have been and are being developed. Without the impact of telecoms, we would have been on target in the year to date. Notably, there has been strong performance in reducing both points and traction power failures.
The quarter ended with a strong overall performance, driven overwhelmingly by better than forecast performance in civil assets such as buildings, earthworks and structures such as bridges.
However, we are now forecasting that the CRI will be 5.2 per cent at the end of the year, which is 0.5 per cent worse than our target of 5.7 per cent. This is largely driven by underperformance by track and telecoms, which we do not believe can be recovered in the remainder of the year.
What are our plans?We are continuing to roll out equipment that allows the condition of our assets to be monitored remotely which, combined with an improved understanding and analysis of the data gathered, will contribute to improved performance in both points and track circuits.
Tackling the unreliability of GSM-R, which is having a significant effect on our overall asset reliability as well as causing unacceptable disruption to passengers, is a key priority. Development of new software, known to be more reliable, is progressing. However, the roll out of GSM-R continues to expose new issues and we expect improvement over the next few years to be more gradual than had been forecasted.
Asset reliability is crucial to delivering the service that passengers have a right to expect, and it is clear we have to improve underlying reliability at a faster rate than we had originally planned, as well as reducing the time it takes to fix incidents and the impact this has on secondary delays to services.
Composite Reliability Index (CRI) Current Year Actual Current Year Forecast Target
Key measures (continued)
14 Network Rail Quarterly Report Q3 2014/15

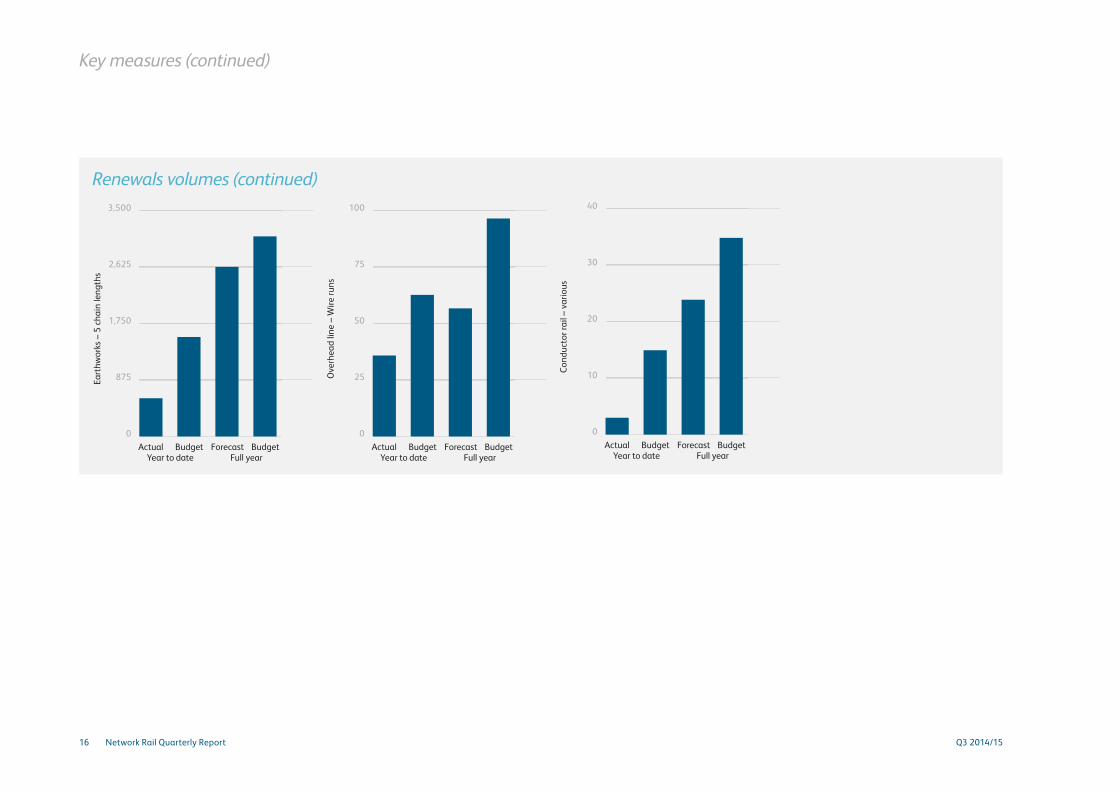
How are we doing?These seven key volumes represent about half of our overall renewals activity, and represent the most critical activities.
We are now forecasting that, at a national level, it is unlikely we will meet any of the seven targets. The factors contributing to this are complex, but include insufficient clarity and stability in the workbank; over-optimistic delivery schedules; delays in appointing contractors; and insufficient access.
What are our plans?Although it would require a significant acceleration simply to meet our current forecast for the year end, we are confident that there is sufficient work either scheduled for completion or in the pipeline in the remainder of the year to achieve these forecasts. We continue to discuss resources with our supply chain to improve overall delivery.
Renewals volumes – seven key volumes
Key measures (continued)
0
400
800
1,200
1,600
Trac
k –
Plai
n Li
ne –
1Km
BudgetActualYear to date
Forecast BudgetFull year
0
300
600
900
1,200
Switc
hes
and
cros
sing
s –
Poin
t End
s
BudgetActualYear to date
Forecast BudgetFull year
0
375
750
1,125
1,500
Sign
allin
g –
Tota
l N
umbe
r of S
EU
BudgetActualYear to date
Forecast BudgetFull year
0
30,000
60,000
90,000
120,000
Brid
ges
– sq
uare
met
res
BudgetActualYear to date
Forecast BudgetFull year
15Network Rail Quarterly Report Q3 2014/15
Key measures (continued)
Renewals volumes (continued)
0
875
1,750
2,625
3,500
Eart
hwor
ks –
5 c
hain
leng
ths
BudgetActualYear to date
Forecast BudgetFull year
0
25
50
75
100
Ove
rhea
d lin
e –
Wire
runs
BudgetActualYear to date
Forecast BudgetFull year
0
10
20
30
40
Cond
ucto
r rai
l – v
ario
us
BudgetActualYear to date
Forecast BudgetFull year
16 Network Rail Quarterly Report Q3 2014/15

Glossary
This page provides details and explanations for some of the terms, abbreviations and acronyms that have been used in this report.
Term Description
Control Period Network Rail's funding, and what it has to deliver, is determined by the Office of Rail Regulation. This is done every five years. These five year periods are known as control periods. We are currently in Control Period 5 (2014/15 to 2018/19)
Enhancements Enhancements are the projects that Network Rail is delivering to improve or grow the railway. These range in size from those which cost a few hundred thousand pounds to those which cost many billions, but all of them enhance the railway in some way
Final determination The final determination is the decision taken by the Office of Rail Regulation on what Network Rail has to deliver, and how much funding it has to deliver it, during a control period
IP Infrastructure Projects – Network Rail's project delivery arm
LX Level crossingMAA Moving Annual Average – this is a measurement that
is updated every four weeks, and covers train punctuality and other measures over the previous 12 months (13 periods)
Period The railway year is sub-divided into 13 periods of four weeks each from 1 April to 31 March
Renewals Renewals refers to Network Rail's programme of renewing its assets, such as track, points or conductor rails
RIDDOR Reporting of Injuries, Diseases and Dangerous Occurrences Regulations
Schedule 4 Payments made by Network Rail to compensate its customers – the train and freight operators – for planned disruption
Schedule 8 Payments made by Network Rail to compensate its customers for unplanned disruption.
YTD Year to date
17Network Rail Quarterly Report Q3 2014/15

Network Rail Limited 1 Eversholt Street London NW1 2DN
Tel: 020 3356 9595
networkrail.co.uk
Company number: 4402220 Registered in England and Wales
Look out for our next quarterly report published in the spring.
In the meantime further updates and information is at networkrail.co.uk