Q3 2012 TELUS investor conference call November 9, 2012 Robert McFarlane EVP & Chief Financial...
28
Q3 2012 TELUS investor conference call November 9, 2012 Robert McFarlane EVP & Chief Financial Officer Joe Natale EVP & Chief Commercial Officer Darren Entwistle President & Chief Executive Officer
-
Upload
arnold-henderson -
Category
Documents
-
view
215 -
download
0
Transcript of Q3 2012 TELUS investor conference call November 9, 2012 Robert McFarlane EVP & Chief Financial...

Q3 2012 TELUS investor conference callNovember 9, 2012
Robert McFarlaneEVP & Chief Financial Officer
Joe NataleEVP & Chief Commercial Officer
Darren EntwistlePresident & Chief Executive Officer
TELUS Forward Looking Statement
Today's presentation and answers to questions contain statements about expected future events and financial and operating performance of TELUS that are forward-looking. By their nature, forward-looking statements require the Company to make assumptions and predictions and are subject to inherent risks and uncertainties. There is significant risk that the forward-looking statements will not prove to be accurate. Readers are cautioned not to place undue reliance on forward-looking statements as a number of factors could cause actual future performance and events to differ materially from that expressed in the forward-looking statements. Accordingly our comments are subject to the disclaimer and qualified by the assumptions (including assumptions for 2012 annual guidance), qualifications and risk factors (including the potential for a future non-voting to common share exchange proposal on a one-for-one basis, the ability over time to sustain dividend growth of circa 10% per annum with semi-annual dividend increases to 2013, and CEO three year goals for EPS and free cash flow growth excluding spectrum costs to 2013) referred to in the Management’s discussion and analysis in the 2011 annual report, and in the 2012 first, second and third quarter reports. Except as required by law, TELUS disclaims any intention or obligation to update or revise forward-looking statements, and reserves the right to change, at any time at its sole discretion, its current practice of updating annual targets and guidance.
2

3
Agenda
Wireless and wireline segment review
Consolidated financial review
Updates
Dividend increase
2012 guidance
Share exchange proposal
Operational highlights
Questions and Answers
CEO introduction
Reporting strong third quarter 2012 results
Increasing dividend, consistent with semi-annual growth model
Thanking shareholders for decisive support of share exchange proposal
Celebrating Bob McFarlane’s outstanding career at TELUS
Welcoming new CFO, John Gossling, to TELUS leadership team
4

Q3 2012 wireless financial results
($M) Q3-11 Q3-12 change
Revenue (external) 1,397 1,501 7.4%
EBITDA 570 640 12%
EBITDA margin1
(total revenue)40.5% 42.4% 1.9 pts
Capex 157 175 11%
EBITDA less capex 413 465 13%
1 Margins on network revenue in Q3-12 and Q3-11 were 46.6% and 44.2%, respectively.
Strong double digit EBITDA growth leading to cash flow growth of 13%
5
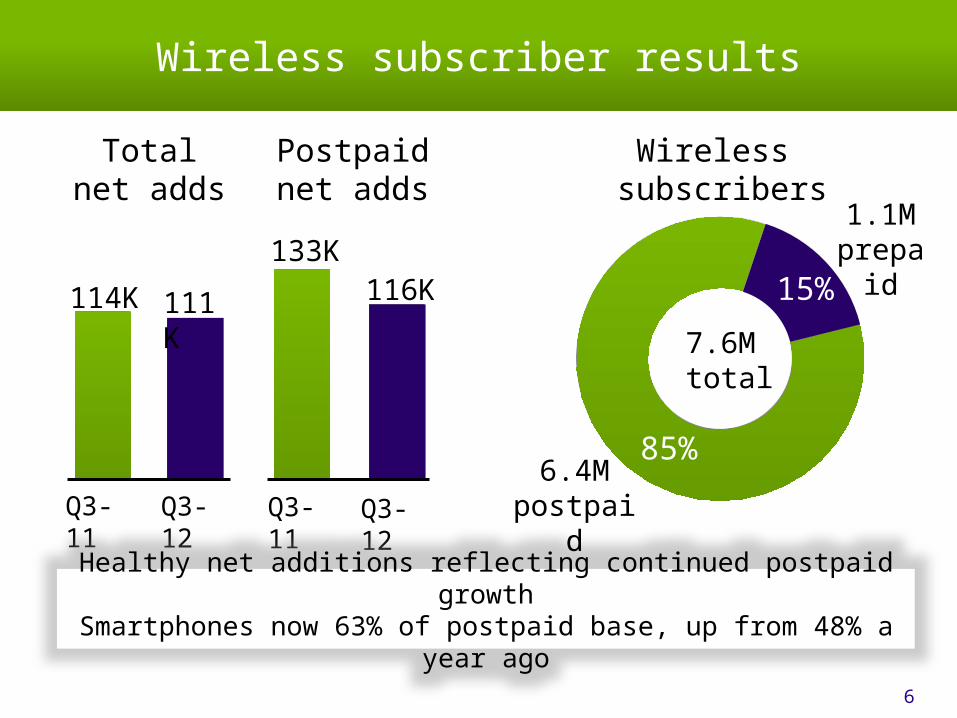
Wireless subscriber results
Wireless subscribers
Postpaidnet adds
7.6M total
1.1Mprepaid
Q3-11
133K116K
Q3-12
Totalnet adds
Q3-11
114K 111K
Q3-12
Healthy net additions reflecting continued postpaid growthSmartphones now 63% of postpaid base, up from 48% a year ago
85%
15%
6.4Mpostpaid
6
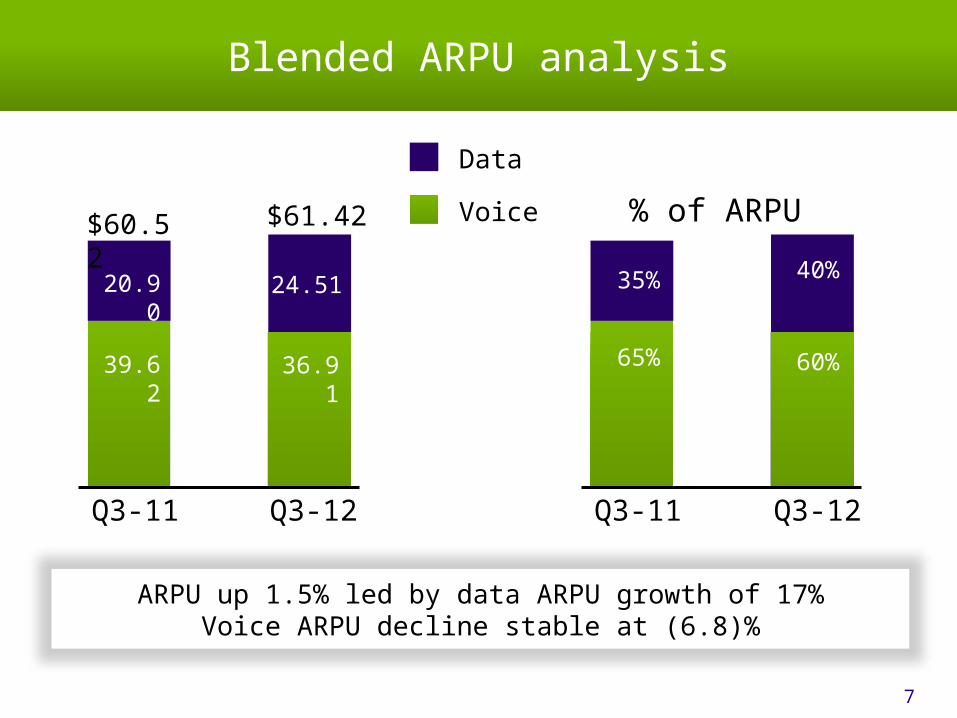
Blended ARPU analysis
Data
Q3-12
$61.42 Voice$60.52
Q3-11
% of ARPU
Q3-12Q3-11
60%
40%24.51
39.62 36.91
ARPU up 1.5% led by data ARPU growth of 17%Voice ARPU decline stable at (6.8)%
20.90
65%
35%
7
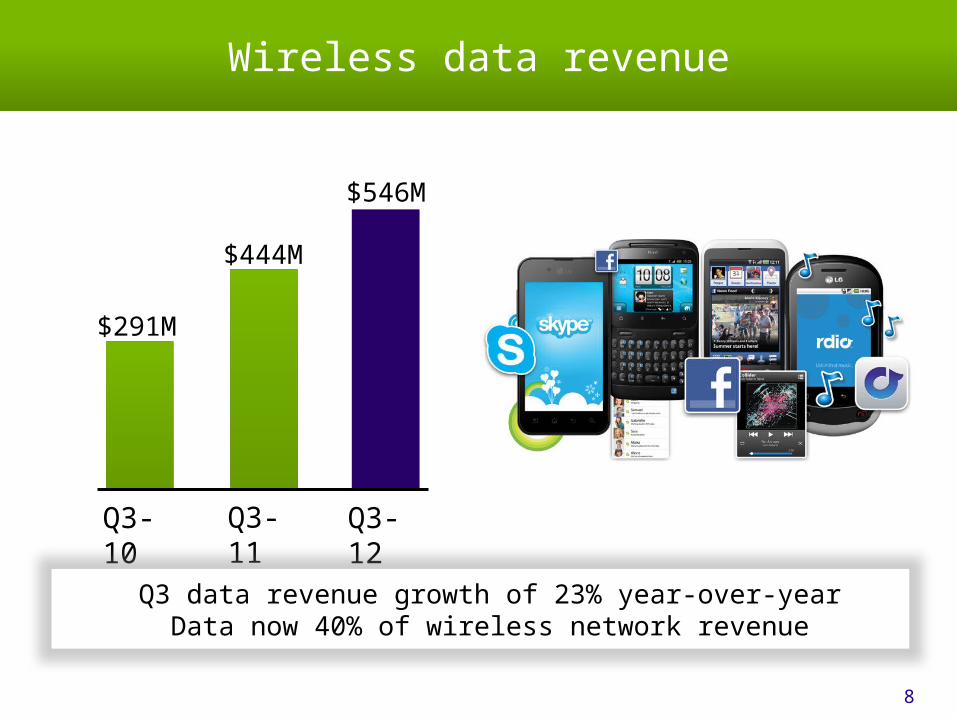
Wireless data revenue
Q3-11
$444M
Q3-12
$546M
$291M
Q3-10
Q3 data revenue growth of 23% year-over-yearData now 40% of wireless network revenue
8
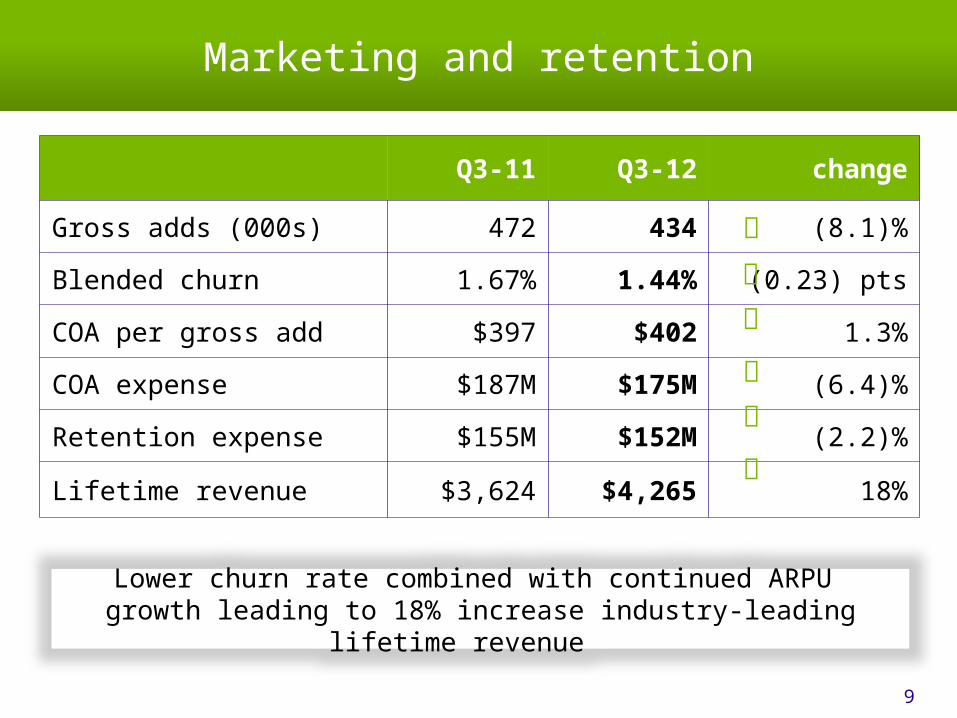
Marketing and retention
Q3-11 Q3-12 change
Gross adds (000s) 472 434 (8.1)%
Blended churn 1.67% 1.44% (0.23) pts
COA per gross add $397 $402 1.3%
COA expense $187M $175M (6.4)%
Retention expense $155M $152M (2.2)%
Lifetime revenue $3,624 $4,265 18%
Lower churn rate combined with continued ARPU growth leading to 18% increase industry-leading lifetime revenue
9
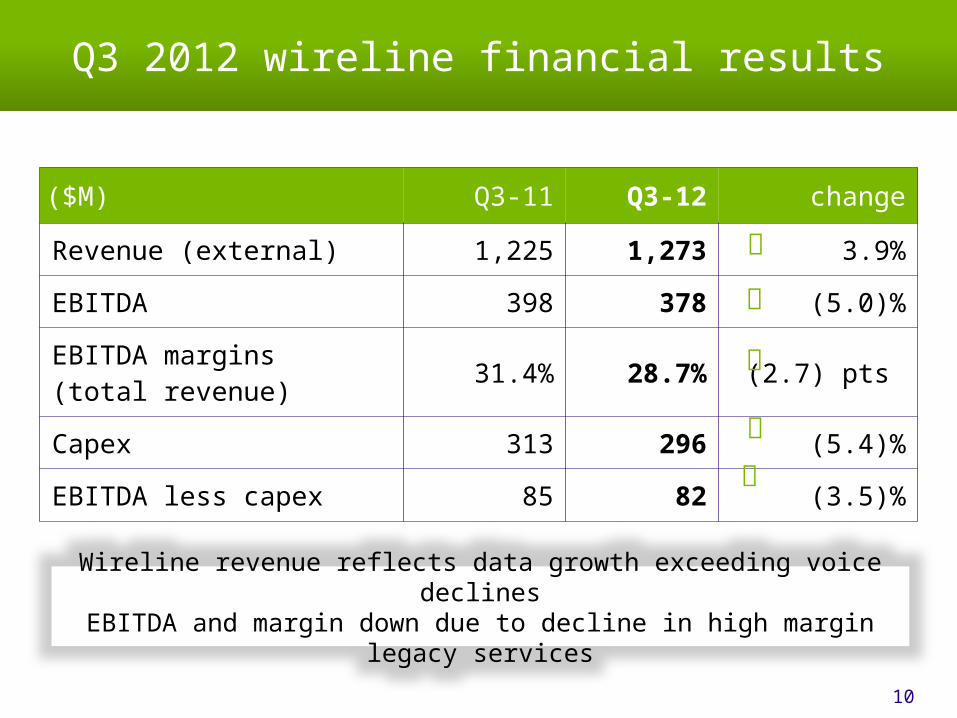
Q3 2012 wireline financial results
($M) Q3-11 Q3-12 change
Revenue (external) 1,225 1,273 3.9%
EBITDA 398 378 (5.0)%
EBITDA margins(total revenue)
31.4% 28.7% (2.7) pts
Capex 313 296 (5.4)%
EBITDA less capex 85 82 (3.5)%
Wireline revenue reflects data growth exceeding voice declinesEBITDA and margin down due to decline in high margin legacy services
10
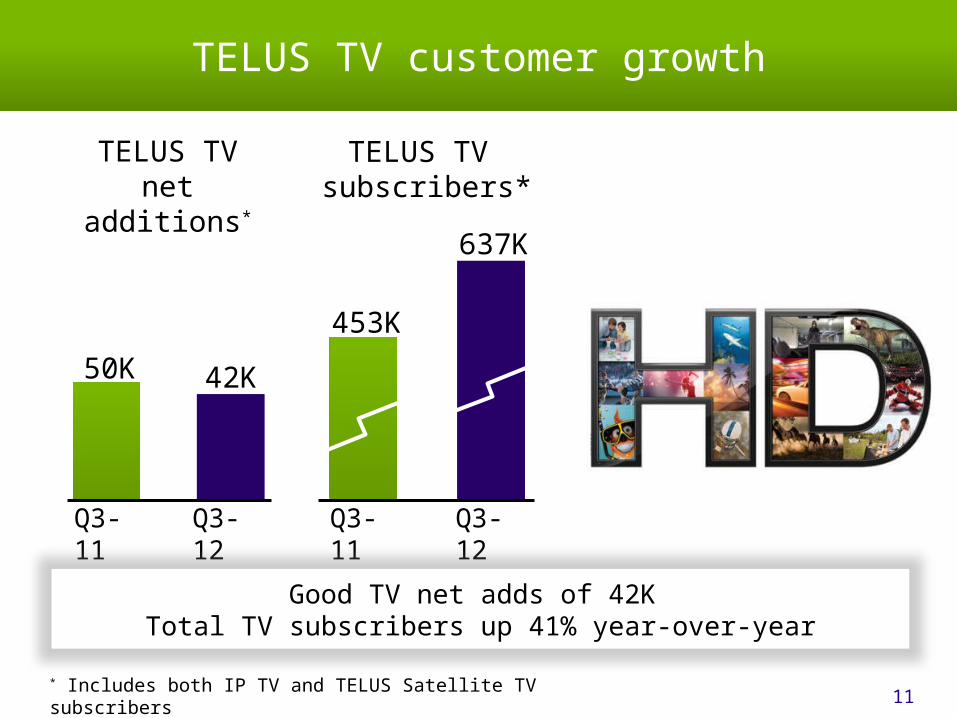
TELUS TV customer growth
Q3-11
50K 42K
Q3-12
TELUS TV net additions*
TELUS TV subscribers*
* Includes both IP TV and TELUS Satellite TV subscribers
Q3-12Q3-11
453K
637K
Good TV net adds of 42K Total TV subscribers up 41% year-over-year
11

Q3-11
1.2M
TELUS high-speed Internet customer growth
Q3-11
22K
Q3-12
26K
Excellent high-speed Internet net adds up 18% Subscriber base up 85,000 year-over-year to surpass 1.3 million
High-speed subscribers
Q3-12
1.3M
High-speed net additions
12

TELUS network access line losses
Q3-12 Q3-12
-30K -30K
-13K -9K
Q3-11Q3-11
BusinessResidential
Residential NAL losses flat year-over-year and lowest since Q1/06Business lines improved y/y but continue to be impacted by competition
13

Q3 2012 consolidated financial results
($M, except EPS) Q3-11 Q3-12 change
Revenue (external) 2,622 2,774 5.8%
EBITDA 968 1,018 5.2%
EPS (basic) 1.00 1.08 8.0%
Capex 470 471 0.2%
EBITDA less capex 498 547 9.8%
Free cash flow 345 426 23%
Consolidated revenue, EBITDA and EPS growth driven by wireless Strong double digit free cash flow growth of 23%
14
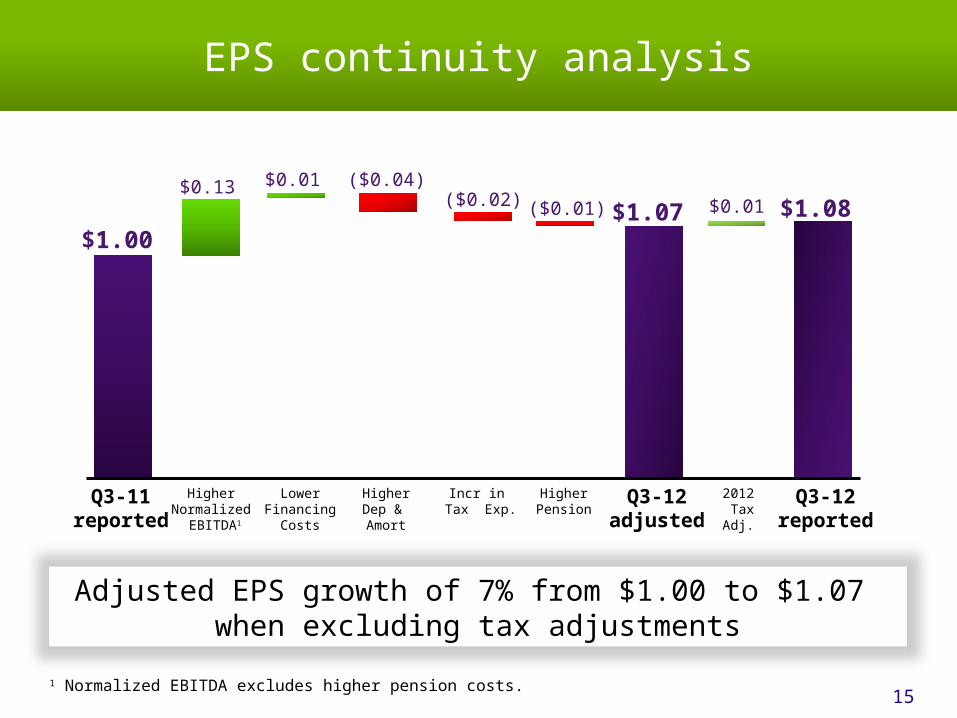
EPS continuity analysis
$1.00
$0.01
($0.04)$0.01 ($0.02)
$1.07 ($0.01)$0.13
$1.08
Higher Normalized
EBITDA1
HigherPension
LowerFinancing
Costs
HigherDep & Amort
Incr in Tax Exp.
2012 Tax Adj.
Q3-12 reported
Q3-11 reported
Q3-12 adjusted
Adjusted EPS growth of 7% from $1.00 to $1.07 when excluding tax adjustments
1 Normalized EBITDA excludes higher pension costs. 15

TELUS raises quarterly dividend to 64 cents
January 2, 2013 dividend of 64 cents declared
Up 3 cents from October dividend
Up 6 cents or 10.3% from year ago
$2.56 annualized
Q1 Q2 Q3 Q4 Q1 Q2 Q3 Q4
2011 2012
52.5 55 5558 58 61 61
64
* See forward looking statement caution. Dividend decisions will continue to be subject to the Board’s assessment and determination of the Company’s financial situation and outlook on a quarterly basis.
Fourth of six semi-annual dividend increases targeted Consistent with TELUS’ dividend growth model to 2013
16
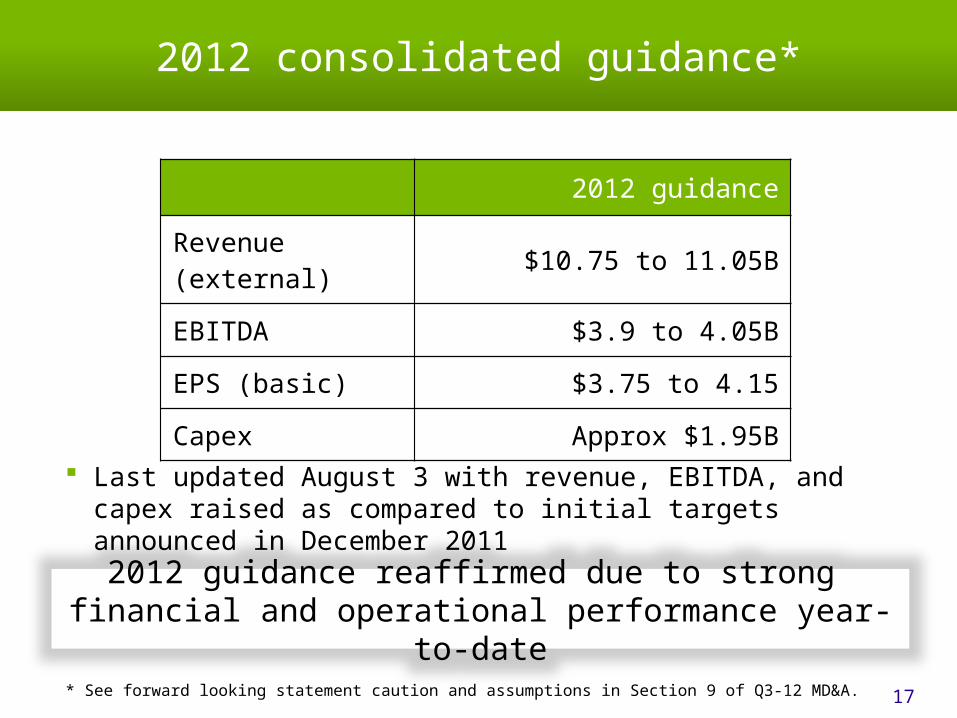
2012 consolidated guidance*
2012 guidance reaffirmed due to strong financial and operational performance year-to-date
2012 guidance
Revenue (external) $10.75 to 11.05B
EBITDA $3.9 to 4.05B
EPS (basic) $3.75 to 4.15
Capex Approx $1.95B
17
Last updated August 3 with revenue, EBITDA, and capex raised as compared to initial targets announced in December 2011
* See forward looking statement caution and assumptions in Section 9 of Q3-12 MD&A.

TELUS share exchange proposal – key dates
18
Court approval needed for share exchange proposal to proceed
Oct. 12, 2012BC Court of Appeal allows Mason meeting requisition and four resolutions to proceed.
Oct. 15Supreme Court of B.C. (Court) rejects Mason’s attempt to set aside TELUS’ interim order and confirmed validity of the order it granted TELUS in August.
Oct. 15Court orders joint meeting to consider TELUS’ proposal and Mason Capital’s resolutions.
Oct. 17At meeting TELUS shareholders voted strongly in favour of share exchange proposal. None of Mason’s resolutions passed.
Oct. 23Court granted TELUS’ adjournment application for Mason’s appeals and TELUS’ final order application be heard beginning Nov. 7
Nov. 7Court hearing begins on Mason appeals and TELUS’ final order application for the share exchange plan of arrangement

October 17 shareholders meeting
19
81.1% of total shares voted were in favour of TELUS’ share exchange proposal
62.9% of 128.8 million common shares voted were in favour 99.5% of 127.7 million non-voting shares voted were in favour
Excluding Mason’s most recently reported (Aug 31) voting block 84.4% of common shares voted were in favour 93.0% of total shares voted were in favour of the exchange
None of Mason’s four resolutions voted on only by Common shareholders passed
TELUS shareholders decisively approveone-for-one share exchange proposal
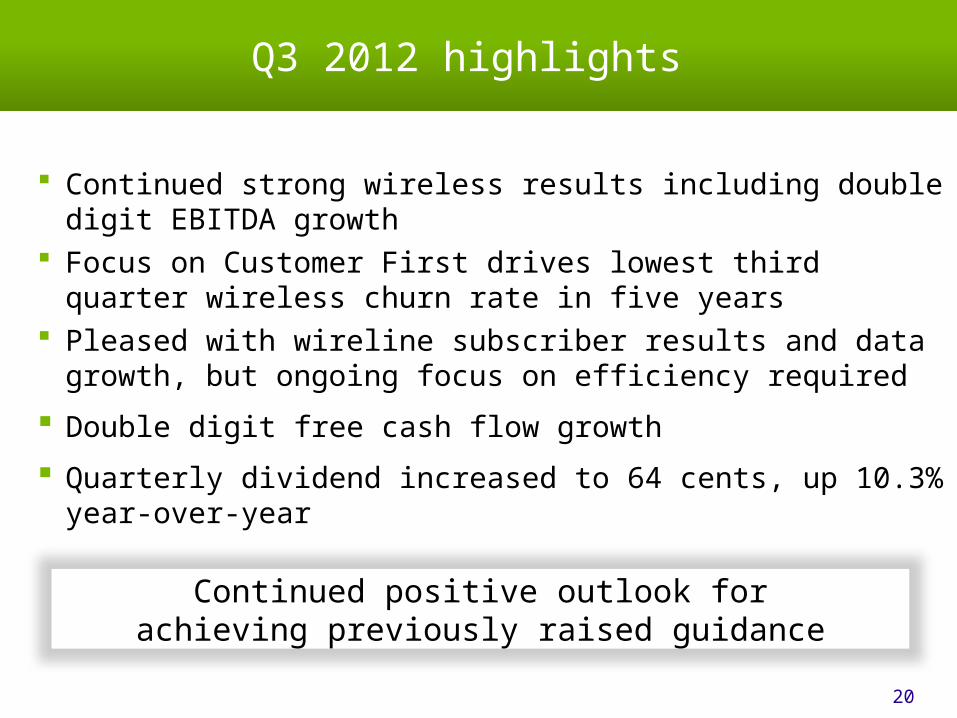
Q3 2012 highlights
Continued strong wireless results including double digit EBITDA growth
Focus on Customer First drives lowest third quarter wireless churn rate in five years
Pleased with wireline subscriber results and data growth, but ongoing focus on efficiency required
Double digit free cash flow growth
Quarterly dividend increased to 64 cents, up 10.3% year-over-year
Continued positive outlook forachieving previously raised guidance
20
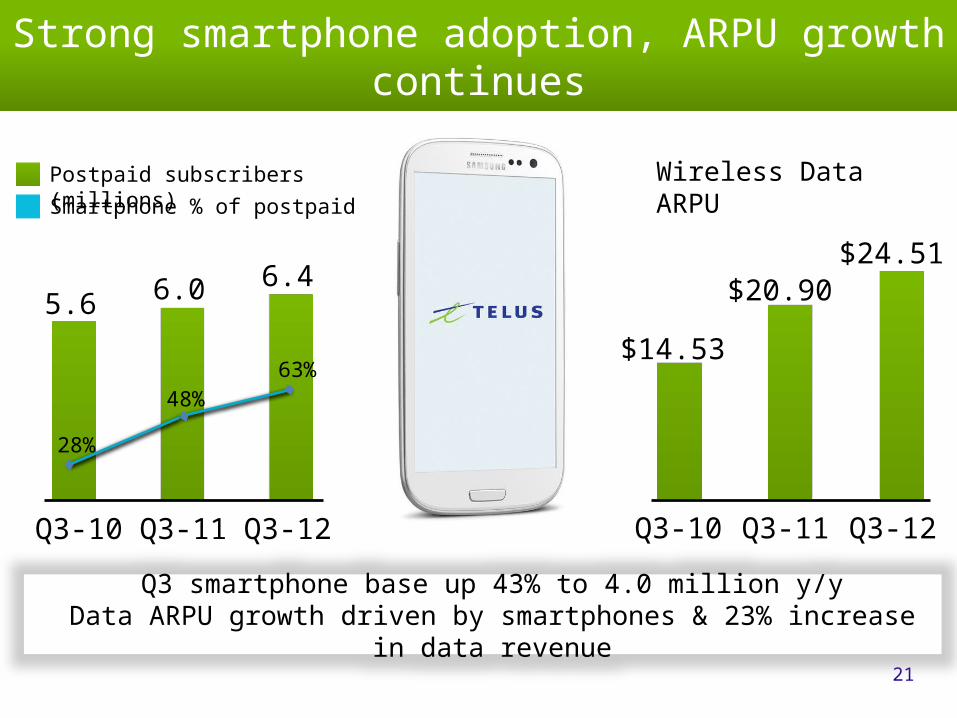
Strong smartphone adoption, ARPU growth continues
21
Q3 smartphone base up 43% to 4.0 million y/yData ARPU growth driven by smartphones & 23% increase in data
revenue
Q3-10 Q3-11 Q3-12
5.6 6.0 6.4
Postpaid subscribers (millions)
Smartphone % of postpaid
$14.53
$20.90$24.51
Q3-10 Q3-11 Q3-12
Wireless Data ARPU
28%
48%63%
Q3-11 Q3-12
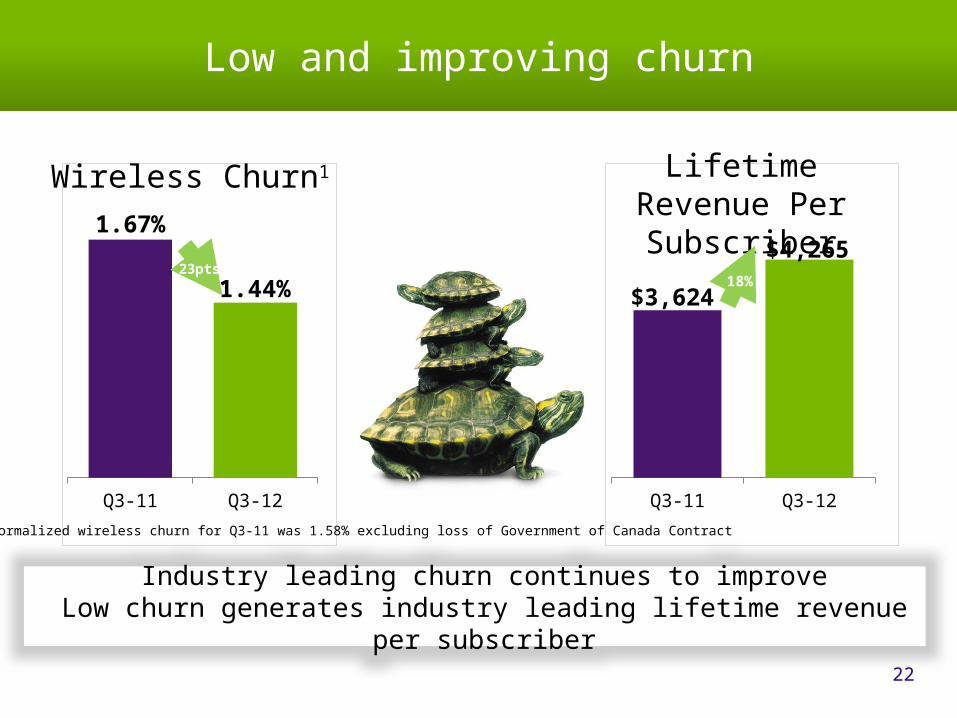
1.67%
Low and improving churn
22
Industry leading churn continues to improveLow churn generates industry leading lifetime revenue per subscriber
1.44%
Q3-11 Q3-12
$4,265
$3,624
Wireless Churn1 Lifetime Revenue Per Subscriber
1 Normalized wireless churn for Q3-11 was 1.58% excluding loss of Government of Canada Contract
23pts18%

Future friendly home – continued strength in Optik
23
TV and High-Speed Internet loading exceedingresidential NAL losses for ninth consecutive quarter
TELUS TVResidential NALs
High-speed Internet
Q3-11 Q3-12Q3-10
72K 68K
-30K
38K
50K
53K
-39K -30K -30K
38K 50K 42K
15K
22K26K

Optik TV innovations continues
24
Launched Optik Smart Remote App Change channels with tap on an iPhone or iPad Channel surf or browse interactive guide without interrupting what you
are watching
Added 10 new HD channels Optik offers >550 channels, including 135 in HD
Further introduction of innovative new services supports premium, differentiated customer experience and steady momentum

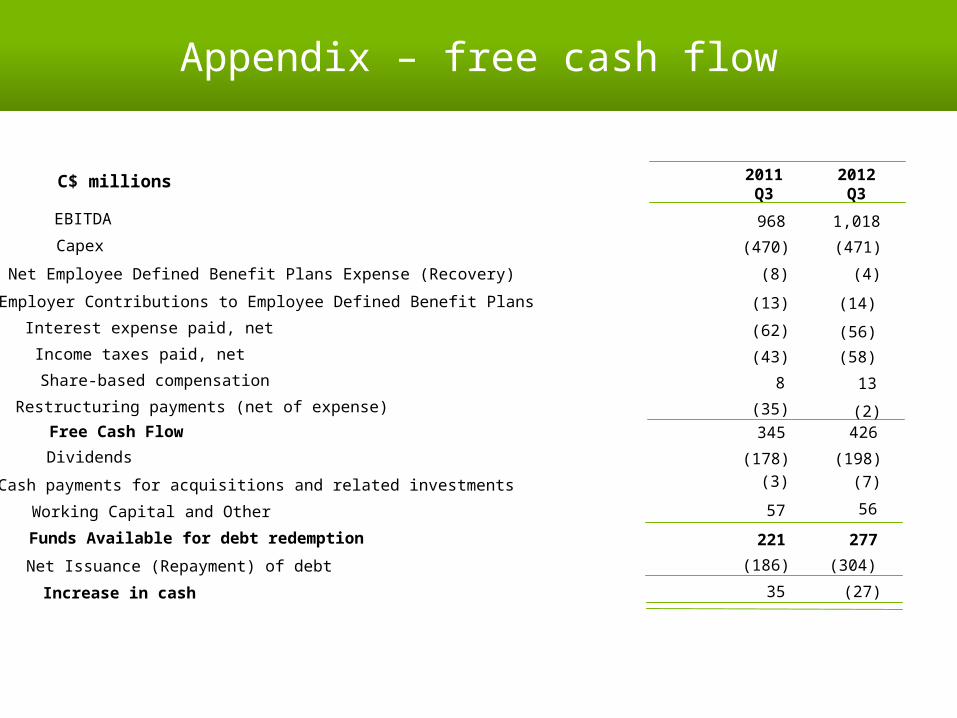
Appendix – free cash flow
2012Q3
2011Q3
C$ millions
EBITDA 968 1,018
Capex (470) (471)
Net Employee Defined Benefit Plans Expense (Recovery) (8) (4)
Employer Contributions to Employee Defined Benefit Plans (13) (14)
Interest expense paid, net (62) (56)
Income taxes paid, net (43) (58)
Share-based compensation 8 13
Restructuring payments (net of expense) (35) (2)Free Cash Flow 426
(178) (198)Dividends
Working Capital and Other 57 56
Funds Available for debt redemption 221 277
Net Issuance (Repayment) of debt (186) (304)
Increase in cash 35 (27)
Cash payments for acquisitions and related investments (3)
345
(7)
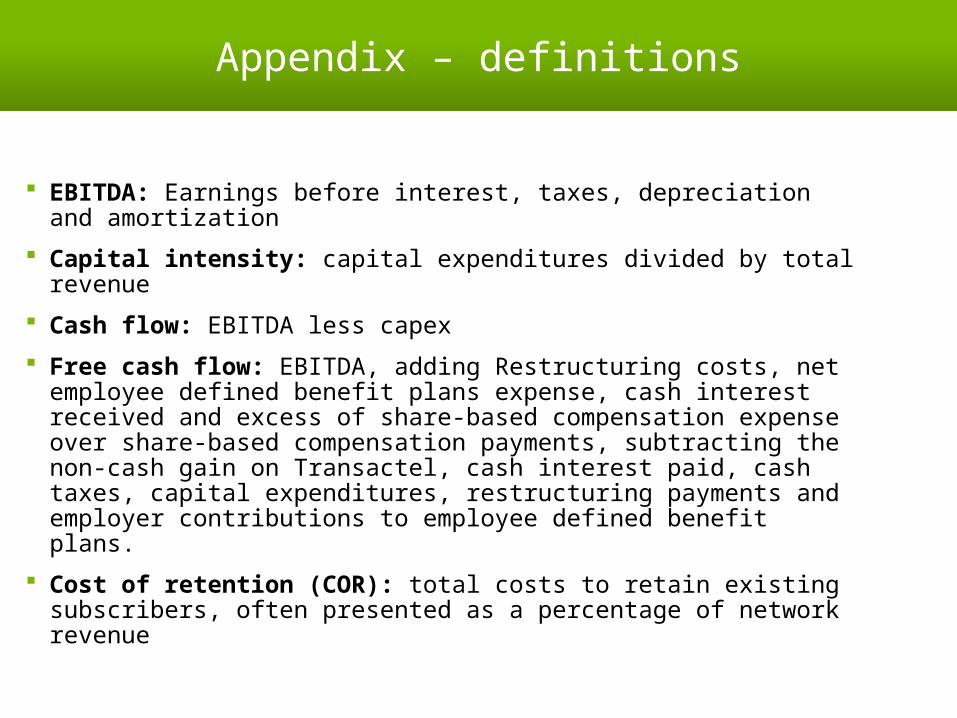
Appendix – definitions
EBITDA: Earnings before interest, taxes, depreciation and amortization
Capital intensity: capital expenditures divided by total revenue
Cash flow: EBITDA less capex
Free cash flow: EBITDA, adding Restructuring costs, net employee defined benefit plans expense, cash interest received and excess of share-based compensation expense over share-based compensation payments, subtracting the non-cash gain on Transactel, cash interest paid, cash taxes, capital expenditures, restructuring payments and employer contributions to employee defined benefit plans.
Cost of retention (COR): total costs to retain existing subscribers, often presented as a percentage of network revenue
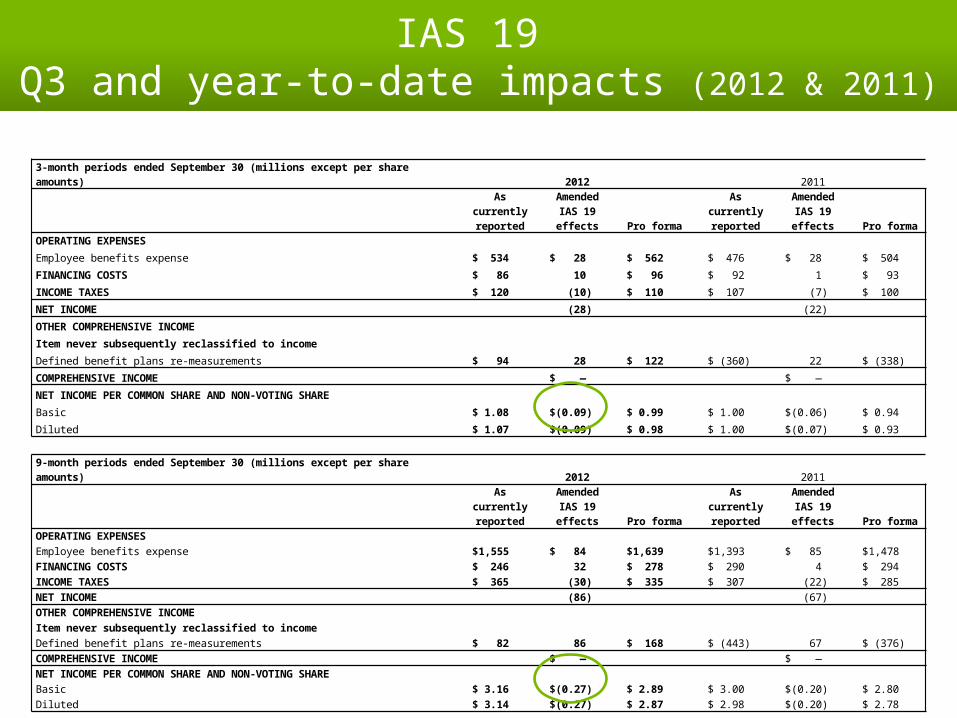
IAS 19 Q3 and year-to-date impacts (2012 & 2011)
3-month periods ended September 30 (millions except per share amounts) 2012 2011
As currently reported
Amended IAS 19 effects Pro forma
As currently reported
Amended IAS 19 effects Pro forma
OPERATING EXPENSES
Employee benefits expense $ 534 $ 28 $ 562 $ 476 $ 28 $ 504
FINANCING COSTS $ 86 10 $ 96 $ 92 1 $ 93
INCOME TAXES $ 120 (10) $ 110 $ 107 (7) $ 100
NET INCOME (28) (22)
OTHER COMPREHENSIVE INCOME
Item never subsequently reclassified to income
Defined benefit plans re-measurements $ 94 28 $ 122 $ (360) 22 $ (338)
COMPREHENSIVE INCOME $ — $ —
NET INCOME PER COMMON SHARE AND NON-VOTING SHARE
Basic $ 1.08 $ (0.09) $ 0.99 $ 1.00 $ (0.06) $ 0.94
Diluted $ 1.07 $ (0.09) $ 0.98 $ 1.00 $ (0.07) $ 0.93
9-month periods ended September 30 (millions except per share amounts) 2012 2011
As currently reported
Amended IAS 19 effects Pro forma
As currently reported
Amended IAS 19 effects Pro forma
OPERATING EXPENSES
Employee benefits expense $ 1,555 $ 84 $ 1,639 $ 1,393 $ 85 $ 1,478
FINANCING COSTS $ 246 32 $ 278 $ 290 4 $ 294
INCOME TAXES $ 365 (30) $ 335 $ 307 (22) $ 285
NET INCOME (86) (67)
OTHER COMPREHENSIVE INCOME
Item never subsequently reclassified to income
Defined benefit plans re-measurements $ 82 86 $ 168 $ (443) 67 $ (376)
COMPREHENSIVE INCOME $ — $ —
NET INCOME PER COMMON SHARE AND NON-VOTING SHARE
Basic $ 3.16 $ (0.27) $ 2.89 $ 3.00 $ (0.20) $ 2.80
Diluted $ 3.14 $ (0.27) $ 2.87 $ 2.98 $ (0.20) $ 2.78