Q1 2014 DHL/BCC Quarterly International Trade Outlook
28
1ST QUARTER 2014 QUARTERLY INTERNATIONAL TRADE OUTLOOK BRITISH CHAMBERS OF COMMERCE IN PARTNERSHIP WITH DHL
Transcript of Q1 2014 DHL/BCC Quarterly International Trade Outlook
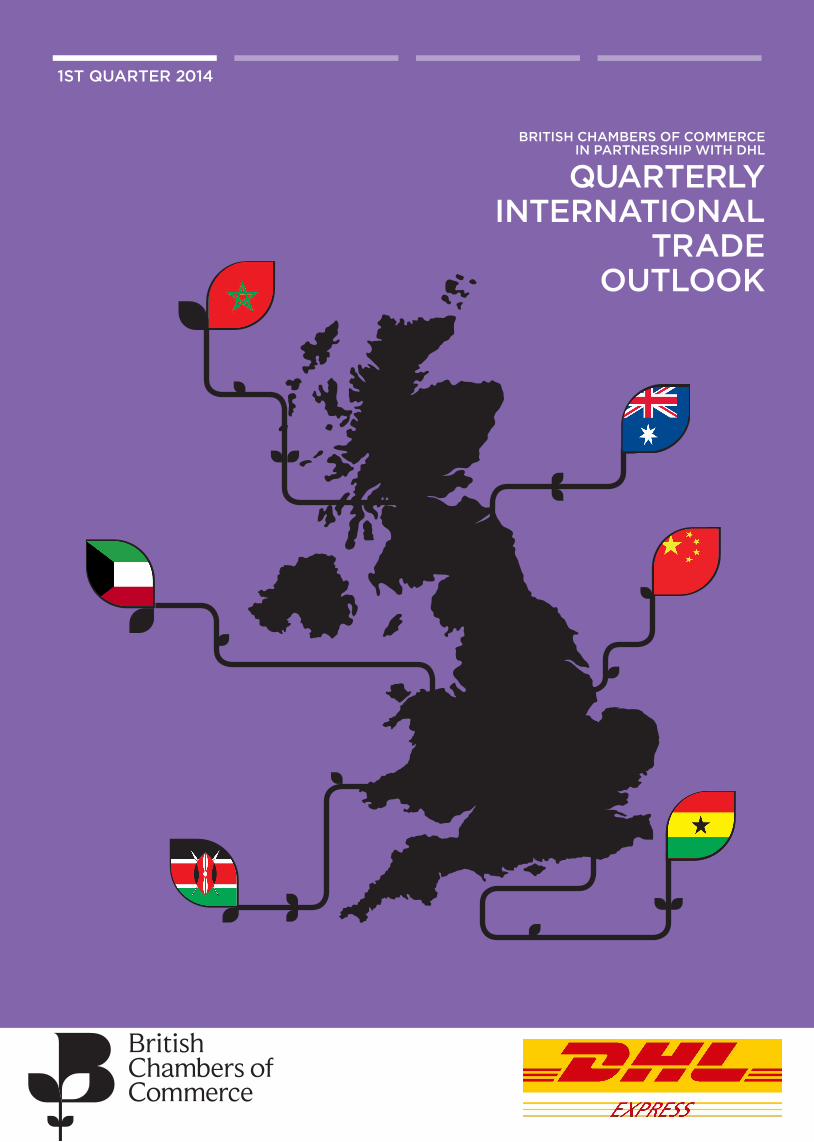
1ST QUARTER 2014
QUARTERLY INTERNATIONAL
TRADE OUTLOOK
BRITISH CHAMBERS OF COMMERCE IN PARTNERSHIP WITH DHL
The British Chambers of Commerce is the national body for a powerful and influential Network of Accredited Chambers of Commerce across the UK, a Network that directly serves not only its member businesses, but the wider business community. Representing thousands of businesses of all sizes and within all sectors, the British Chambers of Commerce is the voice of the ‘real economy’. Every Chamber sits at the very heart of its local community working with businesses to grow and develop by sharing opportunities, expertise and know-how. No other organisation makes such a difference to business as the British Chambers of Commerce.
Written and researched by: Sukhdeep Dhillon, Global Economic Adviser Suren Thiru, UK Economist Tom Nolan, Policy Manager
Acknowledgements: Mike Spicer, Director of Research
The British Chambers of Commerce 65 Petty France St. James’s Park London SW1H 9EU T: 020 7654 5800 E: [email protected]
www.britishchambers.org.uk
THE BRITISH CHAMBERS OF
COMMERCE
Contents
Foreword 3
DHL/BCC Trade Confidence Index 4
Export index 5
Export & confidence balances 6
Recent performance & outlook 7
Factsheets overview 8-9
Kenya 10-11
Ghana 12-13
Kuwait 14-15
Morocco 16-17
Australia 18-19
China 20-21
Overview of trade agreements 22-23
Case study: ‘Our export journey’ 24
How UK exports will change 25
Methodology 26
DHL – THE LOGISTICS COMPANY FOR THE WORLD
About this outlook
DHL is the global market leader in the logistics industry and “The Logistics company for the world”. DHL commits its expertise in international express, air and ocean freight, road and rail transportation, contract logistics and international mail services to its customers. A global network composed of more than 190 countries and territories and about 275,000 employees worldwide offers customers superior service quality and local knowledge to satisfy their supply chain requirements. DHL accepts its social responsibility by supporting climate protection, disaster management and education.
DHL is part of Deutsche Post DHL. The Group generated revenue of more than 53 billion euros in 2011.
www.dp-dhl.com
The BCC/DHL Quarterly International Trade Outlook sets out the opportunities and risks facing British companies as they trade with the world – with a particular focus on timely information on dynamic new markets. It features the DHL/BCC Trade Confidence Index (TCI) which is a measure of the UK’s exporting health. It builds on the role of accredited Chambers of Commerce – the UK’s premier private-sector providers of international trade support to business – and the modelling expertise of Oxford Economics, who have provided all the economic and trade forecasts presented in this publication.
2

3
Foreword by John LongworthDirector General, British Chambers of Commerce
There has been lots of positivity around trade amongst Chamber members and customers recently and it’s only getting better. With the UK set to be the fastest-growing major economy this year, according to the International Monetary Fund, there is definitely a wave of optimism in the air for British exporters. The BCC’s figures for Q1 2014 show the volume of trade documents issued to UK exporters increased and is the second highest on record.
It is also good news that the trade deficit improved in February and business outlook is gradually improving, the pace is far too slow for what the economy needs. Our Quarterly Economic Survey (QES) shows that our members are enthusiastic about increasing their exports, but much more needs to be done if this enthusiasm is to be reflected in the national figures. The fact is that too many British companies either export reactively, or shy away from doing so because of perceived barriers, lack of local knowledge, business contacts, or practical considerations such as a postal address or office space.
It is crucial that business people have a quality approved, business savvy provider of support services in new markets,
and are confident that as they step off the plane, they can easily be connected with new exporting opportunities. The BCC is delighted to be working with the UK Government to create a strong, global business-to-business network, giving companies that haven’t exported before the tools and the confidence to seek out opportunities in new markets across the world.
With the right support, attitude and sheer determination, there is no reason why the UK can’t meet the huge challenge set by the Prime Minister of increasing exports to one trillion by 2020.
Foreword by Phil CouchmanCEO, DHL Express UK & Ireland
Looking to new markets remains key for growth, and the Chancellor’s recent trade trip to Brazil to build business relationships shows that this is a market with significant opportunities for businesses. The upcoming 2014 FIFA World Cup and 2016 Olympic Games also demonstrates a huge investment in this territory’s infrastructure.
However, considering new markets for entry requires detailed planning and research. There are a number of resources available, one of which includes the DHL’s new Export Advisors Service - a team of dedicated small business exporting experts providing free advice for businesses, whether they are a DHL customer or not.
The UK SMEs already growing their businesses overseas are hugely confident in the possibilities the export market presents. However there are still many hurdles for SMEs to overcome such as, language differences and a lack of new market knowledge.
If the UK is going to successfully rebalance its economy away from consumer and Government debt, there must be more support available for businesses who wish to export. A great deal of work has already been undertaken to aid businesses on their route to exporting and to keep this success overseas marching on, we must continue to make sure that support is readily available.
The DHL/BCC Trade Confidence Index (TCI) in Q1 2014 saw increased confidence levels amongst exporters and crucially a rise in the volume of export documentation to the second highest level on record. This positive sentiment coupled with the Government’s increasing support for exporters, such as the new export credit scheme, means that British businesses are slowly being equipped with the tools they need to capitalise on the benefits of growing their business abroad.
4
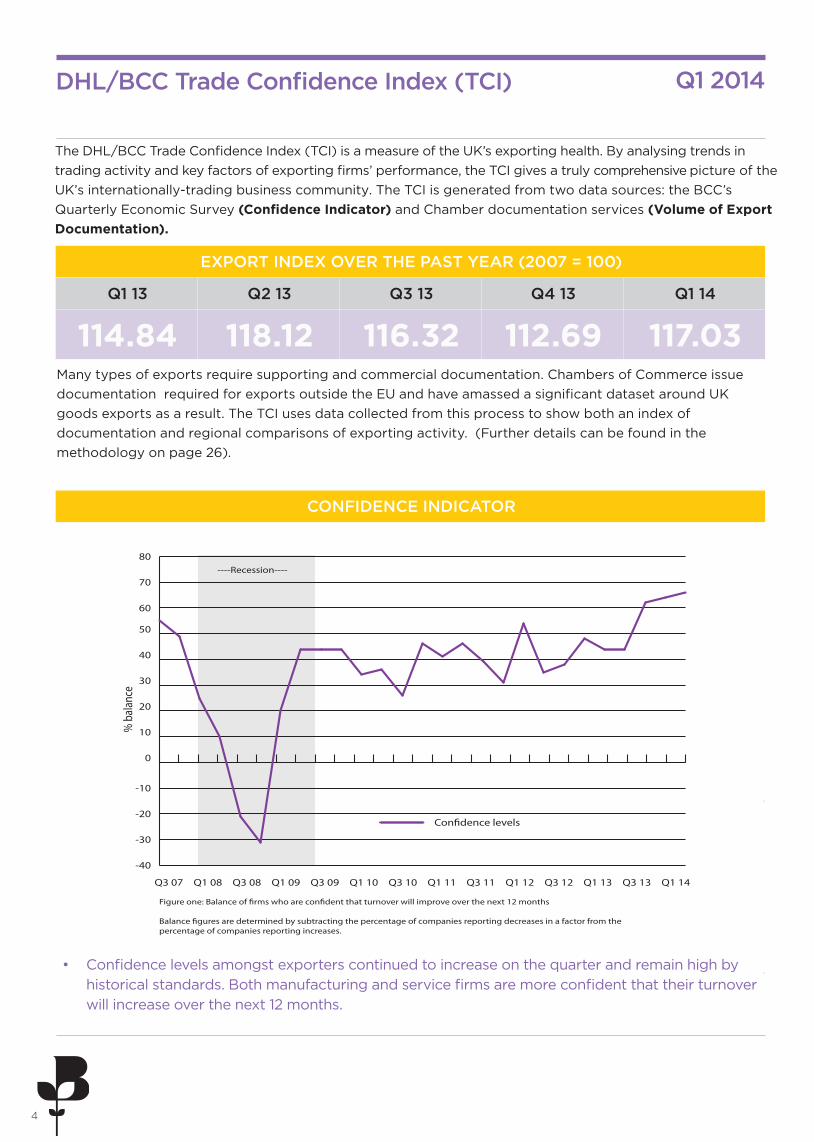
DHL/BCC Trade Confidence Index (TCI)
----Recession----
% b
alan
ce
Figure one: Balance of �rms who are con�dent that turnover will improve over the next 12 months
Balance �gures are determined by subtracting the percentage of companies reporting decreases in a factor from the percentage of companies reporting increases.
-40
-30
-20
-10
0
10
20
30
40
50
60
70
80
Q1 14Q3 13Q1 13Q3 12Q1 12Q3 11Q1 11Q3 10Q1 10Q3 09Q1 09Q3 08Q1 08Q3 07
Con�dence levels
• Confidence levels amongst exporters continued to increase on the quarter and remain high by historical standards. Both manufacturing and service firms are more confident that their turnover will increase over the next 12 months.
EXPORT INDEX OVER THE PAST YEAR (2007 = 100)
Q1 13 Q2 13 Q3 13 Q4 13 Q1 14
114.84 118.12 116.32 112.69 117.03
The DHL/BCC Trade Confidence Index (TCI) is a measure of the UK’s exporting health. By analysing trends in trading activity and key factors of exporting firms’ performance, the TCI gives a truly comprehensive picture of theUK’s internationally-trading business community. The TCI is generated from two data sources: the BCC’s Quarterly Economic Survey (Confidence Indicator) and Chamber documentation services (Volume of Export Documentation).
CONFIDENCE INDICATOR
Q1 2014
Many types of exports require supporting and commercial documentation. Chambers of Commerce issue documentation required for exports outside the EU and have amassed a significant dataset around UK goods exports as a result. The TCI uses data collected from this process to show both an index of documentation and regional comparisons of exporting activity. (Further details can be found in the methodology on page 26).

5
Export index
• The volume of trade documents issued increased and is the second highest on record.
• The index number used to calculate the volume of trade documents issued by Chambers of Commerce across the UK now stands at 117.03 in Q1 2014.
Percentage Change (%)
Index number 2007=100
Recent quarter compared to last year
Recent quarter on previous quarter
Volume indexof
exportdocumentation
117.03 1.9% 3.9%
-15
-10
-5
0
5
10
15
20
25
30
35
Q1 2014 vs Q1 2013
Q1 2014 vs Q4 2013
N IrelandWalesN EastS WestE MidsW MidsEastY&HScotlandN WestS EastLondon
% c
hang
e
Regional comparison - export index
% change in documents issued by Chambers
National
There was a jump in the volume of trade documents issued on the quarter. The index now stands at 117.03 in Q1 2014. This represents an increase of 3.9% on Q4 2013, and an increase of 1.9% on the same quarter in 2013. The highest outturn on record for this series was 118.12 in Q2 2013.
Regions and Nations
There was a mixed picture across the regions and nations of the UK. The highest quarter-on-quarter increase was recorded in London (+10.31%). This was followed by the West Midlands (+6.67%) and the East Midlands (+6.12%). The biggest declines were in Northern Ireland (-10.11%) Scotland (-8.67%), and the North East (-1.80%).
Q1 2014
6
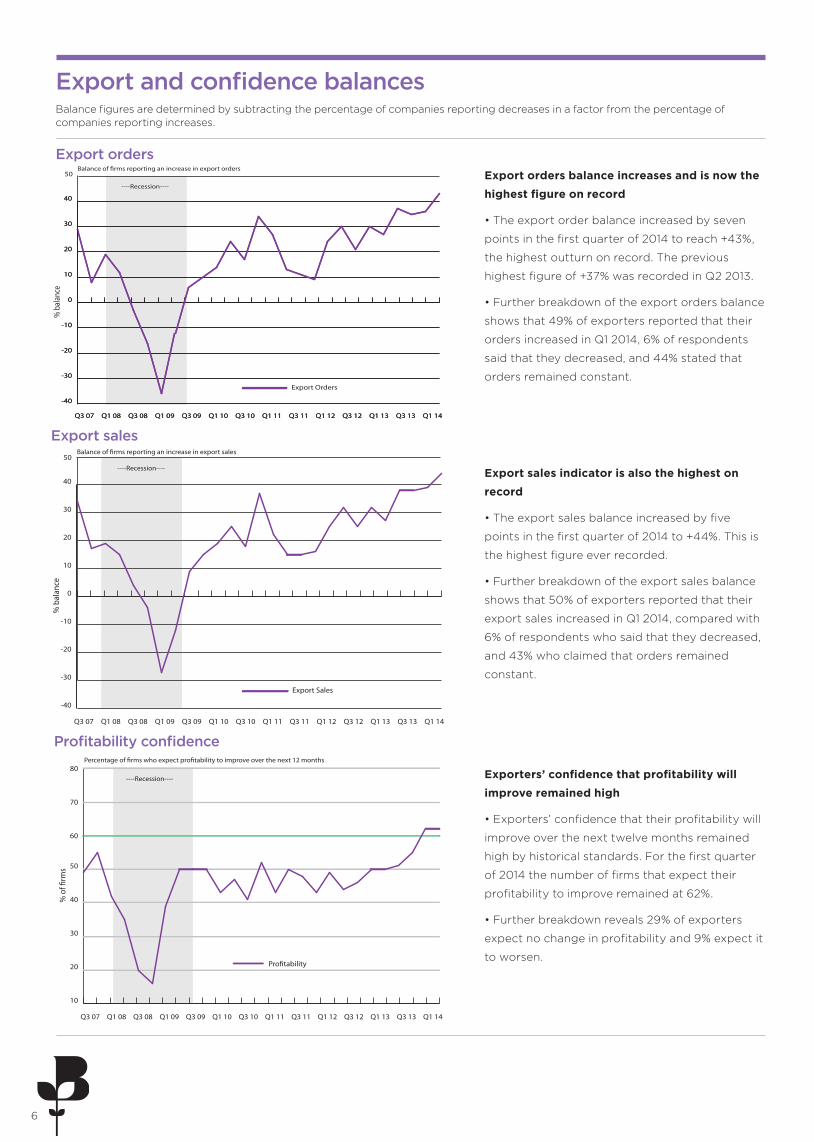
Export and confidence balances
Export orders balance increases and is now the
highest figure on record
• The export order balance increased by seven
points in the first quarter of 2014 to reach +43%,
the highest outturn on record. The previous
highest figure of +37% was recorded in Q2 2013.
• Further breakdown of the export orders balance
shows that 49% of exporters reported that their
orders increased in Q1 2014, 6% of respondents
said that they decreased, and 44% stated that
orders remained constant.
-40
-30
-20
-10
0
10
20
30
40
Q1 14Q3 13Q1 13Q3 12Q1 12Q3 11Q1 11Q3 10Q1 10Q3 09Q1 09Q3 08Q1 08Q3 07
-40
-30
-20
-10
0
10
20
30
40
Q1 14Q3 13Q1 13Q3 12Q1 12Q3 11Q1 11Q3 10Q1 10Q3 09Q1 09Q3 08Q1 08Q3 07
----Recession----
Balance of �rms reporting an increase in export orders
% b
alan
ce
Export Orders
50
Export orders
-40
-30
-20
-10
0
10
20
30
40
Q1 14Q3 13Q1 13Q3 12Q1 12Q3 11Q1 11Q3 10Q1 10Q3 09Q1 09Q3 08Q1 08Q3 07
50----Recession----
Balance of �rms reporting an increase in export sales
% b
alan
ce
Export Sales
Export sales
Export sales indicator is also the highest on
record
• The export sales balance increased by five
points in the first quarter of 2014 to +44%. This is
the highest figure ever recorded.
• Further breakdown of the export sales balance
shows that 50% of exporters reported that their
export sales increased in Q1 2014, compared with
6% of respondents who said that they decreased,
and 43% who claimed that orders remained
constant.
10
20
30
40
50
60
70
80
Q1 14Q3 13Q1 13Q3 12Q1 12Q3 11Q1 11Q3 10Q1 10Q3 09Q1 09Q3 08Q1 08Q3 07
----Recession----
Percentage of �rms who expect pro�tability to improve over the next 12 months
% o
f �rm
s
Pro�tability
Profitability confidence
Exporters’ confidence that profitability will
improve remained high
• Exporters’ confidence that their profitability will
improve over the next twelve months remained
high by historical standards. For the first quarter
of 2014 the number of firms that expect their
profitability to improve remained at 62%.
• Further breakdown reveals 29% of exporters
expect no change in profitability and 9% expect it
to worsen.
Balance figures are determined by subtracting the percentage of companies reporting decreases in a factor from the percentage of companies reporting increases.
7
EconomyGlobal The US economy grew at an annual rate of 2.6% in the final three months of 2013, an upward revision on the previous estimate of 2.4% but below the previous quarter of 4.1%. China, the world’s second-largest economy, grew by 7.4% in the first quarter of 2014 compared to the same period last year, the slowest rate of growth since Q3 2013. Eurozone GDP growth in Q4 2013 has been revised down to 0.2% from the previous estimate of 0.3%.
UK The UK economy grew by 0.8% in the first quarter of 2014, following growth of 0.7% in the final quarter of 2013. Due to downward revisions for previous quarters, UK economic growth for 2013 was revised down slightly to 1.7% from the previous estimate of 1.8%. However, this was still the fastest growth since 2010. The service sector and consumer spending remain the main drivers of UK economic growth.
TradeGlobal World trade declined by 0.9% in Q4 2013. Export growth was negative in Europe and Asia during the quarter, while North America’s export growth was positive, largely supported by US export growth of 2.3%.
UK The deficit in the UK’s trade balance (difference between what we export and import) narrowed to £5.7bn in Q4 2013, from £10bn in Q3 2013. The narrowing in the total trade deficit was due to a fall of £3bn in the trade in goods deficit and an increase of £1.4bn in the trade in services surplus. Imports of goods fell £3.4bn and exports of goods decreased by £0.4bn in Q4 2013.
However, the UK’s current account deficit (the gap between what the UK earns and spends) reached £22.4bn in Q4 2013, just below the all-time high of £22.8bn in Q3 2013. The deficit was driven largely by an increase in foreign investment earnings leaving the UK and a drop in income on British investments abroad
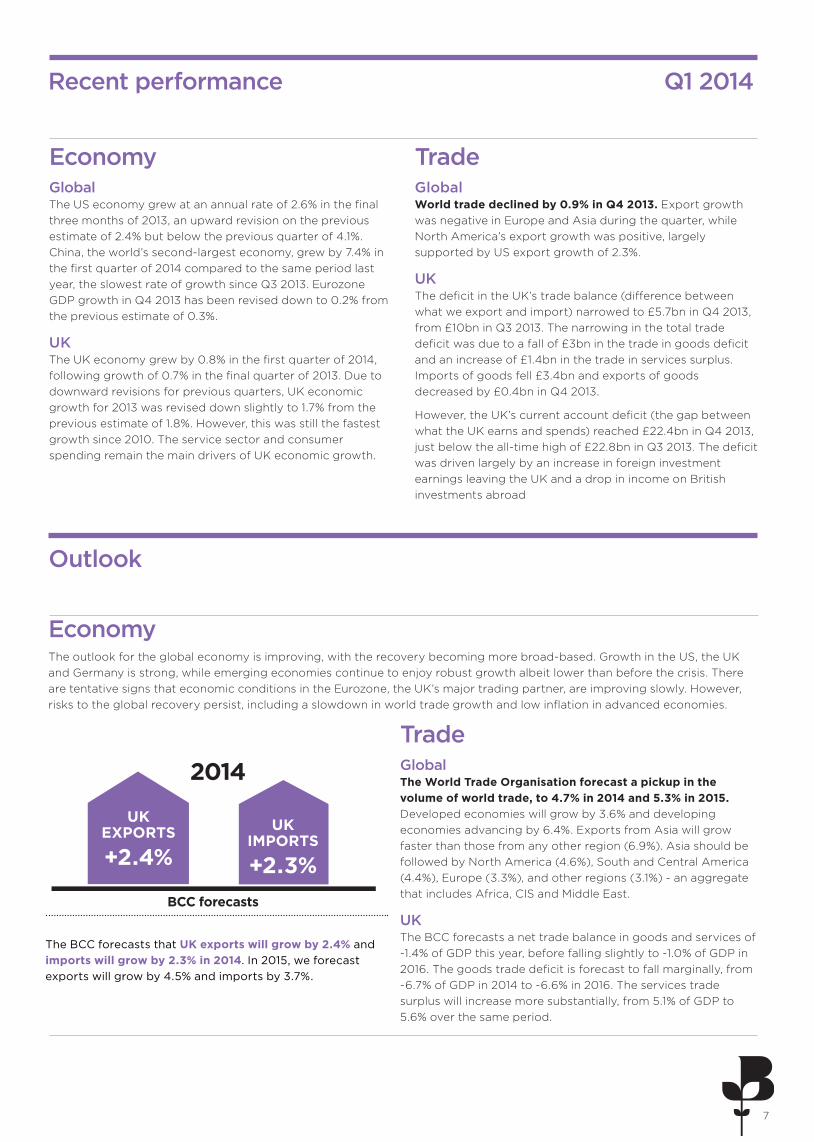
Recent performance
The BCC forecasts that UK exports will grow by 2.4% and imports will grow by 2.3% in 2014. In 2015, we forecast exports will grow by 4.5% and imports by 3.7%.
UK EXPORTS
+2.4%
BCC forecasts
Outlook
EconomyThe outlook for the global economy is improving, with the recovery becoming more broad-based. Growth in the US, the UK and Germany is strong, while emerging economies continue to enjoy robust growth albeit lower than before the crisis. There are tentative signs that economic conditions in the Eurozone, the UK’s major trading partner, are improving slowly. However, risks to the global recovery persist, including a slowdown in world trade growth and low inflation in advanced economies.
TradeGlobal The World Trade Organisation forecast a pickup in the volume of world trade, to 4.7% in 2014 and 5.3% in 2015. Developed economies will grow by 3.6% and developing economies advancing by 6.4%. Exports from Asia will grow faster than those from any other region (6.9%). Asia should be followed by North America (4.6%), South and Central America (4.4%), Europe (3.3%), and other regions (3.1%) - an aggregate that includes Africa, CIS and Middle East.
UK The BCC forecasts a net trade balance in goods and services of -1.4% of GDP this year, before falling slightly to -1.0% of GDP in 2016. The goods trade deficit is forecast to fall marginally, from -6.7% of GDP in 2014 to -6.6% in 2016. The services trade surplus will increase more substantially, from 5.1% of GDP to 5.6% over the same period.
Q1 2014
UK IMPORTS
+2.3%
2014
8
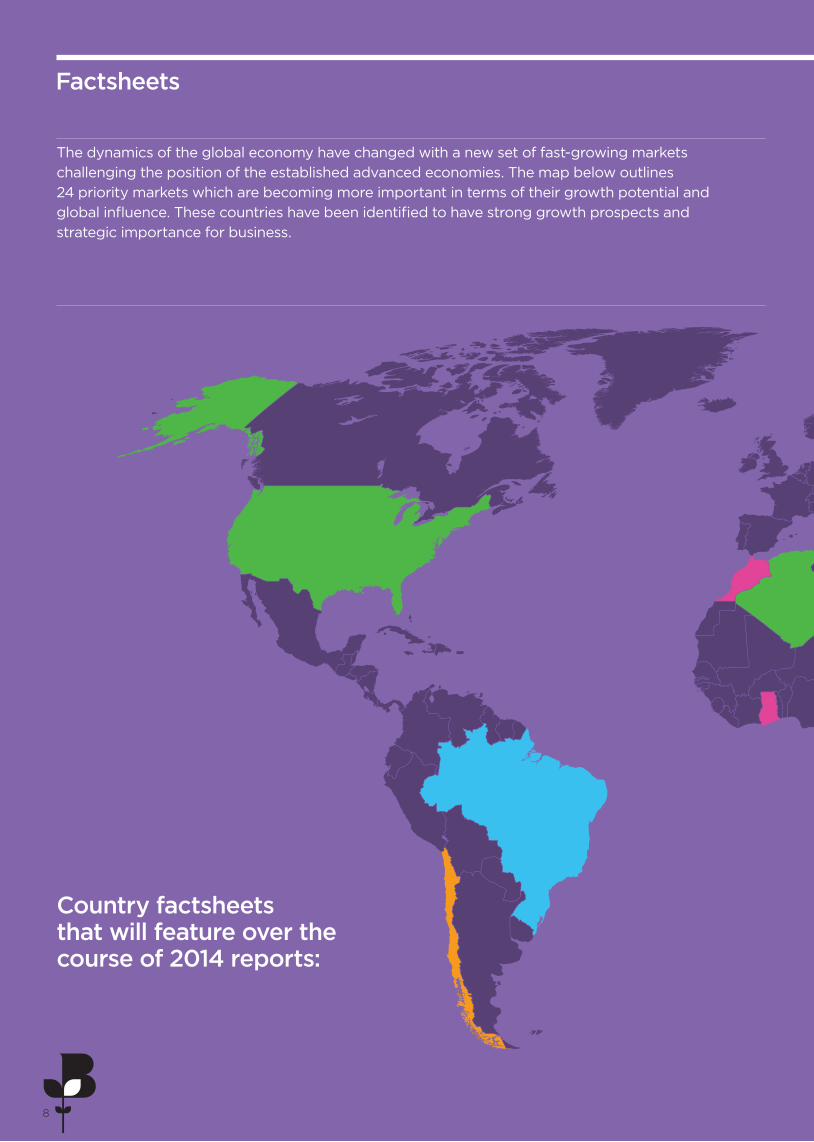
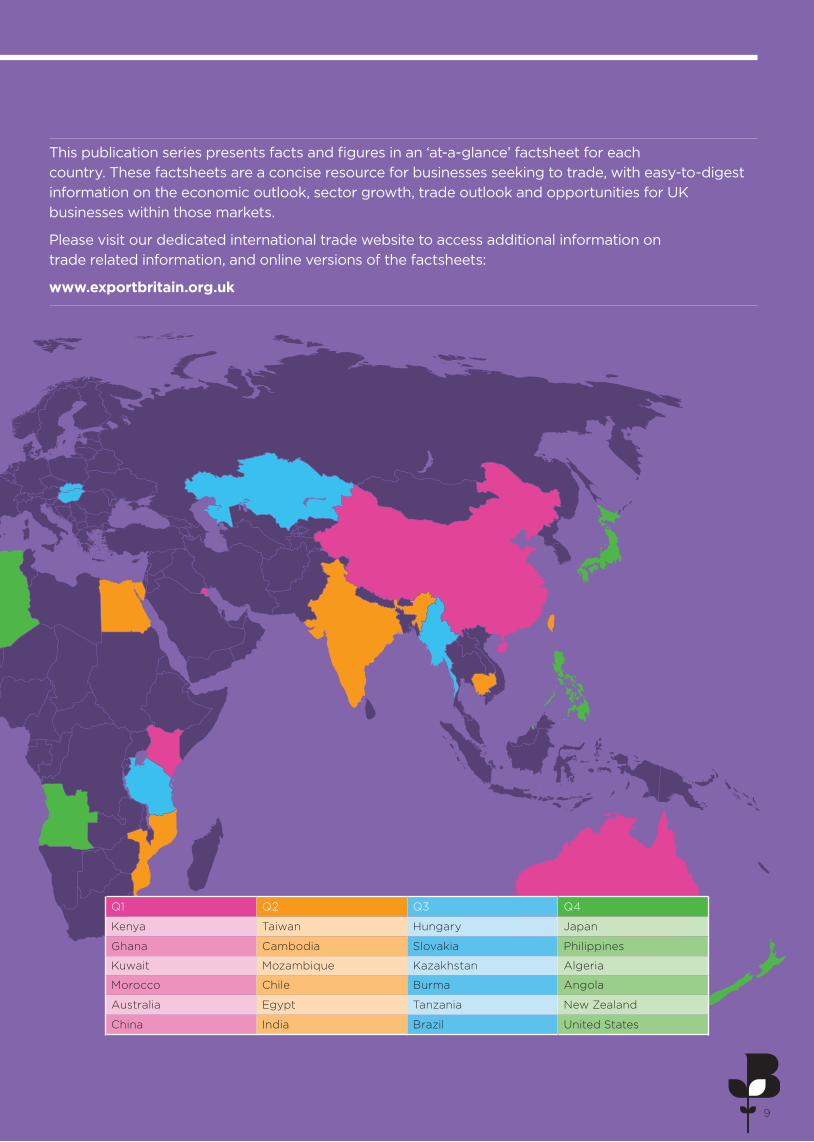
Country factsheets that will feature over the course of 2014 reports:
Factsheets
The dynamics of the global economy have changed with a new set of fast-growing markets challenging the position of the established advanced economies. The map below outlines 24 priority markets which are becoming more important in terms of their growth potential and global influence. These countries have been identified to have strong growth prospects and strategic importance for business.
8
9
Q1 Q2 Q3 Q4
Kenya Taiwan Hungary Japan
Ghana Cambodia Slovakia Philippines
Kuwait Mozambique Kazakhstan Algeria
Morocco Chile Burma Angola
Australia Egypt Tanzania New Zealand
China India Brazil United States
This publication series presents facts and figures in an ‘at-a-glance’ factsheet for each country. These factsheets are a concise resource for businesses seeking to trade, with easy-to-digest information on the economic outlook, sector growth, trade outlook and opportunities for UK businesses within those markets.
Please visit our dedicated international trade website to access additional information on trade related information, and online versions of the factsheets:
www.exportbritain.org.uk
9
10
Kenya is the biggest and most advanced economy in east and central Africa. It is east and central Africa’s hub for financial services. Agriculture has over the years been the backbone of Kenya’s economy. Economic prospects are positive largely because of expansions in tourism, telecommunications, transport, construction and a recovery in agriculture. Kenya has a well-developed social and physical infrastructure. It is considered the main alternative location to South Africa, for businesses seeking entry into the African continent.
Source: Oxford Economics
Economic snapshot (% annual growth rate)
Despite the impact of the very sluggish EU economy on Kenya’s exports and tourism, rising agricultural output and foreign direct investment inflows kept GDP growth at 4.6% in Q1-Q3 last year. Activity continues to be led by construction, electricity and water, financial services and manufacturing. Growth of 5.5% in 2014 is expected, as tourism recovers and agricultural output rises. And with investor interest in Africa rising and east African trade opportunities expanding, growth of around 6% in both 2015 and 2016 is expected.
Economic outlook
As a member of the integrated east African community, Kenya’s external performance will also depend on the growth rate of east African countries, especially Uganda and Tanzania with whom Kenya has significant trade ties. These blocs are a key components of Kenya’s trade volumes. Kenya’s imports include machinery, transport equipments and motor vehicles. India and the UAE are the largest import partners for Kenya. Other major import partner countries are China, Saudi Arabia, South Africa, Japan and the US.
Trade outlook
Kenya
StrengthsWell diversified economy, providing a strong base for weathering problems in any one industry.
WeaknessesInadequate infrastructure.
OpportunitiesStrategic position. Emerging middle class.
ThreatsAgricultural production highly dependent on weather conditions.
SWOT analysis
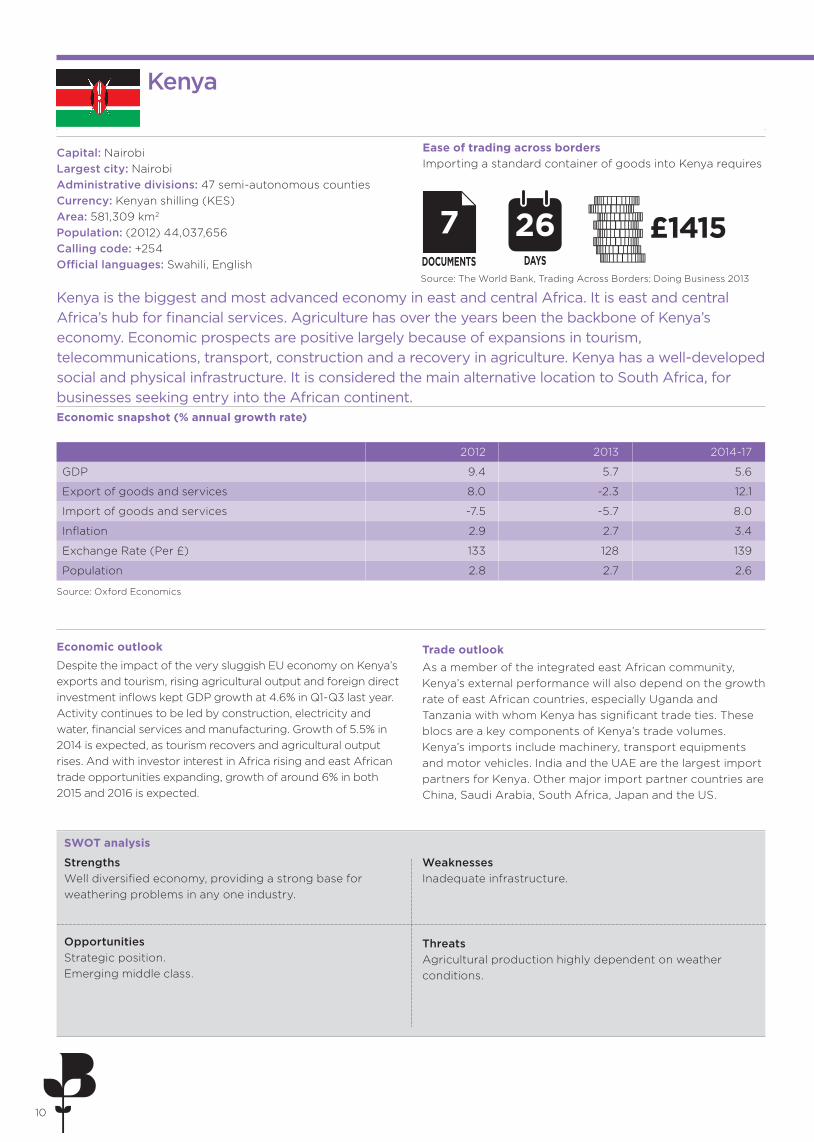
Capital: Nairobi Largest city: Nairobi Administrative divisions: 47 semi-autonomous counties Currency: Kenyan shilling (KES) Area: 581,309 km2 Population: (2012) 44,037,656 Calling code: +254 Official languages: Swahili, English
Ease of trading across borders Importing a standard container of goods into Kenya requires
Source: The World Bank, Trading Across Borders: Doing Business 2013
7DOCUMENTS
£1415DAYS
26
2012 2013 2014-17
GDP 9.4 5.7 5.6
Export of goods and services 8.0 -2.3 12.1
Import of goods and services -7.5 -5.7 8.0
Inflation 2.9 2.7 3.4
Exchange Rate (Per £) 133 128 139
Population 2.8 2.7 2.6
11
2011 2012 2013 2014 2015 2016 2017 2018 2019 2020
UK Asia North America Europe
0
10
20
30
40
50
60
70
80
% o
f to
tal i
mp
ort
s o
f K
enya
Opportunities for UK businesses Kenya has a central role in east Africa as the largest economy and a gateway into the region.Opportunities for UK businesses exist in largely in the services sector (tourism, banking, telecommunications, wholesale and retail trade, and business process outsourcing). Kenya envisages a massive upgrading and extension of the country’s infrastructure. In this regard, the country has highlighted a number of infrastructure projects that present significant opportunities for UK businesses in the coming years.
How Kenya’s imports from the UK compare Kenya’s trade with the UK UK exports to Kenya (2013) - by major product groups
Food, beverages & tobacco
Crude materials & fuel
Chemicals and related products
Manufactured goods
Machinery and transport equipment
Commodities
(Total value £379m)
Sectors to watch:
• Financial and business services • Industrial production • Manufacturing • Infrastructure
Sector segmentation growth
Agriculture, forestry & fisheries
Construction
Financial & business services
Industrial production, excluding construction
Information & communications
Manufacturing
Public services
Retails & wholesale distribution
Forecast for Africa’s economic structure (2021) - Output, value-added, real, % of GDP
4% 4%
61%
13%
16%
2%
26%
27%
5%
6%
4%
16%
14%
Source: Oxford EconomicsSource: Eurostat
Source: Oxford Economics
Source: The World Bank, Trading Across Borders: Doing Business 2013
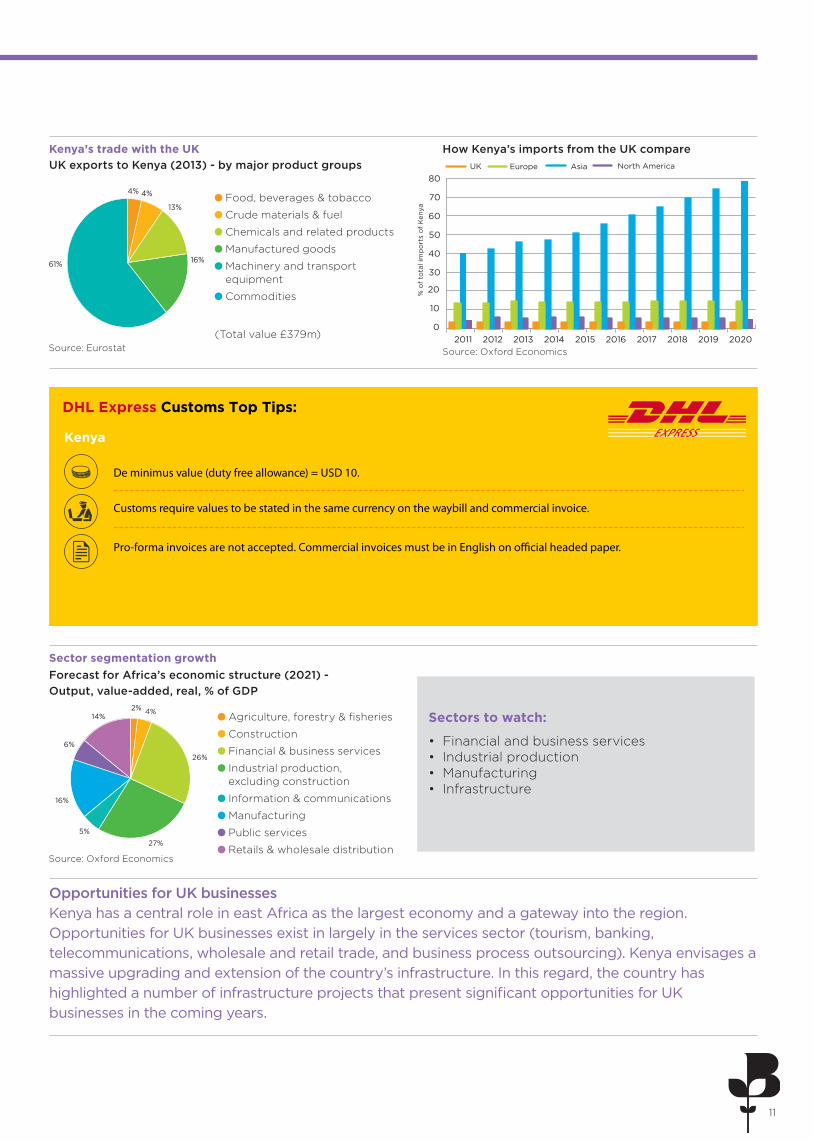
DHL Express Customs Top Tips:
Kenya
De minimus value (duty free allowance) = USD 10.
Customs require values to be stated in the same currency on the waybill and commercial invoice.
Pro-forma invoices are not accepted. Commercial invoices must be in English on o�cial headed paper.

12
Ghana
Capital: Accra Largest city: Kumasi Administrative divisions: 10 administrative regions Currency: Ghana cedi (GHS) Area: 238,535 km2 Population: (2012) 24,200,000 Calling code: +233 Official language: English
Ghana has one of largest economies on the African continent and one of the world’s fastest growing economies. It is a mixed economy and an emerging market with 7.9% GDP growth in 2012. An economic plan target known as the “Ghana Vision 2020” aims to see Ghana become the first country on the African continent to become a developed country from the years 2020 to 2029 followed by a newly industrialised country from the years 2030 to 2039.
Source: Oxford Economics
Economic outlook GDP is now estimated to have risen by 4.8% in 2013 overall, lower than previously expected. The main weakness was due to routine maintenance at the Jubilee oilfield, which saw mining output fall sharply. Although services are still growing strongly and oil output will bounce back, growth is now estimated at 6% this year, before a modest easing to some 5.5-6% per annum in 2015-16.
Trade outlook Ghana remains heavily dependent on international financial and technical assistance. Because of historical connections to Europe and geographical proximity, European exports have tended to be relatively more successful in Ghana. Other than the EU, the largest import partners for Ghana include, United Arab Emirates (16%), China (12%), India (5.2%), US (4.3%), and France (4.1%). Ghana largely exports to South Africa (20%), France (12%), Netherlands (6.9%), United Arab Emirates (6.7%), and US (6%).
Ease of trading across borders Importing a standard container of goods into Ghana requires
Source: The World Bank, Trading Across Borders: Doing Business 2013
7DOCUMENTS
£786DAYS
34
StrengthsGovernment has introduced trade policy reforms to promote growth and provide transparent regulatory practices to attract foreign investments.
WeaknessesBallooning fiscal deficit is at 14.5% of GDP. High inflation.
OpportunitiesInfrastructure development.
ThreatsOverdependence on gold output, vulnerable to fluctuations and plummeting prices of gold.
Economic snapshot (% annual growth rate)
SWOT analysis
2012 2013 2014-17
GDP 7.9 4.8 5.6
Export of goods and services 9.5 -4.1 10.9
Import of goods and services 15.7 -4.4 9.4
Inflation 9.2 11.7 8.8
Exchange Rate (Per £) 2.83 2.94 3.61
Population 2.3 2.3 2.2
13
2011 2012 2013 2014 2015 2016 2017 2018 2019 2020
UK Asia North America Rest of Europe
0
10
20
30
40
50
60
% o
f to
tal i
mp
ort
s o
f G
hana
Opportunities for UK businesses Ghana has a population of about 24.2 million people and is one of the most populous countries in West Africa, second only to Nigeria. Ghana has become increasingly attractive to foreign investors. UK businesses can seek opportunities in the services sector. The country requires management level education facilities (i.e., nursing, finance, etc) to meet the growing need in the country’s private sector. Other sectors of opportunity include, healthcare, information and communications technology services.
Food, beverages & tobacco
Crude materials & fuel
Chemicals and related products
Manufactured goods
Machinery and transport equipment
Commodities
(Total value £373m)
15%
17%
20%
38%
10%
2%
26%
27%
5%
6%
4%
16%
14%
UK exports to Ghana (2013) - by major product groupsHow Ghana’s imports from the UK compareGhana’s trade with the UK
Sectors to watch:
• Financial and business services • Industrial production • Manufacturing
Sector segmentation growthForecast for Africa’s economic structure (2021) - Output, value-added, real, % of GDP
Source: Oxford EconomicsSource: Eurostat
Source: Oxford Economics
Agriculture, forestry & fisheries
Construction
Financial & business services
Industrial production, excluding construction
Information & communications
Manufacturing
Public services
Retails & wholesale distribution
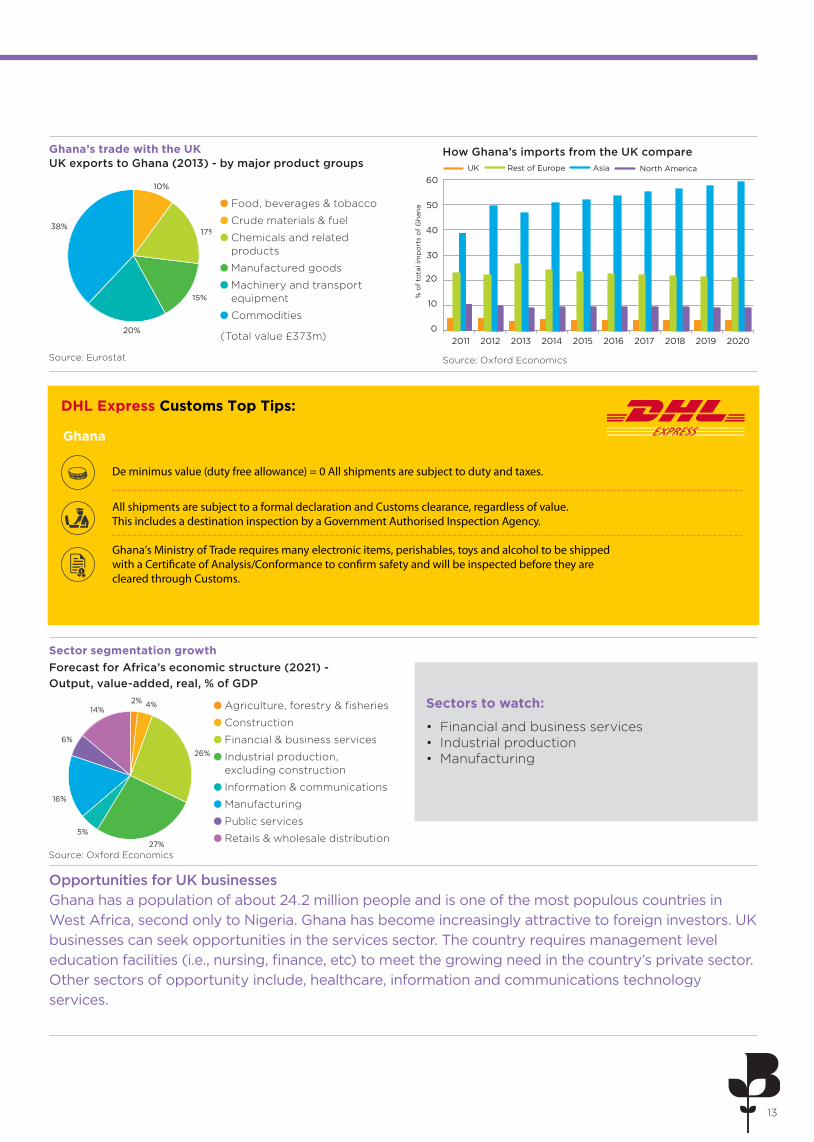
DHL Express Customs Top Tips:
Ghana
De minimus value (duty free allowance) = 0 All shipments are subject to duty and taxes.
All shipments are subject to a formal declaration and Customs clearance, regardless of value.This includes a destination inspection by a Government Authorised Inspection Agency.
Ghana’s Ministry of Trade requires many electronic items, perishables, toys and alcohol to be shipped with a Certificate of Analysis/Conformance to confirm safety and will be inspected before they are cleared through Customs.
14
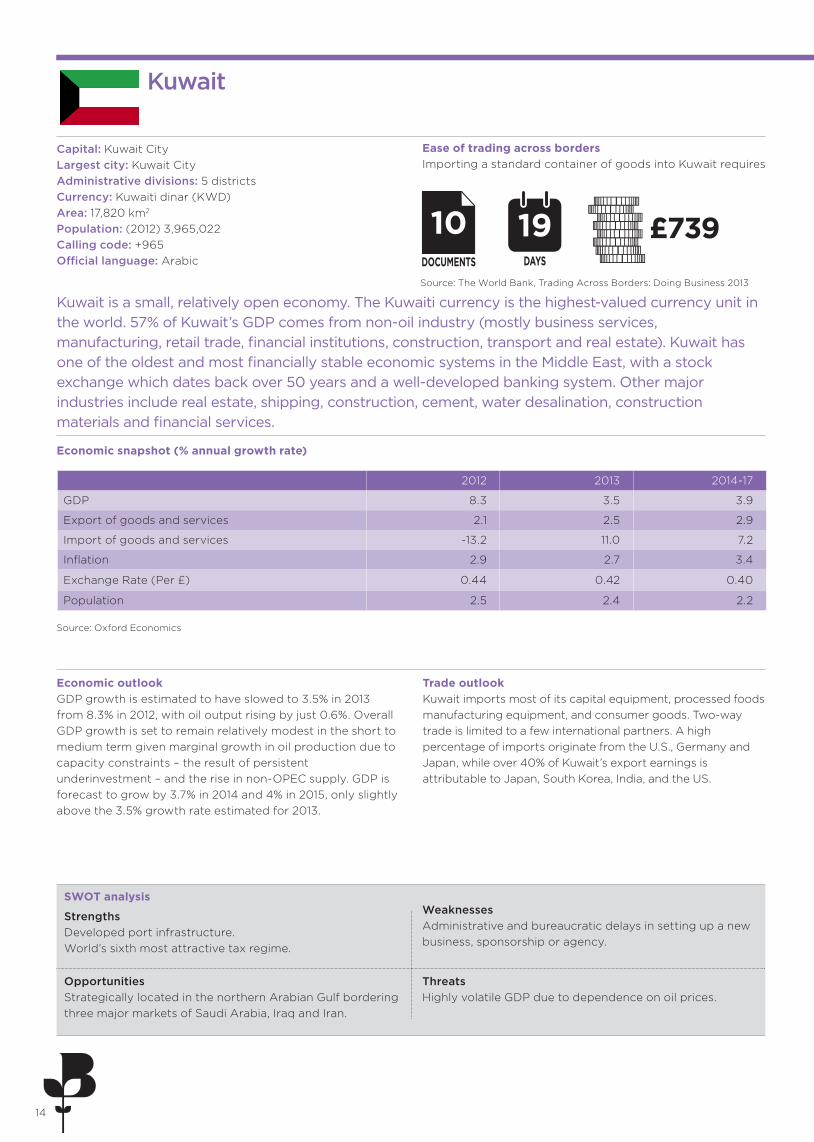
Kuwait
Capital: Kuwait City Largest city: Kuwait City Administrative divisions: 5 districts Currency: Kuwaiti dinar (KWD) Area: 17,820 km2 Population: (2012) 3,965,022 Calling code: +965 Official language: Arabic
Kuwait is a small, relatively open economy. The Kuwaiti currency is the highest-valued currency unit in the world. 57% of Kuwait’s GDP comes from non-oil industry (mostly business services, manufacturing, retail trade, financial institutions, construction, transport and real estate). Kuwait has one of the oldest and most financially stable economic systems in the Middle East, with a stock exchange which dates back over 50 years and a well-developed banking system. Other major industries include real estate, shipping, construction, cement, water desalination, construction materials and financial services.
Source: Oxford Economics
Economic snapshot (% annual growth rate)
Economic outlook GDP growth is estimated to have slowed to 3.5% in 2013 from 8.3% in 2012, with oil output rising by just 0.6%. Overall GDP growth is set to remain relatively modest in the short to medium term given marginal growth in oil production due to capacity constraints – the result of persistent underinvestment – and the rise in non-OPEC supply. GDP is forecast to grow by 3.7% in 2014 and 4% in 2015, only slightly above the 3.5% growth rate estimated for 2013.
Trade outlook Kuwait imports most of its capital equipment, processed foods manufacturing equipment, and consumer goods. Two-way trade is limited to a few international partners. A high percentage of imports originate from the U.S., Germany and Japan, while over 40% of Kuwait’s export earnings is attributable to Japan, South Korea, India, and the US.
Ease of trading across borders Importing a standard container of goods into Kuwait requires
Source: The World Bank, Trading Across Borders: Doing Business 2013
10DOCUMENTS
£739DAYS
19
StrengthsDeveloped port infrastructure. World’s sixth most attractive tax regime.
WeaknessesAdministrative and bureaucratic delays in setting up a new business, sponsorship or agency.
OpportunitiesStrategically located in the northern Arabian Gulf bordering three major markets of Saudi Arabia, Iraq and Iran.
ThreatsHighly volatile GDP due to dependence on oil prices.
SWOT analysis
2012 2013 2014-17
GDP 8.3 3.5 3.9
Export of goods and services 2.1 2.5 2.9
Import of goods and services -13.2 11.0 7.2
Inflation 2.9 2.7 3.4
Exchange Rate (Per £) 0.44 0.42 0.40
Population 2.5 2.4 2.2
15
2011 2012 2013 2014 2015 2016 2017 2018 2019 2020
UK Asia North America Rest of Europe
0
10
20
30
40
50
% o
f to
tal i
mp
ort
s o
f K
uwai
t
7%
23%
56%
14%
2%
52%
6%
6%
22%8%
4%
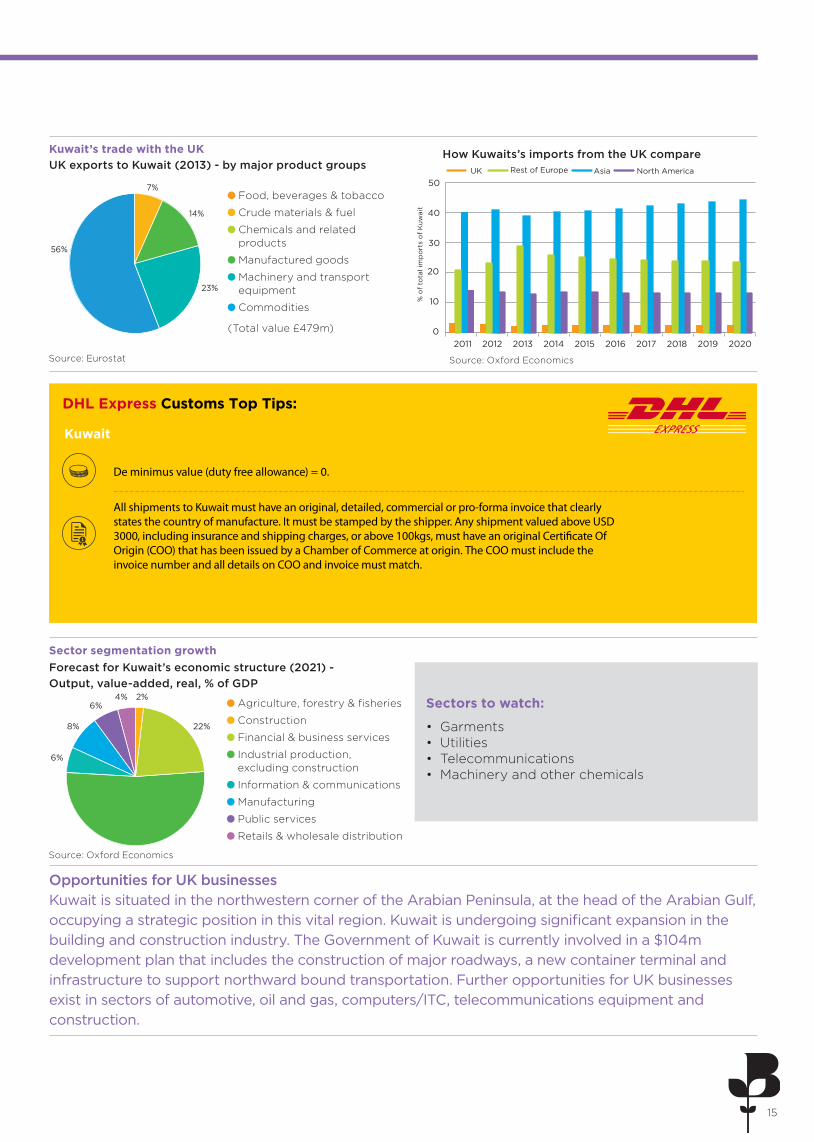
Opportunities for UK businesses Kuwait is situated in the northwestern corner of the Arabian Peninsula, at the head of the Arabian Gulf, occupying a strategic position in this vital region. Kuwait is undergoing significant expansion in the building and construction industry. The Government of Kuwait is currently involved in a $104m development plan that includes the construction of major roadways, a new container terminal and infrastructure to support northward bound transportation. Further opportunities for UK businesses exist in sectors of automotive, oil and gas, computers/ITC, telecommunications equipment and construction.
How Kuwaits’s imports from the UK compareKuwait’s trade with the UK UK exports to Kuwait (2013) - by major product groups
Sectors to watch:
• Garments • Utilities • Telecommunications • Machinery and other chemicals
Sector segmentation growthForecast for Kuwait’s economic structure (2021) - Output, value-added, real, % of GDP
Source: Oxford EconomicsSource: Eurostat
Source: Oxford Economics
Agriculture, forestry & fisheries
Construction
Financial & business services
Industrial production, excluding construction
Information & communications
Manufacturing
Public services
Retails & wholesale distribution
Food, beverages & tobacco
Crude materials & fuel
Chemicals and related products
Manufactured goods
Machinery and transport equipment
Commodities
(Total value £479m)
DHL Express Customs Top Tips:
Kuwait
De minimus value (duty free allowance) = 0.
All shipments to Kuwait must have an original, detailed, commercial or pro-forma invoice that clearly states the country of manufacture. It must be stamped by the shipper. Any shipment valued above USD 3000, including insurance and shipping charges, or above 100kgs, must have an original Certificate Of Origin (COO) that has been issued by a Chamber of Commerce at origin. The COO must include the invoice number and all details on COO and invoice must match.
16
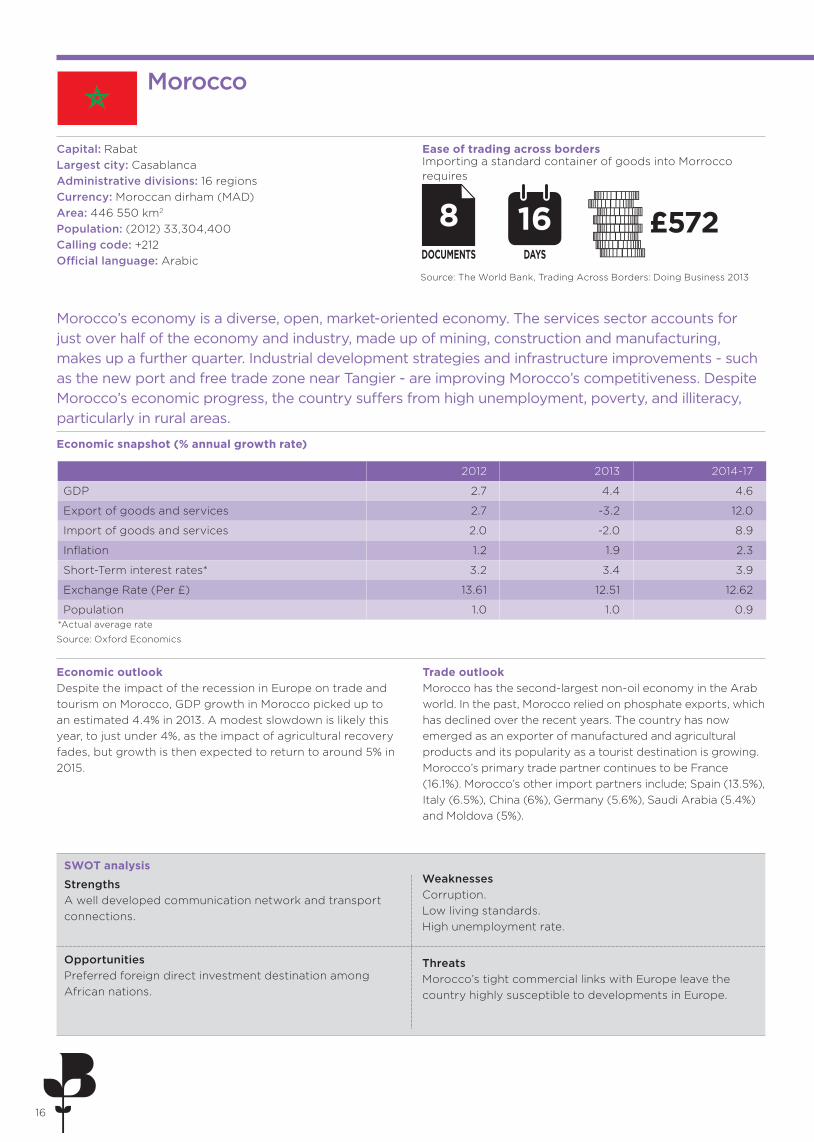
Morocco
Capital: Rabat Largest city: Casablanca Administrative divisions: 16 regions Currency: Moroccan dirham (MAD) Area: 446 550 km2 Population: (2012) 33,304,400 Calling code: +212 Official language: Arabic
Morocco’s economy is a diverse, open, market-oriented economy. The services sector accounts for just over half of the economy and industry, made up of mining, construction and manufacturing, makes up a further quarter. Industrial development strategies and infrastructure improvements - such as the new port and free trade zone near Tangier - are improving Morocco’s competitiveness. Despite Morocco’s economic progress, the country suffers from high unemployment, poverty, and illiteracy, particularly in rural areas.
Source: Oxford Economics
Economic snapshot (% annual growth rate)
Economic outlook Despite the impact of the recession in Europe on trade and tourism on Morocco, GDP growth in Morocco picked up to an estimated 4.4% in 2013. A modest slowdown is likely this year, to just under 4%, as the impact of agricultural recovery fades, but growth is then expected to return to around 5% in 2015.
Trade outlook Morocco has the second-largest non-oil economy in the Arab world. In the past, Morocco relied on phosphate exports, which has declined over the recent years. The country has now emerged as an exporter of manufactured and agricultural products and its popularity as a tourist destination is growing. Morocco’s primary trade partner continues to be France (16.1%). Morocco’s other import partners include; Spain (13.5%), Italy (6.5%), China (6%), Germany (5.6%), Saudi Arabia (5.4%) and Moldova (5%).
Importing a standard container of goods into Morrocco requires
Ease of trading across borders
Source: The World Bank, Trading Across Borders: Doing Business 2013
8DOCUMENTS
£572DAYS
16
StrengthsA well developed communication network and transport connections.
WeaknessesCorruption. Low living standards. High unemployment rate.
OpportunitiesPreferred foreign direct investment destination among African nations.
ThreatsMorocco’s tight commercial links with Europe leave the country highly susceptible to developments in Europe.
SWOT analysis
2012 2013 2014-17
GDP 2.7 4.4 4.6
Export of goods and services 2.7 -3.2 12.0
Import of goods and services 2.0 -2.0 8.9
Inflation 1.2 1.9 2.3
Short-Term interest rates* 3.2 3.4 3.9
Exchange Rate (Per £) 13.61 12.51 12.62
Population 1.0 1.0 0.9*Actual average rate
17
2011 2012 2013 2014 2015 2016 2017 2018 2019 2020
UK Asia North America Rest of Europe
0
10
20
30
40
50
60
% o
f to
tal i
mp
ort
s o
f M
oro
cco
Food, beverages & tobacco
Crude materials & fuel
Chemicals and related products
Manufactured goods
Machinery and transport equipment
Commodities
(Total value £598m)
Agriculture, forestry & fisheries
Construction
Financial & business services
Industrial production excl. construction
Information & communications
Manufacturing
Public services
Retail & wholesale distribution
41%
3%
7%
21%
1%
27%
2%
26%
27%
5%
6%
4%
16%
14%
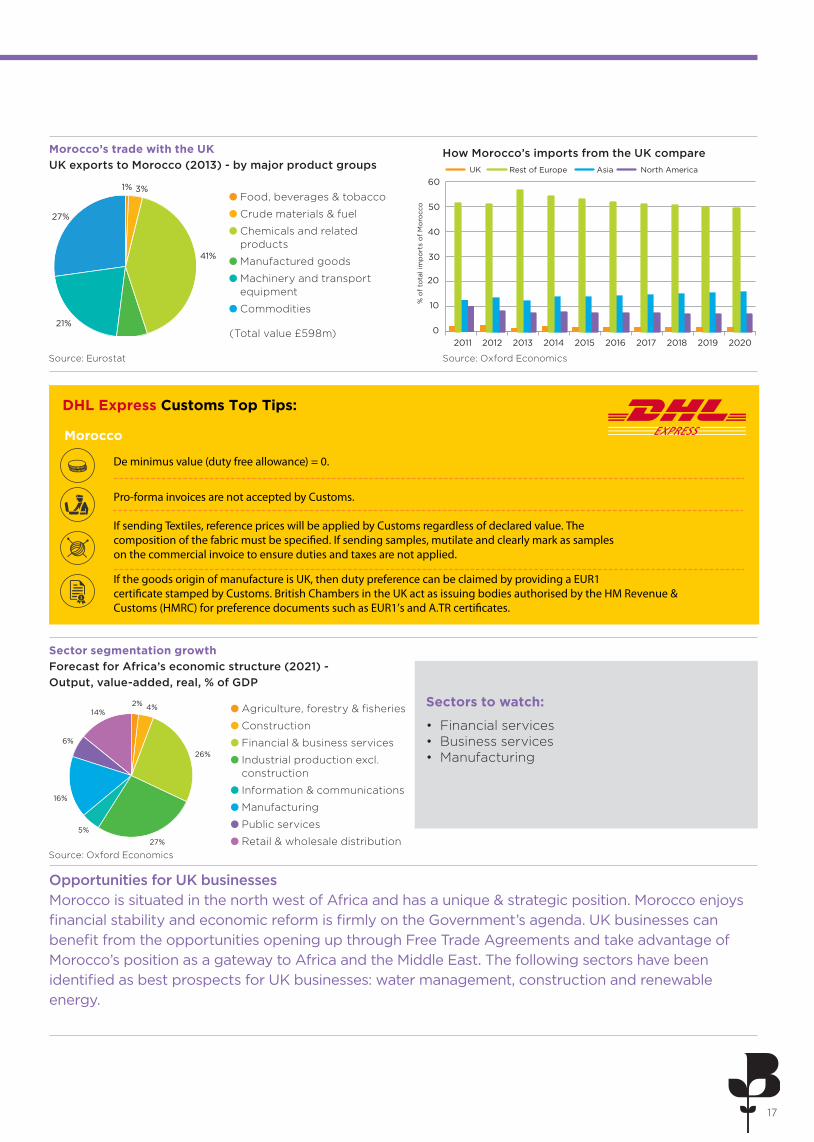
Opportunities for UK businesses Morocco is situated in the north west of Africa and has a unique & strategic position. Morocco enjoys financial stability and economic reform is firmly on the Government’s agenda. UK businesses can benefit from the opportunities opening up through Free Trade Agreements and take advantage of Morocco’s position as a gateway to Africa and the Middle East. The following sectors have been identified as best prospects for UK businesses: water management, construction and renewable energy.
How Morocco’s imports from the UK compareMorocco’s trade with the UK UK exports to Morocco (2013) - by major product groups
Sectors to watch:
• Financial services • Business services • Manufacturing
Sector segmentation growth Forecast for Africa’s economic structure (2021) - Output, value-added, real, % of GDP
Source: Oxford EconomicsSource: Eurostat
Source: Oxford Economics
DHL Express Customs Top Tips:
Morocco
De minimus value (duty free allowance) = 0.
Pro-forma invoices are not accepted by Customs. If sending Textiles, reference prices will be applied by Customs regardless of declared value. The composition of the fabric must be specified. If sending samples, mutilate and clearly mark as samples on the commercial invoice to ensure duties and taxes are not applied. If the goods origin of manufacture is UK, then duty preference can be claimed by providing a EUR1certificate stamped by Customs. British Chambers in the UK act as issuing bodies authorised by the HM Revenue & Customs (HMRC) for preference documents such as EUR1’s and A.TR certi�cates.
18
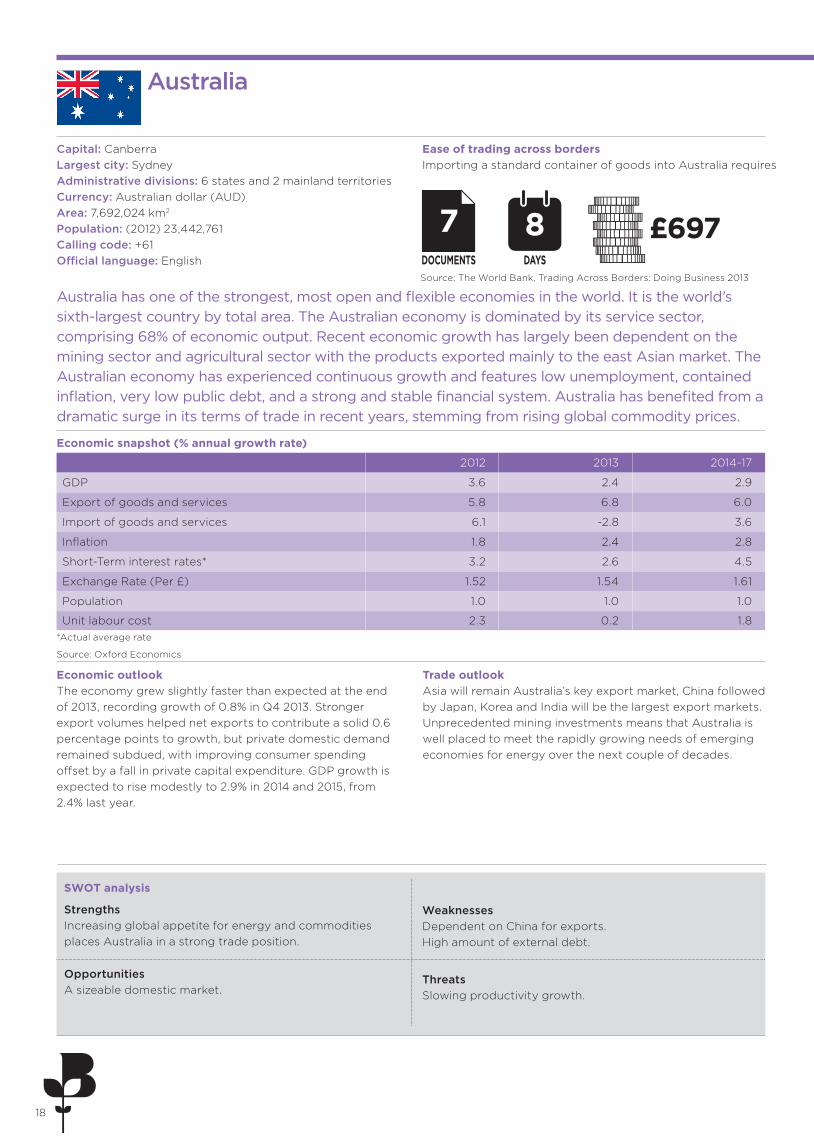
Australia
Capital: Canberra Largest city: Sydney Administrative divisions: 6 states and 2 mainland territories Currency: Australian dollar (AUD) Area: 7,692,024 km2 Population: (2012) 23,442,761 Calling code: +61 Official language: English
Australia has one of the strongest, most open and flexible economies in the world. It is the world’s sixth-largest country by total area. The Australian economy is dominated by its service sector, comprising 68% of economic output. Recent economic growth has largely been dependent on the mining sector and agricultural sector with the products exported mainly to the east Asian market. The Australian economy has experienced continuous growth and features low unemployment, contained inflation, very low public debt, and a strong and stable financial system. Australia has benefited from a dramatic surge in its terms of trade in recent years, stemming from rising global commodity prices.
Economic outlook The economy grew slightly faster than expected at the end of 2013, recording growth of 0.8% in Q4 2013. Stronger export volumes helped net exports to contribute a solid 0.6 percentage points to growth, but private domestic demand remained subdued, with improving consumer spending offset by a fall in private capital expenditure. GDP growth is expected to rise modestly to 2.9% in 2014 and 2015, from 2.4% last year.
Trade outlook Asia will remain Australia’s key export market, China followed by Japan, Korea and India will be the largest export markets. Unprecedented mining investments means that Australia is well placed to meet the rapidly growing needs of emerging economies for energy over the next couple of decades.
Ease of trading across borders Importing a standard container of goods into Australia requires
7DOCUMENTS
£697DAYS
8
StrengthsIncreasing global appetite for energy and commodities places Australia in a strong trade position.
WeaknessesDependent on China for exports. High amount of external debt.
OpportunitiesA sizeable domestic market.
ThreatsSlowing productivity growth.
Source: The World Bank, Trading Across Borders: Doing Business 2013
Economic snapshot (% annual growth rate)
*Actual average rate
Source: Oxford Economics
SWOT analysis
2012 2013 2014-17
GDP 3.6 2.4 2.9
Export of goods and services 5.8 6.8 6.0
Import of goods and services 6.1 -2.8 3.6
Inflation 1.8 2.4 2.8
Short-Term interest rates* 3.2 2.6 4.5
Exchange Rate (Per £) 1.52 1.54 1.61
Population 1.0 1.0 1.0
Unit labour cost 2.3 0.2 1.8

19
2011 2012 2013 2014 2015 2016 2017 2018 2019 2020
UK Asia North AmericaRest of Europe
0
10
20
30
40
50
60
% o
f to
tal i
mp
ort
s o
f A
ustr
alia
Food, beverages & tobacco
Crude materials & fuel
Chemicals and related products
Manufactured goods
Machinery and transport equipment
Commodities
(Total value £3.5bn)
Sectors to watch:
• Food • Utilities • Non-ferrous metals • Ceramics • Clay & refractory products
8%1%
43%
26%
1%
21%
29%
3%
9%
32%
9%
6%
9% 3%
Opportunities for UK businesses Australia is one of the largest economies in the Asia Pacific region after Japan, China and Korea. The combination of a highly-qualified work force, extensive infrastructure and natural resources are the reasons why many businesses, both small and large, are exploring Australia. The system of law in Australia is historically dependent for its legal validity on British statutes, notably including the Commonwealth of Australia Constitution Act 1900. Australia offers UK businesses many opportunities, especially in the following sectors: agribusiness and food, major infrastructure, resources and energy, advanced manufacturing, services and technology.
How Australia’s imports from the UK compare Australia’s trade with the UKUK exports to Australia (2013) - by major product groups
Sector segmentation growthForecast for Australia’s economic structure (2021) - Output, value-added, real, % of GDP
Source: Eurostat Source: Oxford Economics
Source: Oxford Economics
Agriculture, forestry & fisheries
Construction
Financial & business services
Industrial production excl. construction
Information & communications
Manufacturing
Public services
Retail & wholesale distribution
DHL Express Customs Top Tips:
Australia
De minimus value (duty free allowance) = AUD 1000.
New clothing and other textiles should be clearly marked ‘NEW’ on the waybill and invoice. This will help prevent Customs delays, as used textiles are subject to quarantine and fumigation requirements. The shipping charge should be quoted on the invoice in addition to the customs value, otherwise a standard local customs freight charge is applied by AU customs for Goods & Service Tax calculations.
20
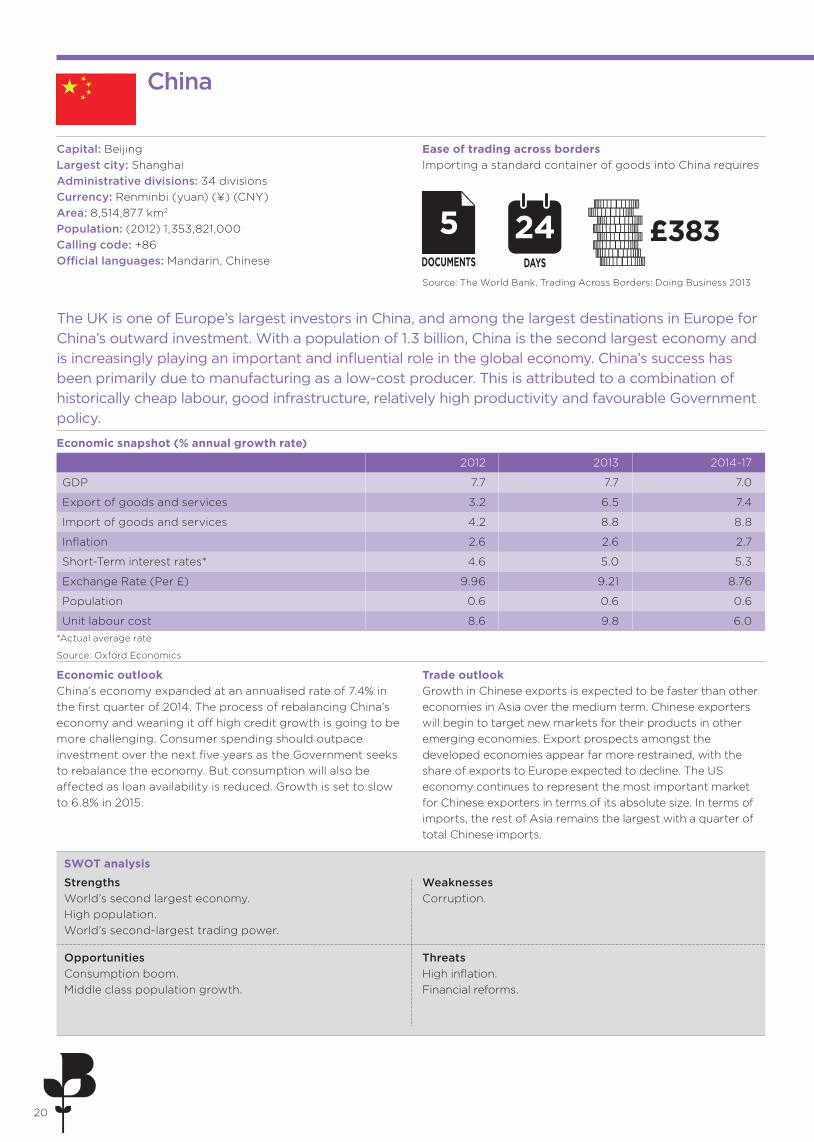
China
Capital: Beijing Largest city: Shanghai Administrative divisions: 34 divisions Currency: Renminbi (yuan) (¥) (CNY) Area: 8,514,877 km2
Population: (2012) 1,353,821,000 Calling code: +86 Official languages: Mandarin, Chinese
The UK is one of Europe’s largest investors in China, and among the largest destinations in Europe for China’s outward investment. With a population of 1.3 billion, China is the second largest economy and is increasingly playing an important and influential role in the global economy. China’s success has been primarily due to manufacturing as a low-cost producer. This is attributed to a combination of historically cheap labour, good infrastructure, relatively high productivity and favourable Government policy.
*Actual average rate
Source: Oxford Economics
Economic snapshot (% annual growth rate)
Economic outlook China’s economy expanded at an annualised rate of 7.4% in the first quarter of 2014. The process of rebalancing China’s economy and weaning it off high credit growth is going to be more challenging. Consumer spending should outpace investment over the next five years as the Government seeks to rebalance the economy. But consumption will also be affected as loan availability is reduced. Growth is set to slow to 6.8% in 2015.
Trade outlook Growth in Chinese exports is expected to be faster than other economies in Asia over the medium term. Chinese exporters will begin to target new markets for their products in other emerging economies. Export prospects amongst the developed economies appear far more restrained, with the share of exports to Europe expected to decline. The US economy continues to represent the most important market for Chinese exporters in terms of its absolute size. In terms of imports, the rest of Asia remains the largest with a quarter of total Chinese imports.
Ease of trading across borders Importing a standard container of goods into China requires
Source: The World Bank, Trading Across Borders: Doing Business 2013
5DOCUMENTS
£383DAYS
24
StrengthsWorld’s second largest economy. High population. World’s second-largest trading power.
WeaknessesCorruption.
OpportunitiesConsumption boom. Middle class population growth.
ThreatsHigh inflation. Financial reforms.
SWOT analysis
2012 2013 2014-17
GDP 7.7 7.7 7.0
Export of goods and services 3.2 6.5 7.4
Import of goods and services 4.2 8.8 8.8
Inflation 2.6 2.6 2.7
Short-Term interest rates* 4.6 5.0 5.3
Exchange Rate (Per £) 9.96 9.21 8.76
Population 0.6 0.6 0.6
Unit labour cost 8.6 9.8 6.0

21
2011 2012 2013 2014 2015 2016 2017 2018 2019 2020
UK Rest of Asia North America Rest of Europe
0
5
10
15
20
25
30
35
40
% o
f to
tal i
mp
ort
s o
f C
hina
Food, beverages & tobacco
Crude materials & fuel
Chemicals and related products
Manufactured goods
Machinery and transport equipment
Commodities
(Total value £10.75bn)
2%
13%
1%
11%
12%
61%
37%
5%
10%
2%
27%
4%
5%10%
Opportunities for UK businesses China will remain an important and viable market for a wide range of products and services. As a result, China offers huge opportunities for UK businesses, particularly in sectors such as food and drink, renewable energy and financial services. The opportunities are not just in the well-known Chinese business centres of Beijing, Shanghai, Guangzhou and Shenzhen, but also in numerous emerging regional centres such as Chengdu, Sichuan, Chongqing, Dalian, Liaoning and Hangzhou.
How China’s imports from the UK compare China’s trade with the UK UK exports to China (2013) - by major product groups
Sectors to watch:
• Iron & steel • Utilities • Electronic components • Machinery
Sector segmentation growthForecast for China’s economic structure (2021) - Output, value-added, real, % of GDP
Source: Oxford EconomicsSource: Eurostat
Source: Oxford Economics
Agriculture, forestry & fisheries
Construction
Financial & business services
Industrial production excl. construction
Information & communications
Manufacturing
Public services
Retail & wholesale distribution
DHL Express Customs Top Tips:
China
De minimus value (duty free allowance) = CNY 50 - If calculated duty/tax is under 50 CNY then the shipment is classed as duty free.
China only allows commercial shipments to be sent to a business, and the receiver name, postcode and phone number must be provided. All shippers/receivers must be registered with Chinese Customs and are given a Customs Registration (CR) number. Ensure your customer’s CR number is stated on your pro-forma/commercial invoice and on any applicable Customs declarations to avoid delays. Shipments under 794 USD can clear as informal as long as the paperwork provides a detailed description.
22
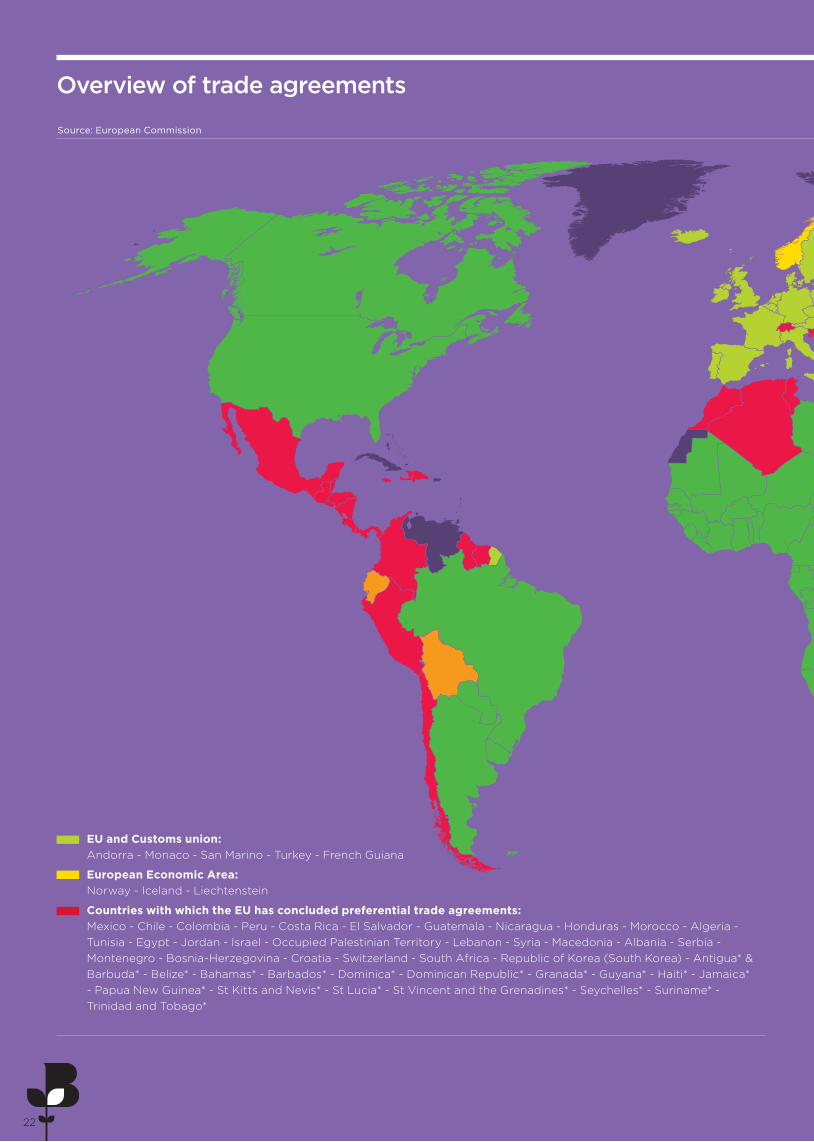
Overview of trade agreements
EU and Customs union: Andorra - Monaco - San Marino - Turkey - French Guiana
European Economic Area: Norway - Iceland - Liechtenstein
Countries with which the EU has concluded preferential trade agreements: Mexico - Chile - Colombia - Peru - Costa Rica - El Salvador - Guatemala - Nicaragua - Honduras - Morocco - Algeria - Tunisia - Egypt - Jordan - Israel - Occupied Palestinian Territory - Lebanon - Syria - Macedonia - Albania - Serbia - Montenegro - Bosnia-Herzegovina - Croatia - Switzerland - South Africa - Republic of Korea (South Korea) - Antigua* & Barbuda* - Belize* - Bahamas* - Barbados* - Dominica* - Dominican Republic* - Granada* - Guyana* - Haiti* - Jamaica* - Papua New Guinea* - St Kitts and Nevis* - St Lucia* - St Vincent and the Grenadines* - Seychelles* - Suriname* - Trinidad and Tobago*
22
Source: European Commission

23
Countries with which the EU is currently negotiating preferential trade agreements: Canada - India - Singapore - Malaysia - Ukraine - Brazil - Argentina - Uruguay - Paraguay - Saudi Arabia - Botswana* - Cameroon* - Côte d’Ivoire* - Kuwait - Qatar - United Arab Emirates - Fiji* - Oman - Bahrain - Libya - Cook Islands* - Kiribati - Lesotho* - Swaziland* - Madagascar* - Mauritius* - Mozambique* - Marshall Islands* - Micronesia* - Nauru* - Samoa* - Solomon Islands* - Timor Leste* - Tonga* - Tuvalu* - Vanuatu* - Angola* - Namibia* - Comoros* - Djibouti* - Eritrea* - Ethiopia* - Malawi* - Sudan* - Zambia* - Burundi* - Kenya* - Rwanda* - Uganda* - Tanzania* - Central African Republic* - Chad* - Congo* - Democratic Republic of Congo* - Equatorial Guinea* - Gabon* - Sao Tome and Principe* - Benin* - Burkina Faso* - Cape Verde* - Gambia* - Ghana* - Guinea* - Guinea-Bissau* - Liberia* - Mali* - Mauritania* - Niger* - Nigeria* - Senegal* - Sierra Leone* - Togo* - Zambia* - Zimbabwe* - Vietnam - Moldova - Armenia - Georgia - United States of America - Japan
Countries with which the EU is considering opening preferential negotiations: Azerbaijan - Brunei - Indonesia - Philippines - Thailand - Ecuador - Bolivia
*Economic partnership agreements
23

Case study: ‘Our export journey’
Accredited Chambers of Commerce are Britain’s export hubs. Chambers of Commerce are the premier source of private sector, business-to-business support for international trade and export. In addition to in-house support, Chambers also partner with government agencies such as UKTI, to ensure companies get the best possible advice and help. And it’s working. Amongst Chamber members, 22% were exporting in 2011 - compared to over 35% today.
24
This section brings together the experiences of businesses who have embarked on their export journey. It gives a snapshot of some of the challenges they faced when trying to expand their business’s share of exports or enter new markets.
Founded in 1894, Smiffy’s has become a global organisation with offices and showrooms worldwide. As the leading fancy dress, Halloween and carnival manufacturing company in the UK, Smiffy’s distribute nearly 5,000 products to over 5,000 stockists around the world with over 26 million items shipped every year.
Trading internationallyFUN is the name of the game for staff at Smiffy’s, where they are knee-deep in crazy colourful costumes, wild wigs and amazing accessories and pack and despatch more than 75,000 products every day of the year.
But this Gainsborough company is deadly serious about exporting. Overseas sales to 42 countries make up almost £18m of its £50m turnover. Head of International Development Julian Smith said: ‘Exporting is a massive growth area. Over the past four years, overseas sales have risen from around 10 to 35 per cent of turnover. This will continue to increase as we expand our international horizons.’
Two factors are at play. Smiffy’s has great products and is absolutely dedicated to the development of innovative ranges, backed by trusted quality and service. The company has also entered completely new markets, experiencing a huge surge in demand - particulary from Europe, thanks to
Member of Lincolnshire Chamber of Commerce
changing social trends.
Exporting tipBe visible and develop local strategies: The company has agency and distribution partners across the globe – from The Netherlands to Italy, Australia, Canada and America - but has taken a strategic step and put directly-employed staff into overseas territories. “It’s like having an extension of our management team. It makes Smiffy’s more visible, allows us to develop localised strategies to meet individual market needs and ensures we can more efficiently follow-up sales” said Julian.
Smiffy’s is determined to maximise opportunities, but as it expands into more challenging markets, the business faces increasingly tough decisions as directors weigh-up the benefits of speculative development against consolidation and focus on existing core territories.
To find out how your local Accredited Chamber can help you on your export journey, visit www.exportbritain.org.uk or join the conversation on Twitter: get #wellconnected and #joinyourchamber.
Smiffy’s
25
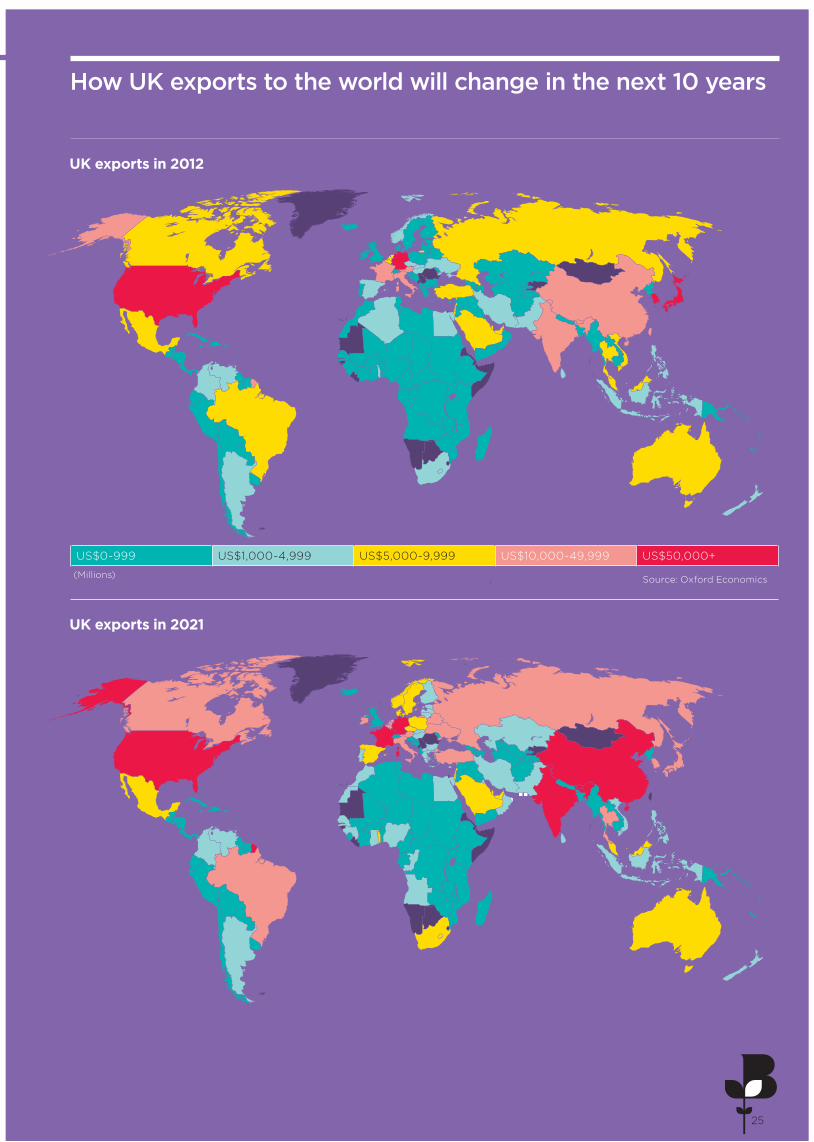
US$0-999 US$1,000-4,999 US$5,000-9,999 US$10,000-49,999 US$50,000+
How UK exports to the world will change in the next 10 years
UK exports in 2021
UK exports in 2012
Source: Oxford Economics(Millions)
26
TCI Methodology
The TCI generates its results from two data sources:
• Questionnaire responses submitted by over 2,000 exporters, derived from the BCC’s Quarterly Economic Survey (QES). The QES is the largest and most representative private sector business survey of its kind.
• Data generated from exporting activity that requires supporting documentation.
Quarterly Economic Survey (QES)
Fieldwork for the survey was conducted between 24 Febuary to 19 March 2014.
Results are split into the following firm size categories:
0-9 employees (micro firms)
10-49 employees (small firms)
50-249 employees (medium firms)
50+ employees (large firms)
Unless otherwise stated, results refer to all exporters responding to the survey. Where results are split between the service and manufacturing sectors, this is stated clearly in the text. Results that are not split by firm size are weighted by the contribution of firm size to total exporting turnover.
Results are represented by either a balance figure or a pure percentage figure. Balance figures are determined by subtracting the percentage of companies reporting decreases in a factor from the percentage of companies reporting increases. Where a balance figure is positive it represents growth; where it is negative, it represents contraction.
Export documentation data
Many types of exports require supporting and commercial documentation to ensure the timely delivery of goods and timely payment. Accredited British Chambers of Commerce administer documentation required for exports outside the EU and have amassed a significant dataset around UK goods exports as a result. The TCI uses data collected from this process to show both an index of documentation and regional comparisons of exporting activity.
Oxford Economics
The Quarterly International Trade Outlook also draws upon the modelling expertise of Oxford Economics, who have provided all the economic and trade forecasts presented in this publication.
Oxford Economics was founded in 1981 to provide independent forecasting and analysis tailored to the needs of economists and planners in government and business. It is now one of the world’s leading providers of economic analysis, advice and models, with over 300 clients including international organisations, government departments and central banks around the world, and a large number of multinational blue-chip companies across the whole industrial spectrum.


BRITISH CHAMBERS OF COMMERCE65 PETTY FRANCELONDON SW1H 9EUUNITED KINGDOM
T +44 (0)20 7654 5800E [email protected]
www.britishchambers.org.uk