


Q1 2013 RESULTS - bicworld.com Guevara 2. Q1 2013 results Group ... BIC APP sales negatively...
35
-
Upload
duongnguyet -
Category
Documents
-
view
216 -
download
2
Transcript of Q1 2013 RESULTS - bicworld.com Guevara 2. Q1 2013 results Group ... BIC APP sales negatively...

Q1 2013 results
Group and category highlights
Mario Guevara
2

Q1 2013 results
Group Q1 2013 key figures
3
* See glossary
Developed markets +2.0%
Developing markets +1.5%
Consumer business(88% of total sales) +1.8%
Advertising & Promotional Products
(12% of total sales)‐11.2%
Consumer business 18.5%
Advertising & Promotional Products ‐5.4%
Q1 13Q1 12
Net Sales: 428.6 million euros
‐3.7%
‐0.7%
+0.0%
As reported At constantcurrencies*
On a comparativebasis*
18.2%15.2%
IFO Margin
18.0%15.6%
Normalized IFO Margin
Normalized IFO
Normalized* Income from Operations: 66.7 million euros
Q1 2013 results
Group Q1 2013 Key figures
4
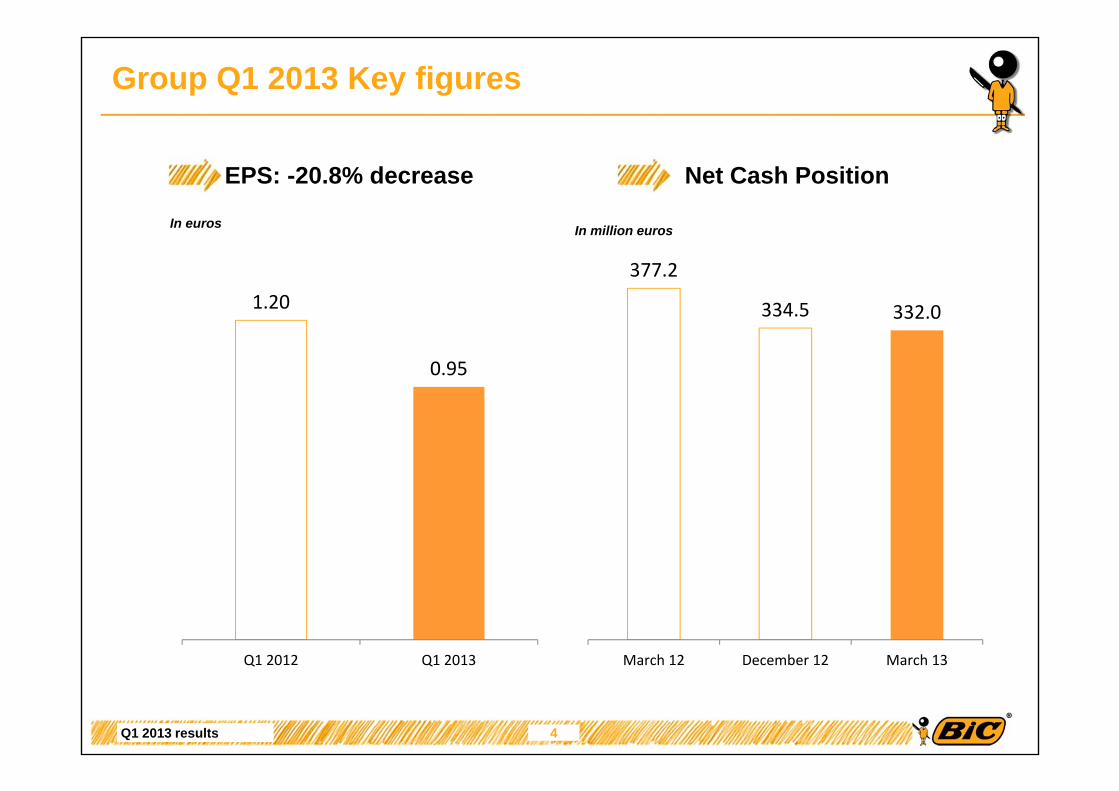
In euros In million euros
377.2
334.5 332.0
March 12 December 12 March 13
1.20
0.95
Q1 2012 Q1 2013
EPS: -20.8% decrease Net Cash Position
Q1 2013 results
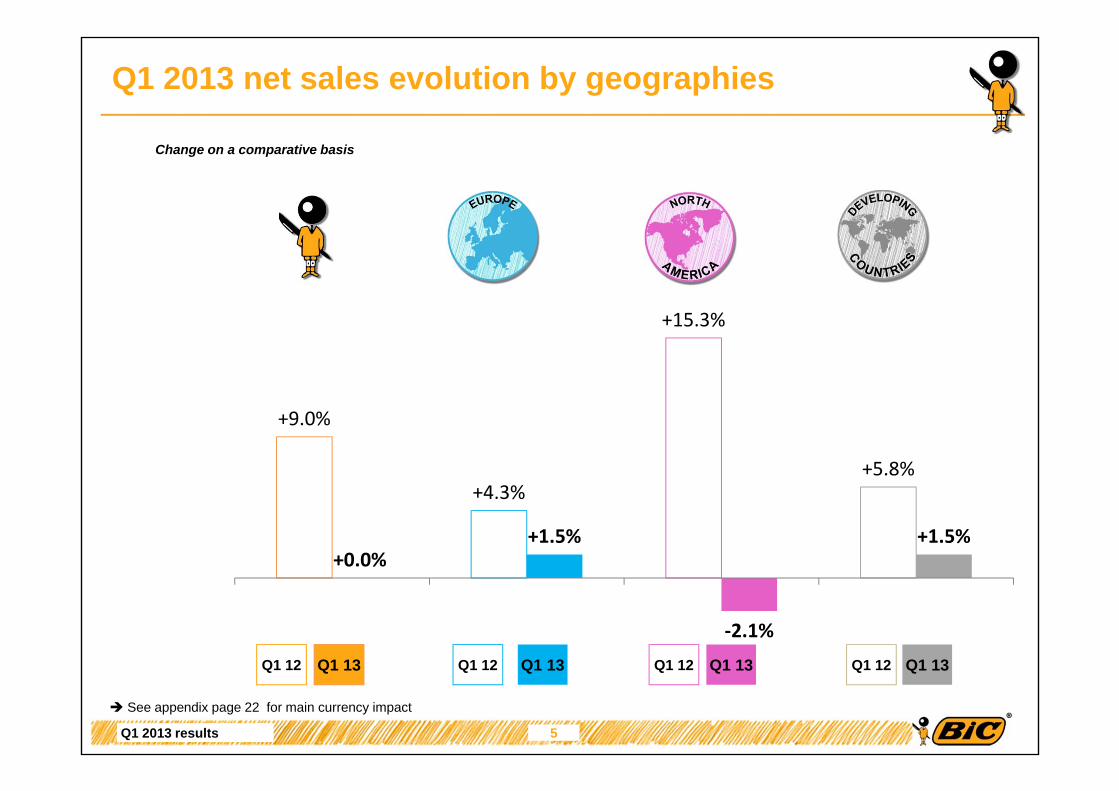
Q1 2013 net sales evolution by geographies
5
+9.0%
+4.3%
+15.3%
+5.8%
+0.0%+1.5%
‐2.1%
+1.5%
Change on a comparative basis
Q1 12
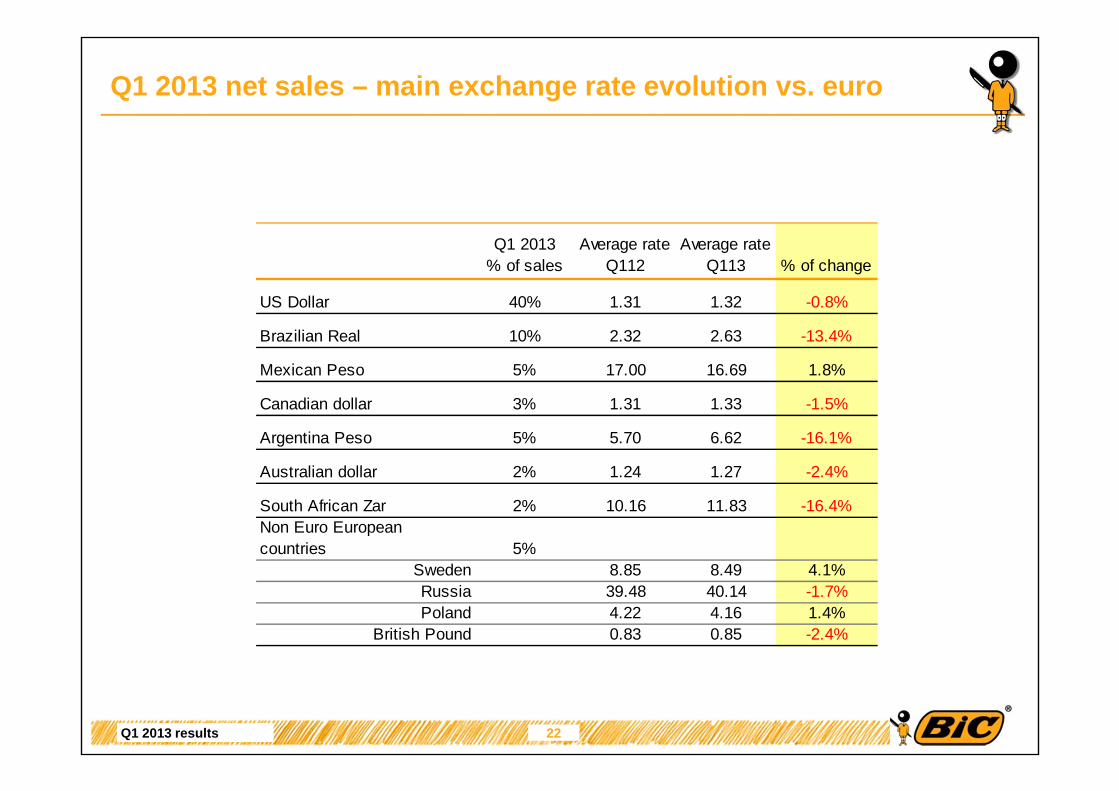
See appendix page 22 for main currency impact
Q1 13 Q1 12 Q1 12 Q1 12Q1 13 Q1 13 Q1 13
Q1 2013 results
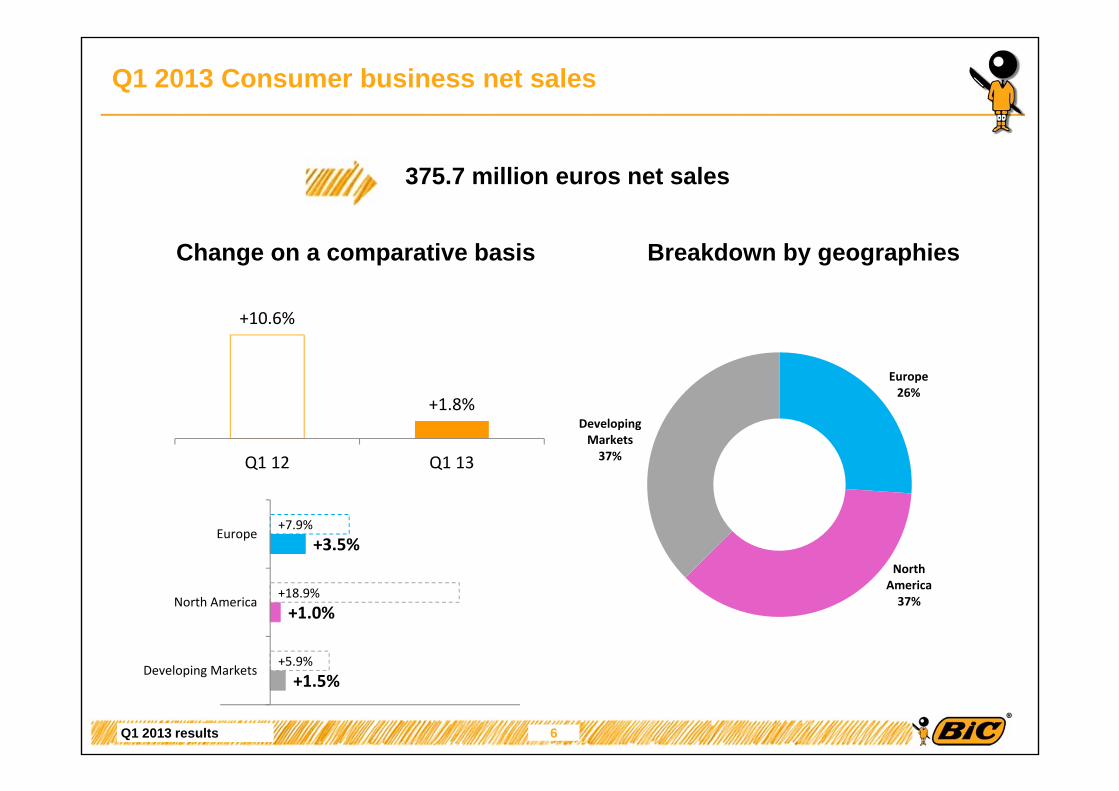
Q1 2013 Consumer business net sales
6
+1.5%
+1.0%
+3.5%
+5.9%
+18.9%
+7.9%
Developing Markets
North America
Europe
Europe26%
North America37%
Developing Markets37%
375.7 million euros net sales
Change on a comparative basis Breakdown by geographies
+10.6%
+1.8%
Q1 12 Q1 13
Q1 2013 results
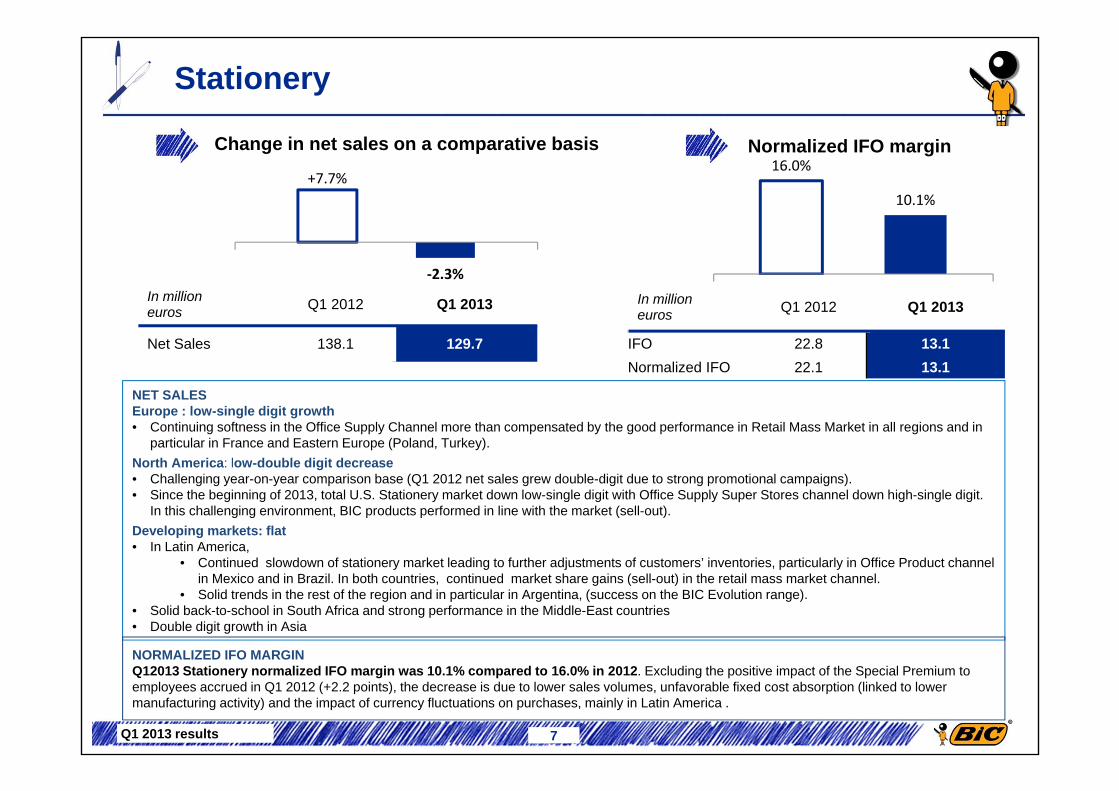
Stationery
7
In million euros Q1 2012 Q1 2013
IFO 22.8 13.1Normalized IFO 22.1 13.1
+7.7%
‐2.3%
Change in net sales on a comparative basis Normalized IFO margin
NET SALESEurope : low-single digit growth • Continuing softness in the Office Supply Channel more than compensated by the good performance in Retail Mass Market in all regions and in
particular in France and Eastern Europe (Poland, Turkey). North America: low-double digit decrease • Challenging year-on-year comparison base (Q1 2012 net sales grew double-digit due to strong promotional campaigns).• Since the beginning of 2013, total U.S. Stationery market down low-single digit with Office Supply Super Stores channel down high-single digit.
In this challenging environment, BIC products performed in line with the market (sell-out).Developing markets: flat• In Latin America,
• Continued slowdown of stationery market leading to further adjustments of customers’ inventories, particularly in Office Product channel in Mexico and in Brazil. In both countries, continued market share gains (sell-out) in the retail mass market channel.
• Solid trends in the rest of the region and in particular in Argentina, (success on the BIC Evolution range). • Solid back-to-school in South Africa and strong performance in the Middle-East countries• Double digit growth in Asia
16.0%
10.1%
In millioneuros Q1 2012 Q1 2013
Net Sales 138.1 129.7
NORMALIZED IFO MARGINQ12013 Stationery normalized IFO margin was 10.1% compared to 16.0% in 2012. Excluding the positive impact of the Special Premium to employees accrued in Q1 2012 (+2.2 points), the decrease is due to lower sales volumes, unfavorable fixed cost absorption (linked to lower manufacturing activity) and the impact of currency fluctuations on purchases, mainly in Latin America .
Q1 2013 results
Lighters
In million euros Q1 2012 Q1 2013
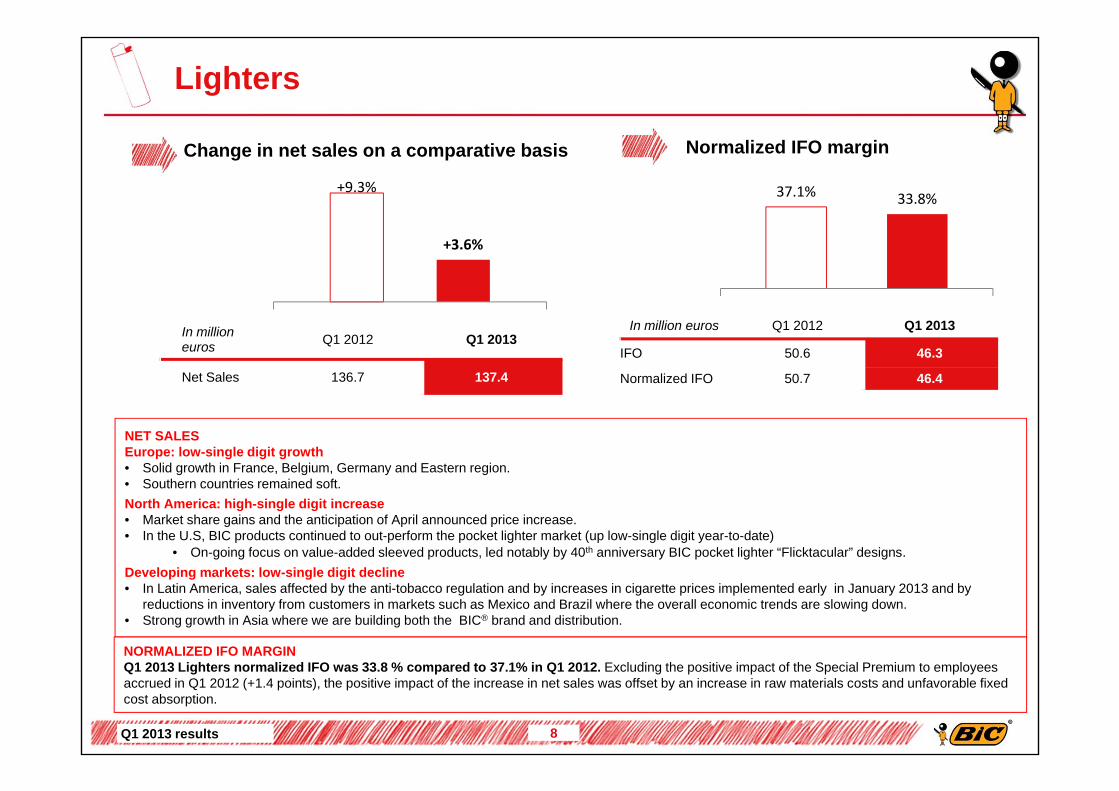
Net Sales 136.7 137.4
8
In million euros Q1 2012 Q1 2013
IFO 50.6 46.3
Normalized IFO 50.7 46.4
Change in net sales on a comparative basis Normalized IFO margin
NET SALESEurope: low-single digit growth• Solid growth in France, Belgium, Germany and Eastern region. • Southern countries remained soft.North America: high-single digit increase• Market share gains and the anticipation of April announced price increase. • In the U.S, BIC products continued to out-perform the pocket lighter market (up low-single digit year-to-date)
• On-going focus on value-added sleeved products, led notably by 40th anniversary BIC pocket lighter “Flicktacular” designs. Developing markets: low-single digit decline• In Latin America, sales affected by the anti-tobacco regulation and by increases in cigarette prices implemented early in January 2013 and by
reductions in inventory from customers in markets such as Mexico and Brazil where the overall economic trends are slowing down. • Strong growth in Asia where we are building both the BIC® brand and distribution.
37.1% 33.8%+9.3%
+3.6%
NORMALIZED IFO MARGINQ1 2013 Lighters normalized IFO was 33.8 % compared to 37.1% in Q1 2012. Excluding the positive impact of the Special Premium to employees accrued in Q1 2012 (+1.4 points), the positive impact of the increase in net sales was offset by an increase in raw materials costs and unfavorable fixed cost absorption.
Q1 2013 results
Shavers
9
In million euros Q1 2012 Q1 2013
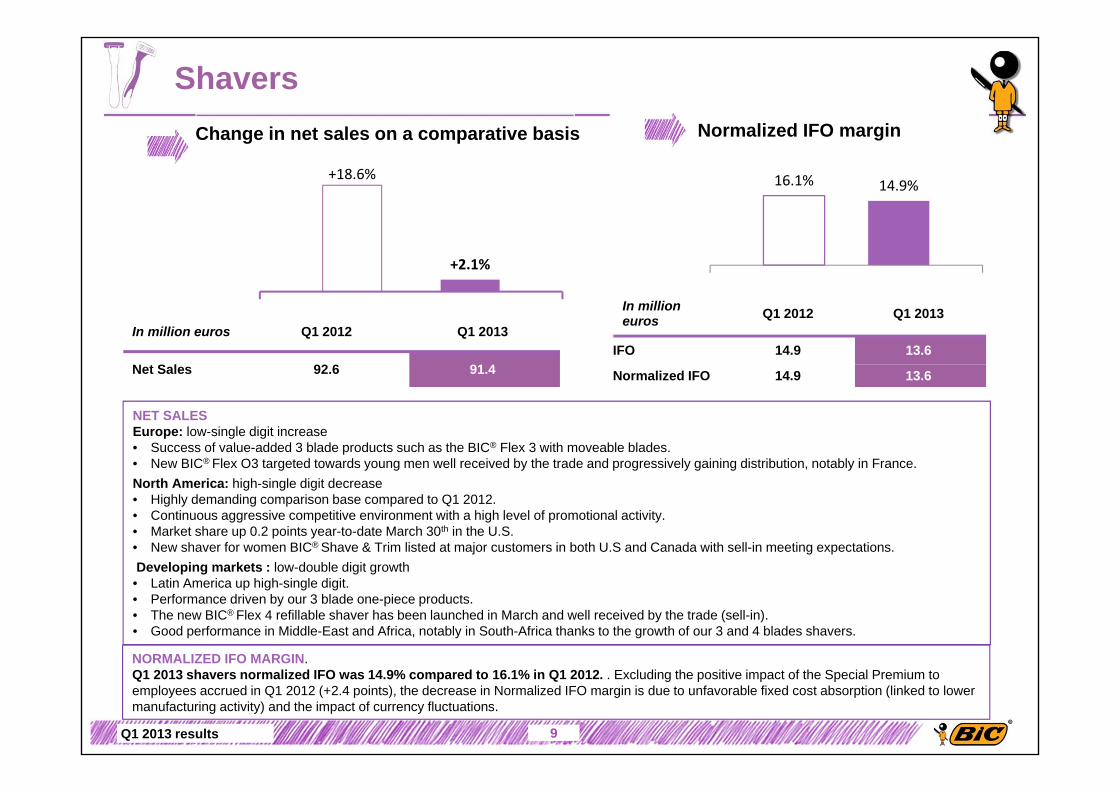
Net Sales 92.6 91.4
In million euros Q1 2012 Q1 2013
IFO 14.9 13.6
Normalized IFO 14.9 13.6
NET SALES Europe: low-single digit increase• Success of value-added 3 blade products such as the BIC® Flex 3 with moveable blades. • New BIC® Flex O3 targeted towards young men well received by the trade and progressively gaining distribution, notably in France.North America: high-single digit decrease • Highly demanding comparison base compared to Q1 2012.• Continuous aggressive competitive environment with a high level of promotional activity.• Market share up 0.2 points year-to-date March 30th in the U.S. • New shaver for women BIC® Shave & Trim listed at major customers in both U.S and Canada with sell-in meeting expectations.Developing markets : low-double digit growth• Latin America up high-single digit. • Performance driven by our 3 blade one-piece products. • The new BIC® Flex 4 refillable shaver has been launched in March and well received by the trade (sell-in). • Good performance in Middle-East and Africa, notably in South-Africa thanks to the growth of our 3 and 4 blades shavers.
+18.6%
+2.1%
16.1% 14.9%
Change in net sales on a comparative basis Normalized IFO margin
NORMALIZED IFO MARGIN. Q1 2013 shavers normalized IFO was 14.9% compared to 16.1% in Q1 2012. . Excluding the positive impact of the Special Premium to employees accrued in Q1 2012 (+2.4 points), the decrease in Normalized IFO margin is due to unfavorable fixed cost absorption (linked to lower manufacturing activity) and the impact of currency fluctuations.

Titre de la présentation
Other Products Consumer
In million euros Q1 2012 Q1 2013
Net Sales 17.5 17.2
10
+5.9%
+22.6% In million euros Q1 2012 Q1 2013
IFO -2.7 -3.6
Normalized IFO -3.5 -3.6
Net sales growth driven by the good performance of BIC Sport
2.5 million euros expenses related to portable fuel cell (compared to -2.9 million euros in Q1 2012)
Change in net sales on a comparative basis Normalized IFO
Q1 2013 results
BIC APP
In million euros Q1 2012 Q1 2013
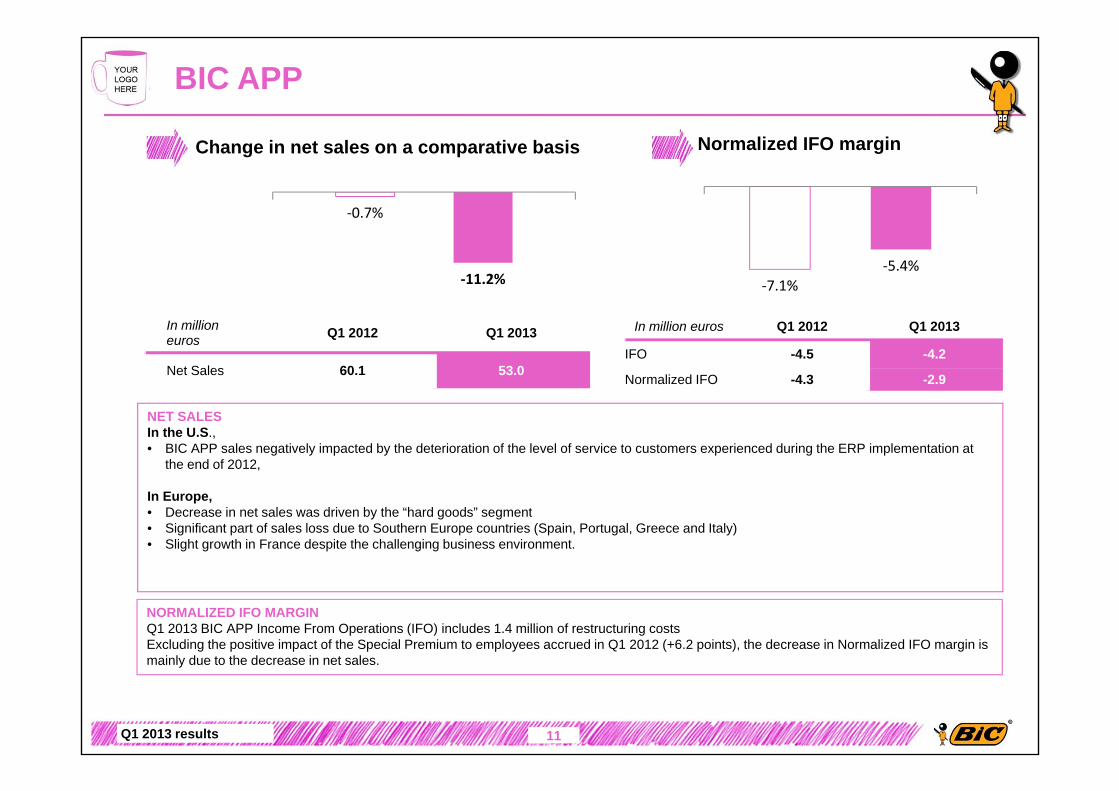
Net Sales 60.1 53.0
11
In million euros Q1 2012 Q1 2013
IFO -4.5 -4.2
Normalized IFO -4.3 -2.9
NET SALESIn the U.S., • BIC APP sales negatively impacted by the deterioration of the level of service to customers experienced during the ERP implementation at
the end of 2012,
In Europe,• Decrease in net sales was driven by the “hard goods” segment • Significant part of sales loss due to Southern Europe countries (Spain, Portugal, Greece and Italy)• Slight growth in France despite the challenging business environment.
‐0.7%
‐11.2% ‐7.1%‐5.4%
Change in net sales on a comparative basis Normalized IFO margin
NORMALIZED IFO MARGINQ1 2013 BIC APP Income From Operations (IFO) includes 1.4 million of restructuring costsExcluding the positive impact of the Special Premium to employees accrued in Q1 2012 (+6.2 points), the decrease in Normalized IFO margin is mainly due to the decrease in net sales.

Q1 2013 results
Q1 2013 consolidated financial figures
Jim DiPietro

Q1 2013 results
Q1 2013: From Net Sales to IFO
13
In million euros Q1 2012 Q1 2013 ChangeChange at constant
currencies*
Change on a comparative
basis*
Net Sales 445.0 428.6 -3.7% -0.7% +0.0%
Gross Profit 233.1 210.4 -9.7%
Normalized* Income from Operations 79.9 66.7 -16.5%
Income from Operations 81.1 65.2 -19.5%
*: see glossary
Q1 2013 results
Q1 2013 non-recurring items
14
In million euros Q1 2012 As % of sales Q1 2013 As %
of sales
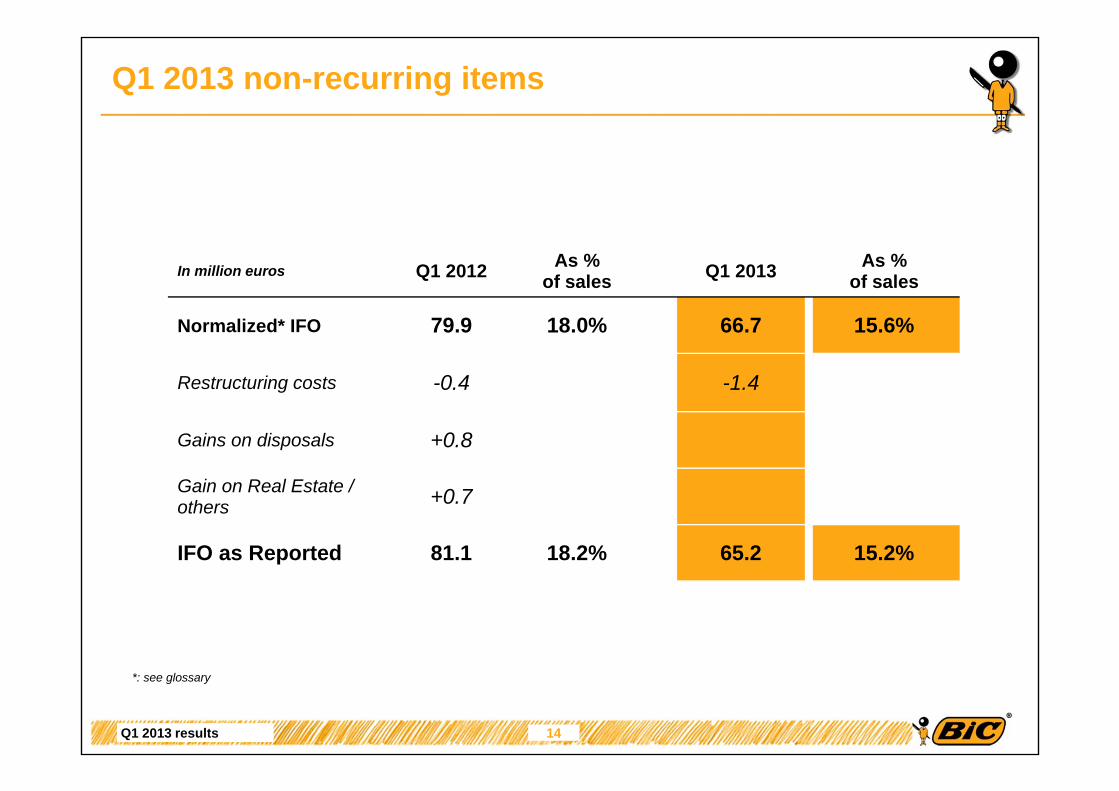
Normalized* IFO 79.9 18.0% 66.7 15.6%
Restructuring costs -0.4 -1.4
Gains on disposals +0.8
Gain on Real Estate / others +0.7
IFO as Reported 81.1 18.2% 65.2 15.2%
*: see glossary
Q1 2013 results
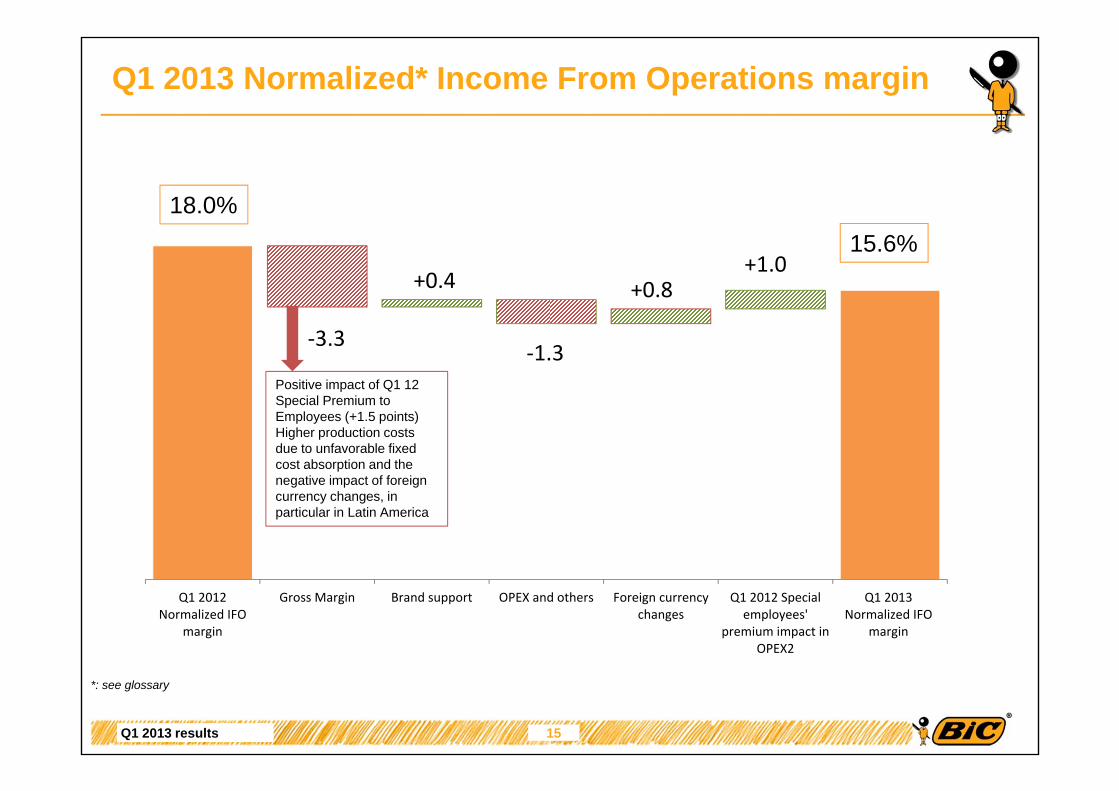
Q1 2013 Normalized* Income From Operations margin
15
‐3.3
+1.0+0.4
‐1.3
+0.8
Q1 2012Normalized IFO
margin
Gross Margin Brand support OPEX and others Foreign currencychanges
Q1 2012 Specialemployees'
premium impact inOPEX2
Q1 2013Normalized IFO
margin
*: see glossary
18.0%15.6%
Positive impact of Q1 12 Special Premium to Employees (+1.5 points)Higher production costs due to unfavorable fixed cost absorption and the negative impact of foreign currency changes, in particular in Latin America
Q1 2013 results
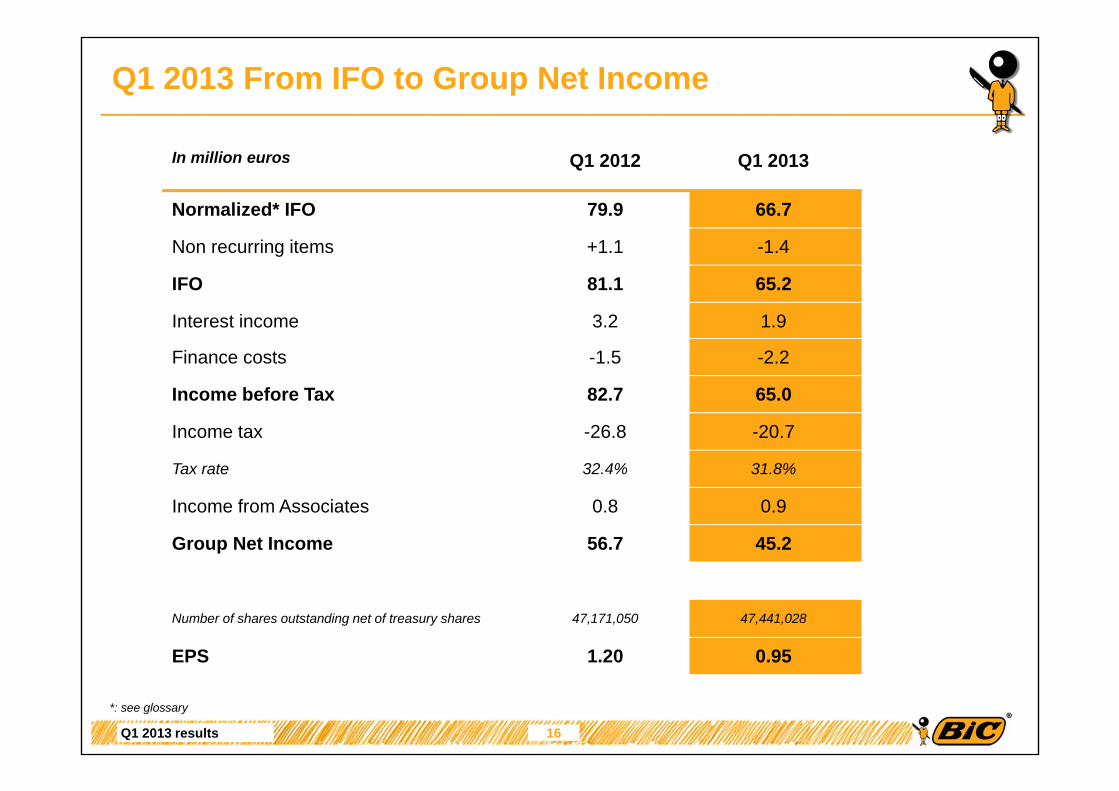
Q1 2013 From IFO to Group Net Income
In million euros Q1 2012 Q1 2013
Normalized* IFO 79.9 66.7
Non recurring items +1.1 -1.4
IFO 81.1 65.2
Interest income 3.2 1.9
Finance costs -1.5 -2.2
Income before Tax 82.7 65.0
Income tax -26.8 -20.7
Tax rate 32.4% 31.8%
Income from Associates 0.8 0.9
Group Net Income 56.7 45.2
Number of shares outstanding net of treasury shares 47,171,050 47,441,028
EPS 1.20 0.95
*: see glossary
16
Q1 2013 results
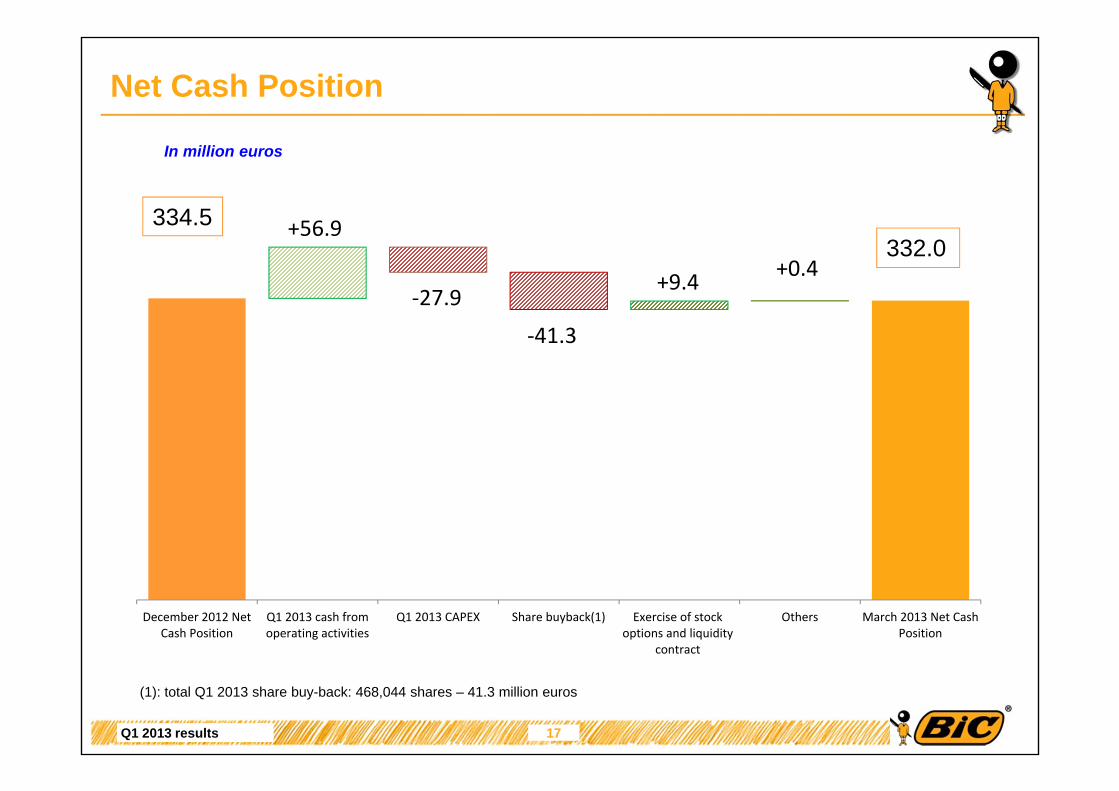
Net Cash Position
+56.9
‐27.9
‐41.3
+9.4 +0.4
December 2012 NetCash Position
Q1 2013 cash fromoperating activities
Q1 2013 CAPEX Share buyback(1) Exercise of stockoptions and liquidity
contract
Others March 2013 Net CashPosition
17
334.5332.0
In million euros
(1): total Q1 2013 share buy-back: 468,044 shares – 41.3 million euros

Q1 2013 results 18
Full year 2013outlook
Mario Guevara

Q1 2013 results
Group Q1 2013 summary
Slight growth of Consumer business despite a challenging comparison basis• Europe driven by a strong performance in Eastern countries and a good resilience in
Western countries,• low-single growth in North America,• low-single digit growth in developing markets with Latin America slowdown more
than compensated by the solid performance of the Middle-East and Africa and Asia.BIC APP impacted the consequence of the ERP implementation in the US and depressed economic conditions in Southern Europe
19
Net sales
Impact of unfavorable fixed cost absorption resulting from to lower manufacturing activity in H2 2012Impact of currency fluctuations on purchases, mainly in Latin AmericaNegative raw material impact in Lighters
Normalized IFO margin
Net Cash Position
Good level of net cash from operating activitiesIncreased in CAPEX Share buy-back resumed
Q1 2013 results
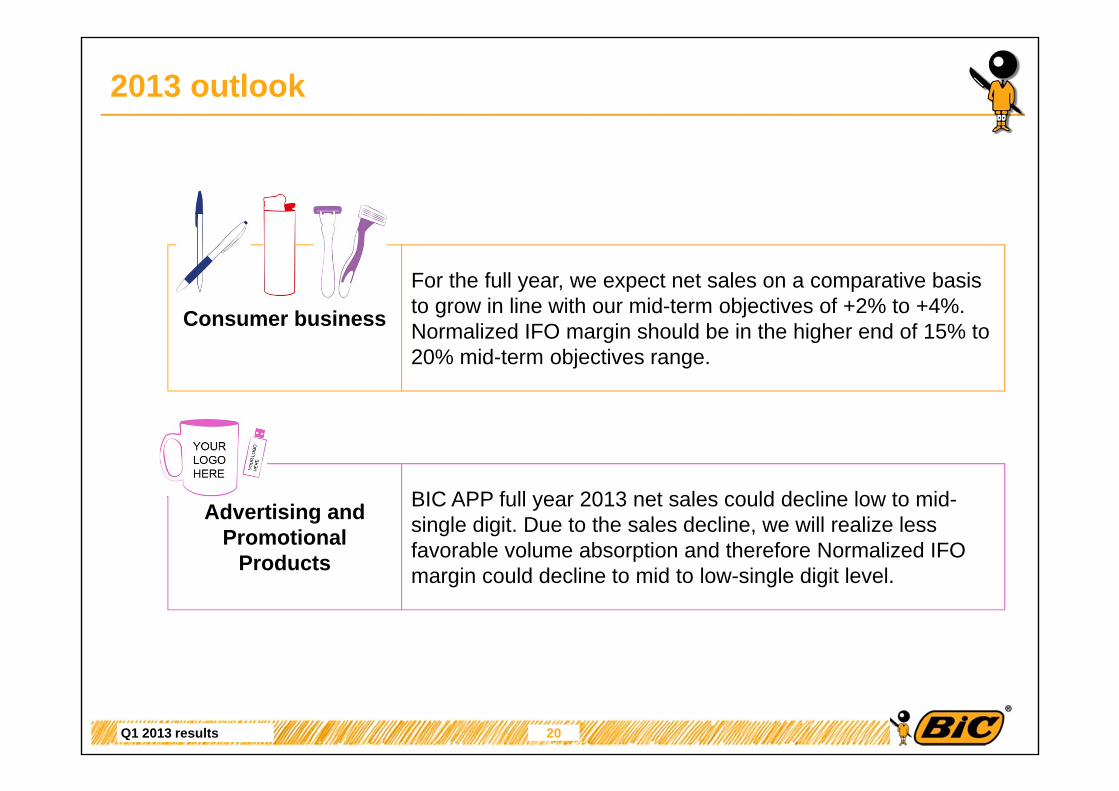
2013 outlook
20
For the full year, we expect net sales on a comparative basis to grow in line with our mid-term objectives of +2% to +4%. Normalized IFO margin should be in the higher end of 15% to 20% mid-term objectives range.
Consumer business
BIC APP full year 2013 net sales could decline low to mid-single digit. Due to the sales decline, we will realize less favorable volume absorption and therefore Normalized IFO margin could decline to mid to low-single digit level.
Advertising and Promotional
Products
Q1 2013 results
Q1 2013 net sales – main exchange rate evolution vs. euro
Q1 2013 % of sales
Average rate Q112
Average rate Q113 % of change
US Dollar 40% 1.31 1.32 -0.8%
Brazilian Real 10% 2.32 2.63 -13.4%
Mexican Peso 5% 17.00 16.69 1.8%
Canadian dollar 3% 1.31 1.33 -1.5%
Argentina Peso 5% 5.70 6.62 -16.1%
Australian dollar 2% 1.24 1.27 -2.4%
South African Zar 2% 10.16 11.83 -16.4%Non Euro European countries 5%
Sweden 8.85 8.49 4.1%Russia 39.48 40.14 -1.7%Poland 4.22 4.16 1.4%
British Pound 0.83 0.85 -2.4%
22

Q1 2013 results
Group Quarterly figures
* see glossary
In million euros Q1 11 Q2 11 Q3 11 Q4 11 FY 11 Q1 12 Q2 12 Q3 12 Q4 12 FY 12 Q1 13
Net Sales 409.9 476.2 468.2 469.8 1,824.1 445.0 500.8 488.8 464.1 1,898.7 428.6
YoY actual changes 8.4% -2.3% -5.0% -0.7% -0.4% 8.6% 5.2% 4.4% -1.2% 4.1% -3.7%
YoY changes atconstant currencies* 4.9% 3.5% 0.2% 0.3% 2.1% 7.1% 0.4% -1.7% -2.2% 0.7% -0.7%
YoY changes on a comparative basis* 6.6% 4.7% 0.8% 1.1% 3.1% 9.0% 3.1% 0.5% -0.4% 2.8% +0.0%
IFO 81.0 91.9 88.8 74.0 335.8 81.1 117.7 99.0 67.2 365.0 65.2
Normalized IFO* 82.1 101.2 90.1 85.2 358.5 79.9 118.6 96.1 73.6 368.3 66.7
15.2%IFO margin 19.8% 19.3% 19.0% 15.8% 18.4% 18.2% 23.5% 20.3% 14.5% 19.2%Normalized IFO margin* 20.0% 21.3% 19.2% 18.1% 19.7% 18.0% 23.7% 19.7% 15.9% 19.4% 15.6%
Income before tax 78.9 95.0 96.3 78.9 349.0 83.5 122.7 101.6 71.4 379.2 65.0
Net Income 53.3 64.0 64.8 53.3 235.3 56.7 84.2 69.5 49.2 259.6 45.2
EPS 1.11 1.33 1.36 1.12 4.95 1.20 1.78 1.47 1.04 5.48 0.95
23
Q1 2013 results
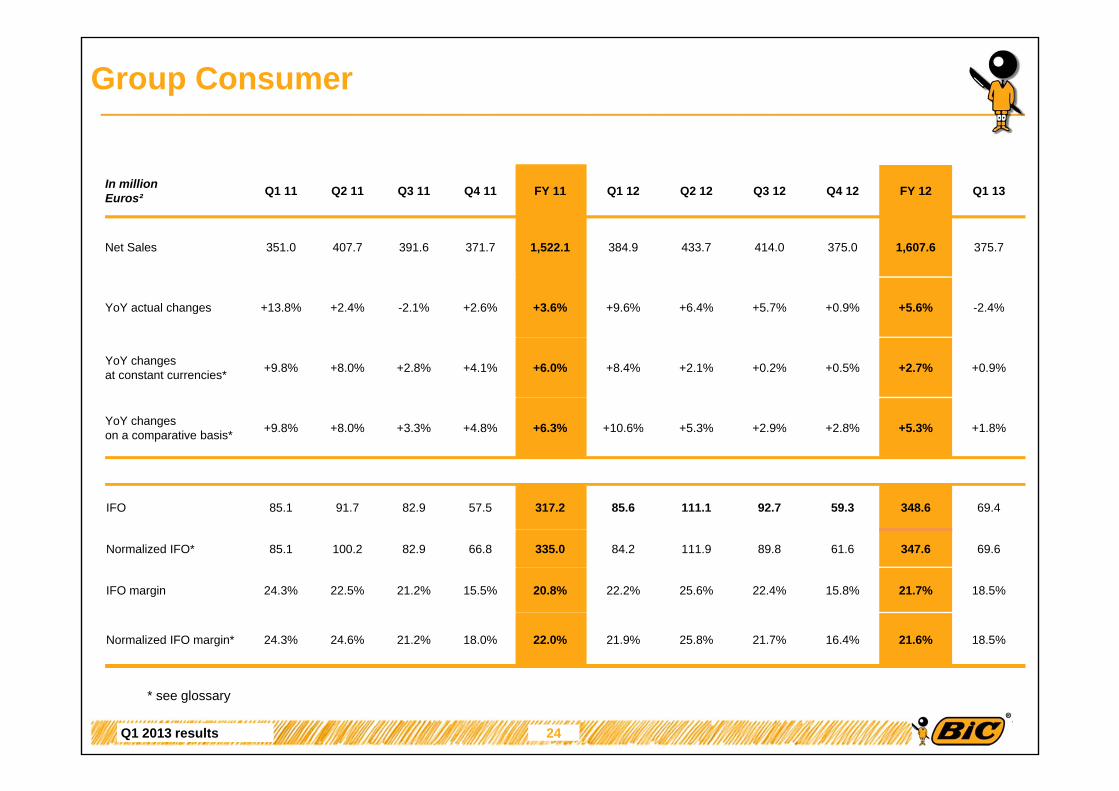
Group Consumer
* see glossary
In millionEuros² Q1 11 Q2 11 Q3 11 Q4 11 FY 11 Q1 12 Q2 12 Q3 12 Q4 12 FY 12 Q1 13
Net Sales 351.0 407.7 391.6 371.7 1,522.1 384.9 433.7 414.0 375.0 1,607.6 375.7
YoY actual changes +13.8% +2.4% -2.1% +2.6% +3.6% +9.6% +6.4% +5.7% +0.9% +5.6% -2.4%
YoY changes at constant currencies* +9.8% +8.0% +2.8% +4.1% +6.0% +8.4% +2.1% +0.2% +0.5% +2.7% +0.9%
YoY changes on a comparative basis* +9.8% +8.0% +3.3% +4.8% +6.3% +10.6% +5.3% +2.9% +2.8% +5.3% +1.8%
IFO 85.1 91.7 82.9 57.5 317.2 85.6 111.1 92.7 59.3 348.6 69.4
Normalized IFO* 85.1 100.2 82.9 66.8 335.0 84.2 111.9 89.8 61.6 347.6 69.6
IFO margin 24.3% 22.5% 21.2% 15.5% 20.8% 22.2% 25.6% 22.4% 15.8% 21.7% 18.5%
Normalized IFO margin* 24.3% 24.6% 21.2% 18.0% 22.0% 21.9% 25.8% 21.7% 16.4% 21.6% 18.5%
24
Q1 2013 results
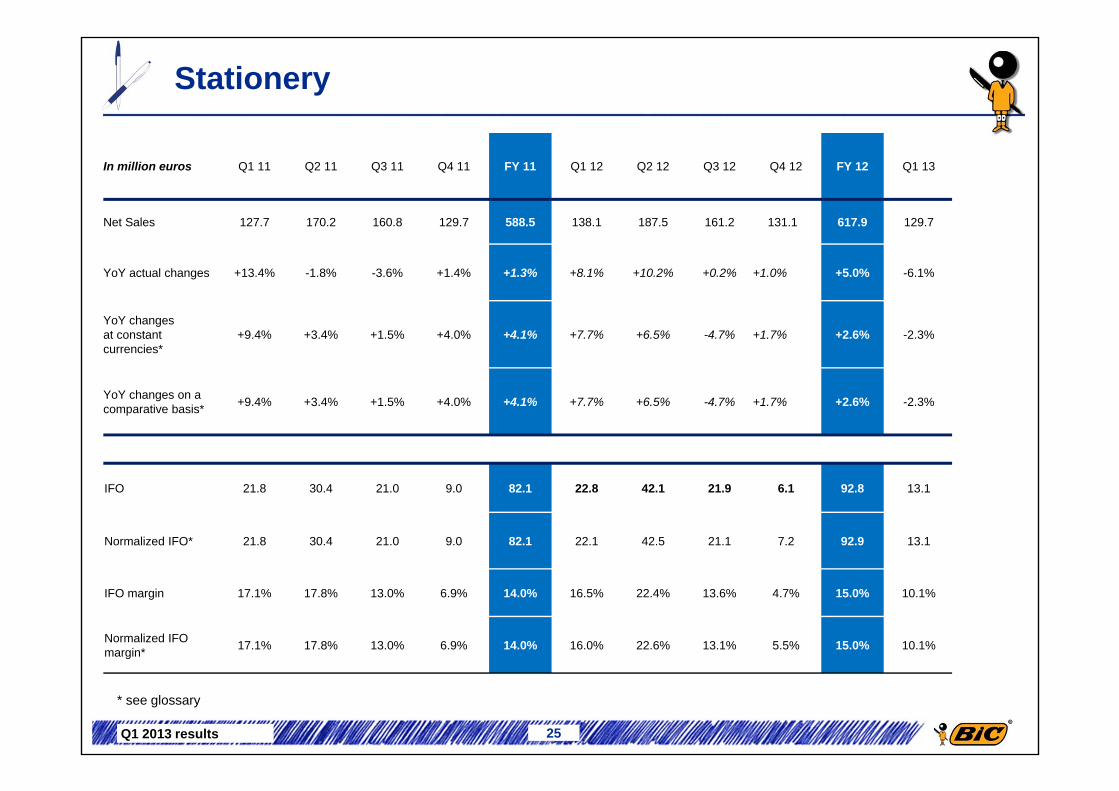
Stationery
25
* see glossary
In million euros Q1 11 Q2 11 Q3 11 Q4 11 FY 11 Q1 12 Q2 12 Q3 12 Q4 12 FY 12 Q1 13
Net Sales 127.7 170.2 160.8 129.7 588.5 138.1 187.5 161.2 131.11 617.9 129.7
YoY actual changes +13.4% -1.8% -3.6% +1.4% +1.3% +8.1% +10.2% +0.2% +1.0% +5.0% -6.1%
YoY changes at constant currencies*
+9.4% +3.4% +1.5% +4.0% +4.1% +7.7% +6.5% -4.7% +1.7% +2.6% -2.3%
YoY changes on a comparative basis* +9.4% +3.4% +1.5% +4.0% +4.1% +7.7% +6.5% -4.7% +1.7% +2.6% -2.3%
IFO 21.8 30.4 21.0 9.0 82.1 22.8 42.1 21.9 6.1 92.8 13.1
Normalized IFO* 21.8 30.4 21.0 9.0 82.1 22.1 42.5 21.1 7.2 92.9 13.1
IFO margin 17.1% 17.8% 13.0% 6.9% 14.0% 16.5% 22.4% 13.6% 4.7% 15.0% 10.1%
Normalized IFO margin* 17.1% 17.8% 13.0% 6.9% 14.0% 16.0% 22.6% 13.1% 5.5% 15.0% 10.1%
Q1 2013 results
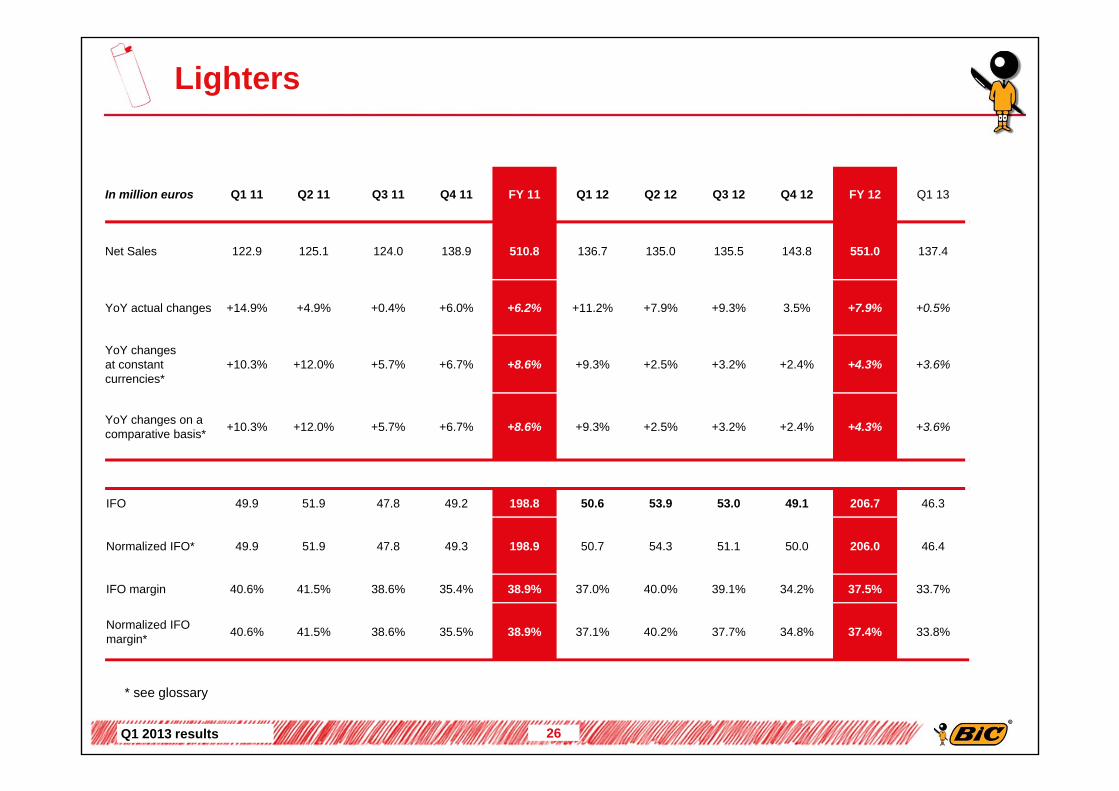
Lighters
26
* see glossary
In million euros Q1 11 Q2 11 Q3 11 Q4 11 FY 11 Q1 12 Q2 12 Q3 12 Q4 12 FY 12 Q1 13
Net Sales 122.9 125.1 124.0 138.9 510.8 136.7 135.0 135.5 143.8 551.0 137.4
YoY actual changes +14.9% +4.9% +0.4% +6.0% +6.2% +11.2% +7.9% +9.3% 3.5% +7.9% +0.5%
YoY changes at constant currencies*
+10.3% +12.0% +5.7% +6.7% +8.6% +9.3% +2.5% +3.2% +2.4% +4.3% +3.6%
YoY changes on a comparative basis* +10.3% +12.0% +5.7% +6.7% +8.6% +9.3% +2.5% +3.2% +2.4% +4.3% +3.6%
IFO 49.9 51.9 47.8 49.2 198.8 50.6 53.9 53.0 49.1 206.7 46.3
Normalized IFO* 49.9 51.9 47.8 49.3 198.9 50.7 54.3 51.1 50.0 206.0 46.4
IFO margin 40.6% 41.5% 38.6% 35.4% 38.9% 37.0% 40.0% 39.1% 34.2% 37.5% 33.7%
Normalized IFO margin* 40.6% 41.5% 38.6% 35.5% 38.9% 37.1% 40.2% 37.7% 34.8% 37.4% 33.8%
Q1 2013 results
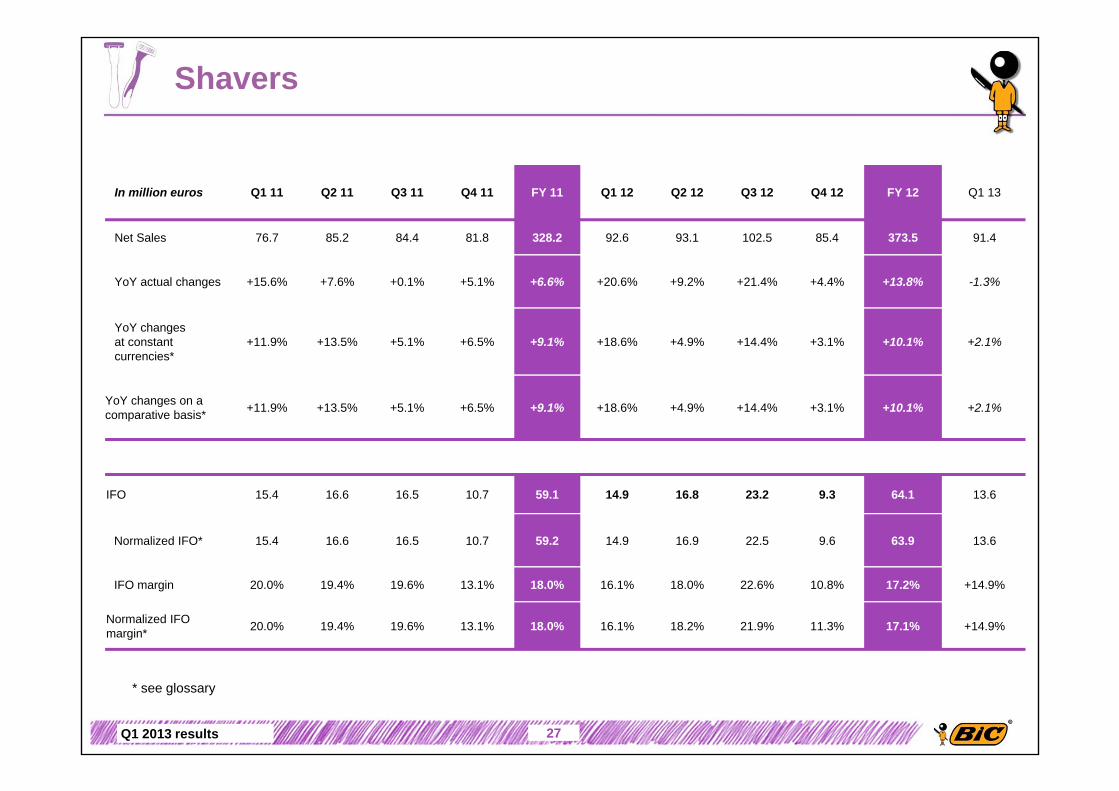
Shavers
27
* see glossary
In million euros Q1 11 Q2 11 Q3 11 Q4 11 FY 11 Q1 12 Q2 12 Q3 12 Q4 12 FY 12 Q1 13
Net Sales 76.7 85.2 84.4 81.8 328.2 92.6 93.1 102.5 85.4 373.5 91.4
YoY actual changes +15.6% +7.6% +0.1% +5.1% +6.6% +20.6% +9.2% +21.4% +4.4% +13.8% -1.3%
YoY changes at constant currencies*
+11.9% +13.5% +5.1% +6.5% +9.1% +18.6% +4.9% +14.4% +3.1% +10.1% +2.1%
YoY changes on a comparative basis* +11.9% +13.5% +5.1% +6.5% +9.1% +18.6% +4.9% +14.4% +3.1% +10.1% +2.1%
IFO 15.4 16.6 16.5 10.7 59.1 14.9 16.8 23.2 9.3 64.1 13.6
Normalized IFO* 15.4 16.6 16.5 10.7 59.2 14.9 16.9 22.5 9.6 63.9 13.6
IFO margin 20.0% 19.4% 19.6% 13.1% 18.0% 16.1% 18.0% 22.6% 10.8% 17.2% +14.9%
Normalized IFO margin* 20.0% 19.4% 19.6% 13.1% 18.0% 16.1% 18.2% 21.9% 11.3% 17.1% +14.9%

Q1 2013 results 28
* see glossary
Other Product Consumer
In million euros Q1 11 Q2 11 Q3 11 Q4 11 FY 11 Q1 12 Q2 12 Q3 12 Q4 12 FY 12 Q1 13
Net Sales 23.7 27.2 22.4 21.2 94.5 17.5 18.1 14.8 14.7 65.2 17.2
YoY actual changes +4.9% +3.5% -11.6% -16.6% -5.1% -25.9% -33.4% -33.9% -30.5% -31.0% -2.2%
YoY changes at constant currencies*
+3.3% +4.3% -10.8% -16.2% -5.0% -26.1% -35.1% -35.5% -29.8% -31.8% -1.2%
YoY changes on a comparative basis*
+3.3% +4.3% -2.5% -7.8% -0.5% +5.9% +17.3% +19.5% +16.8% +14.3% +22.6%
IFO* -1.9 -7.1 -2.5 -11.3 -22.8 -2.7 -1.7 -5.4 -5.2 -15.0 -3.6
Normalized IFO* -1.9 1.4 -2.5 -2.1 -5.2 -3.5 -1.7 -4.9 -5.2 -15.3 -3.6
Q1 2013 results
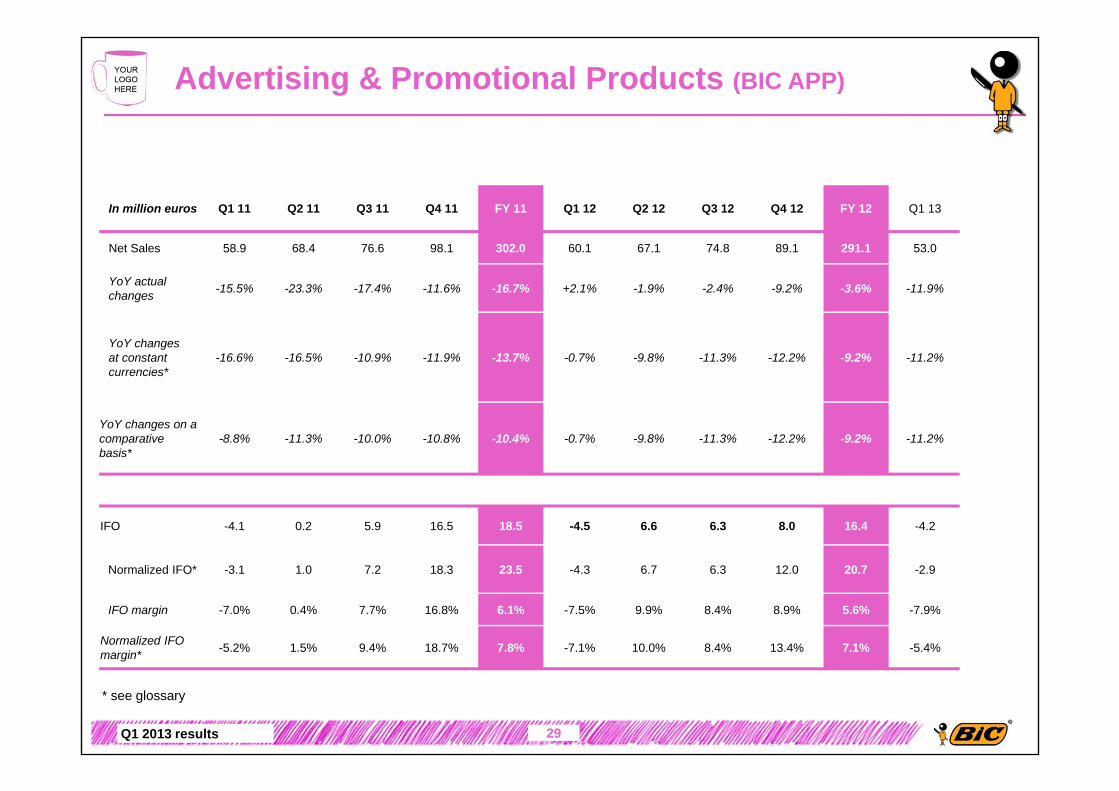
Advertising & Promotional Products (BIC APP)
29
* see glossary
In million euros Q1 11 Q2 11 Q3 11 Q4 11 FY 11 Q1 12 Q2 12 Q3 12 Q4 12 FY 12 Q1 13
Net Sales 58.9 68.4 76.6 98.1 302.0 60.1 67.1 74.8 89.1 291.1 53.0
YoY actual changes -15.5% -23.3% -17.4% -11.6% -16.7% +2.1% -1.9% -2.4% -9.2% -3.6% -11.9%
YoY changes at constant currencies*
-16.6% -16.5% -10.9% -11.9% -13.7% -0.7% -9.8% -11.3% -12.2% -9.2% -11.2%
YoY changes on a comparative basis*
-8.8% -11.3% -10.0% -10.8% -10.4% -0.7% -9.8% -11.3% -12.2% -9.2% -11.2%
IFO -4.1 0.2 5.9 16.5 18.5 -4.5 6.6 6.3 8.0 16.4 -4.2
Normalized IFO* -3.1 1.0 7.2 18.3 23.5 -4.3 6.7 6.3 12.0 20.7 -2.9
IFO margin -7.0% 0.4% 7.7% 16.8% 6.1% -7.5% 9.9% 8.4% 8.9% 5.6% -7.9%
Normalized IFO margin* -5.2% 1.5% 9.4% 18.7% 7.8% -7.1% 10.0% 8.4% 13.4% 7.1% -5.4%
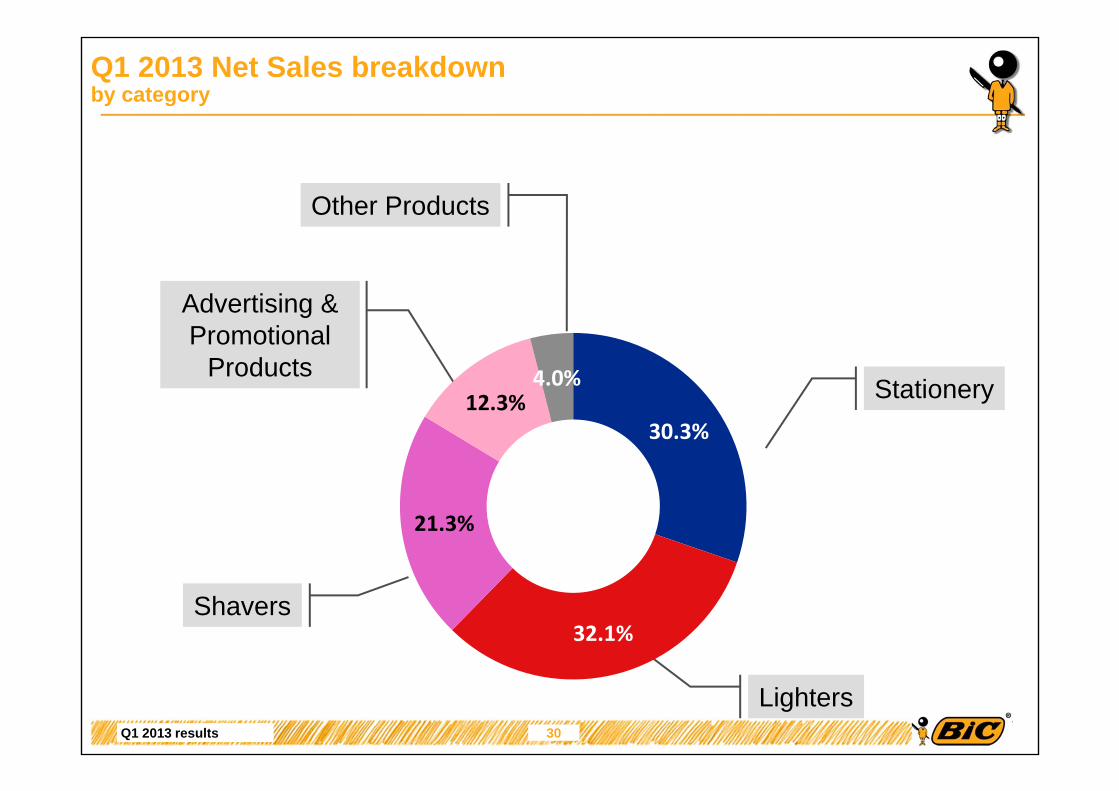
Q1 2013 results
Q1 2013 Net Sales breakdownby category
Stationery
Lighters
Shavers
Other Products
Advertising & Promotional
Products
30.3%
32.1%
21.3%
12.3%4.0%
30
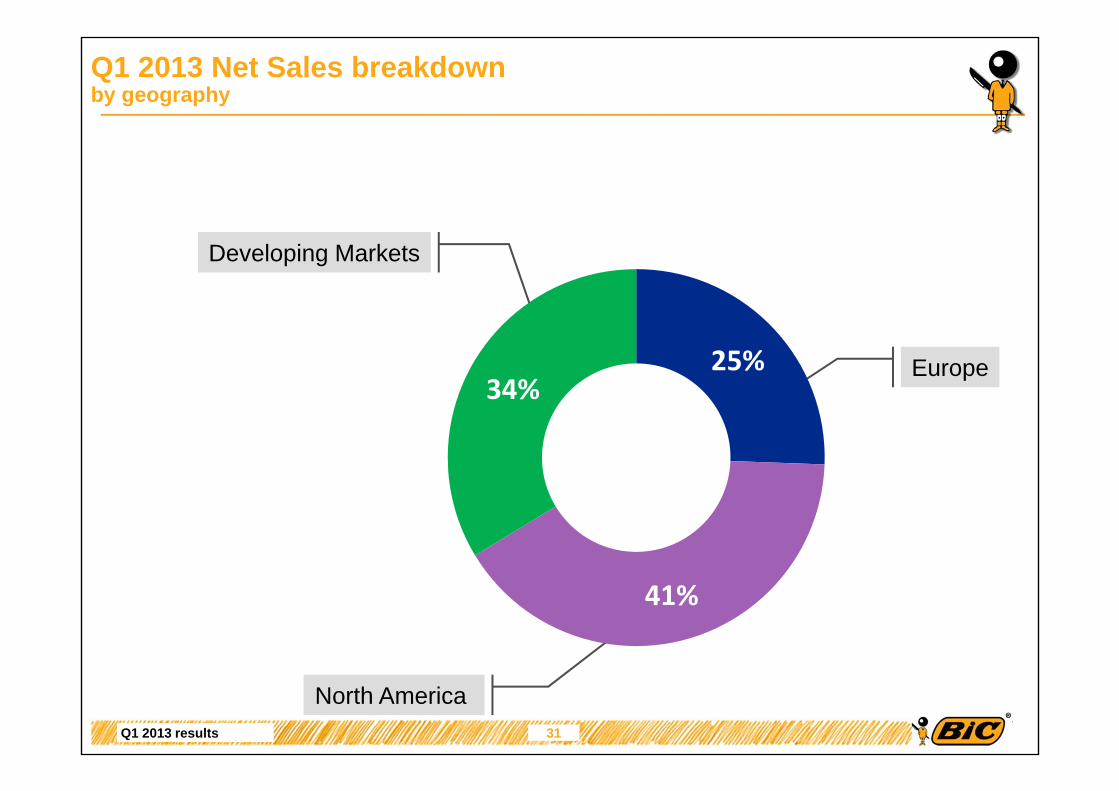
Q1 2013 results
Q1 2013 Net Sales breakdownby geography
Europe
North America
Developing Markets
25%
41%
34%
31
Q1 2013 results
Miscellaneous
Capital evolution:
• Authorized share capital at the end of March 2013: 48,503,512 shares
Total treasury shares at the end March 2013 is 1,246,572.
32
Q1 2013 results
Glossary
33
At constant currencies: Constant currency figures are calculated bytranslating the current year figures at prior year monthly average exchangerates. All net sales category comments are made at constant currencies orcomparative basis.
Comparative basis: at constant currencies and constant perimeter.Figures at constant perimeter exclude the impacts of acquisitions and/ordisposals that occurred during the current year and/or during the previousyear, until their anniversary date.
Normalized IFO: normalized means excluding restructuring, BIC APPintegration plan expenses, gain on disposal of phone cards activity inFrance and real estate gains.
.
Q1 2013 results
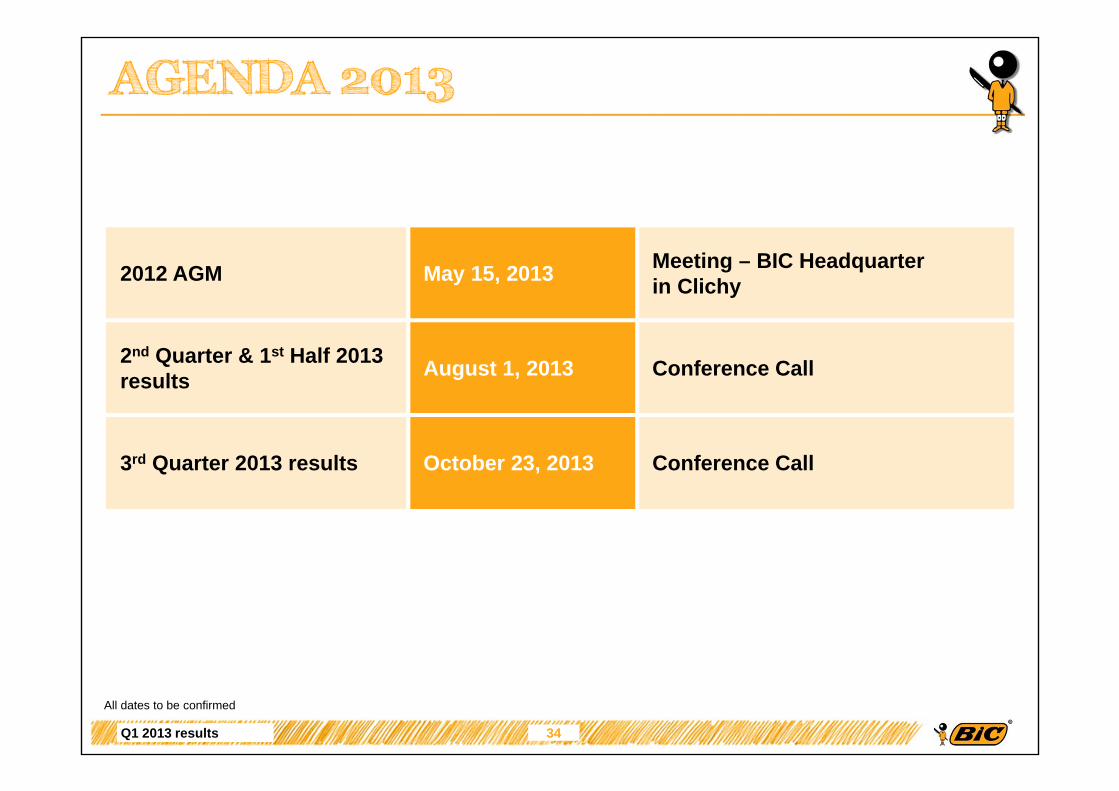
2012 AGM May 15, 2013 Meeting – BIC Headquarter in Clichy
2nd Quarter & 1st Half 2013 results August 1, 2013 Conference Call
3rd Quarter 2013 results October 23, 2013 Conference Call
AGENDA 2013
34
All dates to be confirmed
Q1 2013 results
Disclaimer
This document contains forward-looking statements. Although BIC believes itsexpectations are based on reasonable assumptions, these statements are subjectto numerous risks and uncertainties.A description of the risks borne by BIC appears in section “Risks and Opportunities”of BIC Registration Document filed with the French financial markets authority(AMF) on 27 March 2013.
35