
Python Data representations - Ashoka...
34
Python Data representations Numpy, pandas, sklearn
Transcript of Python Data representations - Ashoka...

Python Data representations
Numpy, pandas, sklearn

M X N matrix

mnmm
n
n
m xxx
xxx
xxx
X
y
y
y
y
21
22221
11211
2
1
,
Matrix with m-samples in n-dimensions and y labels

Data Representations
{(x1,y1), (x2, y2), ..., (xi, yi),..., (xM, yM)}M samplesxi ϵ Rn
n-features/ dimensions
X={x1, x2, ..., xi, ..., xM} xi ϵ Rn
y={y1,y2,..., yi, ..., yM) yi ϵ R
Read files/wrie files (use open(), split(), rstrip()) in PythonFormats: .txt, .dat, .csv, .xls, .mat, .svm, .arff etc.

Use of Numpy
Matrix vector operationsLinear AlgebraFile handling (read/write files with delimiters)
Numpy.Reshpape()

Numpy contd..
import numpy as npimport pandas as pdinput_file = "mydata.csv"# comma delimited is the defaultdf = pd.read_csv(input_file, header = 0)# for space delimited use:# df = pd.read_csv(input_file, header = 0, delimiter = " ")# for tab delimited use:# df = pd.read_csv(input_file, header = 0, delimiter = "\t")ORdata = np.loadtxt(fname = f, delimiter = ',')

� # put the original column names in a python list� original_headers = list(df.columns.values)� # remove the non-numeric columns� df = df._get_numeric_data()� # put the numeric column names in a python list� numeric_headers = list(df.columns.values)� # create a numpy array with the numeric values for input into scikit-learn� numpy_array = df.as_matrix()� # reverse the order of the columns� numeric_headers.reverse()� reverse_df = df[numeric_headers]

Pandas files
read_csvread_excelread_hdfread_sqlread_jsonread_msgpack (experimental)read_htmlread_gbq (experimental)read_stataread_sasread_clipboardread_pickle
The corresponding writer functions are object methods that are accessed like df.to_csv()
to_csvto_excelto_hdfto_sqlto_jsonto_msgpack (experimental)to_htmlto_gbq (experimental)to_statato_clipboardto_pickle

Data read from URL
import numpy as npimport urllib# url with dataseturl = "http://archive.ics.uci.edu/ml/machine-learning-databases/pima-indians-diabetes/pima-indians-diabetes.data"# download the fileraw_data = urllib.urlopen(url)# load the CSV file as a numpy matrixdataset = np.loadtxt(raw_data, delimiter=",")# separate the data from the target attributesX = dataset[:,0:8]y = dataset[:,8]

Scikit-learn (Normalization)
from sklearn import preprocessing# normalize the data attributesnormalized_X = preprocessing.normalize(X)# standardize the data attributesstandardized_X = preprocessing.scale(X)

A simple use of classifier
from sklearn import metricsfrom sklearn.linear_model import LogisticRegressionmodel = LogisticRegression()model.fit(X, y)print(model)# make predictionsexpected = ypredicted = model.predict(X)# summarize the fit of the modelprint(metrics.classification_report(expected, predicted))print(metrics.confusion_matrix(expected, predicted))
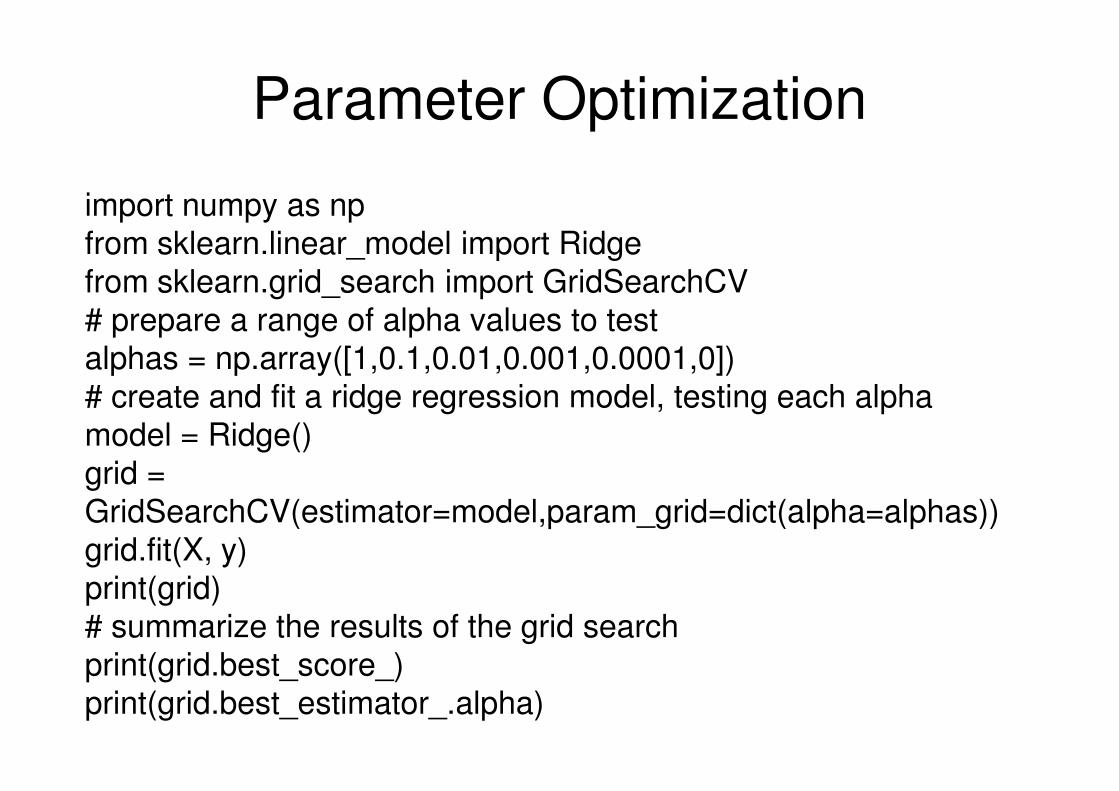
Parameter Optimization
import numpy as npfrom sklearn.linear_model import Ridgefrom sklearn.grid_search import GridSearchCV# prepare a range of alpha values to testalphas = np.array([1,0.1,0.01,0.001,0.0001,0])# create and fit a ridge regression model, testing each alphamodel = Ridge()grid = GridSearchCV(estimator=model,param_grid=dict(alpha=alphas))grid.fit(X, y)print(grid)# summarize the results of the grid searchprint(grid.best_score_)print(grid.best_estimator_.alpha)

Random set of parameters
import numpy as npfrom scipy.stats import uniform as sp_randfrom sklearn.linear_model import Ridgefrom sklearn.grid_search import RandomizedSearchCV# prepare a uniform distribution to sample for the alpha parameterparam_grid = {'alpha': sp_rand()}# create and fit a ridge regression model, testing random alpha valuesmodel = Ridge()rsearch = RandomizedSearchCV(estimator=model, param_distributions=param_grid, n_iter=100)rsearch.fit(X, y)print(rsearch)# summarize the results of the random parameter searchprint(rsearch.best_score_)print(rsearch.best_estimator_.alpha)

from sklearn.datasets import load_svmlight_fileX_train, y_train = load_svmlight_file("SVM format file")

Random data generation+ model save
import numpy as npfrom sklearn.svm import SVCrng = np.random.RandomState(0)X = rng.rand(100, 10)y = rng.binomial(1, 0.5, 100)X_test = rng.rand(5, 10)clf = SVC()clf.set_params(kernel='linear').fit(X, y)clf.predict(X_test)
clf.set_params(kernel='rbf').fit(X, y) clf.predict(X_test)
import pickles = pickle.dumps(clf)clf2 = pickle.loads(s) ORfrom sklearn.externals import joblibjoblib.dump(clf, 'filename.pkl') clf = joblib.load('filename.pkl')

Loading processed datasets
from sklearn import datasetsiris = datasets.load_iris()digits = datasets.load_digits()
dictionary objects:.data, .target_names, .target, .filenames, .DESCR etc.

from sklearn.datasets import fetch_20newsgroupsnewsgroups_train = fetch_20newsgroups(subset='train')orcats = ['alt.atheism', 'sci.space']newsgroups_train = fetch_20newsgroups (subset='train', categories=cats)

Remove headers/footers etc
newsgroups_train = fetch_20newsgroups(subset='train', ... remove=('headers', 'footers', 'quotes'), categories=categories)

Term frequency+ stopwordsfrom sklearn.feature_extraction.text import CountVectorizercount_vect = CountVectorizer(stop_words=None)X_train_counts = count_vect.fit_transform(newsgroups_train.dat)X_train_counts.shapeprint count_vect.vocabulary_.get(u'algorithm')
TFIDF:from sklearn.feature_extraction.text import TfidfTransformertf_transformer = TfidfTransformer(use_idf=False).fit(X_train_counts)X_train_tf = tf_transformer.transform(X_train_counts)
ORtfidf_transformer = TfidfTransformer()X_train_tfidf = tfidf_transformer.fit_transform(X_train_counts)X_train_tfidf.shape
Analyzer:analyze = count_vect.build_analyzer()analyze("This is a text document to analyze.") #Just see the tokenizer
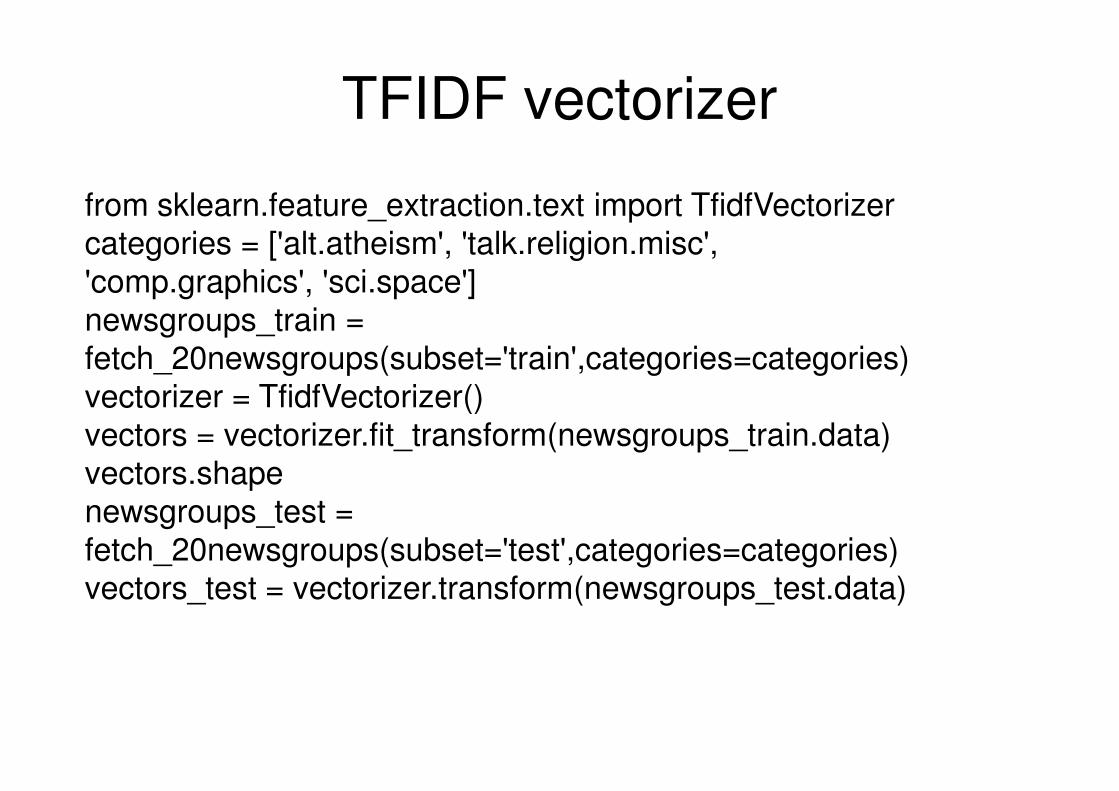
TFIDF vectorizer
from sklearn.feature_extraction.text import TfidfVectorizercategories = ['alt.atheism', 'talk.religion.misc', 'comp.graphics', 'sci.space']newsgroups_train = fetch_20newsgroups(subset='train',categories=categories)vectorizer = TfidfVectorizer()vectors = vectorizer.fit_transform(newsgroups_train.data)vectors.shapenewsgroups_test = fetch_20newsgroups(subset='test',categories=categories)vectors_test = vectorizer.transform(newsgroups_test.data)

Load files
train├── science│ ├── 0001.txt│ └── 0002.txt└── technology├── 0001.txt└── 0002.txt
from sklearn.datasets import load_filesdata=load_files('train')

Load ImagesScipy, PIL, load_sample_image of sklearn etc.
from PIL import Imageim = Image.open("bride.jpg")im.rotate(45).show()The following script creates nice 128x128 thumbnails of all JPEG images in the current directory.Create thumbnails
from PIL import Imageimport glob, ossize = 128, 128for infile in glob.glob("*.jpg"):
file, ext = os.path.splitext(infile)im = Image.open(infile)im.thumbnail(size, Image.ANTIALIAS)im.save(file + ".thumbnail", "JPEG")
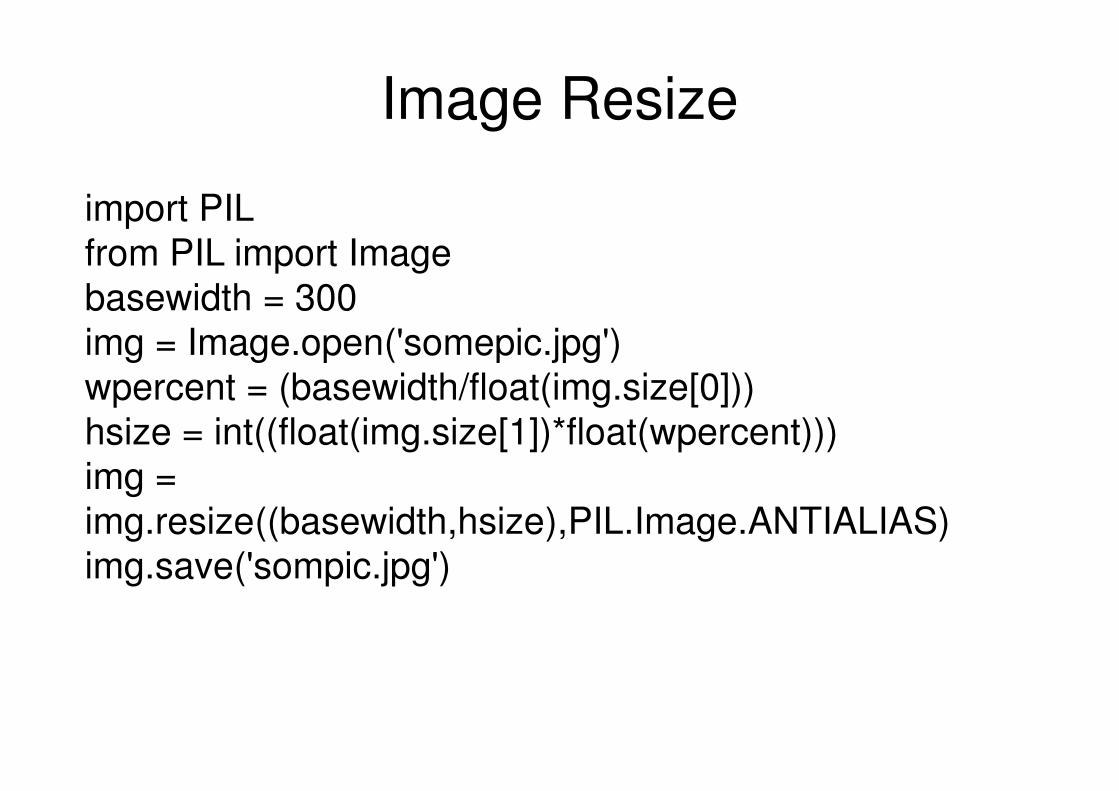
Image Resize
import PILfrom PIL import Imagebasewidth = 300img = Image.open('somepic.jpg')wpercent = (basewidth/float(img.size[0]))hsize = int((float(img.size[1])*float(wpercent)))img = img.resize((basewidth,hsize),PIL.Image.ANTIALIAS)img.save('sompic.jpg')

Image Resize using thumbnail
import os, sysfrom PIL import Imagesize = 128, 128im = Image.open(infile)im.thumbnail(size, Image.ANTIALIAS)im.save(outfile, "JPEG")

Load Images
from scipy.misc import imreadorfrom scipy.misc.pilutil import imreadfrom scipy.misc import imresizeimg = imread(file_path)face = np.asarray(img, dtype=np.float32)face /= 255.0 # scale uint8 coded colors to the [0.0, 1.0] floatsface = imresize(face, resize)

Simple image
from scipy import miscf = misc.face()misc.imsave('face.png', f) # uses the Image module (PIL)
import matplotlib.pyplot as pltplt.imshow(f)plt.show()

Simple Images
from scipy import miscface = misc.face()misc.imsave('face.png', face) # First we need to create the PNG file
face = misc.imread('face.png')type(face) #<... 'numpy.ndarray'>face.shape, face.dtype#((768, 1024, 3), dtype('uint8'))

List of images
for i in range(10):im = np.random.random_integers(0, 255,
10000).reshape((100, 100))misc.imsave('random_%02d.png' % i, im)
from glob import globfilelist = glob('random*.png')filelist.sort()

Read directory of imagesParent||------user1 (some images of user1)|------user2 (some images of user2)|------
train├── user1│ ├── 0001.jpg or png│ └── 0002.jpg or png└── user2├── 0001.jpg or png└── 0002.jpg r png
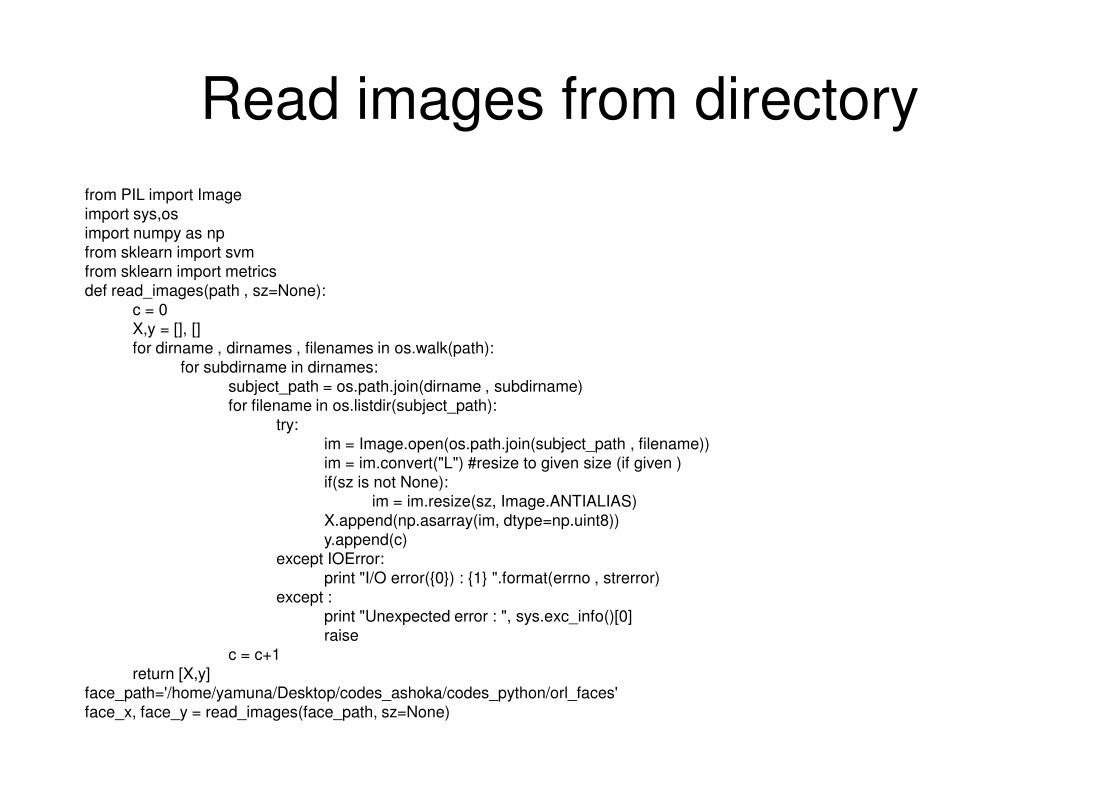
Read images from directoryfrom PIL import Imageimport sys,osimport numpy as npfrom sklearn import svmfrom sklearn import metricsdef read_images(path , sz=None):
c = 0X,y = [], []for dirname , dirnames , filenames in os.walk(path):
for subdirname in dirnames:subject_path = os.path.join(dirname , subdirname)for filename in os.listdir(subject_path):
try:im = Image.open(os.path.join(subject_path , filename))im = im.convert("L") #resize to given size (if given )if(sz is not None):
im = im.resize(sz, Image.ANTIALIAS)X.append(np.asarray(im, dtype=np.uint8))y.append(c)
except IOError:print "I/O error({0}) : {1} ".format(errno , strerror)
except :print "Unexpected error : ", sys.exc_info()[0]raise
c = c+1return [X,y]
face_path='/home/yamuna/Desktop/codes_ashoka/codes_python/orl_faces'face_x, face_y = read_images(face_path, sz=None)
Read images from directory cotd..
data= np.array(face_x)print data.shapey = np.array(face_y)print len(face_x[0]), face_y[0]data2 = data.reshape(data.shape[0],-1)print data2.shapeprint y.shapemodel = svm.SVC(gamma=0.001, C=100)clf = model.fit(data2,y)pred = clf.predict(data2)print predprint y#print metrics.classification_report(y, pred)print metrics.confusion_matrix(y, pred)print np.mean(clf.predict(data2)==y)

Train/Test split# Split iris data in train and test data# A random permutation, to split the data randomlyimport numpy as npfrom sklearn import datasetsiris_X = datasets.load_iris()
np.random.seed(0)indices = np.random.permutation(len(iris_X))iris_X_train = iris_X[indices[:-10]]iris_y_train = iris_y[indices[:-10]]iris_X_test = iris_X[indices[-10:]]iris_y_test = iris_y[indices[-10:]]
# Create and fit a nearest-neighbor classifierfrom sklearn.neighbors import KNeighborsClassifierfrom sklearn import metrics
knn = KNeighborsClassifier()clf= knn.fit(iris_X_train, iris_y_train)pred = knn.predict(iris_X_test)print metrics.classification_report(iris_y_test,pred)print metrics.confusion_matrix(iris_y_test,pred)

Data Crawler: webpage
Use BeautifulSoup and urllibimport urllib2from bs4 import BeautifulSoupimport unicodedataimport requestsopener = urllib2.build_opener()opener.addheaders =[('User-agent', 'Mozilla/5.0')]var = "ArvindKejriwal"#var = raw_input("Enter your Twitter id: ")print "Tweets of", varf=open(var+".txt","w")url = "https://twitter.com/"+var#ur=opener.open(url).read()ur=requests.get(url).text.encode('utf-8')

Data Crawler: webpage
soup = BeautifulSoup(ur)#what = soup.get_text()print soup.title.stringf.write("%s\n"%(soup.title.string))z=""for item in soup.find_all('p',{'class':'TweetTextSize TweetTextSize--16px js-tweet-text tweet-text'}):
try:item=item.text.lower().rstrip()new_str = unicodedata.normalize("NFKD", item)z=z+new_strf.write(z+"\n\n")z=""
except:pass
f.close()


![Regression(1) · Regression(1) February 7, 2019 0.1 Linear Regression: y = mx +c In [16]: import numpy as np from matplotlib.pyplot import * import matplotlib.pyplot as plt x = np.random.normal(3,1,1000)](https://static.fdocuments.net/doc/165x107/5f8da658de8bca5fbd2ac650/regression1-regression1-february-7-2019-01-linear-regression-y-mx-c-in.jpg)

![Numpy - Nicholas Dwork · Arrays An array is an ordered set of numbers import numpy as np array1 = np.array( [2 1 4] ) # makes array with values array2 = np.ndarray( [5,4] ) # makes](https://static.fdocuments.net/doc/165x107/6053d7a7bd1b4f4dd10f79db/numpy-nicholas-arrays-an-array-is-an-ordered-set-of-numbers-import-numpy-as-np.jpg)


