Pulse oximetry in the oesophagus · PDF filePulse oximetry in the oesophagus ... yet the title...
35
INSTITUTE OF PHYSICS PUBLISHING PHYSIOLOGICAL MEASUREMENT Physiol. Meas. 27 (2006) R1–R35 doi:10.1088/0967-3334/27/1/R01 TOPICAL REVIEW Pulse oximetry in the oesophagus P A Kyriacou School of Engineering and Mathematical Sciences, City University, London EC1V 0HB, UK E-mail: [email protected] Received 27 July 2005, accepted for publication 31 August 2005 Published 29 November 2005 Online at stacks.iop.org/PM/27/R1 Abstract Pulse oximetry has been one of the most significant technological advances in clinical monitoring in the last two decades. Pulse oximetry is a non- invasive photometric technique that provides information about the arterial blood oxygen saturation (SpO 2 ) and heart rate, and has widespread clinical applications. When peripheral perfusion is poor, as in states of hypovolaemia, hypothermia and vasoconstriction, oxygenation readings become unreliable or cease. The problem arises because conventional pulse oximetry sensors must be attached to the most peripheral parts of the body, such as finger, ear or toe, where pulsatile flow is most easily compromised. Since central blood flow may be preferentially preserved, this review explores a new alternative site, the oesophagus, for monitoring blood oxygen saturation by pulse oximetry. This review article presents the basic physics, technology and applications of pulse oximetry including photoplethysmography. The limitations of this technique are also discussed leading to the proposed development of the oesophageal pulse oximeter. In the majority, the report will be focused on the description of a new oesophageal photoplethysmographic/SpO 2 probe, which was developed to investigate the suitability of the oesophagus as an alternative monitoring site for the continuous measurement of SpO 2 in cases of poor peripheral circulation. The article concludes with a review of reported clinical investigations of the oesophageal pulse oximeter. Keywords: pulse oximetry, photoplethysmography, perfusion, oesophagus 1. Introduction Pulse oximetry has been one of the most significant technological advances in clinical monitoring in the last two decades (Alexander et al 1989, Bowes et al 1989, Anonymous 2003, Tremper and Barker 1989, Welch 2005). Pulse oximetry is a non-invasive photometric technique that provides information about the arterial blood oxygen saturation (SpO 2 ) and 0967-3334/06/010001+35$30.00 © 2006 IOP Publishing Ltd Printed in the UK R1
Transcript of Pulse oximetry in the oesophagus · PDF filePulse oximetry in the oesophagus ... yet the title...

INSTITUTE OF PHYSICS PUBLISHING PHYSIOLOGICAL MEASUREMENT
Physiol. Meas. 27 (2006) R1–R35 doi:10.1088/0967-3334/27/1/R01
TOPICAL REVIEW
Pulse oximetry in the oesophagus
P A Kyriacou
School of Engineering and Mathematical Sciences, City University, London EC1V 0HB, UK
E-mail: [email protected]
Received 27 July 2005, accepted for publication 31 August 2005Published 29 November 2005Online at stacks.iop.org/PM/27/R1
AbstractPulse oximetry has been one of the most significant technological advancesin clinical monitoring in the last two decades. Pulse oximetry is a non-invasive photometric technique that provides information about the arterialblood oxygen saturation (SpO2) and heart rate, and has widespread clinicalapplications. When peripheral perfusion is poor, as in states of hypovolaemia,hypothermia and vasoconstriction, oxygenation readings become unreliable orcease. The problem arises because conventional pulse oximetry sensors mustbe attached to the most peripheral parts of the body, such as finger, ear or toe,where pulsatile flow is most easily compromised. Since central blood flowmay be preferentially preserved, this review explores a new alternative site, theoesophagus, for monitoring blood oxygen saturation by pulse oximetry. Thisreview article presents the basic physics, technology and applications of pulseoximetry including photoplethysmography. The limitations of this techniqueare also discussed leading to the proposed development of the oesophagealpulse oximeter. In the majority, the report will be focused on the description ofa new oesophageal photoplethysmographic/SpO2 probe, which was developedto investigate the suitability of the oesophagus as an alternative monitoring sitefor the continuous measurement of SpO2 in cases of poor peripheral circulation.The article concludes with a review of reported clinical investigations of theoesophageal pulse oximeter.
Keywords: pulse oximetry, photoplethysmography, perfusion, oesophagus
1. Introduction
Pulse oximetry has been one of the most significant technological advances in clinicalmonitoring in the last two decades (Alexander et al 1989, Bowes et al 1989, Anonymous2003, Tremper and Barker 1989, Welch 2005). Pulse oximetry is a non-invasive photometrictechnique that provides information about the arterial blood oxygen saturation (SpO2) and
0967-3334/06/010001+35$30.00 © 2006 IOP Publishing Ltd Printed in the UK R1

R2 Topical Review
heart rate, and has widespread clinical applications. The use of pulse oximeters has beendescribed in many settings: hospital, outpatient, domiciliary use and in veterinary clinics.In the early 1990s pulse oximetry became a mandated international standard for monitoringduring anaesthesia following the publication in 1986 of the Harvard minimum standards formonitoring. Kelleher (1989) reviewed 220 references in an article published in 1989. In afollow-up review in 1992, Severinghaus and Kelleher (1992) found more than 500 new reportsbetween 1989 and October 1991. Nearly 5000 further reports on pulse oximetry have beenpublished since October 1991.
Although generally reliable, pulse oximeters do fail, in particular, in patients undergoingprolonged procedures such as cardiac, vascular, reconstructive or neuro-surgery, at just the timewhen the measurement of blood oxygen saturation would be clinically of most value (Ralstonet al 1991, Reich et al 1996). Many of their limitations, both physiological and technical,will be discussed in this review. The hypothesis underlying this review is that a more centralsite, such as the oesophagus, will remain adequately perfused in the above-mentioned clinicalsituations, giving the possibility of monitoring SpO2 at the oesophagus when conventionalperipheral oximetry fails.
This review will first outline the basic physics, technology and applications of pulseoximetry including photoplethysmography. The limitations of this technique are also discussedleading to the proposed development of the oesophageal pulse oximeter. In the majority, thereport will be focused on the description of a new oesophageal photoplethysmographic/SpO2
probe, which was developed to investigate the suitability of the oesophagus as an alternativemonitoring site for the continuous measurement of SpO2 in cases of poor peripheral circulation.The technological developments of such a pulse oximeter and the results from clinicalinvestigations will be presented.
2. Photoplethysmography and pulse oximetry
Photoplethysmography is a non-invasive optical technique widely used in the study andmonitoring of the pulsations associated with changes in blood volume in a peripheral vascularbed (Roberts 1982, Dorlas and Nijboer 1985, Higgins and Fronek 1986, Lindberg andOberg 1991). Whether the term ‘plethysmography’ is a misnomer is a matter of debate,yet the title has received general consent. Challoner (1979) made an excellent review ofphotoplethysmography. As discussed in Challoner’s review, Hertzman in 1937 first coinedthe term plethysmograph. It was pointed out above that there is not total agreement that thisis a strictly accurate name. An etymological definition would suggest that a plethysmographrecords volume; thus, volumetric changes are recorded in the blood vessels of an organ.However, whether photoplethysmography measures only blood volume changes is open toquestion. The origin of the photoplethysmographic (PPG) signal has been the subject ofcontinuing debate (Challoner 1979, Roberts 1982).
In photoplethysmography the emitted light, which is made to transverse the skin, isreflected, absorbed and scattered in the tissue and blood. The modulated light level whichemerges, is measured using a suitable photodetector. It is possible for the hand or fingerto be directly transilluminated where the light source, usually in the region of 800 nm to960 nm, is on one side of the skin and the detector on the other side. This method, alsocalled transmission mode, is limited to areas such as the finger, the ear lobe or the toe (Nijboeret al 1981, Mendelson and Ochs 1988). However, when light is directed down into the skin aproportion of this is backscattered so that it emerges from the skin adjacent to the light source.The light source and the photodetector can be positioned side by side. This method, alsocalled the reflection mode, allows measurements on virtually any skin area (Nijboer et al 1981,

Topical Review R3
Figure 1. Photoplethysmographic (PPG) waveform as measured by transmission through tissue.
Mendelson and Ochs 1988). The intensity of the transmitted or reflected light which reachesthe photodetector is measured and the variations in the photodetector current are assumedto be related to blood volume changes underneath the probe (Nijboer et al 1981, Roberts1982). These variations are electronically amplified and recorded as a voltage signal calledthe photoplethysmograph. The photoplethysmographic signal (figure 1) is divided into twocomponents:
(i) A dc PPG component, a relatively constant voltage offset of which the magnitude isdetermined by the nature of the material through which the tissue passes (skin, cartilage,venous blood, etc).
(ii) A pulsatile or ac PPG component synchronous with the heart rate is often assumed tobe related to the arterial blood volume pulse. The ac PPG pulse shapes are indicative ofvessel compliance and cardiac performance.
Pulse oximeters, as will be discussed in more detail in the following sections, estimatearterial blood oxygen saturation by shining light at two different wavelengths, red and infrared,through vascular tissue. In this method, the ac pulsatile PPG signal associated with cardiaccontraction is assumed attributable solely to the arterial blood component. The amplitudesof the red and infrared ac PPG signals are sensitive to changes in arterial oxygen saturationbecause of differences in the light absorption of oxygenated and deoxygenated haemoglobinat these two wavelengths. From the ratios of these amplitudes, and the corresponding dcphotoplethysmographic components, arterial blood oxygen saturation (SpO2) is estimated.Hence, the technique of pulse oximetry relies on the presence of adequate peripheral arterialpulsations, which are detected as photoplethysmographic signals (Mendelson and Ochs 1988,Webster 1997).
3. Physics and technology of pulse oximetry
Theoretical descriptions of pulse oximetry often begin with a discussion of the Beer–Lambertlaw of light absorption (Webster 1997). It is beyond the scope of this review to describe indetail the Beer and Lambert approach, as it has been discussed and explained in detail inthe literature (Webster 1997). It will be useful though to note that by itself this approach isincomplete, as it does not adequately account for the effects of a physical phenomenon calledlight scattering present within the tissue region under investigation. Biological tissue is ahighly light-scattering medium and little information about its optical properties is available
R4 Topical Review
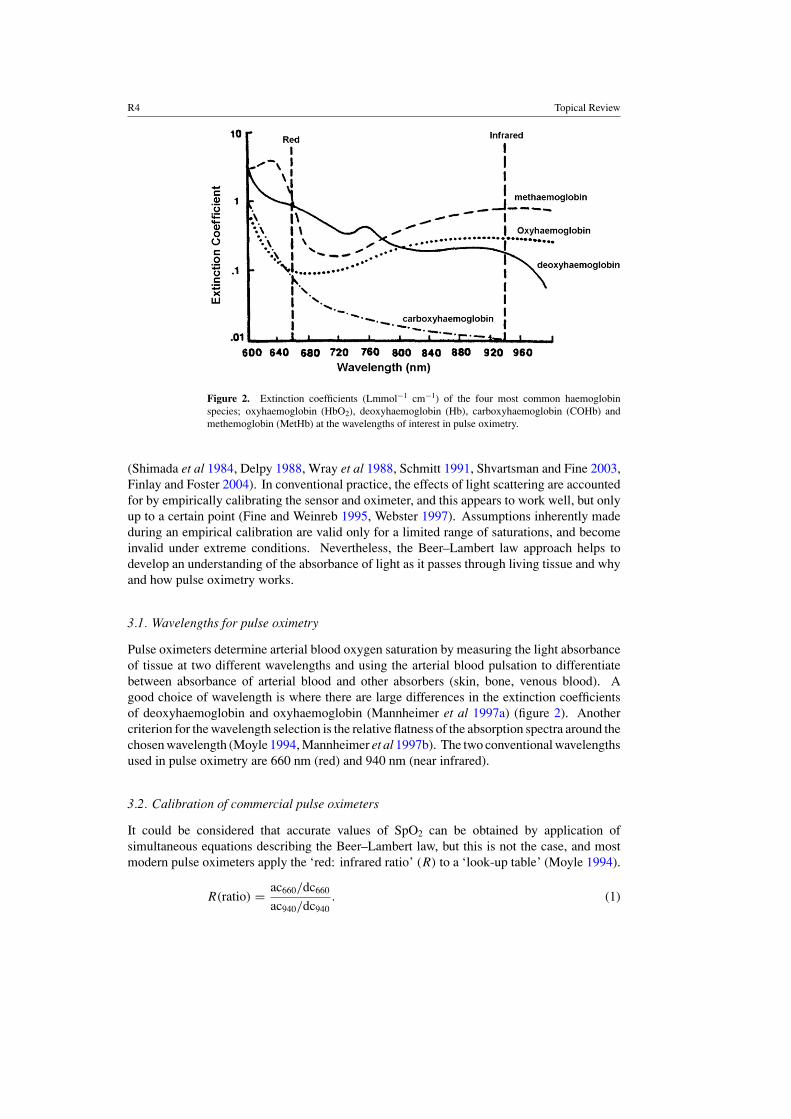
Figure 2. Extinction coefficients (Lmmol−1 cm−1) of the four most common haemoglobinspecies; oxyhaemoglobin (HbO2), deoxyhaemoglobin (Hb), carboxyhaemoglobin (COHb) andmethemoglobin (MetHb) at the wavelengths of interest in pulse oximetry.
(Shimada et al 1984, Delpy 1988, Wray et al 1988, Schmitt 1991, Shvartsman and Fine 2003,Finlay and Foster 2004). In conventional practice, the effects of light scattering are accountedfor by empirically calibrating the sensor and oximeter, and this appears to work well, but onlyup to a certain point (Fine and Weinreb 1995, Webster 1997). Assumptions inherently madeduring an empirical calibration are valid only for a limited range of saturations, and becomeinvalid under extreme conditions. Nevertheless, the Beer–Lambert law approach helps todevelop an understanding of the absorbance of light as it passes through living tissue and whyand how pulse oximetry works.
3.1. Wavelengths for pulse oximetry
Pulse oximeters determine arterial blood oxygen saturation by measuring the light absorbanceof tissue at two different wavelengths and using the arterial blood pulsation to differentiatebetween absorbance of arterial blood and other absorbers (skin, bone, venous blood). Agood choice of wavelength is where there are large differences in the extinction coefficientsof deoxyhaemoglobin and oxyhaemoglobin (Mannheimer et al 1997a) (figure 2). Anothercriterion for the wavelength selection is the relative flatness of the absorption spectra around thechosen wavelength (Moyle 1994, Mannheimer et al 1997b). The two conventional wavelengthsused in pulse oximetry are 660 nm (red) and 940 nm (near infrared).
3.2. Calibration of commercial pulse oximeters
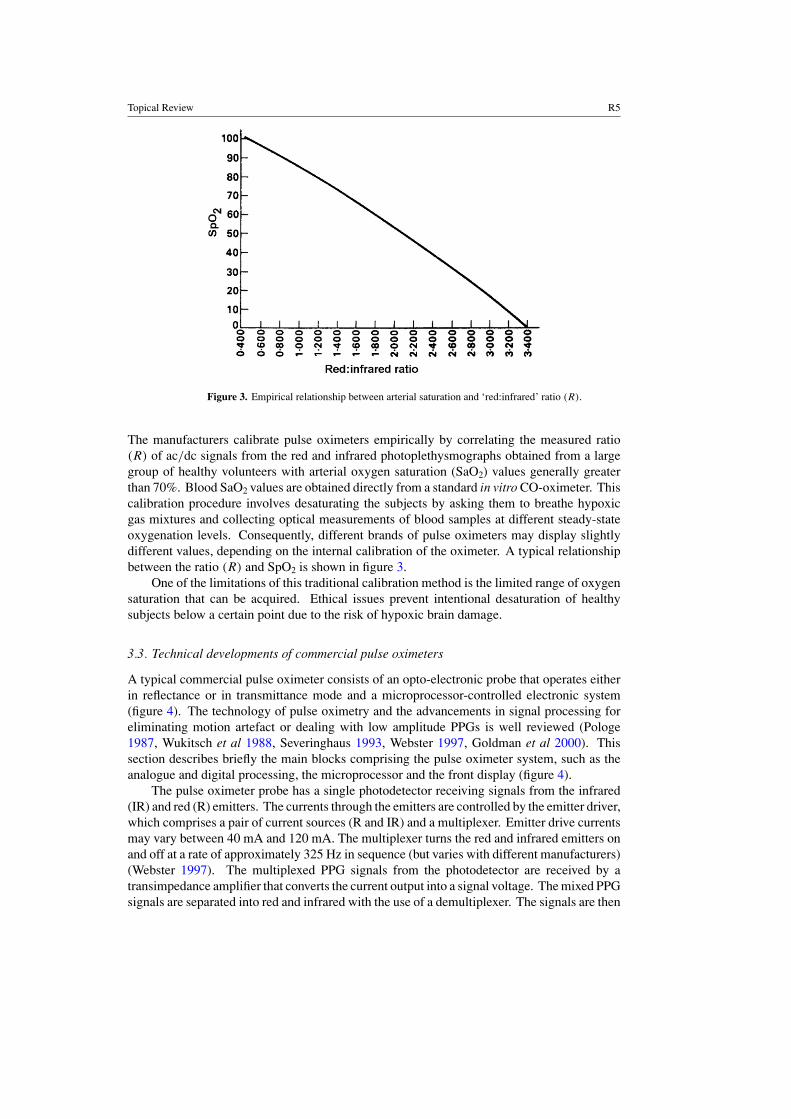
It could be considered that accurate values of SpO2 can be obtained by application ofsimultaneous equations describing the Beer–Lambert law, but this is not the case, and mostmodern pulse oximeters apply the ‘red: infrared ratio’ (R) to a ‘look-up table’ (Moyle 1994).
R(ratio) = ac660/dc660
ac940/dc940. (1)
Topical Review R5
Figure 3. Empirical relationship between arterial saturation and ‘red:infrared’ ratio (R).
The manufacturers calibrate pulse oximeters empirically by correlating the measured ratio(R) of ac/dc signals from the red and infrared photoplethysmographs obtained from a largegroup of healthy volunteers with arterial oxygen saturation (SaO2) values generally greaterthan 70%. Blood SaO2 values are obtained directly from a standard in vitro CO-oximeter. Thiscalibration procedure involves desaturating the subjects by asking them to breathe hypoxicgas mixtures and collecting optical measurements of blood samples at different steady-stateoxygenation levels. Consequently, different brands of pulse oximeters may display slightlydifferent values, depending on the internal calibration of the oximeter. A typical relationshipbetween the ratio (R) and SpO2 is shown in figure 3.
One of the limitations of this traditional calibration method is the limited range of oxygensaturation that can be acquired. Ethical issues prevent intentional desaturation of healthysubjects below a certain point due to the risk of hypoxic brain damage.
3.3. Technical developments of commercial pulse oximeters
A typical commercial pulse oximeter consists of an opto-electronic probe that operates eitherin reflectance or in transmittance mode and a microprocessor-controlled electronic system(figure 4). The technology of pulse oximetry and the advancements in signal processing foreliminating motion artefact or dealing with low amplitude PPGs is well reviewed (Pologe1987, Wukitsch et al 1988, Severinghaus 1993, Webster 1997, Goldman et al 2000). Thissection describes briefly the main blocks comprising the pulse oximeter system, such as theanalogue and digital processing, the microprocessor and the front display (figure 4).
The pulse oximeter probe has a single photodetector receiving signals from the infrared(IR) and red (R) emitters. The currents through the emitters are controlled by the emitter driver,which comprises a pair of current sources (R and IR) and a multiplexer. Emitter drive currentsmay vary between 40 mA and 120 mA. The multiplexer turns the red and infrared emitters onand off at a rate of approximately 325 Hz in sequence (but varies with different manufacturers)(Webster 1997). The multiplexed PPG signals from the photodetector are received by atransimpedance amplifier that converts the current output into a signal voltage. The mixed PPGsignals are separated into red and infrared with the use of a demultiplexer. The signals are then

R6 Topical Review
Infrared(940nm)
Red(660nm)
Photodetector
transimpedanceamplifier
Demultiplexer
Emitter Driver
Timing signal
Infrared
ADC
Red
MIC
RO
PR
OC
ES
SO
R
Digital displaySpO2
Heart rate
Multiplexer
Currentsource
R
Currentsource
R
Figure 4. Basic block diagram of a commercial transmission mode pulse oximeter.
converted by an analogue-to-digital converter (ADC) into a form suitable for manipulation bythe microprocessor. The digitized information is processed by the microprocessor to computethe blood oxygen saturation from the ratio (R) derived from the signal at the red wavelengthcompared with the signal at the infrared wavelength. Pulse oximeters usually display bloodoxygen saturation (SpO2) in per cent together with heart rate, and photoplethysmograph.
4. Pulse oximeter probes and their applications
4.1. Pulse oximetry probes
The probe of the original pulse oximeter as described by Yoshiya et al (1980) was based ona bulky fibre optic cable. The fibre optic cable in this implementation was used only as aguide to conduct light from a quartz halogen lamp to the remote measurement side and toconduct the light transmitted through the tissue back to the photodetector. The light sourceand the photodetector were both housed inside the oximeter. Narrow-bandpass interferenceoptical filters were used in combination with a mechanical chopper to select properly the redand infrared wavelengths (Mendelson 1992). An improved design of a non-invasive pulseoximeter probe was introduced in the United States in the early 1980s (figure 5).
This much simpler design, which dominates most of the commercial pulse oximetersnowadays, consists of a pair of small red and infrared emitters and a single highly sensitivesilicon photodetector mounted inside either a reusable spring loaded clip (figure 5), or adisposable adhesive wrap (Mendelson 1992). A flexible cable connecting the probe and thepulse oximeter unit carries electric power to the emitters and the signal from the photodetector.A synopsis of different types of pulse oximetry probes used today in the clinical setting ispresented below.
4.1.1. MRI probes. When a pulse oximeter is used during magnetic resonance imaging(MRI), the very high magnetic field strengths involved with this imaging modality maygive erroneous readings or no readings at all (Wahr et al 1995). To overcome theproblem manufacturers have produced pulse oximeters where all of the electronic and opticalcomponents are in the housing of the main unit. The light energy is directed to and from thepatient by optical fibres. The complete pulse oximeter is kept beyond the influence of themagnetic field (approximately 3 m) of the MRI scanner (Webster 1997).

Topical Review R7
Figure 5. Typical reusable spring loaded clip pulse oximetry probe.
4.1.2. Foetal probes. This is an area of continued research since no probe yet is used inroutine foetal monitoring (Dildy et al 1994, Dildy 2004). Several designs of foetal pulseoximetry probes have been developed over the last few years. The probes are guided into thecervix and must be placed beyond the presenting part and the transcervical region (just beyondthe cervix). The probe is placed on the temple of the foetus and therefore has less interferencefrom hair (Webster 1997).
4.1.3. Reusable probes. Generally, all probes with nonadhesive or disposable adhesivesensors are reusable probes. The main advantage of reusable pulse oximetry probes is the lowuse cost involved. However, reusable probes require cleaning between patients to minimizethe risk of cross contamination (Kelleher 1989).
4.1.4. Disposable probes. In the past few years, many pulse oximeter manufacturers haveproduced disposable probes. One of the advantages of disposable probes is the elimination ofany form of cross contamination between patients since disposable probes are used on a singlepatient.
4.2. Applications of pulse oximetry
Pulse oximeters, as has been discussed above, are non-invasive, easy to use and readilyavailable. Due to these characteristics, they have an abundance of clinical applications. Thismay be seen as an overstatement, but as more and more pulse oximeters are coming in use,more and more hypoxaemic events are being seen as precursors of pathological events. Someof the main areas in which they are used are anaesthesia, patient transport, childbirth, neonataland paediatric care, dentistry and oral surgery, sleep studies and many other applications.Some of them are described briefly.
4.2.1. Anaesthesia. The pulse oximeter is most often and most importantly used whenanaesthesia is given. Several studies have shown that desaturation is often a problem

R8 Topical Review
during induction of anaesthesia (Drummond and Park 1984). This is the most criticaltime of general anaesthetic because of the side effects of the induction agents, onset ofneuromuscular blockade, loss of protective reflexes, mechanical problems with the airway,respiratory depression and problems with tracheal intubation.
4.2.2. Emergency medicine. Anaesthetists were quick to see the enormous benefit to thesafety of the patient of using pulse oximeters, and doctors, nurses and medical techniciansinvolved in emergency care soon recognized the advantage of pulse oximetry (Lambert andCrinnion 1989). A retrospective study by Anderson et al (1988) showed that failure torecognize hypoxaemia has been identified as one of the major avoidable causes of deathin trauma patients. Pulse oximeters are now regularly used in accident and emergencydepartments and in the pre-hospital care of the sick and injured.
4.2.3. Postoperative recovery. The period between the end of surgery and when the patientis fully conscious is often when hypoxaemia is most likely to go unnoticed. The greatest riskduring this period is respiratory failure. For these reasons the pulse oximeter must be usedregularly in the postoperative recovery phase (Tyler et al 1985, Pullerits et al 1987, Kelleher1989, Moyle 1994).
4.2.4. Childbirth. The process of labour and delivery is a stressful time for both the motherand the foetus. If the foetus does not have sufficient metabolic reserve to withstand thisordeal, it is at risk of hypoxia and of sustaining subsequent brain damage (Minnich et al 1990).Many difficulties have been encountered when attempting to monitor foetal pulse oximetry.The obvious problem is that the foetus is not accessible. The potential application of pulseoximetry to foetal monitoring during labour has been demonstrated by several groups (Gardosiet al 1991, Klauser et al 2005).
4.2.5. Neonatal and paediatric care. Low and high arterial oxygen levels can both bedamaging to newborn infants. Infants who are hypoxic may develop organ damage, andhypoxia may also cause pulmonary hypertension (Moyle 1996). The great concern of neonatalpaediatricians is to prevent retinopathy of prematurity, which is caused by high levels of retinaloxygenation and may lead to blindness (Moyle 1994). It is, therefore, essential to monitoraccurately the oxygen levels of sick and premature newborn infants.
4.2.6. Dentistry and oral surgery. Many papers have recommended the use of pulse oximetryduring general anaesthesia for dental procedures, pointing out that pulse oximeters should beapplied to all patients even for short procedures (Hovagim et al 1989).
4.2.7. Sleep studies and exercise. Many people become desaturated during sleep or heavyexercise. The cause of desaturation during sleep is due to a disorder known as sleep apnoea(Webster 1997). Desaturation can occur during heavy exercise due to poor ventilation orchronic obstructive pulmonary disease (COPD). The use of pulse oximetry during sleep andexercise aids in the diagnosis of these respiratory problems (Trang et al 2004).
4.3. Future applications of pulse oximetry
Although pulse oximetry seems to be at the peak of its development, there is always roomfor further improvement and optimization. Many of these improvements relate to specific
Topical Review R9
applications. Improvements, which will increase the performance of pulse oximetry duringtransport, are to lengthen the battery life in portable units. Reducing the occurrence of falsealarms would be beneficial in all applications, but especially during long-term monitoring whenstaff cannot always be in the room. The application of foetal pulse oximetry is an excitingon-going research by many groups (Dildy 2001, Reuss 2004). In this unique application,sensor attachment to the foetal scalp must be improved. Other potential applications of pulseoximetry have been suggested for monitoring oxygen saturation via the retinal fundus in theeye (De Kock et al 1993, Nelson et al 2005). The direct application of pulse oximetry toan organ, such as the liver, the kidney, the gut or the colon, will be a very useful applicationin determining organ SpO2, regardless if the patients SpO2 as measured from an extremity(finger) is normal (Denobile et al 1990, Yilmaz et al 1999, Crerar-Gilbert et al 2002).
5. Limitations of pulse oximeters
5.1. Calibration assumptions
Initially, the conversion from absorbancy ratios to arterial oxygen saturation as described inprevious sections is based on experimentally derived calibration curves (figure 3). Thesecurves are based on measurements in healthy young volunteers after induction of hypoxaemia(Moyle 1994, Sinex 1999). An unavoidable limitation is that pulse oximeters can only beas accurate as their empirical calibration curves. Understandably, researchers were limitedin the degree of haemoxaemia inducible in these volunteers, to a SaO2 of approximately75% to 80%. Therefore the shape of the curve (figure 3) below these levels (75% to 85%)must be extrapolated, with obvious implications for the accuracy of pulse oximetry at lowsaturation levels. Studies showed such great inaccuracy and bias at low oxygen saturation thatmanufacturers revised early calibration curves and software (Severinghaus and Naifeh 1987).More studies, however, continued to show significant bias, increasing as oxygen saturationdecreases, although it has been justifiably pointed out that few, if any, clinical treatmentdecisions will hinge on whether the oxygen saturation is actually 50% or 60% (Kelleher1989).
5.2. Dyshaemoglobinaemias
Many substances in the blood can interfere optically with pulse oximetry. This interferencegenerally takes the form of false absorbers, or components besides deoxyhaemoglobin oroxyhaemoglobin that will absorb light within the red and near-infrared wavelengths usedin pulse oximetry. The most significant potential false absorbers in the circulation arecarboxyhaemoglobin (COHb) and methaemoglobin (MetHb) (Kelleher 1989, Richardson2005). Being two-wavelength devices, pulse oximeters can only deal with two haemoglobinspecies (deoxyhaemoglobin and oxyhaemoglobin). Therefore, both COHb and MetHb willcause errors in the pulse oximeter readings (Barker and Tremper 1987, Barker et al 1989).When the presence of these Hb species is suspected, pulse oximetry should be supplementedby in vitro multiwavelength CO-oximetry.
5.3. Intravenous dyes
Intravenous dyes are known to have potentially profound effects on pulse oximetry readings,resulting in falsely low measured oxygen saturations. Methylene blue, with very highabsorbance at 660 nm, causes spurious decrease in SpO2 (Kessler et al 1986, Scheller et al1986, Sidi et al 1987).

R10 Topical Review
5.4. Anaemia
Anaemia appears to adversely affect the accuracy of pulse oximetry, although the mechanismis unclear, and it may do so only in the presence of hypoxia. In theory, anaemia shouldnot affect pulse oximetry at all, as the ratio of relative absorbances should be preserved andunchanged by changes in total haemoglobin concentration within the sample (Severinghausand Koh 1990). A study of non-hypoxic human patients with acute anaemia showed goodaccuracy with pulse oximetry (Jay et al 1994).
5.5. Skin pigmentation and nail polish
Skin pigmentation has shown variable effects on pulse oximetry (Volgyesi and Spahr-Schopfer1991, Bickler et al 2005). Primarily, dark pigmentation appears to make adequate lightpenetration more difficult, with significantly more signal detection failures. More concerningare some studies of pigmentation effects which have shown overestimation of oxygensaturation, both in models and in human subjects (Ries et al 1989). Similarly, there isevidence for the effects of nail polish on pulse oximetry, but little consensus on occurrence ordegree (Kataria and Lampkins 1986, Cote et al 1988, Chan et al 2003).
5.6. Electromagnetic interference
Electromagnetic interference (EMI) can affect the accuracy of pulse oximeters and othermedical devices. It may be generated by many sources, mostly man made but it may alsoresult from atmospheric events.
5.7. Interference due to electrocautery
Electrocautery can interfere with pulse oximetry by artifactually decreasing SpO2 readings,or by setting off false alarms (Wahr et al 1995). The cause is the wide spectrum of radiofrequency emissions picked up directly by the photodetector in the pulse oximeter probe(Block and Detko 1986). New signal extraction technology (MASIMO) claims to be moreaccurate in the presence of electrocautery (Wahr et al 1995).
5.8. Signal artefact
Most commonly, problems in pulse oximetry arise from signal artefact. Signal artefactresults from false sources of signal or from a low signal-to-noise ratio. False signal canarise from detection of non-transmitted light (ambient sources or optical shunt) or from non-arterial sources of alternating signal. A low signal-to-noise ratio results from inadequatesignal complicated by an excess of physiological or technical noise. The oximetry systemas outlined in the previous sections assumes that the sum of the light absorbed and the lighttransmitted is equal to the incident light, with no other light loss or gain affecting the detector.Ambient light, however, is potentially a major source of interference (Fluck et al 2003).Recognizing this, designers of pulse oximeters divided the emitter and detector activities intothree sensing periods, cycling at hundreds of times per second. Two of these periods use lightemitted by the emitters at each of the two incident wavelengths. In the third period neitheremitter is activated and the photodiode detector measures only ambient light, the influenceof which is subsequently eliminated from the emitter-illuminated sensing periods. However,cases of ambient light interference still occur (Hanowell et al 1987). Implicated sourcesinclude fluorescent lighting, surgical lamps, fiber optic instruments and sunlight. Covering

Topical Review R11
the probe with an opaque shield offers a simple solution. Optical shunting occurs when lightfrom the emitters reaches the photodetector without passing through an arterial bed. Thisoccurs most commonly with inappropriate probe selection, as when a digit probe is placedon the ear lobe, or with probe misplacement (Barker et al 1993, Webster 1997). In bothambient light interference and optical shunt, the result is the addition of false signal to bothwavelengths emitted (Kelleher and Ruff 1989). Non-arterial sources of alternating signalmost commonly result from motion artefact. Motion artefacts, such as during shivering,seizure activity or exercise, are usually recognized by false or erratic heart rate displays orby distorted photoplethysmographic waveforms (Severinghaus and Kelleher 1992, Hanningand Alexander-Williams 1995). When interference does occur from motion artefact it againtends to be additive into both the red and infrared wavelength channels (Pologe 1987), witha resultant absorbance ratio (R) becoming nearer to 1 and an SpO2 approaching 85% (seefigure 3).
Although different oximeter models employ different data processing, the saturationvalues acquired per second are typically averaged over a period of 2–16 s before a readingis given, serving in part to limit the impact of motion artefact (Kidd and Vickers 1989).Newly developed signal processing algorithms by MASIMO technologies have demonstratedsuccessfully that can minimize or eliminate erroneous estimation of SpO2 due to movementartefact (Goldman et al 2000).
5.9. Inadequate pulsatile signals
Apart from the physiological and technical limitations of pulse oximeters described in thisreview, they have also been reported to fail in patients with compromised peripheral perfusion(Severinghaus and Spellman 1990, Freund et al 1991, Moller et al 1993, Reich et al 1996).Pulse oximetry is a pulse-dependent technique, and any significant reduction in the amplitudeof the pulsatile component of the photoplethysmographic signal can lead to dubious values forblood oxygen saturation (SpO2) or complete failure. Hence, pulse oximeters require adequateperipheral perfusion to operate accurately. When peripheral perfusion is poor, as in statesof hypovolaemia, hypothermia and vasoconstriction, oxygenation readings become unreliableor cease (Palve and Vuori 1989, Palve 1992a, 1992b). Such clinical situations occur, forexample, after prolonged operations, especially hypothermic cardiopulmonary bypass surgery.The problem arises because conventional pulse oximetry sensors must be attached to the mostperipheral parts of the body, such as finger, ear or toe, where pulsatile flow is most easilycompromised. Measurements at sites other than the finger or ear, such as the forehead andnose, give no improvement in poorly perfused patients (Rosenberg and Pedersen 1990, Claytonet al 1991). Thus, SpO2 readings are often unobtainable at just the time when they would bemost valuable.
Therefore, the question becomes what to do in such cases, particularly those in whichthe oximeter is unable to find an adequate pulse at any of the available peripheral sites.There is, therefore, a need to find a means of solving this frustrating and serious clinicalproblem.
6. Oesophageal pulse oximetry
In an attempt to overcome the difficulties associated with conventional measurements ofarterial blood oxygen saturation during conditions of poor peripheral perfusion and pulsation,the oesophagus has been proposed as a potential measurement site on the hypothesis that

R12 Topical Review
Figure 6. The reflectance transoesophageal probe (oesophageal probe is an 18-gauge stethoscopewith a temperature sensor at the distal tip and an oximetry sensor approximately 7 cm proximally).
perfusion may be better preserved at this central site. The oesophagus is perfused directly bymain arteries. The cervical oesophagus is supplied mainly by branches of the inferior thyroidartery. The chief blood supply of the thoracic oesophagus is either by branches of the bronchialarteries, or direct from the aorta, and there are branches of the left gastric and inferior phrenicarteries running along the surface of the lower oesophagus for 2–3 cm above the diaphragm(Romanes 1972, Marieb 1992).
Atlee and Bratanow (1995) proposed to use the upper oesophagus as a measurementsite. They presented results of blood oxygen saturation measurements obtained at thecricopharyngeus muscle in the upper oesophagus (14 ± 1 cm from incisors) using a reflectance‘transoesophageal’ probe where the optical components of the oximetry sensor wereincorporated into a traditional anaesthesia oesophageal stethoscope (figure 6). Technicaldetails of the probe or processing system are not available in the literature.
Clinical studies using the ‘transoesophageal’ probe compared SpO2 measurements withsimultaneous SpO2 measurements from conventional pulse oximetry probes (Nellcor N-200:N-200F) and arterial oxygen saturation (SaO2) measurements using an in vitro CO-oximeterin 16 anaesthetized adult patients. The results showed that the ‘transoesophageal’ probeunderestimated or overestimated SpO2 values depending on the geometry of the sensor(Prielipp et al 1996, Borum 1997). Another limitation of this design was the difficultyin placing the probe accurately at the cricopharyngeus muscle, as the procedure requiredconsiderable expertise. It was also found that electrocautery interference resulted in morefrequent signal dropout and delayed signal reacquisition than for a peripheral pulse oximetryprobe. The successful use of the ‘transoesophageal’ pulse oximeter has been demonstratedin a single patient study in which peripheral oximetry was unobtainable (Borum 1997). Amore recent study (Prielipp et al 2000) used the upper oesophageal pulse oximeter in agroup of ten patients undergoing coronary bypass surgery and compared their results withtwo commercial finger pulse oximeters (Criticare 504-US and Nellcor N-200). The study,however, could not confirm that the upper oesophageal pulse oximeter was superior toconventional peripheral pulse oximeters. Vicenzi et al (2000) used the same probe on a studyof 40 severely traumatized or diseased intensive care patients. They compared SpO2 valuesfrom the upper oesophagus with those from a finger pulse oximeter (Hewlett-Packard). The

Topical Review R13
Figure 7. Reflectance oesophageal pulse oximetry probe.
authors concluded that assuming correct positioning of the ‘transoesophageal’ probe, readingsfrom the upper oesophagus were more consistent with SpO2 values from the finger pulseoximeter.
All the studies using the ‘transoesophageal’ probe did not present any investigations intothe morphology or the quality of PPG signals at the cricopharyngeus muscle or at any otherdepths within the oesophagus.
To overcome the drawbacks of the upper oesophageal pulse oximeter, and the difficultieswhich are associated with attempts to measure arterial blood oxygen saturation in the poorlyperfused peripheral circulation, Kyriacou (2001) describes a new oesophageal pulse oximetrysystem. This new system comprised a miniaturized oesophageal pulse oximeter probe and acustom made processing unit which allows the detailed investigation of photoplethysmographicsignals and SpO2 values within the whole depth of the oesophagus in healthy and critically illpatients, and this will be the subject of the following sections.
7. Technical developments of the oesophageal pulse oximeter
7.1. Oesophageal pulse oximeter probe
A new reflectance oesophageal pulse oximeter probe was constructed (Kyriacou et al 1999,2002c). This new probe comprised two infrared and two red surface mount emitters anda surface mount photodetector (figure 7). The peak emission wavelengths of the infraredand red emitters used were 880 nm and 655 nm, respectively. The oesophageal probe withattached cable was designed to fit into a plastic transparent disposable stomach/oesophagealtube (Pennine Healthcare, Derby, UK). The oesophageal tube used was a size 20 French gauge(external diameter: 6.66 mm, internal diameter: 4.66 mm, length: 780 mm, without x-raydetectable line) mainly used for gastric lavage (washout) or other gastric surgical procedures.A finger reflectance probe, optically and electronically identical to the oesophageal probe hasalso been developed to facilitate comparisons between the two sites (oesophagus and finger)(Kyriacou et al 2002c).

R14 Topical Review
Figure 8. Main block diagram of the oesophageal processing system including the identical fingerchannel.
7.2. Oesophageal processing system: hardware
A processing system was constructed to pre-process, record and display oesophageal andfinger PPG signals and estimate SpO2 values on a laptop personal computer (figure 8). Bothchannels were identical and only the oesophageal will be described.
7.2.1. Pre-isolation circuitry of the processing system. The master clock and timing generatorcircuit (figure 9) of the processing system was used to generate the timing signals for switching(ON/OFF) the red (R) and infrared (IR) emitters. These timing control signals were also usedfor synchronizing the demultiplexer that separated the mixed (red and infrared) PPG signalsat the output of the current-to-voltage (I–V ) amplifier circuit into red and infrared PPGsignals. The emitters were driven by a pair of identical constant current sources one for eachwavelength. Analogue switches were used to time multiplex the red and infrared emitters at75 Hz (Kyriacou 2001, Kyriacou et al 2002c).
The mixed PPG signal from the output of the I–V amplifier was demultiplexed to separatethe PPG signals into two independent channels (red and infrared). Low-pass filters were usedto eliminate the high frequency switching noise from the demultiplexer. The red and infraredPPG signals were then passed through the isolation barrier of the analogue isolation amplifierto the post-isolation circuitry of the processing system.

Topical Review R15
Figure 9. Oesophageal pulse oximeter processing system.
7.2.2. Post-isolation circuitry of the processing system. Two analogue isolation amplifierswere used (figure 9). The infrared and red PPG signals were split into independent channels(infrared ac and dc and red ac and dc) using active filters (Kyriacou 2001, Kyriacou et al2002c).
7.3. Oesophageal processing system: software
All PPG output signals were digitized (100 samples per second) by a 16-bit data acquisitioncard on a laptop personal computer. The digitized PPG signals were analysed by a VirtualInstrument (VI) implemented in LabVIEW (National Instruments Corporation, Austin, TX).This VI read the oesophageal and finger PPG data, converted them into a spreadsheet formatand saved them into a file specified by the user and displayed the signals in real time on thescreen of the laptop computer (Kyriacou 2001, Kyriacou et al 2002c). Algorithms were alsodeveloped in the VI for the online estimation of oesophageal SpO2. The algorithm used toestimate oesophageal SpO2 calculated the ratio (R) (see equation (1)) of the quotients of theac and dc PPG amplitudes at the red (655 nm) and infrared (880 nm) wavelengths. The ratio(R) was then used to compute the arterial oxygen saturation (SpO2) using the equation
SpO2 = 110 − 25R. (2)
This equation is a linear approximation to an empirical calibration curve established bymeasurements on a large group of healthy volunteers with arterial blood oxygen saturation(SaO2) values generally greater than 70% (Webster 1997). Figure 10 depicts a typical VIscreen of the developed oesophageal pulse oximeter processing system incorporating a fingerand an ECG channel.

R16 Topical Review
Figure 10. Virtual instrument (VI) screen of the oesophageal pulse oximetry system.
The following sections will describe the various clinical investigations performed usingthe above-described oesophageal pulse oximeter to investigate for the first time PPG signalsand SpO2 values from the whole length of the oesophagus from healthy and critically illpatients.
8. Clinical investigation 1: comparison of oesophageal and finger PPGs in healthyanaesthetized patients
8.1. Clinical method
Twenty consented healthy (ASA 1 or 2) adult patients who were to undergo tracheal intubationas a routine part of general anaesthesia were studied (Kyriacou et al 1999, Kyriacou 2001).Following induction of general anaesthesia the oesophageal probe was advanced under directvision into the oesophagus until the end of the probe was between 25 cm and 30 cm from theupper incisors (figure 11). The identical reflectance finger probe was also placed on the indexfinger of the patient.
8.2. Results
Figure 12 shows typical red and infrared ac PPG traces obtained from the middle third ofthe oesophagus and the finger of an anaesthetized patient with the mechanical ventilatortemporarily switched off (Kyriacou et al 1999). When the ventilator was switched on, the

Topical Review R17
Figure 11. The oesophageal PPG probe contained within the stomach tube is seen placed in theoesophagus via the mouth.
Figure 12. Typical PPG traces for the red and infrared wavelengths from the middle third of theoesophagus and the finger of an anaesthetized patient with the mechanical ventilator temporarilyswitched off.
oesophageal PPG traces were modulated by an artefact synchronous with the approximately5 s period of the ventilator, as shown in figure 13.
Figure 14 shows the means, standard deviations (SD) of the peak-to-peak amplitudes ofthe red and infrared ac PPGs from the oesophagus and the finger of the 20 patients studied(Kyriacou et al 1999).
Statistically significant differences were found between the PPG amplitudes in the mid-oesophagus and the PPG amplitudes at the finger at the infrared wavelength. There were

R18 Topical Review
Figure 13. PPG traces for the red and infrared wavelengths from the middle third of the oesophagusand the finger of an anaesthetized patient with the mechanical ventilator switched on.
Figure 14. Mean peak-to-peak PPG signals (±SD) at red and infrared wavelengths from themid-third of the oesophagus and the finger.
no significant differences between the PPG amplitudes in the mid-oesophagus and the PPGamplitudes at the finger at the red wavelength. The amplitudes of the oesophageal PPGs wereon average approximately three times larger than those obtained simultaneously from a fingerfor both wavelengths.

Topical Review R19
9. Clinical investigation 2: ‘PPG mapping of the oesophagus’
9.1. Clinical method
A new clinical study was performed by Kyriacou et al (2001) to investigate in more detail thequality of PPG signals within the whole length of the oesophagus. The preliminary objectiveof this study was to characterize PPGs in healthy (ASA 1) anaesthetized patients undergoinglow risk surgery and to determine whether there would be sufficient PPG amplitudes at redand infrared wavelengths throughout the oesophagus to make pulse oximetry feasible.
Thirteen adult elective surgery patients were recruited for this study. In this group ofpatients, the oesophageal probe was advanced into the oesophagus until the end of the probewas 35 cm from the upper incisors. PPG traces from the oesophagus at both wavelengths wererecorded for approximately 5 min at this depth. Measurements were repeated at 30, 25, 20and 15 cm from the upper incisors (Kyriacou et al 2001).
9.2. Results
Measurable ac PPG traces at both wavelengths were obtained in the oesophagus at all fivedepths in all patients. Figure 15 depicts typical traces from one patient for the five depths.
Figure 16 gives the mean ±SE of the ac PPG amplitudes at both wavelengths at thefive oesophageal depths for the 13 patients. The ac PPGs in the mid to lower oesophagus(depths of 20 cm or greater) have significantly larger mean amplitudes at both wavelengthsthan those in the upper oesophagus (15 cm). The maximum mean oesophageal amplitude foreach wavelength occurs at the depth of 25 cm. The mean value of the ac PPG amplitude at25 cm is a factor 4.8 higher than that at 15 cm at the infrared wavelength and a factor of 6.7higher at the red wavelength.
Statistically significant differences between the PPG amplitudes in the upper oesophagus(15 cm) and the amplitudes at all other depths at the infrared wavelength were found. Thiswas also true for the red wavelength except that there is no significant difference between theamplitudes at the depths of 15 cm and 35 cm (Kyriacou et al 2001).
10. Clinical investigation 3: oesophageal PPG signals and blood oxygen saturationmeasurements in cardiothoracic surgery patients
10.1. Clinical method
This study (Kyriacou et al 2002b, 2002c, 2003) investigated and compared oesophageal andfinger PPGs and SpO2s in patients undergoing high-risk operations, such as hypothermiccardiothoracic bypass surgery, in whom conventional pulse oximetry might fail due topoor peripheral circulation. Forty nine adult patients were recruited for this study(Kyriacou et al 2003). Having previously found (Kyriacou et al 1999, 2001) that PPGsignals in the mid oesophagus (20–25 cm from the upper lip) are of large amplitude, theoesophageal pulse oximeter probe was advanced into the oesophagus at 30 cm from thelips. Photoplethysmographic signals were observed at various depths in the oesophagusuntil the site that provided the highest amplitude PPG signals and small ventilator artefact(synchronous modulation of the oesophageal PPG traces at the frequency of the ventilator)was determined. During the oesophageal measurements, values of blood oxygen saturationfrom a commercial transmission type finger pulse oximeter (Marquette, Tram 200A; MarquetteElectronics, Milwaukee, WI) were also recorded.

R20 Topical Review
Figure 15. PPG signals at red and infrared wavelengths from five oesophageal depths. The infraredPPG trace is at the top and has the larger amplitude in each case. The amplitudes of both red andinfrared signals increase as the depth increases from 15 cm reaching a maximum at 25 cm.
Monitoring with the oesophageal pulse oximeter was performed intermittently (Kyriacouet al 2003) during the various periods of the operation (during induction of anaesthesia, priorto commencing cardiopulmonary bypass, after bypass and postoperative in the intensive careunit). During the above recording periods, samples of arterial blood were taken and analysedby an Instrumentation Laboratories IL 482 CO-oximeter or an Instrumentation Laboratories ILBG-1400 Blood Gas Analyser (BGA) (Instrumentation Laboratories, Lexington, MA, USA).

Topical Review R21
Oesophageal Depths
15.0 cm 20.0 cm 25.0 cm 30.0 cm 35.0 cm
Mea
n In
frar
ed &
Red
AC
PP
G A
mp
lidu
tes
(mV
)
0
100
200
300
400
500
600
700
800Infrared (880 nm) Red (655 nm)
Figure 16. Mean (std error) PPG peak-to-peak amplitudes at two wavelengths and five oesophagealdepths.
10.2. Results
10.2.1. Results from the investigation of PPG signals in cardiac patients. MeasurablePPG traces at red and infrared wavelengths were obtained in the oesophagus in all 49patients (Kyriacou et al 2002b). Figure 17 depicts typical traces from one patient undergoingcardiopulmonary bypass surgery during the various monitoring periods as described above(probe depth 17 cm from the lips). Figure 17(a) shows oesophageal and finger ac PPGs,obtained at both wavelengths, and ECG signals recorded prior to skin incision. The signals infigure 17(b) were recorded just before sternotomy. In figure 17(c) the signals were recordedafter the chest was open. Figure 17(d) shows the transition from before bypass to being oncardiopulmonary bypass. When the heart–lung machine was switched on (indicated in thefigure as ‘on bypass’) the pulsatile PPG signals disappeared within the next 20–25 s. TheECG trace on bypass shows a variable high frequency activity as expected. Figures 17(e) and(f) show PPG and ECG signals after bypass, during closing of the chest and postoperativelyin the intensive care unit, respectively.
The chosen oesophageal monitoring depths ranged from 14 cm to 28 cm, measured fromthe upper lip (mean ± SD: 17.8 ± 3.3 cm). The optimal oesophageal monitoring depth for eachpatient was considered the depth at which oesophageal PPGs with a good signal-to-noise ratioand acceptable ventilator artefact (synchronous modulation in the form of a sinusoidal baselineshift in time with the approximately 5 s period of the ventilatory cycle) could be obtained(Kyriacou et al 1999, 2001). The mean ± SD of the ac PPG amplitudes at both wavelengthsat the different oesophageal monitoring depths for all cardiothoracic patients were within thesame ranges as those obtained in an earlier PPG amplitude study at five oesophageal depthsin healthy anaesthetized patients (Kyriacou et al, 2001, 2002b).

R22 Topical Review
18.0
17.0
16.0
15.0
14.0
13.0
12.0
11.0
10.0
9.0
8.0
7.0
6.0
5.0
4.0
3.0
2.0
1.0
0.015 16 17 18 19 20 21 22 23 44 25
Time/s
Time/s
Time/sTime/s
V
(a)
18.0
17.0
16.0
15.0
14.0
13.0
12.0
11.0
10.0
9.0
8.0
7.0
6.0
5.0
4.0
3.0
2.0
1.0
0.026 27 28 29 30 31 32 33 34 35 36
Time/s
V
18.0
17.0
16.0
15.0
14.0
13.0
12.0
11.0
10.0
9.0
8.0
7.0
6.0
5.0
4.0
3.0
2.0
1.0
0.022 23 24 25 26 2827 29 30 31 32
V
18.0
17.0
16.0
15.0
14.0
13.0
12.0
11.0
10.0
9.0
8.0
7.0
6.0
5.0
4.0
3.0
2.0
1.0
0.000 05 10 15 20 25 30 35 40
V
(c) (d)
(f)(e)
18.0
17.0
16.0
15.0
14.0
13.0
12.0
11.0
10.0
9.0
8.0
7.0
6.0
5.0
4.0
3.0
2.0
1.0
0.017 18 19 20 21 22 23 24 25 26 27
Time/s
V
18.0
17.0
16.0
15.0
14.0
13.0
12.0
11.0
10.0
9.0
8.0
7.0
6.0
5.0
4.0
3.0
2.0
1.0
0.0
16 17 18 19 20 21 22 23 24 25 26
V
(b)
Figure 17. Oesophageal, finger and ECG traces obtained from an anaesthetized patient undergoingcardiopulmonary bypass surgery (probe depth 17 cm from lips): (a) prior to skin incision,(b) in operating theatre before sternotomy, (c) after sternotomy, (d) during bypass transition (beforebypass, on bypass), (e) closing the chest, (f) in intensive care unit. O/IR/AC—oesophageal infraredac PPG, O/R/AC—oesophageal red ac PPG, F/IR/AC—finger infrared ac PPG, F/R/AC—fingerred ac PPG.

Topical Review R23
Blood Gas Analysis SaO2%90 92 94 96 98 100
Oes
op
hag
eal S
pO
2%
90
92
94
96
98
100
Figure 18. Plot of SpO2 measurements obtained from the oesophageal pulse oximeter (OES SpO2)against SaO2 from blood gas analysis (BGA SaO2) for 49 patients. The solid line represents thebest fit linear regression line: (OES SpO2) = 12.3 + 0.88 (BGA SaO2), r2 = 0.74, SEE = 0.86,n = 155, p < 0.001. The dashed line represents identity.
10.2.2. Comparisons of blood oxygen saturation measurements from the oesophageal andcommercial finger pulse oximeters with those from blood gas analysis. A total of 155 sets ofdata points from the 49 patients were used for the regression analysis (Kyriacou et al 200c). Aplot of SpO2 readings obtained from the reflectance oesophageal pulse oximeter (OES SpO2)against the SaO2 values from the blood gas analyser (BGA SaO2) is shown in figure 18. Theequation of the best fit linear regression line is: (OES SpO2) = 12.3 + 0.88 (BGA SaO2)(the solid line in figure 18); r2 = 0.74; standard error of estimate (SEE) = 0.86; p < 0.001.The dashed line represents the line of identity. The median (interquartile range [range]) ofthe differences between the blood oxygen saturation values obtained with the oesophagealpulse oximeter and those obtained from blood gas analysis (OES SpO2 − BGA SaO2) is 0.00(−0.30, 0.3 [7.07]).
Figure 19 shows a plot of SpO2 readings obtained from the commercial finger pulseoximeter (CF SpO2) against the SaO2 values from the blood gas analyser. The equation of thebest fit linear regression line was: (CF SpO2) = 26.8 + 0.73 (BGA SaO2); r2 = 0.39; SEE =1.48; p < 0.001. The dashed line represents the equal value line. The median (interquartilerange [range]) of the differences between the blood gas analyser and the commercial fingerpulse oximeter results (BGA SaO2 − CF SpO2) is 0.10 (−0.40, 1.07 [10.60]).
10.2.3. Comparisons of blood oxygen saturation measurements from the oesophageal andcommercial finger pulse oximeter with those from CO-oximetry. In a subset of 17 patients,arterial blood was also analysed by CO-oximetry, providing 36 sets of data for regressionanalysis.
A plot of oesophageal SpO2 readings against the SaO2 values from the CO-oximeter isshown in figure 20. The equation of the best fit linear regression line is: (OES SpO2) = 10.1 +1.1 (CO-ox SaO2) (the solid line in figure 20); r2 = 0.83; SEE = 0.71; p < 0.001. Thedashed line represents the equal value line. The mean (± SD) of the differences between theoesophageal pulse oximeter SpO2 values and the corresponding CO-oximeter readings (OESSpO2 − CO-ox SaO2) is 0.73 ± 0.72%.

R24 Topical Review
Blood Gas Analysis SaO2%90 92 94 96 98 100
Co
mm
erci
al F
ing
er S
pO
2 %
90
92
94
96
98
100
Figure 19. Plot of SpO2 measurements obtained from the commercial finger pulse oximeter(CF SpO2) against SaO2 from blood gas analysis (BGA SaO2) for 49 patients. The solid linerepresents the best fit linear regression line: (CF SpO2) = 26.8 + 0.73 (BGA SaO2), r2 = 0.39,SEE = 1.48, n = 155, p < 0.001. The dashed line represents identity.
CO-oximetry SaO2%
90 92 94 96 98 100
Oes
op
hag
eal S
pO
2%
90
92
94
96
98
100
Figure 20. Plot of SpO2 measurements obtained from the oesophageal pulse oximeter (OES SpO2)against SaO2 from the CO-oximetry (CO-ox SaO2) for 17 patients. The solid line represents thebest fit linear regression line: (OES SpO2) = 10.1 + 1.1 (CO-ox SaO2), r2 = 0.83, SEE = 0.71,n = 36, p < 0.001. The dashed line represents identity.
Figure 21 shows a plot of commercial finger SpO2 readings against the SaO2 values fromthe CO-oximeter. The equation of the best fit linear regression line is: (CF SpO2) = 4.9 + 0.9(CO-ox SaO2); r2 = 0.55; SEE = 1.26; p < 0.001. The dashed line represents the equal valueline. The mean and standard deviation of the differences between the commercial finger pulseoximeter and the CO-oximeter readings (CF SpO2 − CO-ox SaO2) are 0.61 ± 1.23%.
Topical Review R25
CO-oximetry SaO2%90 92 94 96 98 100
Co
mm
erci
al F
ing
er S
pO
2 %
90
92
94
96
98
100
Figure 21. Plot of SpO2 measurements obtained from the commercial finger pulse oximeter(CF SpO2) against SaO2 from the CO-oximetry (CO-ox SaO2) for 17 patients. The solid linerepresents the best fit linear regression line: (CF SpO2) = 4.9 + 0.9 (CO-ox SaO2), r2 = 0.55,SEE = 1.26, n = 36, p < 0.001. The dashed line represents identity.
(CF SpO2 + OES SpO2)/2 %90 92 94 96 98 100 102
(CF
Sp
O2
- O
ES
Sp
O2)
%
-8
-6
-4
-2
0
2
4
6
Mean + 2SD
Mean
Mean - 2SD
Figure 22. The difference between blood oxygen saturation values from the commercial fingerpulse oximeter (CF SpO2) and SpO2 readings obtained from the reflectance oesophageal pulseoximeter (OES SpO2) plotted against their mean for 49 patients.
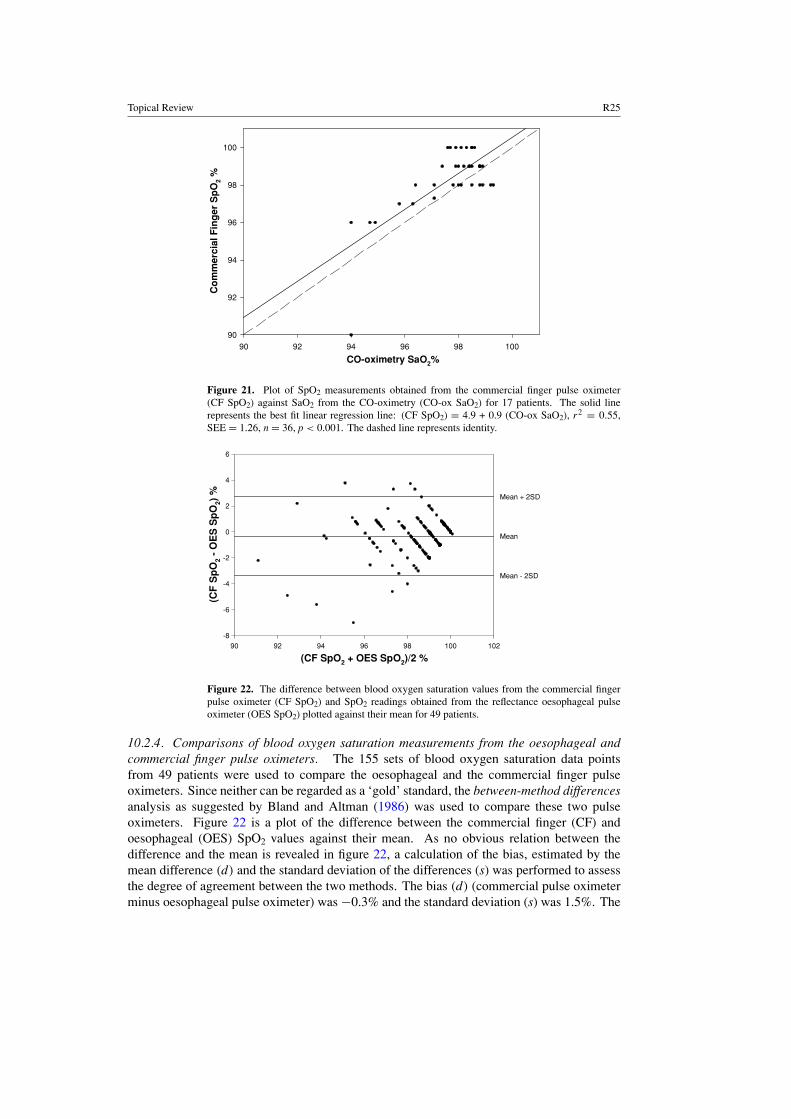
10.2.4. Comparisons of blood oxygen saturation measurements from the oesophageal andcommercial finger pulse oximeters. The 155 sets of blood oxygen saturation data pointsfrom 49 patients were used to compare the oesophageal and the commercial finger pulseoximeters. Since neither can be regarded as a ‘gold’ standard, the between-method differencesanalysis as suggested by Bland and Altman (1986) was used to compare these two pulseoximeters. Figure 22 is a plot of the difference between the commercial finger (CF) andoesophageal (OES) SpO2 values against their mean. As no obvious relation between thedifference and the mean is revealed in figure 22, a calculation of the bias, estimated by themean difference (d) and the standard deviation of the differences (s) was performed to assessthe degree of agreement between the two methods. The bias (d) (commercial pulse oximeterminus oesophageal pulse oximeter) was −0.3% and the standard deviation (s) was 1.5%. The

R26 Topical Review
Table 1. Blood oxygen saturation measurements from the oesophageal pulse oximeter and bloodgas analysis in patients in whom peripheral pulse oximetry failed.
Patients BGA SaO2% Oesophageal SpO2% Finger SpO2%
1 97.0 97.1 Failed2 97.7 97.0 Failed3 98.7 98.5 Failed
99.0 99.0 Failed4 97.9 97.9 Failed5 98.9 98.8 Failed
98.0 98.9 Failed
limits of agreement for the SpO2 data (commercial finger and oesophageal) were
d − 2s = −0.3 − (2 × 1.5) = − 3.3%d + 2s = −0.3 + (2 × 1.5) = 2.7%.
10.2.5. Failure of commercial pulse oximeter. Of the 49 patients included in the study, it wasfound that five patients (10.2%) had one or more periods of at least ten consecutive minutes,during which the commercial finger pulse oximeter failed to record pulsatile PPG signals anddisplay SpO2 values, despite being correctly positioned on the finger. The oesophageal pulseoximeter operated successfully throughout these periods of finger monitoring failure. In fourof these patients, the finger pulse oximeter failed postoperatively in the intensive care unit(within the first half hour after completion of the surgery), and in the fifth patient, the failureoccurred in the operating theatre before bypass. Results from arterial blood gas analysisperformed during these periods of failed finger pulse oximetry are shown in table 1, anddemonstrate good agreement (mean difference = 0.0%) between the oxygen saturation valuesobtained from the oesophageal pulse oximeter and the blood gas analyser.
11. Clinical investigation 4: oesophageal blood oxygen saturation measurements inburned patients
The oesophageal pulse oximeter developed by Kyriacou (2001) has also been used in a smallclinical study on burned patients (Pal et al 2005). In this group of patients, standard sitesfor monitoring SpO2 such as fingers or toes may be affected by the burn or they might beunsuitable due to the use of tourniquets during surgery. Seven patients with major burns wererecruited for the study. The total body surface area burnt ranged between 28% and 90%.
The oesophageal PPG signals recorded from this group of patients were of good qualityand large amplitude. A plot of SpO2 readings obtained from the reflectance oesophagealpulse oximeter (OES SpO2) against the SaO2 values from the CO-oximeter is shown in figure23. The equation of the best fit linear regression line is: (OES SpO2) = 33.278 + 0.666(CO-ox SaO2) (the solid line in figure 23), r2 = 0.49, standard error of estimate (SEE) = 0.64,p < 0.001. The dashed line represents the line of identity.
12. Clinical investigation 5: oesophageal pulse oximetry in neonatal and paediatricpatients
The oesophageal pulse oximeter probe developed by Kyriacou (2001) has been modified(Kyriacou et al 2002a) to fit into a conventional disposable transparent stomach tube, 12French gauge. Such a size stomach tube is used routinely in anaesthetized babies and children.

Topical Review R27
CO-ox SaO2 %
90 92 94 96 98 100
Oes
op
hag
eal S
pO
2 %
90
92
94
96
98
100
Figure 23. Plot of SpO2 measurements obtained from the oesophageal pulse oximeter against SaO2from the CO-oximetry for seven patients. The solid line represents the best fit linear regressionline: (OES SpO2) = 33.278 + 0.666 (CO-ox SaO2), r2 = 0.49, standard error of estimate(SEE) = 0.64, p < 0.001. The dashed line represents the line of identity.
Figure 24. Typical PPG traces obtained from a neonatal human oesophagus at two wavelengths,infrared (top trace) and red (bottom trace).
In this pilot study, five patients were studied in the intensive care unit (Kyriacou et al 2002a).The oesophageal SpO2 probe was advanced through the mouth to a maximum depth of 15 cmfrom the lips. During the oesophageal measurements, values of blood oxygen saturation froma commercial foot pulse oximeter were also recorded.
Measurable PPG traces of good quality were obtained in the oesophagus in all patients.Figure 24 depicts typical PPG signals from the oesophagus of a 3.2 kg, 5 day old neonate. AnAltman and Bland (1983) plot of the difference between blood oxygen saturation values fromthe commercial pulse oximeter and those from the oesophageal pulse oximeter against theirmean showed that the bias and the limits of agreement between the oesophageal and toe pulseoximeters were −0.3% and −1.7% to 1.0%.
13. Other applications of the oesophageal pulse oximeter
13.1. Introduction
The oesophageal pulse oximeter (Kyriacou 2001) has also been used to investigatephotoplethysmographic signals in human visceral organs (Crerar-Gilbert et al 2002). The

R28 Topical Review
Figure 25. Reflectance oesophageal pulse oximeter probe placed on the surface of the humanbowel.
hypothesis underlying that investigation is that blood oxygen saturation from an extremitysuch as the finger may not accurately reflect splanchnic oxygen saturation values. In manycritically ill patients, poor tissue oxygenation is due to disordered regional distribution ofblood flow, despite high global blood flow and oxygen delivery. Splanchnic ischaemia mayultimately lead to cellular hypoxia and necrosis and may well contribute to the developmentof multiple organ failure and increased mortality (Lemaire et al 1996). Rapid detection of asignificant change in tissue oxygenation could enable earlier and more successful interventionand restoration of splanchnic blood flow and should improve survival in critically ill patients(Lemaire et al 1996).
Techniques used to measure tissue oxygenation such as polarographic oxygen electrodes,luminescent oxygen probes, magnetic resonance spectroscopy and positron emissiontomography remain research tools (Lemaire et al 1996). Manual fluid tonometry for estimatingintestinal hypoxia is expensive, intermittent, operator dependent and time consuming; therecently introduced automatic device is more convenient but is even more expensive (Lemaireet al 1996). Methods such as laser Doppler, Doppler ultrasound and intravenous fluoresceinhave been previously explored to assess intestinal ischaemia in animals (Pearce et al 1987,Ferrara et al 1988, Denobile et al 1990, Macdonald et al 1993). Many of these techniquesare complex and expensive and none of them directly measures oxygenation. Therefore, thereis a need for a simple, reliable and continuous method for estimating visceral organ SpO2.Animal studies have also shown that pulse oximetry could be used to monitor intestinal oxygensaturation (Macdonald et al 1993). The feasibility of estimating blood oxygen saturation inhumans has been demonstrated by a study using a commercial transmission pulse oximeteron the colon (Ouriel et al 1988). However, there are difficulties in applying commercial pulseoximeters to measurements in abdominal human organs because the probes are unsuitable andare not easily sterilizable. Moreover, none of the currently available probes could be left inthe abdomen for prolonged postoperative monitoring.
As a preliminary to constructing a suitable pulse oximeter for monitoring abdominal organSpO2, the oesophageal pulse oximeter has been used for the measurement of PPG signals fromthe surface of the bowel, liver and kidney. The aim was to develop techniques to facilitate

Topical Review R29
Figure 26. PPG traces from simultaneous measurements at various abdominal organs (bowel,kidney and liver) and the finger.
measurements on patients with compromised splanchnic circulation, which will be useful bothintraoperatively and in intensive care.

R30 Topical Review
Organs
Bowel Liver Kidney Finger(n = 11)
Mea
n In
frar
ed &
Red
AC
PP
G A
mp
litu
des
(V
)
0.0
0.5
1.0
1.5
2.0
2.5Infrared (880 nm) Red (655 nm)
(n = 12) (n = 8) (n = 6)
Figure 27. AC peak-to-peak amplitudes, mean (± SD), at two wavelengths from the threeabdominal organs and the finger.
13.2. Clinical method
Twelve adult patients undergoing elective laparotomy under general anaesthesia were studied(Crerar-Gilbert et al 2002). The oesophageal probe was inserted into a sealed and sterilizeddisposable size 20 French gauge gastric tube. The gastric tube containing the probe was thenapplied gently to the surface of each abdominal organ so that the emitted light was reflectedfrom its surfaces (figure 25). The identical reflectance finger probe was placed on the finger ofthe patient. Simultaneous PPG traces from each abdominal organ and the finger were recordedfor approximately 2 min.
13.3. Results
Crerar-Gilbert et al (2002) reported that measurable PPG signals were always obtained fromthe surface of the bowel in all 12 patients, depending on intra-operative accessibility from theliver (eight patients) and the kidney (six patients). PPG signals with similar amplitudes andreasonably high signal-to-noise ratios were obtained from all investigated abdominal organs(figure 26). The PPG amplitudes from both hollow and solid abdominal organs were, onaverage, approximately the same as those obtained simultaneously from a finger for bothwavelengths, although there is considerable variability.
Figure 27 shows the mean peak-to-peak PPG amplitudes and standard deviations fromall investigated abdominal organs and the finger. Paired t-tests showed that there were nostatistically significant differences between the PPG amplitudes recorded from the abdominalorgans and those from the finger (Crerar-Gilbert et al 2002).
14. Conclusions
Pulse oximetry is a non-invasive photometric technique that provides information aboutthe arterial blood oxygen saturation (SpO2) and heart rate, and has widespread clinical

Topical Review R31
applications. Pulse oximeters estimate arterial oxygen saturation by shining light at twodifferent wavelengths, red and infrared, through vascular tissue. In this method, the acpulsatile photoplethysmographic (PPG) signal associated with cardiac contraction is assumedattributable solely to the arterial blood component. The amplitudes of the red and infrared acPPG signals are sensitive to changes in arterial oxygen saturation because of differences in thelight absorption of oxygenated and deoxygenated haemoglobin at these two wavelengths. Fromthe ratios of these amplitudes, and the corresponding dc photoplethysmographic components,arterial blood oxygen saturation (SpO2) is estimated.
Although generally reliable, pulse oximeters do fail in patients with compromisedperipheral perfusion. Pulse oximetry is a pulse-dependent technique, and any significantreduction in the amplitude of the pulsatile component of the photoplethysmographic signalcan lead to dubious values for blood oxygen saturation (SpO2) or complete failure. Hence,pulse oximeters require adequate peripheral perfusion to operate accurately. When peripheralperfusion is poor, as in states of hypovolaemia, hypothermia and vasoconstriction, oxygenationreadings become unreliable or cease. Such clinical situations occur, for example, afterprolonged operations such as cardiac, vascular, reconstructive or neuro-surgery. The problemarises because conventional pulse oximetry sensors must be attached to the most peripheralparts of the body, such as finger, ear or toe, where pulsatile flow is most easily compromised.The introduction of the oesophageal pulse oximeter was found to be reliable and accurate incases of poor peripheral perfusion where peripheral pulse oximeters failed to estimate oxygensaturation. These results show that in general the arterial blood circulation to the oesophagusis less subject to peripheral vasoconstriction and decreased PPG amplitudes than are theperipheral sites used for pulse oximetry such as the finger. Therefore, the human oesophagusnot only can be used as an alternative SpO2 monitoring site but also can be used as a possibleSpO2 monitoring site in cases of poor peripheral circulation where peripheral pulse oximetersfail. This novel monitoring site, the oesophagus, can also find applications in patients whohave burns or other serious injuries where the oesophagus may be the only available site forpulse oximetry monitoring. In addition, the application of the oesophageal pulse oximeter inhollow and solid abdominal organs supported the hypothesis that pulse oximetry may be usedas a blood oxygen saturation monitoring technique for abdominal organs for intraoperativeand prolonged postoperative monitoring.
In summary, the use of this novel pulse oximeter has proven for the first time that thewhole of the oesophagus is a reliable and accurate monitoring site for blood oxygen saturationin healthy patients and in sick patients in whom conventional pulse oximetry might fail due topoor peripheral circulation.
References
Alexander C M, Teller L E and Gross J B 1989 Principles of pulse oximetry: theoretical and practical considerationsAnesth. Analg. 68 368–76
Altman D G and Bland J M 1983 Measurement in medicine: the analysis of method comparison studies Statistician32 307–17
Anderson I D, Woodford M, De Dombal F T and Irving M 1988 Retrospective study of 1000 deaths from injury inEngland and Wales Br. Med. J. 296 1305–8
Anonymous 2003 Next generation pulse oximetry Health Devices 32 49–103Atlee J L and Bratanow N 1995 Comparison of surface and esophageal oximetry in man [abstract] Anesthesiology 83
A455Barker S J, Hyatt J, Shah N K and Kao Y J 1993 The effect of sensor malpositioning on pulse oximeter accuracy
during hypoxemia Anesthesiology 79 248–54Barker S J and Tremper K K 1987 The effect of carbon monoxide inhalation on pulse oximetry and transcuteneous
PO2 Anesthesiology 66 677–9

R32 Topical Review
Barker S J, Tremper K K and Hyatt J 1989 Effects of methemoglobinemia on pulse oximetry and mixed venousoximetry Anesthesiology 70 112–7
Bickler P E, Feiner J R and Severinghaus J W 2005 Effects of skin pigmentation on pulse oximeter accuracy at lowsaturation Anesthesiology 102 715–9
Bland J M and Altman D G 1986 Statistical methods for assessing agreement between two methods of clinicalmeasurement Lancet 1 307–10
Block F E and Detko G J 1986 Minimizing interference and false alarms from electrocautery in the Nellcor N-100pulse oximeter J. Clin. Monit. 2 203–5
Borum S E 1997 The successful use of transesophageal pulse oximetry in a patient in whom peripheral pulse oximetrywas unobtainable [case report] Anesth. Analg. 85 514–6
Bowes W A, Corke B C and Hulka J 1989 Pulse oximetry: a review of the theory, accuracy and clinical applicationsObstet. Gynaecol. 74 541–6
Challoner A V J 1979 Photoelectric Plethysmography for Estimating Cutaneous Blood Flow (New York: Academic)chapter 6 pp 125–51
Chan M M, Chan M M and Chan E D 2003 What is the effect of fingernail polish on pulse oximetry? Chest 1232163–4
Clayton D G, Webb R K, Ralston A C, Duthie D and Runciman W B 1991 A comparison of the performance of 20pulse oximeters under conditions of poor perfusion Anaesthesia 46 3–10
Cote C J, Goldstein E A, Fuchsman W H and Hoaglin D C 1988 The effect of nail polish on pulse oximetry Anesth.Analg. 67 683–6
Crerar-Gilbert A, Kyriacou P A, Jones D P and Langford R M 2002 Assessment of photoplethysmographic signalsfor the determination of splanchnic oxygen saturation in humans Anaesthesia 57 442–5
Delpy D T 1988 Developments in oxygen monitoring J. Biomed. Eng. 10 533–40Denobile J, Guzzetta P and Patterson K 1990 Pulse oximetry as a means of assessing bowel viability J. Surg. Res. 48
21–3De Kock J P, Tarassenko L, Glynn C J and Hill A R 1993 Reflectance pulse oximetry measurements from the retinal
fundus IEEE Trans. Biomed. Eng. 40 817–23Dildy G A 2001 Fetal pulse oximetry: current issues J. Perinat. Med. 29 5–13Dildy G A 2004 Fetal pulse oximetry: a critical appraisal Best Pract. Res. Clin. Obstet. Gynaecol. 8 477–84Dildy G A, Clark S L and Loucks C A 1994 Intrapartum fetal pulse oximetry: the effects of maternal hyperoxia on
fetal arterial oxygen saturation Am. J. Obstet. Gynecol. 171 1120–4Dorlas J C and Nijboer J A 1985 Photo-electric plethysmography as a monitoring device in anaesthesia: application
and interpretation Br. J. Anaesth. 57 524–30Drummond G B and Park G R 1984 Arterial oxygen saturation before intubation of the trachea Br. J. Anaesth. 56
987–93Ferrara J J, Dyess D L, Lasecki M, Kinsey S, Donnell C and Jurkovich G J 1988 Surface oximetry: a new method to
evaluate intestinal perfusion Am. Surg. 54 10–4Fine I and Weinreb A 1995 Multiple scattering effect in transmission pulse oximetry Med. Biol. Eng. Comput. 33
709–12Finlay J C and Foster T H 2004 Hemoglobin oxygen saturations in phantoms and in vivo from measurements of
steady-state diffuse reflectance at a single, short source–detector separation Med. Phys. 31 1949–59Fluck R R Jr, Schroeder C, Frani G, Kropf B and Engbretson B 2003 Does ambient light affect the accuracy of pulse
oximetry? Respir. Care 48 677–80Freund P R, Overand P T, Cooper J, Jacobson L, Bosse S, Walker B, Posner K L and Cheney F W 1991 A prospective
study of intraoperative pulse oximetry failure J. Clin. Monit. 7 253–8Gardosi J O, Schram C M and Symonds E M 1991 Adaptation of pulse oximetry for fetal monitoring during labour
Lancet 337 1265–7Goldman J M, Petterson M T, Kopotic R J and Barker S J 2000 Masimo signal extraction pulse oximetry J. Clin.
Monit. Comput. 16 475–83Hanning C D and Alexander-Williams J M 1995 Pulse oximetry: a practical review Br. Med. J. 311 367–70Hanowell L, Eisele J H and Downs D 1987 Ambient light affects pulse oximeters Anesthesiology 67 864–5 (letter)Higgins J L and Fronek A 1986 Photoplethysmographic evaluation of the relationship between skin reflectance and
blood volume J. Biomed. Eng. 8 130–6Hovagim A R, Vitkun S A, Manecke G R and Reiner R 1989 Arterial oxygen saturation in adult dental patients
receiving conscious sedation J. Oral Maxillofac. Surg. 47 936–9Jay G D, Hughes L and Renzi F P 1994 Pulse oximetry is accurate in acute anemia from hemorrhage Ann. Emerg.
Med. 24 32–5Kataria B K and Lampkins R 1986 Nail polish does not affect pulse oximetry saturation Anesth. Analg. 65 824 (letter)

Topical Review R33
Kelleher J F 1989 Pulse oximetry J. Clin. Monit. 5 37–62Kelleher J F and Ruff R H 1989 The penumbra effect: vasomotion-dependent pulse oximeter artifact due to probe
malposition Anesthesiology 71 787–91Kessler M R, Eide T, Humayan B and Poppers P J 1986 Spurious pulse oximeter desaturation with methylene blue
injection Anesthesiology 65 435–6Kidd J F and Vickers M D 1989 Pulse oximeters: essential monitors with limitations Br. J. Anaesth. 62 355–7Klauser C K, Christensen E E, Chauhan S P, Bufkin L and Magann E F 2005 Use of fetal pulse oximetry among
high-risk women in labor: a randomized clinical trial Am. J. Obstet. Gynecol. 192 1810–7Kyriacou P A 2001 Investigation of new electro-optical techniques for monitoring patients with compromised
peripheral perfusion in anaesthesia PhD Thesis University of LondonKyriacou P A, Moye A R, Choi D M A, Langford R M and Jones D P 2001 Investigation of the human oesophagus
as a new monitoring site for blood oxygen saturation Physiol. Meas. 22 223–32Kyriacou P A, Moye A R, Gregg A, Choi D M A, Langford R M and Jones D P 1999 A system for investigating
oesophageal photoplethysmographic signals in anaesthetised patients Med. Biol. Eng. Comput. 37 639–43Kyriacou P A, Powell S L, Jones D P and Langford R M 2003 Evaluation of oesophageal pulse oximetry in
cardiothoracic surgery patients Anaesthesia 58 422–7Kyriacou P A, Powell S, Langford R M and Jones D P 2002b Investigation of oesophageal photoplethysmographic
signals and blood oxygen saturation measurements in cardiothoracic surgery patients Physiol. Meas. 23533–45
Kyriacou P A, Powell S, Langford R M and Jones D P 2002c Esophageal pulse oximetry utilizing reflectancephotoplethysmography IEEE Trans. Biomed. Eng. 49 1360–8
Kyriacou P A, Wardhaugh A, Jones D P, Langford R M and Petros A J 2002a Investigation of photoplethysmographicsignals in neonatal and paediatric patients Intensive Care Med. 28 (Suppl. 1) S111
Lambert M A and Crinnion J 1989 The role of pulse oximetry in the accident and emergency department Arch. Emerg.Med. 6 211–5
Lemaire F et al 1996 Tissue hypoxia. How to detect, how to correct, how to prevent? Intensive Care Med. 22250–1257
Lindberg L G and Oberg P A 1991 Photoplethysmography: part 2. Influence of light source wavelength Med. Biol.Eng. Comput. 29 48–54
Macdonald P H, Dinda P K, Beck I T and Mercer C D 1993 The use of oximetry in determining intestinal blood flowSurg. Gynecol. Obstet. 176 451–8
Mannheimer P D, Casciani J R, Fein M E and Nierlich S L 1997a Wavelength selection for low-saturation pulseoximetry IEEE Trans. Biomed. Eng. 44 148–58
Mannheimer P D, Fein M E and Casciani J R 1997b Physio-optical considerations in the design of fetal pulse oximetrysensors Eur. J. Obstet. Gynecol. Reprod. Biol. 72 9–19
Marieb E N 1992 Human Anatomy and Physiology 2nd edn (Redwood City, CA: Benjamin/Cumming)Mendelson Y 1992 Pulse oximetry: theory and applications for noninvasive monitoring Clin. Chem. 38 1601–7Mendelson Y and Ochs B D 1988 Noninvasive pulse oximetry utilizing skin reflectance photoplethysmography IEEE
Trans. Biomed. Eng. 35 798–805Minnich M E, Clark R B, Miller F C and Thompson D S 1990 Oxygen desaturation in women in labor J. Reprod.
Med. 35 693–6Moller J T, Johannessen N W, Espersen R, Ravlo O, Pedersen B D, Jensen P F, Rasmussen N H, Rasmussen L S,
Pedersen T and Cooper J B 1993 Randomized evaluation of pulse oximetry in 20802 patients: II. Perioperativeevents and postoperative complications Anesthesiology 78 445–53
Moyle J T B 1994 Principles and Practice Series: Pulse Oximetry (London: BMJ Publishing Group)Moyle J T B 1996 Uses and abuses of pulse oximetry Arch. Dis. Child. 74 77–80Nelson D A, Krupsky S, Pollack A, Aloni E, Belkin M, Vanzetta I, Rosner M and Grinvald 2005 Special report:
noninvasive multi-parameter functional optical imaging of the eye Ophthal. Surg. Lasers Imaging 36 57–66Nijboer J A, Dorlas J C and Mahieu H F 1981 Photoelectric plethysmography—some fundamental aspects of the
reflection and transmission method Clin. Phys. Physiol. Meas. 2 205–15Ouriel K, Fiore W M and Geary J E 1988 Detection of occult colonic ischaemia during aortic procedures: use of an
intraoperative photoplethysmographic technique J. Vas. Surg. 7 5–9Pal S K, Kyriacou P A, Kumaran S, Fadheel S, Emamdee R, Langford R M and Jones D P 2005 Evaluation of
oesophageal reflectance pulse oximetry in major burns patients Burns 31 337–41Palve H 1992a Reflection and transmission pulse oximetry during compromised peripheral perfusion J. Clin. Monit.
8 12–5Palve H 1992b Comparison of reflection and transmission pulse oximetry after open-heart surgery Crit. Care Med.
29 48–51

R34 Topical Review
Palve H and Vuori A 1989 Pulse oximetry during low cardiac output and hypothermia states immediately after openheart surgery Crit. Care Med. 17 66–9
Pearce W H, Jones D N, Warren G H, Bartle E J, Whitehill T A and Rutherford R B 1987 The use of infraredphotoplethysmography in identifying early intestinal ischaemia Arch. Surg. 122 308–10
Pologe J A 1987 Pulse oximetry: technical aspects of machine design Int. Anesthesiol. Clin. 35 137–53Prielipp R C, Scuderi P E, Butterworth J F, Royster R L and Atlee J L 1996 Comparison of transesophageal pulse
oximetry (TEPO) with peripheral surface pulse oximetry in CABG patients [abstract] Anesthesiology 85 3APrielipp R C, Scuderi P E, Hines M H, Atlee J L and Butterworth J F 2000 Comparison of a prototype esophageal
oximetry probe with two conventional digital pulse oximetry monitors in aortocoronary bypass patients J. Clin.Monit. Comput. 16 201–9
Pullerits J, Burrows F A and Roy W L 1987 Arterial desaturation in healthy children during transfer to the recoveryroom Can. J. Anaesth. 34 470–3
Ralston A C, Webb R K and Runciman W B 1991 Potential errors in pulse oximetry: I. Pulse oximeter evaluationAnaesthesia 46 202–6
Reich D L, Imcenko A, Bodian C A, Kraidin J, Hofman J B, Deperio M, Konstadt S N, Kurki T and Eisenkraft J B1996 Predictors of pulse oximetry data failure Anesthesiology 84 859–64
Reuss J L 2004 Factors influencing fetal pulse oximetry performance J. Clin. Monit. Comput. 8 13–24Richardson T 2005 Methemoglobinemia and pulse oximetry Resp. Care 50 386Ries A L, Prewitt L M and Johnson J J 1989 Skin color and ear oximetry Chest 96 287–90Roberts V C 1982 Photoplethysmography—fundamental aspects of the optical properties of blood in motion Trans.
Inst. M C 4 101–6Romanes G J 1972 Cunninghamn’s Textbook of Anatomy (London: Oxford University Press)Rosenberg J and Pedersen M H 1990 Nasal pulse oximetry overestimates oxygen saturation Anaesthesia 45 1070–1Scheller M S, Unger R J and Kelner M J 1986 Effects of intravenously administered dyes on pulse oximeter readings
Anesthesiology 65 550–2Schmitt J M 1991 Simple photon diffusion analysis of the effects of multiple scattering on pulse oximetry IEEE Trans.
Biomed. Eng. 38 1194–203Severinghaus J W 1993 History and recent developments in pulse oximetry Scand. J. Clin. Lab. Invest. Suppl. 214
105–11Severinghaus J W and Kelleher J F 1992 Recent developments in pulse oximetry Anesthesiology 76 1018–38Severinghaus J W and Koh S O 1990 Effect of anemia on pulse oximeter accuracy at low saturations J. Clin. Monit.
6 85–8Severinghaus J W and Naifeh K H 1987 Accuracy of response of six pulse oximeters to profound hypoxia
Anesthesiology 67 551–8Severinghaus J W and Spellman M J 1990 Pulse oximeter failure thresholds in hypotension and vasoconstriction
Anesthesiology 73 532–7Shimada Y, Yoshiya I, Oka N and Hamaguri K 1984 Effects of multiple scattering and peripheral circulation on
arterial oxygen saturation measured with pulse-type oximeter Med. Biol. Eng. Comput. 22 475–8Shvartsman L D and Fine I 2003 Optical transmission of blood: effect of erythrocyte aggregation IEEE Trans. Biomed.
Eng. 50 1026–33Sidi A, Paulus D A, Rush W, Gravenstein N N and Davis R F 1987 Methylene blue and indocyanine green artifactually
lower oximetry readings of oxygen saturation J. Clin. Monit. 3 249–56Sinex J E 1999 Pulse oximetry: principles and limitations Am. J. Emerg. Med. 17 59–66Trang H, Boureghda S and Leske V 2004 Sleep desaturation: comparison of two oximeters Pediatr. Pulmonol. 37
76–80Tremper K K and Barker S J 1989 Pulse oximetry Anaesthesiology 70 98–108Tyler I L, Tantisira B, Winter P M and Motoyama E K 1985 Continuous monitoring of arterial oxygen saturation with
pulse oximetry during transfer to the recovery room Anesth. Analg. 64 1108–12Vicenzi M N, Gombotz H, Krenn H, Dorn C and Rehak P 2000 Transesophageal versus surface pulse oximetry in
intensive care unit patients Crit. Care Med. 28 2268–70Volgyesi G A and Spahr-Schopfer I 1991 Does skin pigmentation affect the accuracy of pulse oximetry? An in vitro
study Anesthesiology 75 A406 (abstract)Wahr J A, Tremper K K and Diab M 1995 Pulse oximetry Respir. Care Clin. N Am. 1 77–105Webster J G 1997 Design of Pulse Oximeters (Bristol: Institute of Physics Publishing)Welch J 2005 Pulse oximeters Biomed. Instrum. Technol. 39 125–30Wray S, Cope M, Delpy D T, Wyatt J S and Reynolds E O R 1988 Characterization of the near infrared absorption
spectra of cytochrome aa3 and hemoglobin for the non-invasive monitoring of cerebral oxygenation Biochim.Biophys. Acta 933 184–92

Topical Review R35
Wukitsch M W, Petterson M T, Tobler D R and Pologe J A 1988 Pulse oximetry: analysis of theory, technology andpractice J. Clin. Monit. 4 290–301
Yilmaz E N, Vahl A C, van Rij G, Nauta S H, Brom H L and Rauwerda J A 1999 Endoluminal pulse oximetry of thesigmoid colon and the monitoring of the colonic circulation Cardiovasc. Surg. 7 704–9
Yoshiya I, Shimada Y and Tanaka K 1980 Spectrophotometric monitoring of arterial oxygen saturation in the fingertipMed. Biol. Eng. Comput. 18 27–32