PUEBLO RESERVOIR 1993 SEDIMENTATION SURVEY Reservoir... · PERFORMING ORGANIZATION CODE 1993...
59
PUEBLO RESERVOIR 1993 SEDIMENTATION SURVEY I .i' iol RCESAlAv çv CH3 U.S. Department of the Interior Bureau of Reclamation
Transcript of PUEBLO RESERVOIR 1993 SEDIMENTATION SURVEY Reservoir... · PERFORMING ORGANIZATION CODE 1993...
PUEBLO RESERVOIR1993 SEDIMENTATION SURVEY
I .i'iol
RCESAlAv
çv
CH3
U.S. Department of the InteriorBureau of Reclamation
7-2090 (4-81)n( ,mtnn TECHNICAL REPORT STANDARD TITLE PAGE
- 1. REPORT NO. :T:IE4ET Ii 3. RECIPIENTS CATALOG NO.
.4. TITLE AND SUBTITLE 5. REPORT DATEMay 1994
Pueblo Reservoir 6. PERFORMING ORGANIZATION CODE1993 Sedimentation Survey
D-5753
7. AUTHOR(S) 8. PERFORMING ORGANIZATION
Ronald L. Ferrari REPORT NO.
9. PERFORMING ORGANIZATION NAME AND ADDRESS 10. WORK UNIT NO.
Bureau of Reclamation 11. CONTRACT OR GRANT NO.Denver OfficeDenver CO 80225 13. TYPE OF REPORT AND PERIOD COVERED
12. SPONSORING AGENCY NAME AND ADDRESSDIBR
Same14. SPONSORING AGENCY CODE
D-575315. SUPPLEMENTARY NOTES
Microfiche and hard copy available at the Denver Office, Denver, Colorado
16. ABSTRACT
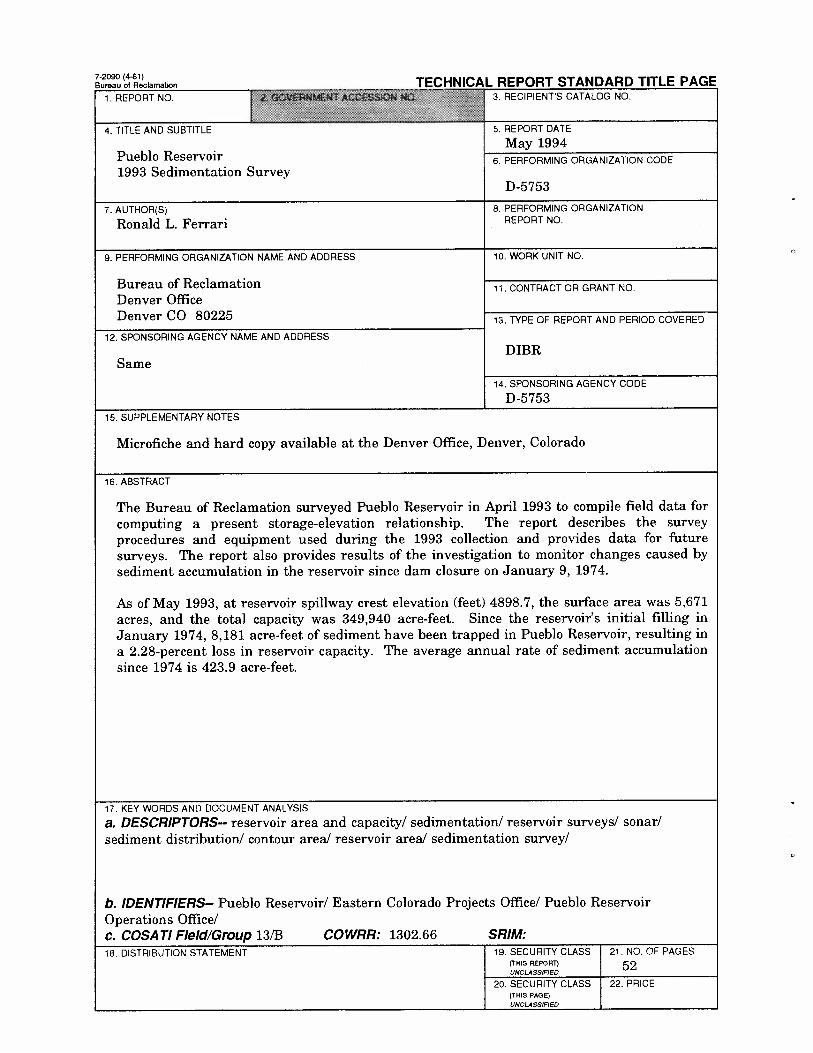
The Bureau of Reclamation surveyed Pueblo Reservoir in April 1993 to compile field data forcomputing a present storage-elevation relationship. The report describes the surveyprocedures and equipment used during the 1993 collection and provides data for futuresurveys. The report also provides results of the investigation to monitor changes caused bysediment accumulation in the reservoir since dam closure on January 9, 1974.
As of May 1993, at reservoir spillway crest elevation (feet) 4898.7, the surface area was 5,671acres, and the total capacity was 349,940 acre-feet. Since the reservoir's initial filling inJanuary 1974, 8,181 acre-feet of sediment have been trapped in Pueblo Reservoir, resulting ina 2.28-percent loss in reservoir capacity. The average annual rate of sediment accumulationsince 1974 is 423.9 acre-feet.
17. KEY WORDS AND DOCUMENT ANALYSIS
a. DESCRIPTORS- reservoir area and capacity! sedimentation! reservoir surveys! sonar!sediment distribution! contour area! reservoir area! sedimentation survey!
b. IDENTIFIERS- Pueblo Reservoir! Eastern Colorado Projects Office! Pueblo ReservoirOperations Office!C. COSATI Field/Group 13/B COWRR: 1302.66 SRIM:18. DISTRIBUTION STATEMENT 19. SECURITY CLASS 21. NO. OF PAGES
(THIS 52UNCLASSIFIED
20. SECURITY CLASS 22. PRICE(THIS PAGE)UNCLASSIFIED
PUEBLO RESERVOIR
1993 SEDIMENTATION SURVEY
by
Ronald L. Ferrari
Sedimentation SectionSurface Water Branch
Division of Earth SciencesDenver Office
Denver, Colorado
May 1994
ACKNOWLEDGMENTS
The Bureau of Reclamation's Sedimentation Section preparedand published this report. The hydrographic survey wassupervised by Ronald Ferrari, Hydraulic Engineer. Thehydrographic survey was assisted by personnel from the EasternColorado Projects Office and the Pueblo Reservoir OperationsOffice, who also conducted the field work of locating and flaggingthe existing sediment range end markers and surveying all theabove water ranges. Ronald Ferrari completed the dataprocessing, sediment computations, area-capacity tables, and thereport. Joseph Lyons, Hydraulic Engineer, was consulted in thesediment computations and report preparation.
U.S. Department of the InteriorMission Statement
As the Nation's principal conservation agency, the Department of theInterior has responsibility for most of our nationally-owned publiclands and natural resources. This includes fostering sound use of ourland and water resources; protecting our fish, wildlife, and biologicaldiversity; preserving the environmental and cultural values of ournational parks and historical places; and providing for the enjoymentof life through outdoor recreation. The Department assesses ourenergy and mineral resources and works to ensure that theirdevelopment is in the best interests of all our people by encouragingstewardship and citizen participation in their care. The Departmentalso has a major responsibility for American Indian reservationcommunities and for people who live in island territories under U.S.administration.
The information contained in this report regarding commercialproducts or firms may not be used for advertising or promotionalpurposes and is not to be construed as an endorsement of anyproduct or firm by the Bureau of Reclamation.
The information contained in this report was developed for theBureau of Reclamation; no warranty as to the accuracy,usefulness, or completeness is expressed or implied.
11

CONTENTS
.......................................................................................................................
.....................................................................................................................
...............................................................................................................................
.................................................................................................................
............................................................................................
.................................................................................................................................................................
.........................................................................................................................
..................................
...............................................................................
..........................................
..........................................
..........................................
..............................................
...............................................................................................
......................................................................
.............................................................................
..........................................
..........................................
..........................................
..........................................
..........................................
...................................................................................
..........................................
..........................................
......................................................................................................................................................................................................................................................
Page
1Introduction2Summary and conclusions2Description of basin3Reservoir operations3Surveys3Original survey41993 resurvey4Reservoir area and capacity4Development of 1993 contour areas41993 revised storage capacity5Sediment analyses6Reservoir sediment distribution6Longitudinal distribution6Lateral distribution7References
TABLESTable
1 Reservoir sediment data summary (page 1 of 2) 81 Reservoir sediment data summary (page 2 of 2) 92 Summary of 1993 survey results 103 Range end coordinates (page 1 of 3) 113 Range end coordinates (page 2 of 3) 123 Range end coordinates (page 3 of 3) 13
FIGURESFigure
1 Pueblo Reservoir location map 142 Pueblo Dam plan and sections 153 Pueblo Dam outlet sections 164 Pueblo Reservoir range location map 175 Width adjustment method for revising contour areas 196 Area and capacity curves - Pueblo Reservoir 207 Longitudinal profile - Arkansas River 218 Sediment Range 1 - Arkansas River 229 Sediment Range 2 - Arkansas River 23
10 Sediment Range 3 - Arkansas River 2411 Sediment Range 4 - Arkansas River 2512 Sediment Range 5 - Arkansas River 2613 Sediment Range 6 - Arkansas River 2714 Sediment Range 6A - Arkansas River 2815 Sediment Range 7 - Arkansas River 2916 Sediment Range 8 - Arkansas River 3017 Sediment Range 9 - Arkansas River 3118 Sediment Range 9A - Arkansas River 3219 Sediment Range 10 - Arkansas River 3320 Sediment Range 1OA - Arkansas River 3421 Sediment Range 11 - Arkansas River 3522 Sediment Range 12 - Arkansas River 36
in
CONTENTS - CONTINUED
.........................................
.........................................
.........................................
..........................................................................................................................................................................
............................................
............................................
............................................
............................................
............................................
..........................................................................................................................................................................
FIGURES - CONTINUED
Figure Page
23 Sediment Range 13 - Arkansas River 3724 Sediment Range 14 - Arkansas River 3825 Sediment Range 15 - Arkansas River 3926 Sediment Range 16 - Arkansas River 4027 Sediment Range 20 - Boggs Creek 4128 Sediment Range 21 - Boggs Creek 4229 Sediment Range 30 - Above Manna 4330 Sediment Range 40 - Rock Creek 4431 Sediment Range 41 - Rock Creek 4532 Sediment Range 42 - Rock Creek 4633 Sediment Range 43 - Rock Creek 4734 Sediment Range 50 - Peck Creek 4835 Sediment Range 51 - Peck Creek 4936 Sediment Range 60 - Turkey Creek 5037 Sediment Range 61 - Turkey Creek 5138 Sediment Range 62 - Turkey Creek 52
4
iv
INTRODUCTION
Pueblo Dam and Reservoir, located on the Arkansas River in Pueblo County, are 6 miles westof the city of Pueblo in south-central Colorado. Pueblo Reservoir, formed by Pueblo Dam, isone of the major storage features of the Fryingpan-Arkansas Project. The Fryingpan-Arkansas Project is a multipurpose, transmountain development which diverts water fromthe Fryingpan River and tributaries on the western slope of the Rocky Mountains to theArkansas River on the eastern slope. Additional reservoirs that form the project includeRuedi Reservoir on the western slope and Turquoise Lake, Mt. Elbert Forebay Reservoir, andTwin Lakes Reservoir on the eastern slope. Pueblo Reservoir is the largest and the terminalstorage feature of the Fryingpan-Arkansas project (fig. 1).
Construction of the Fryingpan-Arkansas Project was authorized by Public Law 87-590 (76Stat. 389) and signed by the President on August 16, 1962. Construction of Pueblo Dambegan in 1970 and was completed in August 1975. The left embankment was modified in1980 by the addition of a downstream stability berm to provide protection against potentiallyweak foundation soils. Initial water storage began on January 9, 1974. Maximum elevationwas attained in water year 1986 at reservoir elevation 4887.1 feet.
Pueblo Dam is a composite concrete and earthfill structure, about 10,200 feet long at crestelevation 4925.0. The concrete section has a structural height of 250 feet and a hydraulicheight of 191 feet. The earthifil portions consist of the left and right abutmentembankments, totaling 8,450 feet in length. The concrete dam consists of 23 massive-headbuttresses which total 1,750 feet in length, and has a 550-foot overflow spillway section anda 1,200-foot nonoverfiow section (fig. 2).
The uncontrolled overflow spillway has a crest elevation of 4898.7 feet and is located in theoverflow section of the buttresses. The spillway consists of a concrete ogee crest, trainingwalls, ifip bucket, stilling basin, and an outlet channel. The spillway design flow is 191,500ft3/s (cubic feet per second) at reservoir elevation 4919.0.
Five separate outlets operate at Pueblo Dam. The Bessemer Ditch, located in the rightembankment, is controlled by four high-pressure gates with a maximum discharge of 393ft3/s. The river outlet, located in the buttress over the streambed, is controlled by two gateswith a maximum discharge of 1,120 ft3/s. The spillway outlets, located under the spillway,consist of three gated conduits with a maximum discharge of 8,190 ft3/s. The fish hatcheryoutlet, located in the buttress, is controlled by multilevel gated intakes for controlling waterquality to the downstream fish hatchery. The maximum discharge rate is 30 ft3/s. The southoutlet, located in a buttress, has gated intakes and supplies a maximum discharge of 345 ft3/sof municipal and industrial water (fig. 3).
Pueblo Reservoir has an approximate length of 11.4 miles and an average width of 0.8 milesat reservoir pooi elevation 4900.0. The average width is determined by dividing the surfacearea by the reservoir length at elevation 4900.0. The total Arkansas River drainage areaabove the dam is 4,669 square miles, of which an estimated 4,170 square miles contributes
* The definition of terms such as "structural height," "hydraulic height,' etc., may be found in manuals such asReclamation's Design of Small Dams and Guide for Preparation of Standing Operating Procedures for Dams andReservoirs, or ASCE's Nomenclature for Hydraulics.
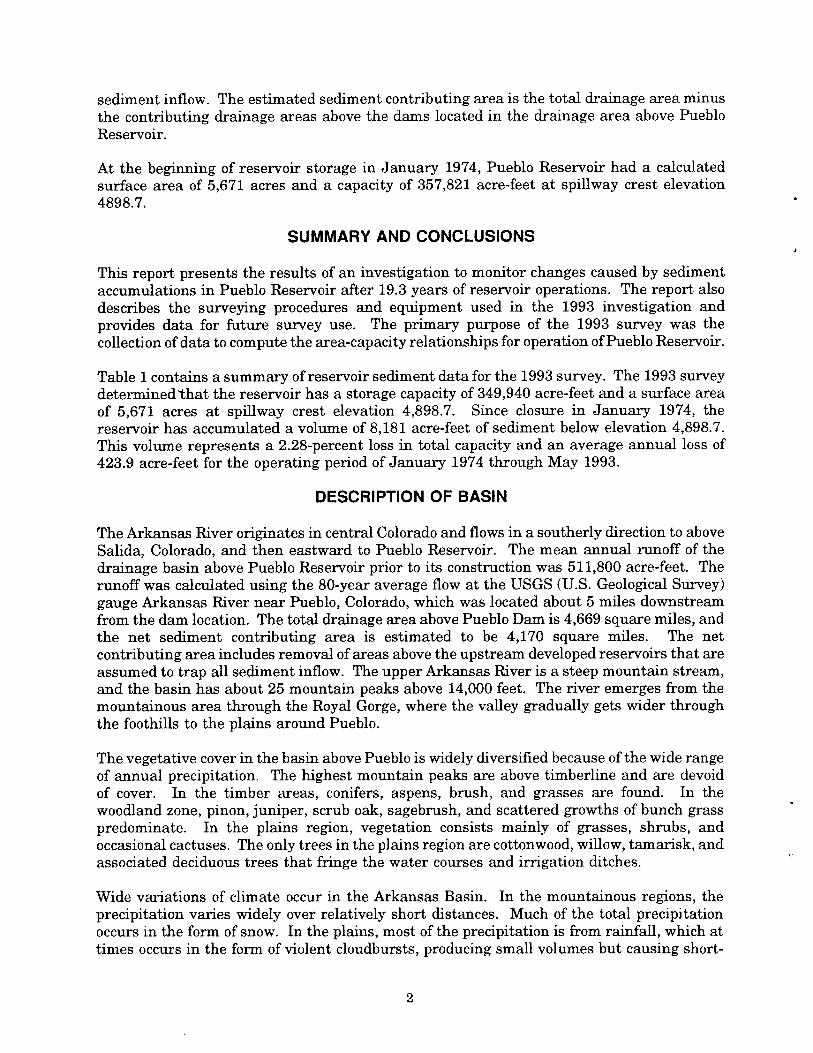
sediment inflow. The estimated sediment contributing area is the total drainage area minusthe contributing drainage areas above the dams located in the drainage area above PuebloReservoir.
At the beginning of reservoir storage in January 1974, Pueblo Reservoir had a calculatedsurface area of 5,671 acres and a capacity of 357,821 acre-feet at spillway crest elevation4898.7.
SUMMARY AND CONCLUSIONS
This report presents the results of an investigation to monitor changes caused by sedimentaccumulations in Pueblo Reservoir after 19.3 years of reservoir operations. The report alsodescribes the surveying procedures and equipment used in the 1993 investigation andprovides data for future survey use. The primary purpose of the 1993 survey was thecollection of data to compute the area-capacity relationships for operation of Pueblo Reservoir.
Table 1 contains a summary of reservoir sediment data for the 1993 survey. The 1993 surveydetermined'that the reservoir has a storage capacity of 349,940 acre-feet and a surface areaof 5,671 acres at spillway crest elevation 4,898.7. Since closure in January 1974, thereservoir has accumulated a volume of 8,181 acre-feet of sediment below elevation 4,898.7.This volume represents a 2.28-percent loss in total capacity and an average annual loss of423.9 acre-feet for the operating period of January 1974 through May 1993,
DESCRIPTION OF BASIN
The Arkansas River originates in central Colorado and flows in a southerly direction to aboveSalida, Colorado, and then eastward to Pueblo Reservoir. The mean annual runoff of thedrainage basin above Pueblo Reservoir prior to its construction was 511,800 acre-feet. Therunoff was calculated using the 80-year average flow at the USGS (U.S. Geological Survey)gauge Arkansas River near Pueblo, Colorado, which was located about 5 miles downstreamfrom the dam location. The total drainage area above Pueblo Dam is 4,669 square miles, andthe net sediment contributing area is estimated to be 4,170 square miles. The netcontributing area includes removal of areas above the upstream developed reservoirs that areassumed to trap all sediment inflow. The upper Arkansas River is a steep mountain stream,and the basin has about 25 mountain peaks above 14,000 feet. The river emerges from themountainous area through the Royal Gorge, where the valley gradually gets wider throughthe foothills to the plains around Pueblo.
The vegetative cover in the basin above Pueblo is widely diversified because of the wide rangeof annual precipitation. The highest mountain peaks are above timberline and are devoidof cover. In the timber areas, conifers, aspens, brush, and grasses are found. In thewoodland zone, pinon, juniper, scrub oak, sagebrush, and scattered growths of bunch grasspredominate. In the plains region, vegetation consists mainly of grasses, shrubs, andoccasional cactuses. The only trees in the plains region are cottonwood, wifiow, tamarisk, andassociated deciduous trees that fringe the water courses and irrigation ditches.
Wide variations of climate occur in the Arkansas Basin. In the mountainous regions, theprecipitation varies widely over relatively short distances. Much of the total precipitationoccurs in the form of snow. In the plains, most of the precipitation is from rainfall, which attimes occurs in the form of violent cloudbursts, producing small volumes but causing short-
2

duration flash floods of damaging intensities. The recorded annual normal precipitationswithin the watershed vary from 9 to 19 inches. Because of the variation in altitude, themean annual temperatures range from 37 to 54 °F, and the extremes range from -54 to 105°F.
RESERVOIR OPERATIONS
The reservoir is a multiuse facility having (following values are from May 1993 area-capacitytables):
• 131,504 acre-feet of surcharge storage between elevations 4898.70 and 4919.00
• 27,044 acre-feet of flood control storage between elevations 4893.79 and 4898.70
• 65,716 acre-feet of joint use storage between elevations 4880.54 and 4893.79
• 229,059 acre-feet of conservation storage between elevations 4796.70 and 4880.54
• 25,792 acre-feet of inactive storage between elevations 4764.00 and 4796.7
• 2,329 acre-feet of dead storage between elevations 4752.80 and 4764.00
Records for Pueblo Reservoir show a calculated average unregulated inflow of 595,355 acre-feet per year. The estimated mean annual runoff from the basin is 2.06 inches. Since normaloperations have begun, Pueblo Reservoir operation has ranged from a minimum end-of-monthelevation of 4873.4 in water year 1987 to a maximum elevation of 4887.1 in water year 1986.The inflow and end-of-month stage records in table 1 show the extreme annual fluctuationof the reservoir,
SURVEYS
Original Survey
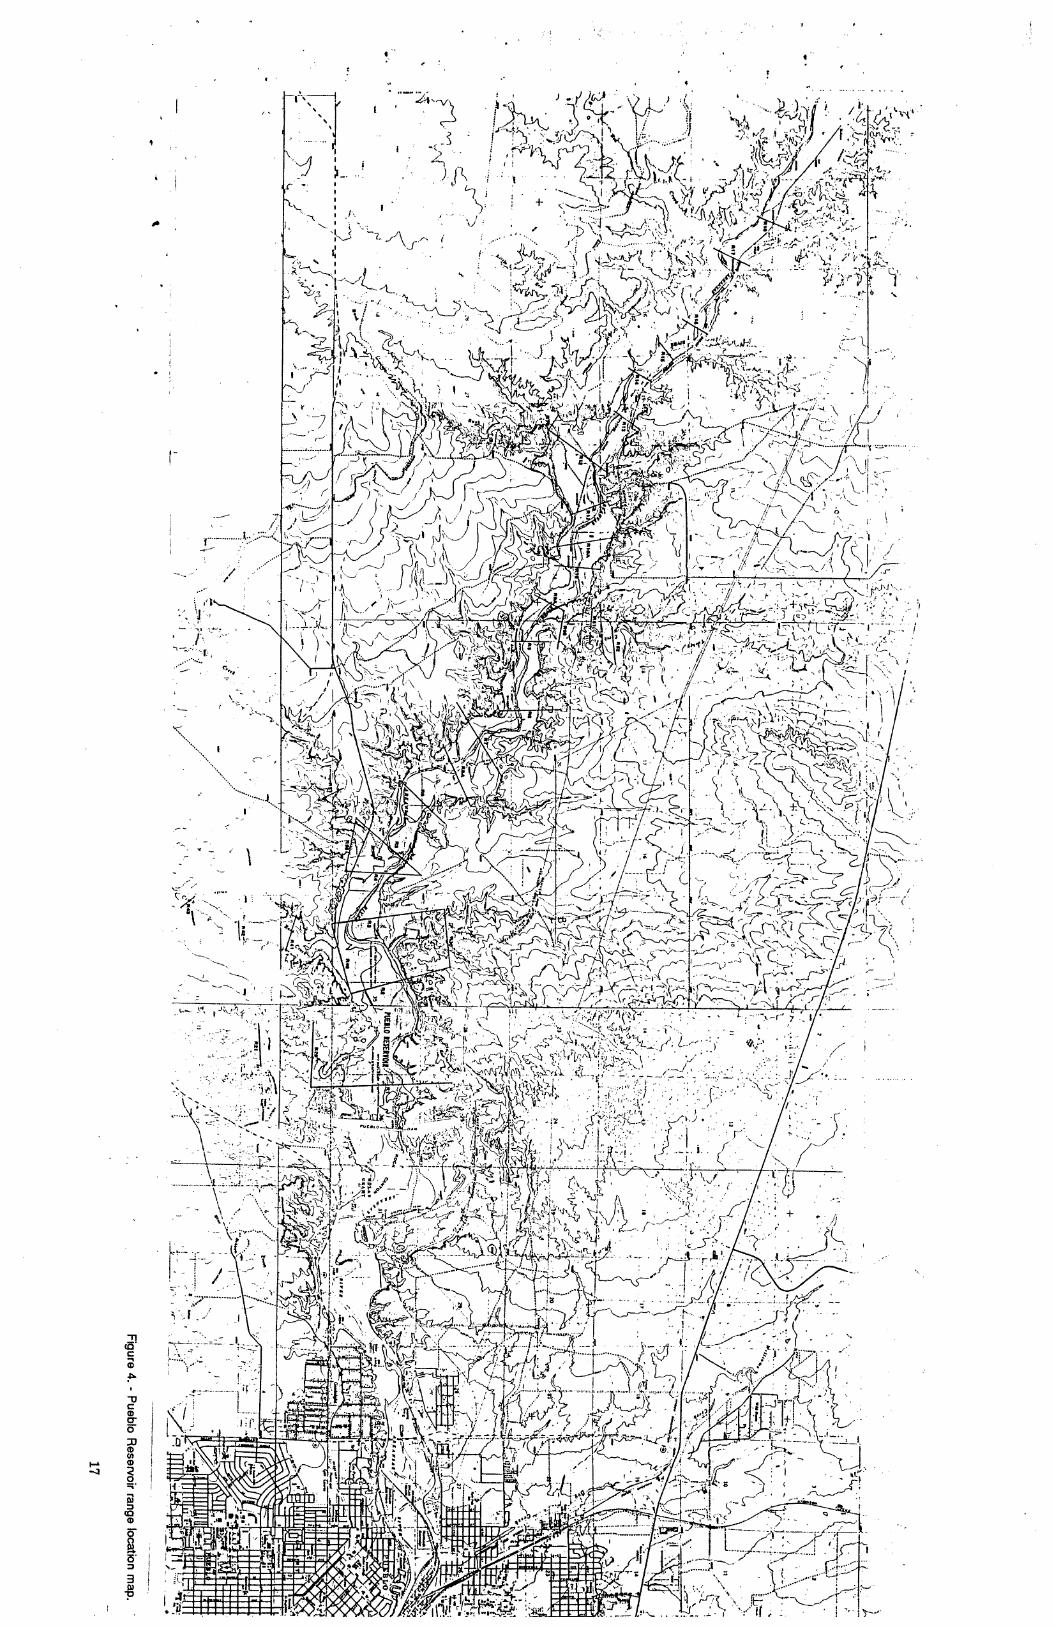
The original sediment ranges were surveyed by the Bureau of Reclamation prior toinundation of water behind Pueblo Reservoir dam and are referred to as the original, or 1974,data. For future reference, Table 3 lists the local and state plane coordinates for the rangeline end points. Several of the ranges had portions of them resurveyed prior to inundationto account for construction borrow pit areas. The finalized original range line data used theresurvey data. Figure 4 illustrates the range line network for Pueblo Reservoir.
The original surface areas for Pueblo Reservoir were determined by planimeteringtopographic maps of the reservoir area developed prior to inundation-Map Numbers 382-706-2270 to 382-706-2290. The topographic maps have a scale of 1 inch equals 400 feet anda 5-foot contour interval. This study used these maps for digitizing the affected segmentedareas as described in the reservoir area and capacity section.
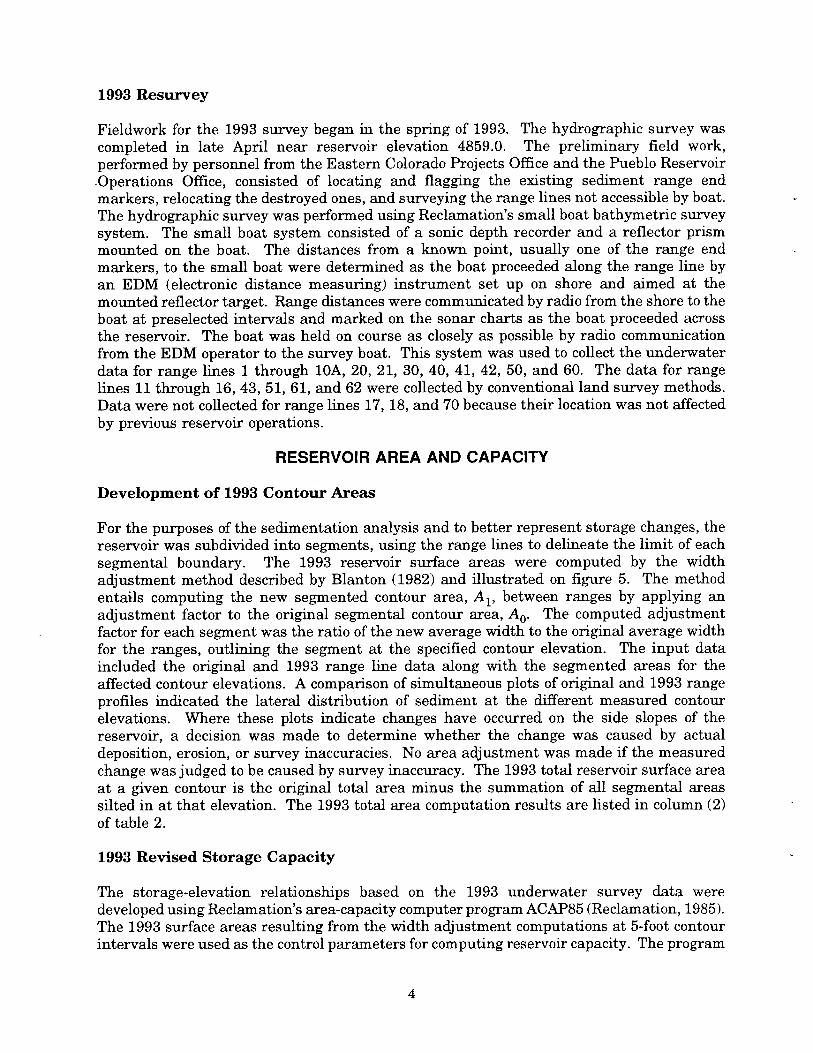
1993 Resurvey
Fieldwork for the 1993 survey began in the spring of 1993. The hydrographic survey wascompleted in late April near reservoir elevation 4859.0. The preliminary field work,performed by personnel from the Eastern Colorado Projects Office and the Pueblo ReservoirOperations Office, consisted of locating and flagging the existing sediment range endmarkers, relocating the destroyed ones, and surveying the range lines not accessible by boat.The hydrographic survey was performed using Reclamation's small boat bathymetric surveysystem. The small boat system consisted of a sonic depth recorder and a reflector prismmounted on the boat. The distances from a known point, usually one of the range endmarkers, to the small boat were determined as the boat proceeded along the range line byan EDM (electronic distance measuring) instrument set up on shore and aimed at themounted reflector target. Range distances were communicated by radio from the shore to theboat at preselected intervals and marked on the sonar charts as the boat proceeded acrossthe reservoir. The boat was held on course as closely as possible by radio communicationfrom the EDM operator to the survey boat. This system was used to collect the underwaterdata for range lines 1 through bA, 20, 21, 30, 40, 41, 42, 50, and 60. The data for rangelines 11 through 16, 43, 51, 61, and 62 were collected by conventional land survey methods.Data were not collected for range lines 17, 18, and 70 because their location was not affectedby previous reservoir operations.
RESERVOIR AREA AND CAPACITY
Development of 1993 Contour Areas
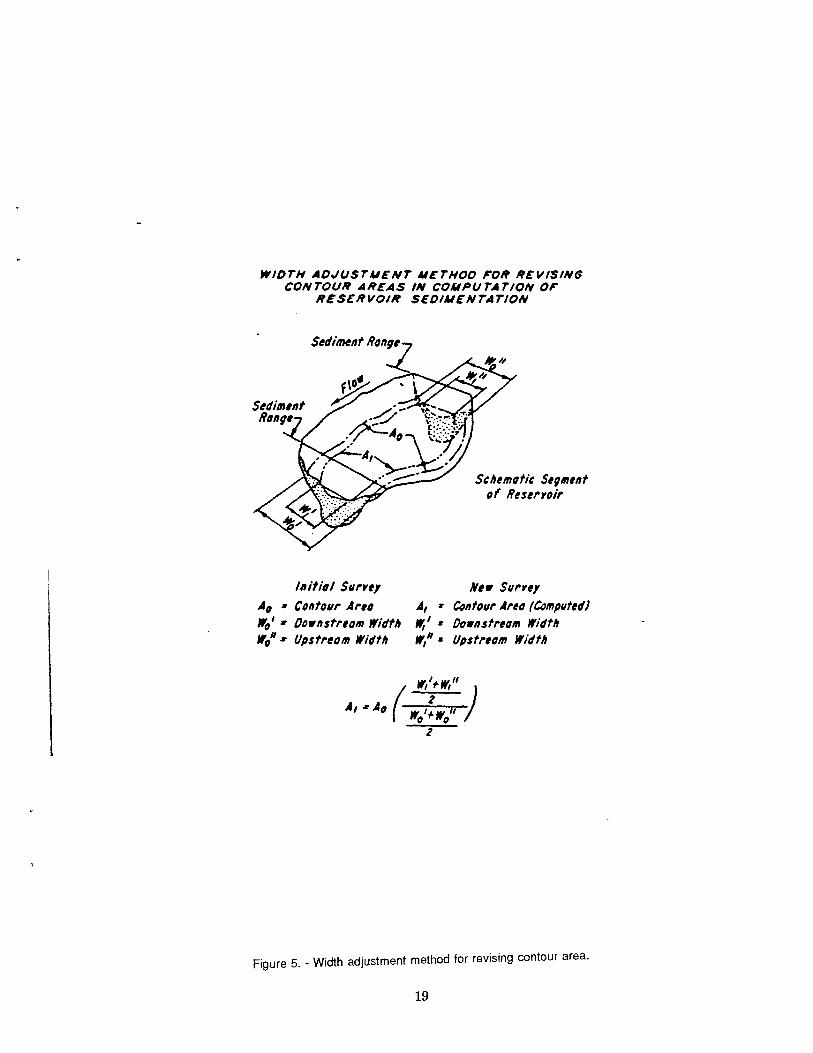
For the purposes of the sedimentation analysis and to better represent storage changes, thereservoir was subdivided into segments, using the range lines to delineate the limit of eachsegmental boundary. The 1993 reservoir surface areas were computed by the widthadjustment method described by Blanton (1982) and illustrated on figure 5. The methodentails computing the new segmented contour area, A1, between ranges by applying anadjustment factor to the original segmental contour area, A0. The computed adjustmentfactor for each segment was the ratio of the new average width to the original average widthfor the ranges, outlining the segment at the specified contour elevation. The input dataincluded the original and 1993 range line data along with the segmented areas for theaffected contour elevations. A comparison of simultaneous plots of original and 1993 rangeprofiles indicated the lateral distribution of sediment at the different measured contourelevations. Where these plots indicate changes have occurred on the side slopes of thereservoir, a decision was made to determine whether the change was caused by actualdeposition, erosion, or survey inaccuracies. No area adjustment was made if the measuredchange was judged to be caused by survey inaccuracy. The 1993 total reservoir surface areaat a given contour is the original total area minus the summation of all segmental areassilted in at that elevation. The 1993 total area computation results are listed in column (2)of table 2.
1993 Revised Storage Capacity
The storage-elevation relationships based on the 1993 underwater survey data weredeveloped using Reclamation's area-capacity computer program ACAP85 (Reclamation, 1985).The 1993 surface areas resulting from the width adjustment computations at 5-foot contourintervals were used as the control parameters for computing reservoir capacity. The program
4
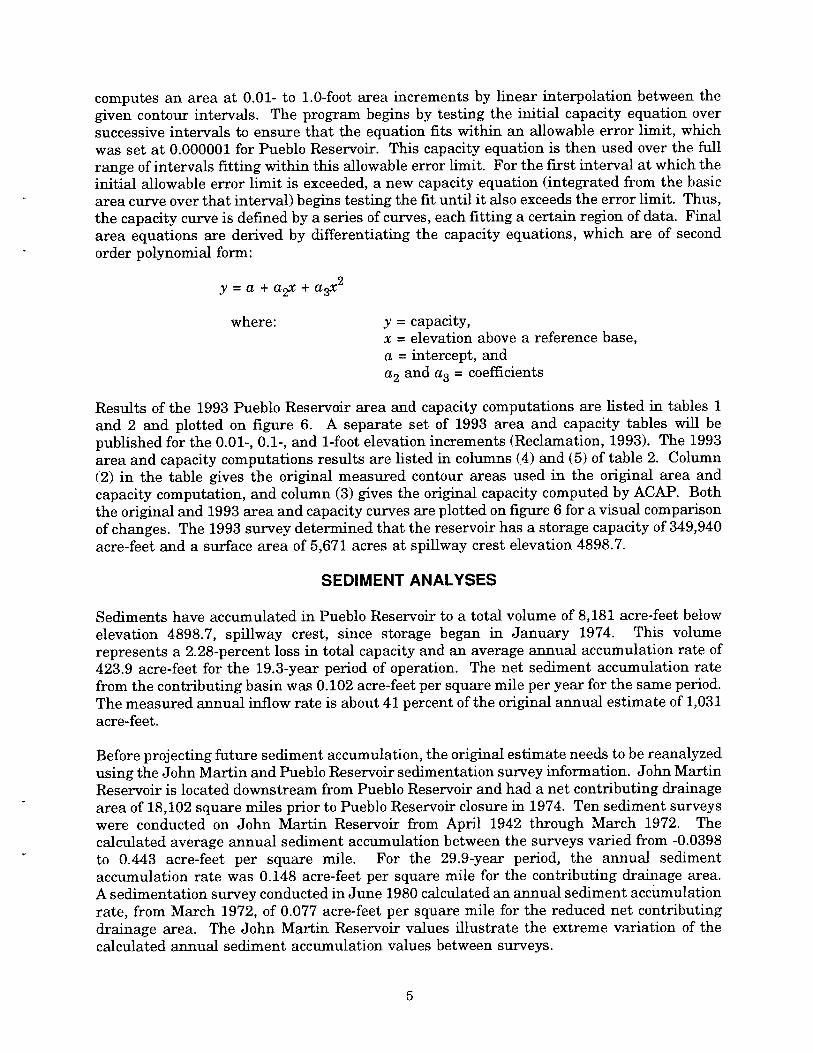
computes an area at 0.01- to 1.0-foot area increments by linear interpolation between thegiven contour intervals. The program begins by testing the initial capacity equation oversuccessive intervals to ensure that the equation fits within an allowable error limit, whichwas set at 0.00000 1 for Pueblo Reservoir. This capacity equation is then used over the fullrange of intervals fitting within this allowable error limit. For the first interval at which theinitial allowable error limit is exceeded, a new capacity equation (integrated from the basicarea curve over that interval) begins testing the fit until it also exceeds the error limit. Thus,the capacity curve is defined by a series of curves, each fitting a certain region of data. Finalarea equations are derived by differentiating the capacity equations, which are of secondorder polynomial form:
y a + a2x + a3x2
where: y = capacity,x = elevation above a reference base,a = intercept, anda2 and a3 = coefficients
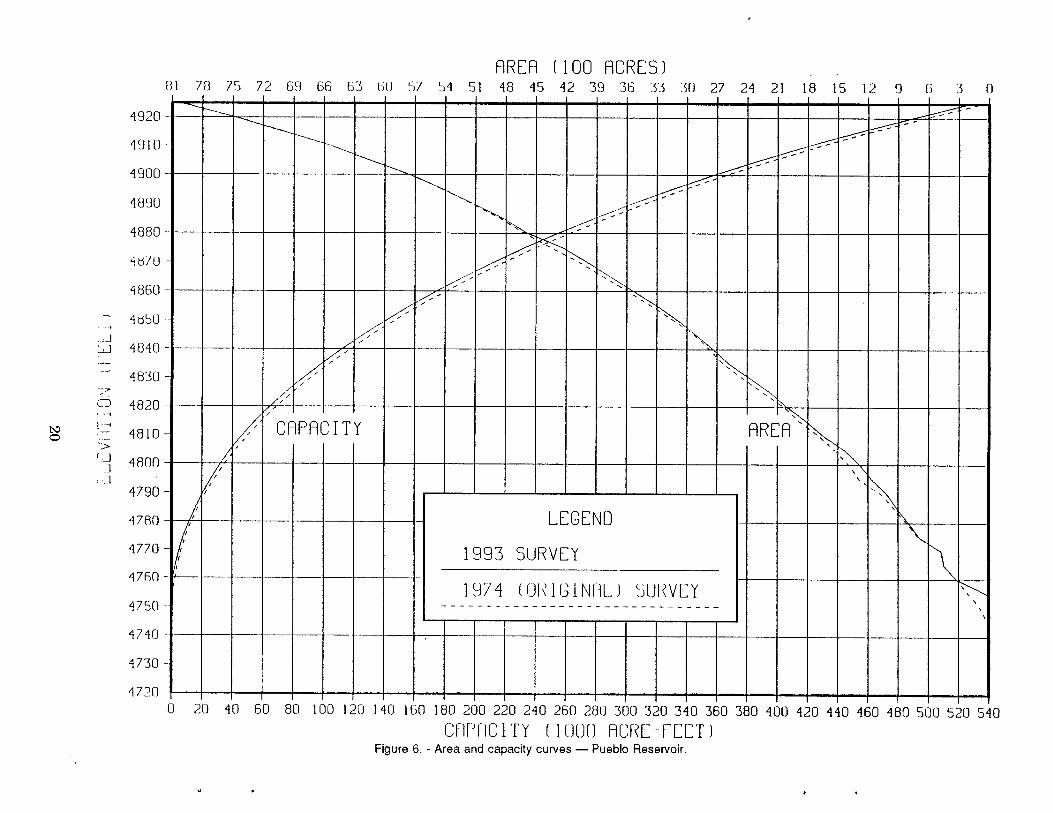
Results of the 1993 Pueblo Reservoir area and capacity computations are listed in tables 1and 2 and plotted on figure 6. A separate set of 1993 area and capacity tables will bepublished for the 0.01-, 0.1-, and 1-foot elevation increments (Reclamation, 1993). The 1993area and capacity computations results are listed in columns (4) and (5) of table 2. Column(2) in the table gives the original measured contour areas used in the original area andcapacity computation, and column (3) gives the original capacity computed by ACAP. Boththe original and 1993 area and capacity curves are plotted on figure 6 for a visual comparisonof changes. The 1993 survey determined that the reservoir has a storage capacity of 349,940acre-feet and a surface area of 5,671 acres at spillway crest elevation 4898.7.
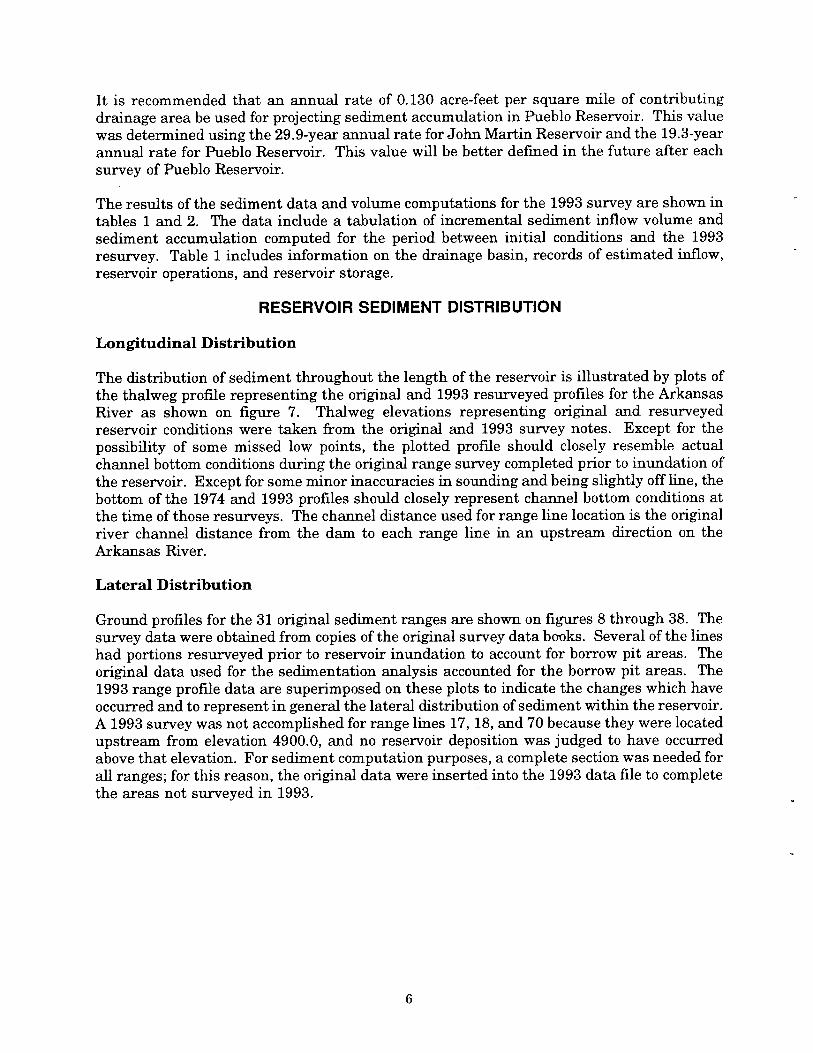
SEDIMENT ANALYSES
Sediments have accumulated in Pueblo Reservoir to a total volume of 8,181 acre-feet belowelevation 4898.7, spiiway crest, since storage began in January 1974. This volumerepresents a 2.28-percent loss in total capacity and an average annual accumulation rate of423.9 acre-feet for the 19.3-year period of operation. The net sediment accumulation ratefrom the contributing basin was 0.102 acre-feet per square mile per year for the same period.The measured annual inflow rate is about 41 percent of the original annual. estimate of 1,031acre-feet.
Before projecting future sediment accumulation, the original estimate needs to be reanalyzedusing the John Martin and Pueblo Reservoir sedimentation survey information. John MartinReservoir is located downstream from Pueblo Reservoir and had a net contributing drainagearea of 18,102 square miles prior to Pueblo Reservoir closure in 1974. Ten sediment surveyswere conducted on John Martin Reservoir from April 1942 through March 1972. Thecalculated average annual sediment accumulation between the surveys varied from -0.0398to 0.443 acre-feet per square mile. For the 29.9-year period, the annual sedimentaccumulation rate was 0.148 acre-feet per square mile for the contributing drainage area.A sedimentation survey conducted in June 1980 calculated an annual sediment accumulationrate, from March 1972, of 0.077 acre-feet per square mile for the reduced net contributingdrainage area. The John Martin Reservoir values illustrate the extreme variation of thecalculated annual sediment accumulation values between surveys.
5
It is recommended that an annual rate of 0.130 acre-feet per square mile of contributingdrainage area be used for projecting sediment accumulation in Pueblo Reservoir. This valuewas determined using the 29.9-year annual rate for John Martin Reservoir and the 19.3-yearannual rate for Pueblo Reservoir. This value will be better defined in the future after eachsurvey of Pueblo Reservoir.
The results of the sediment data and volume computations for the 1993 survey are shown intables 1 and 2. The data include a tabulation of incremental sediment inflow volume andsediment accumulation computed for the period between initial conditions and the 1993resurvey. Table 1 includes information on the drainage basin, records of estimated inflow,reservoir operations, and reservoir storage.
RESERVOIR SEDIMENT DISTRIBUTION
Longitudinal Distribution
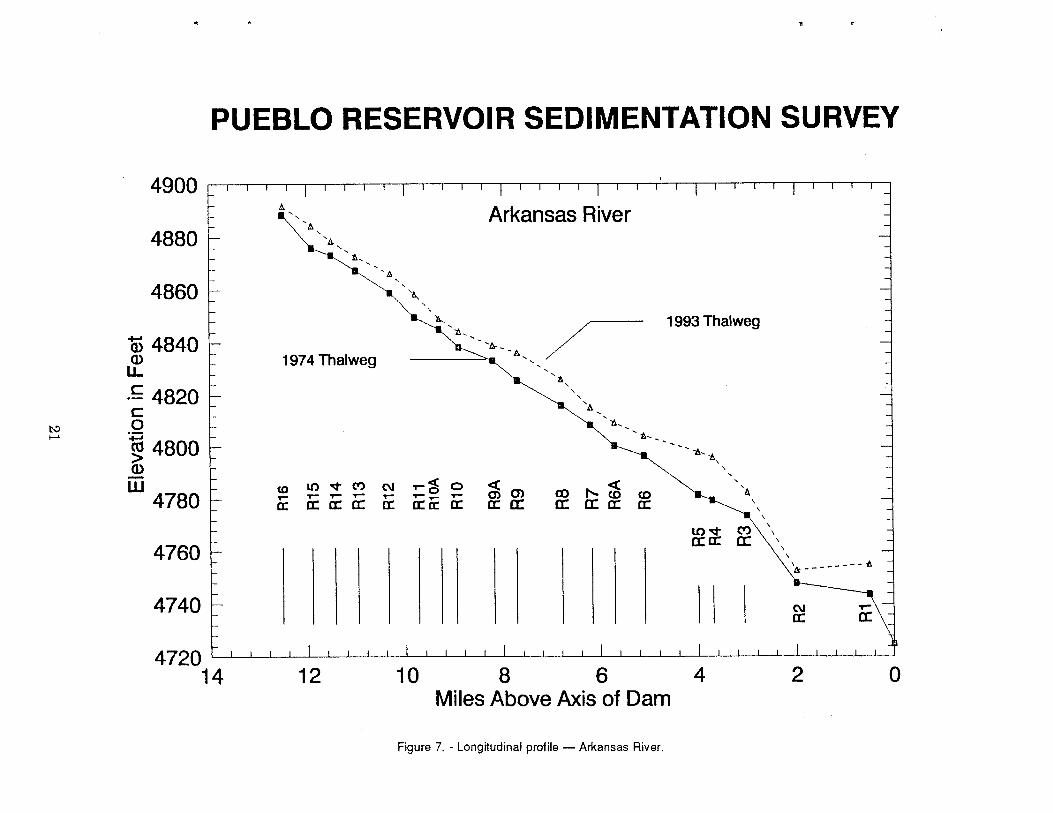
The distribution of sediment throughout the length of the reservoir is illustrated by plots ofthe thaiweg proffle representing the original and 1993 resurveyed profiles for the ArkansasRiver as shown on figure 7. Thaiweg elevations representing original and resurveyedreservoir conditions were taken from the original and 1993 survey notes. Except for thepossibility of some missed low points, the plotted profile should closely resemble actualchannel bottom conditions during the original range survey completed prior to inundation ofthe reservoir. Except for some minor inaccuracies in sounding and being slightly off line, thebottom of the 1974 and 1993 profiles should closely represent channel bottom conditions atthe time of those resurveys. The channel distance used for range line location is the originalriver channel distance from the dam to each range line in an upstream direction on theArkansas River.
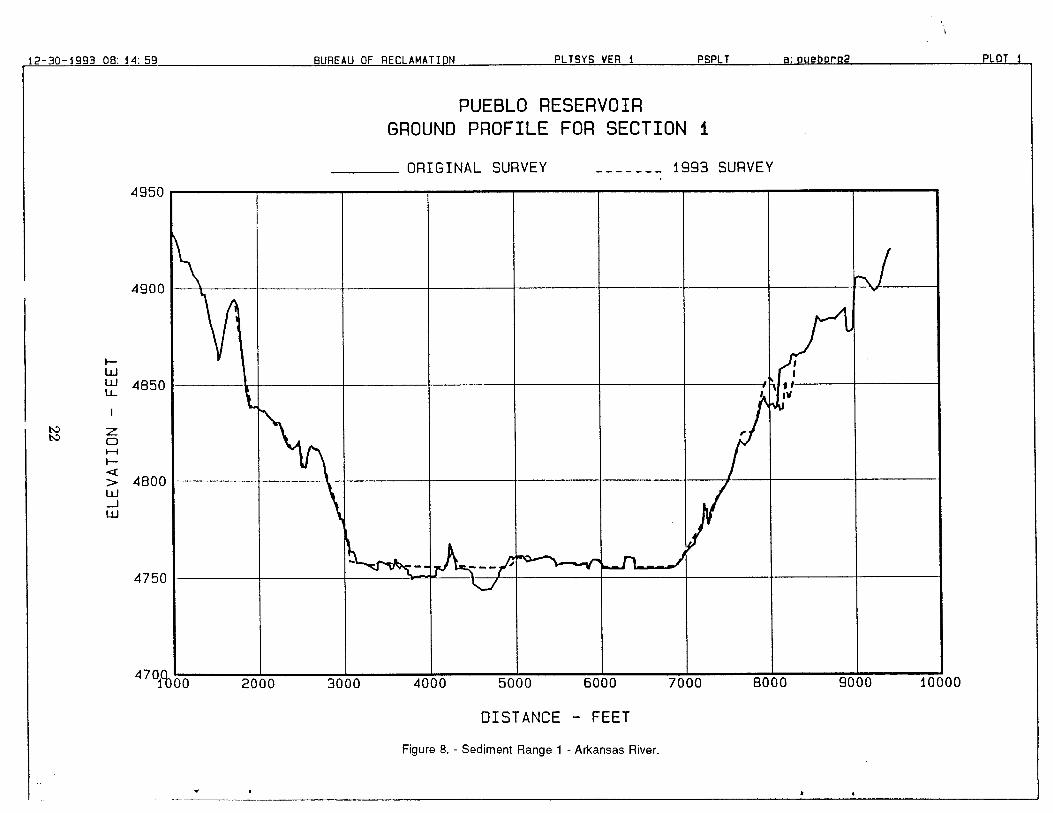
Lateral Distribution
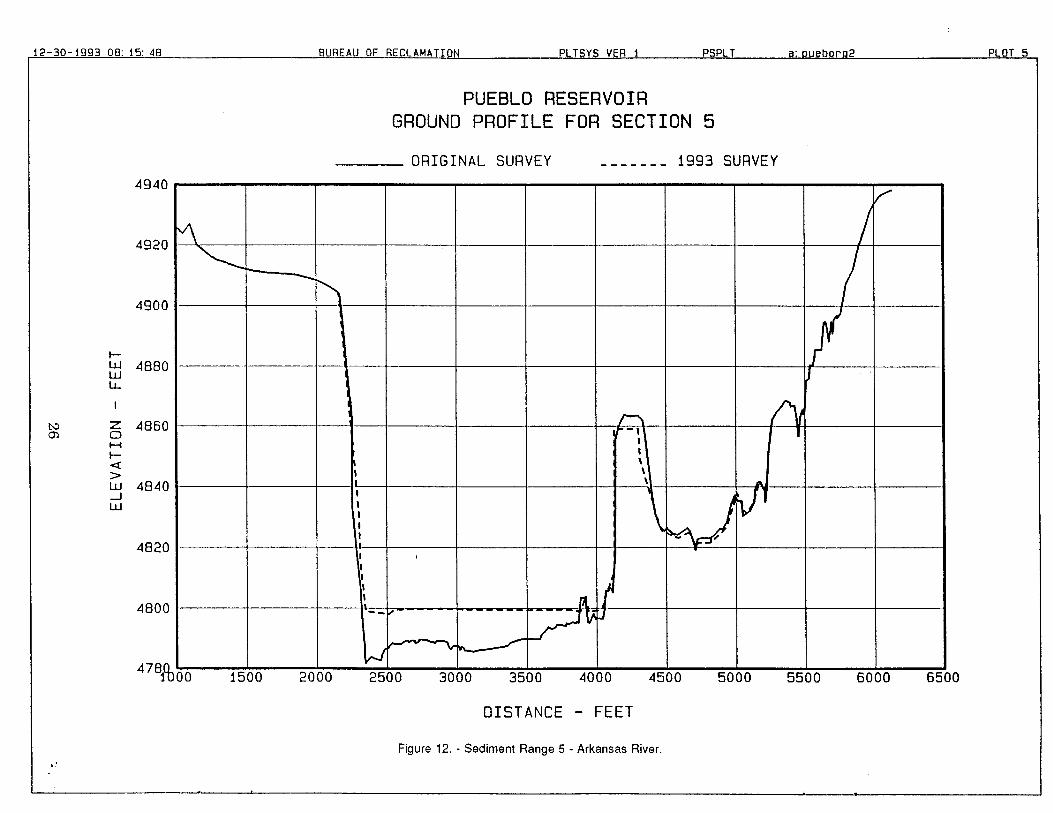
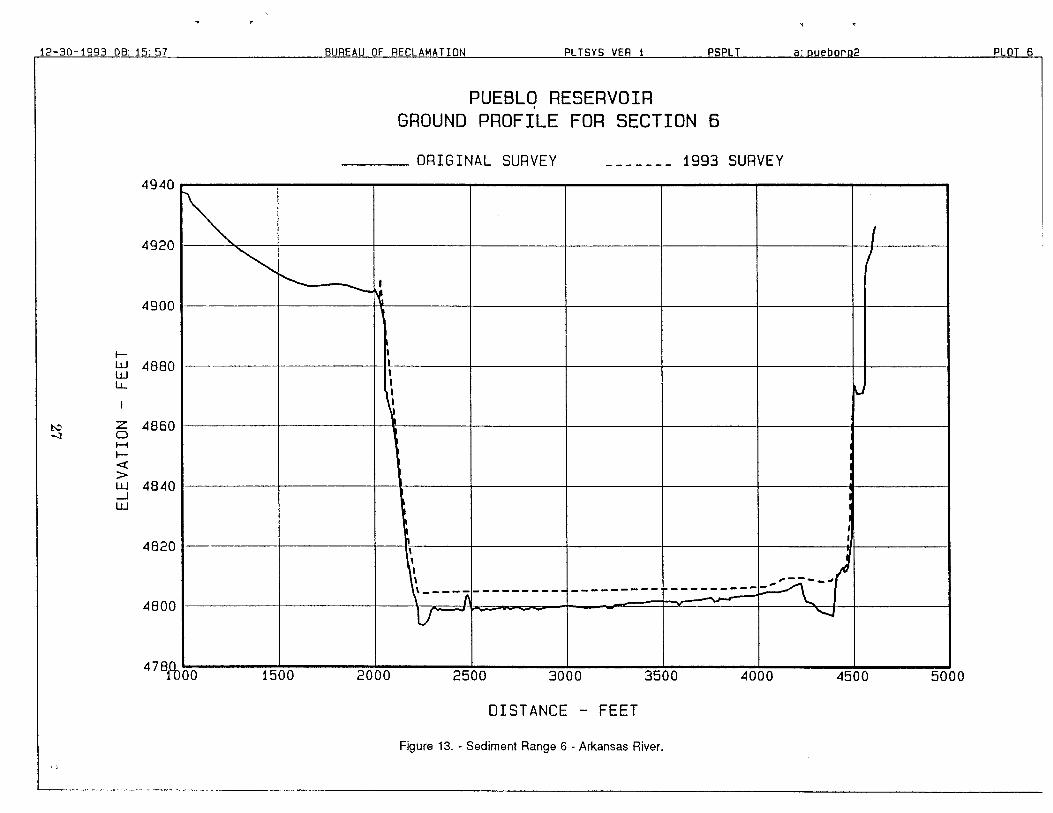
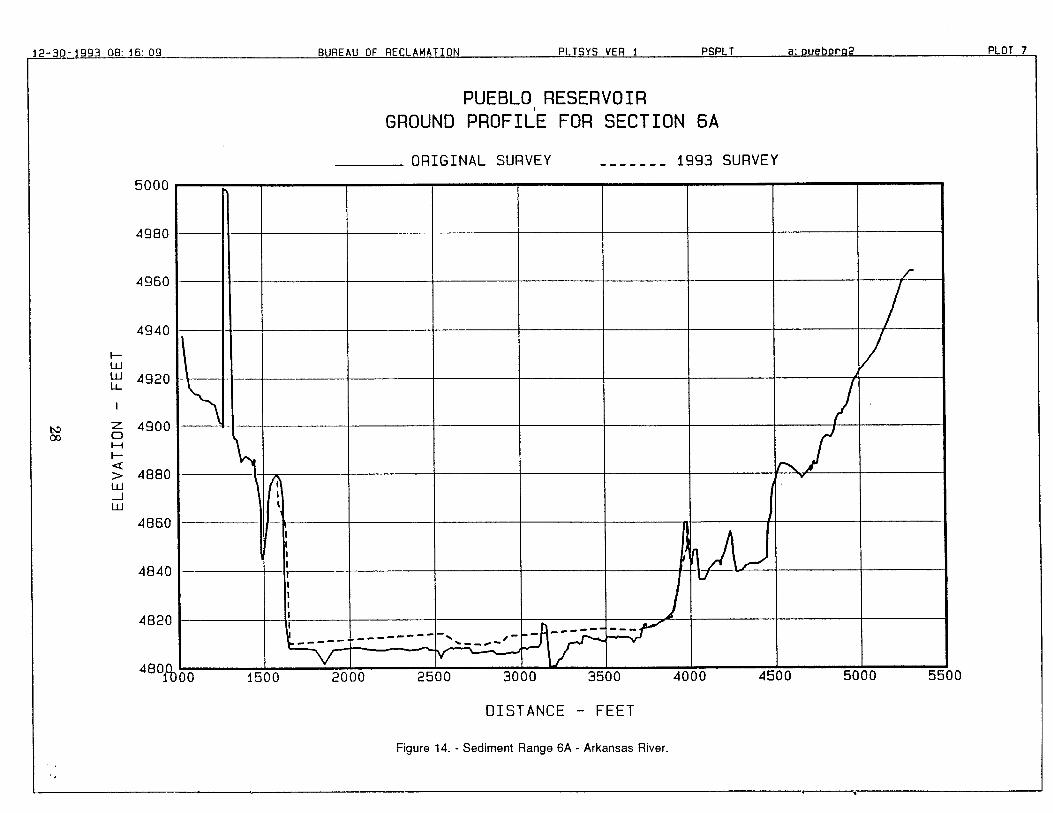
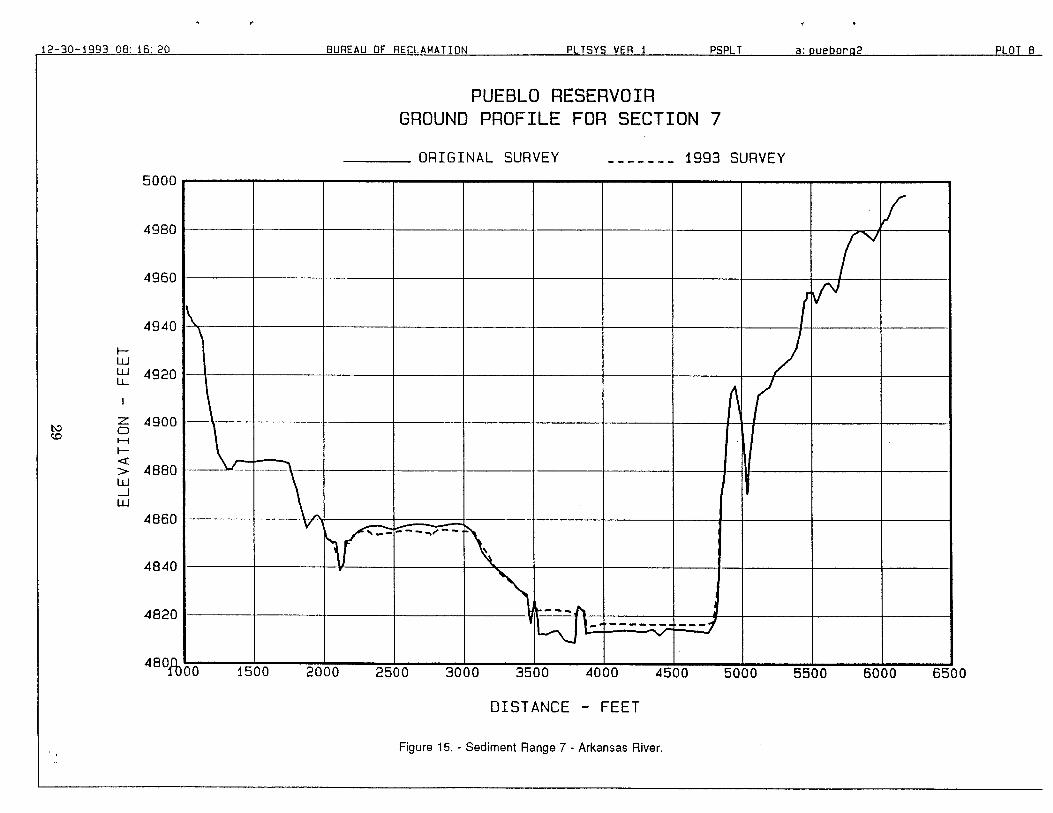
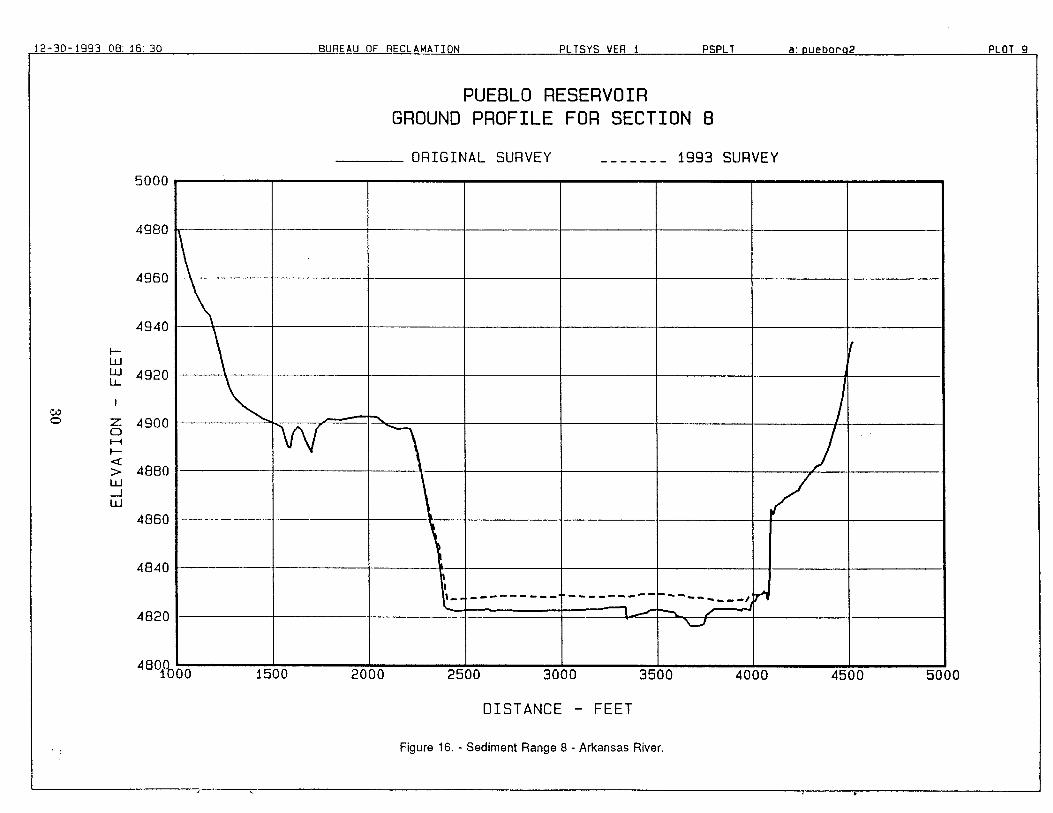
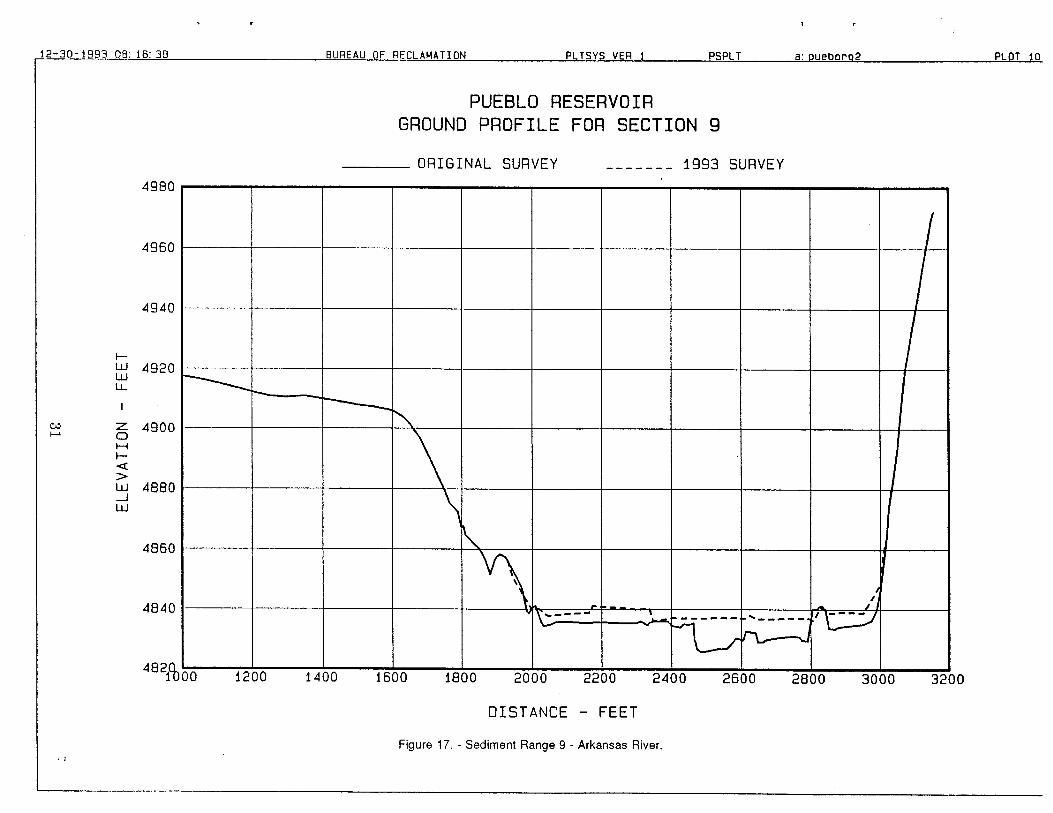
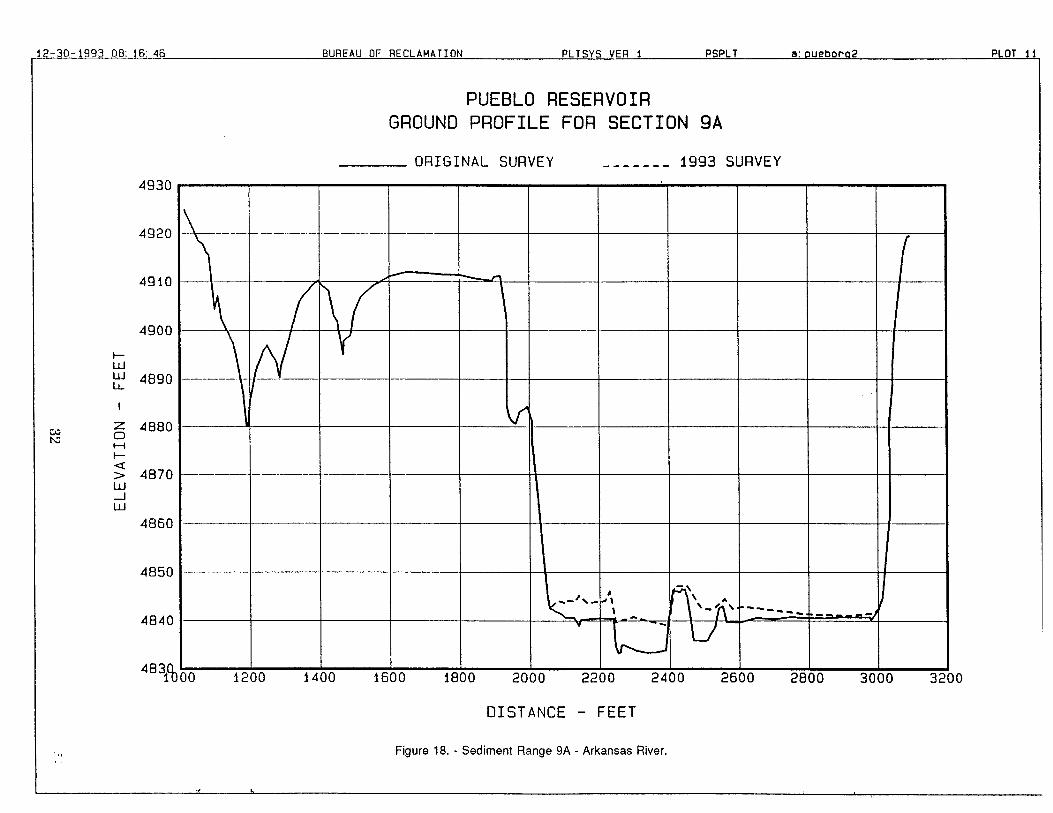
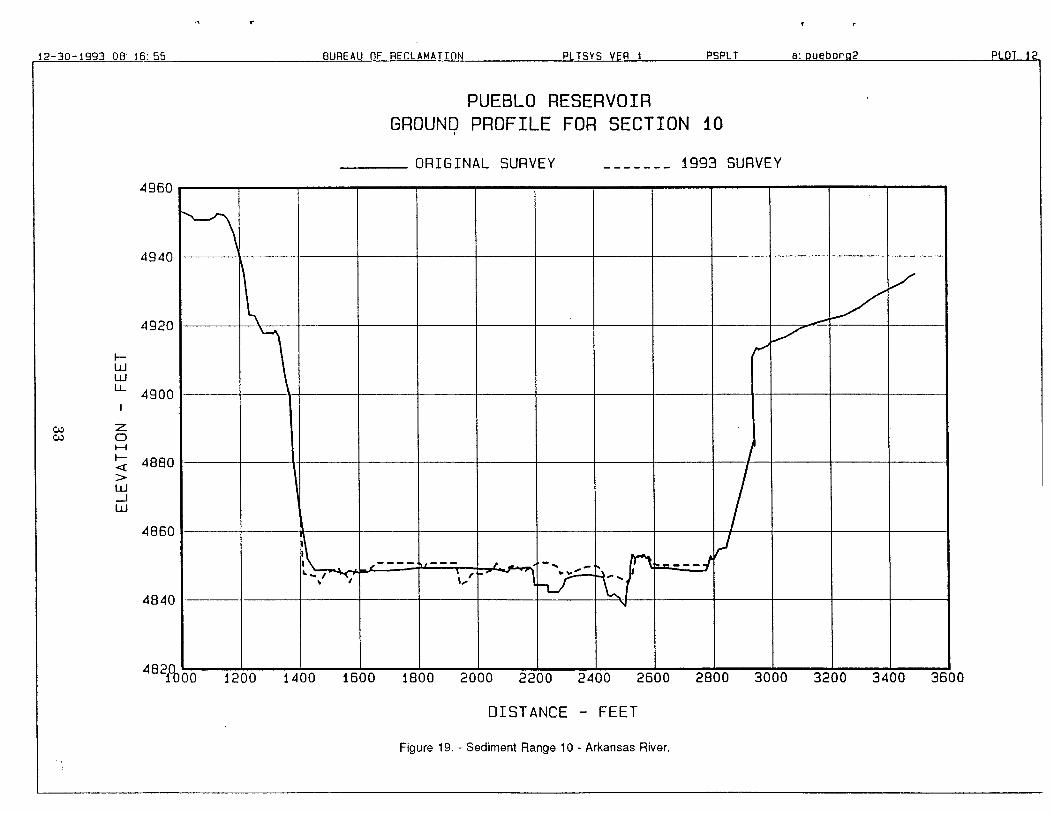
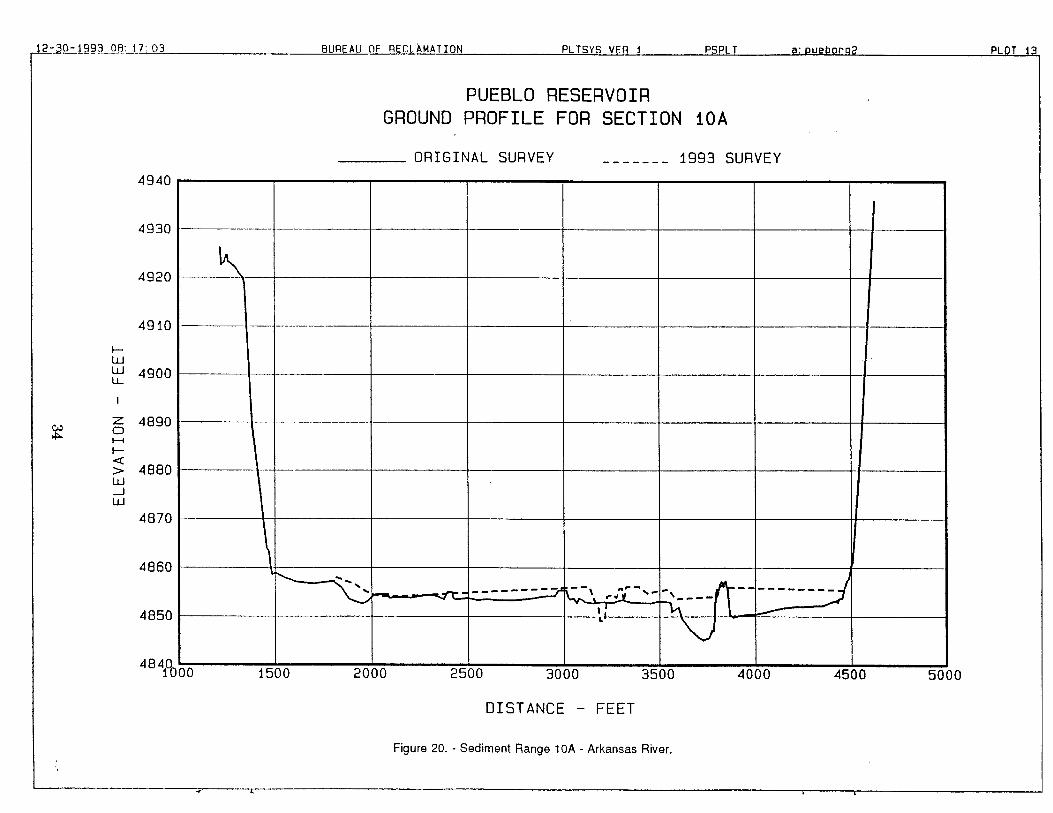
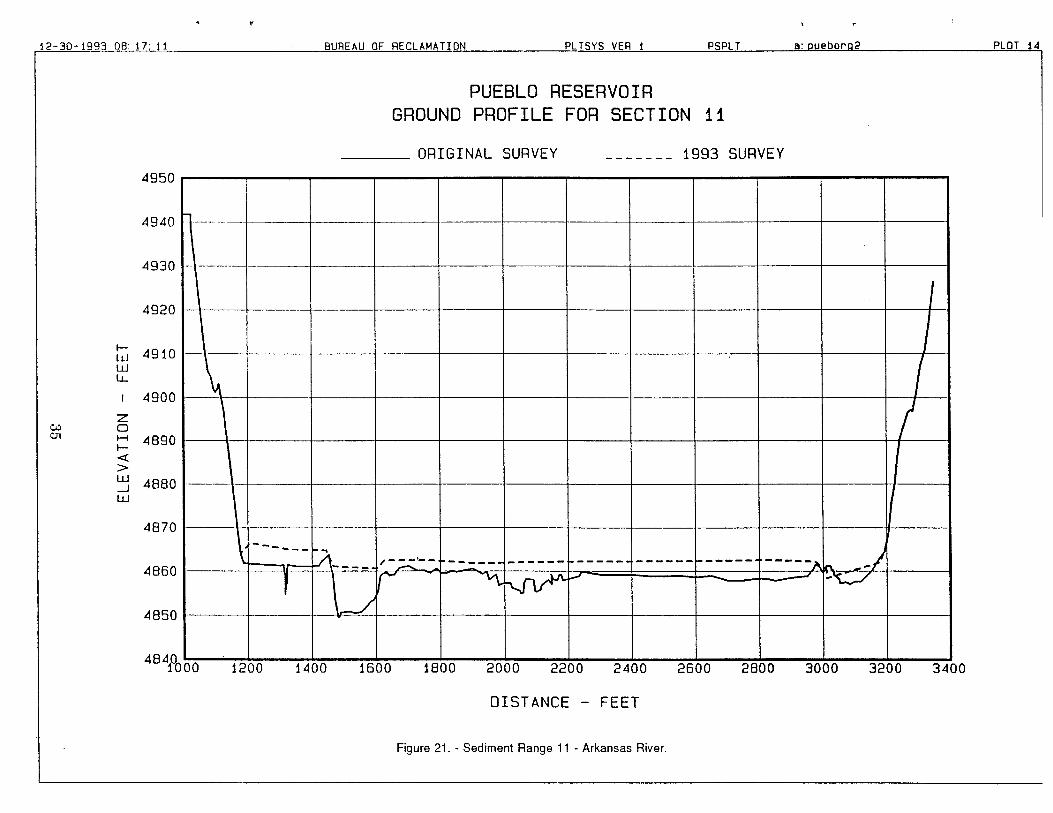
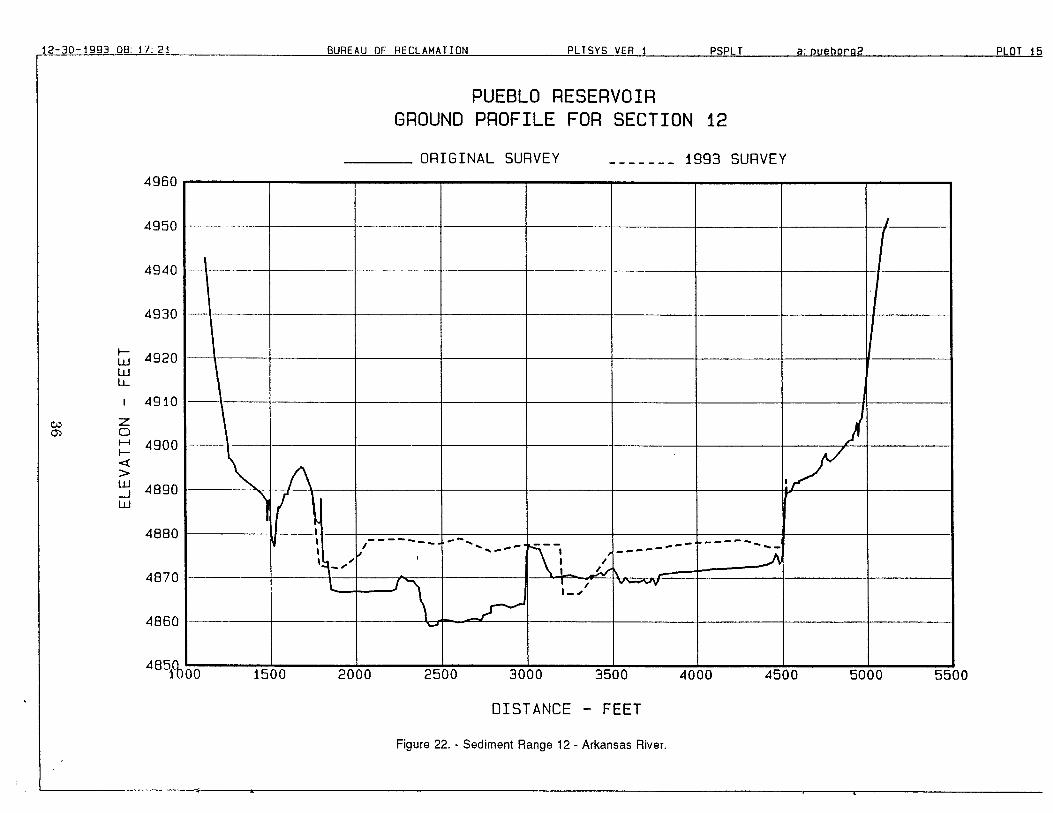
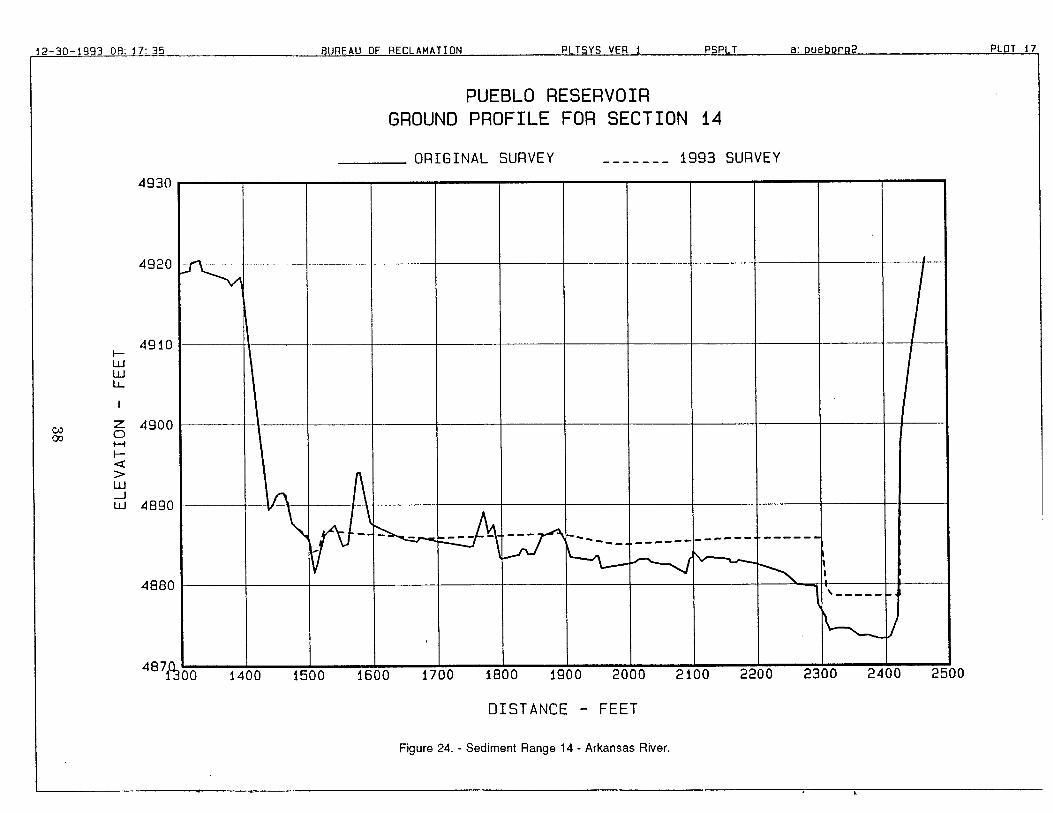
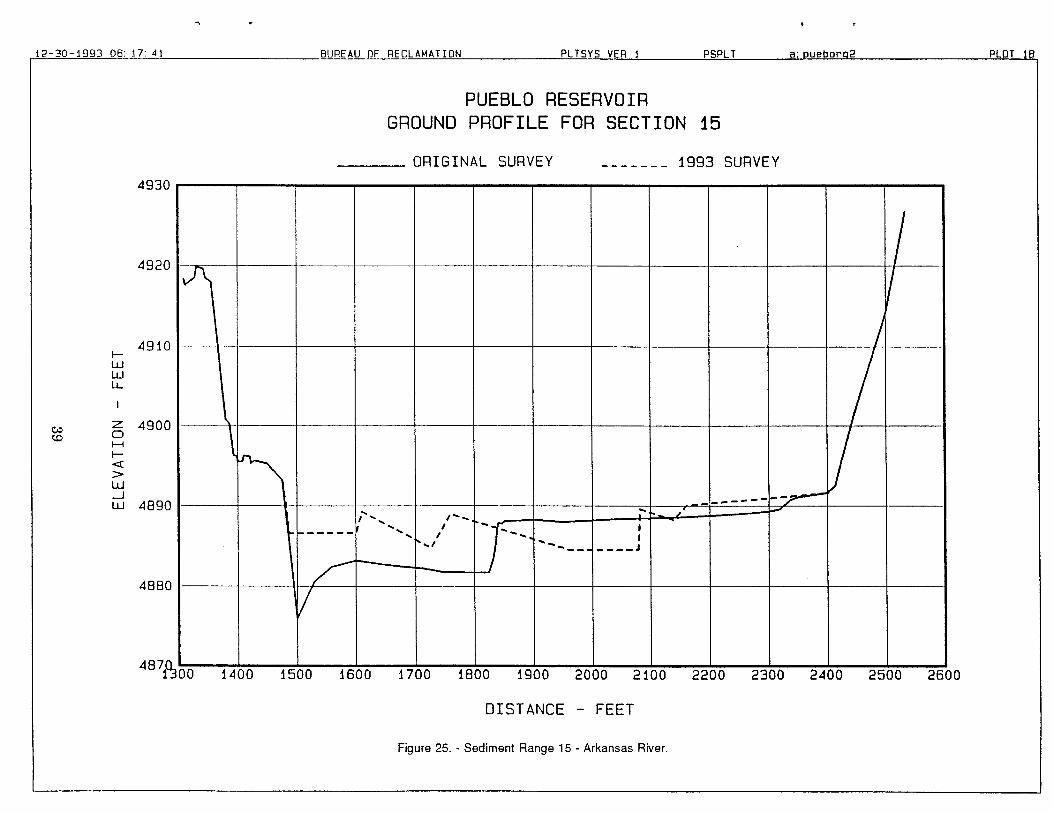
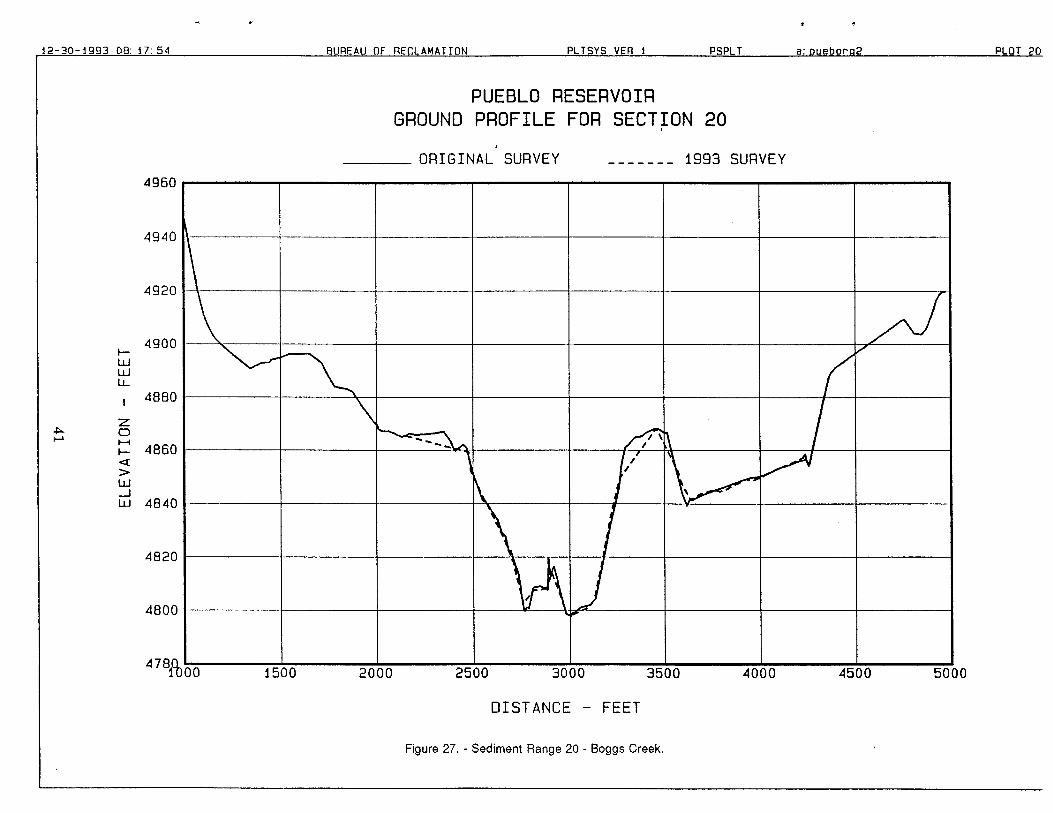
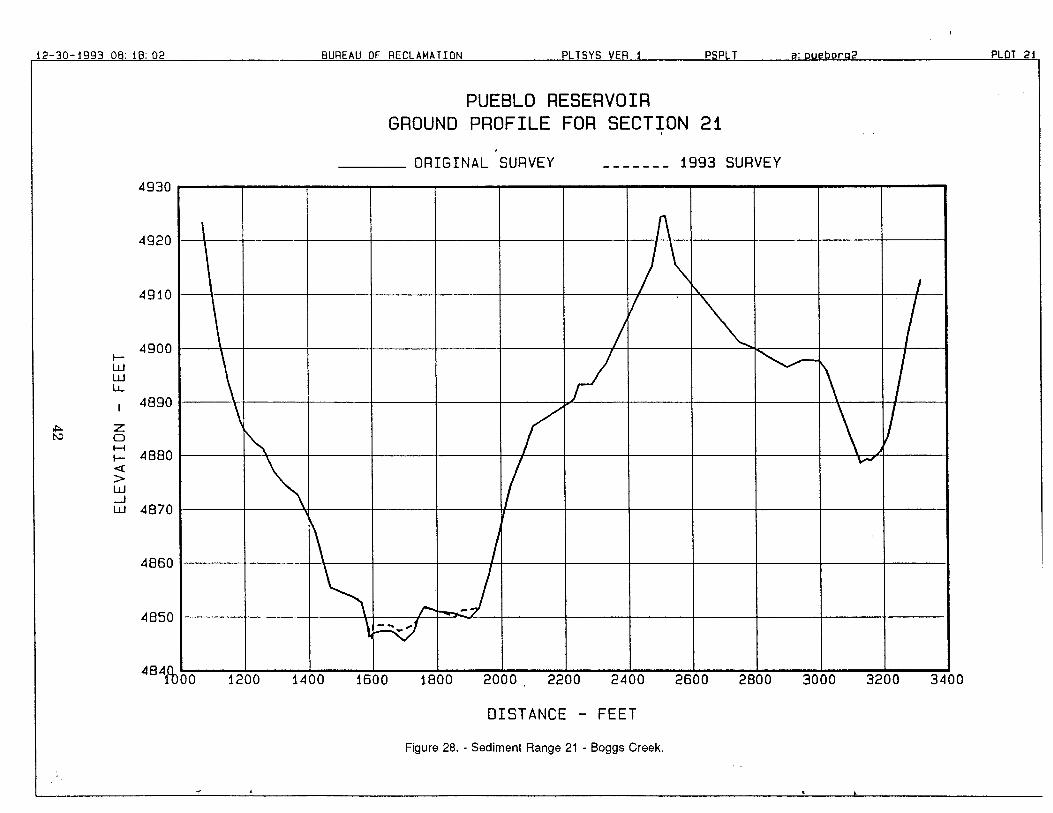
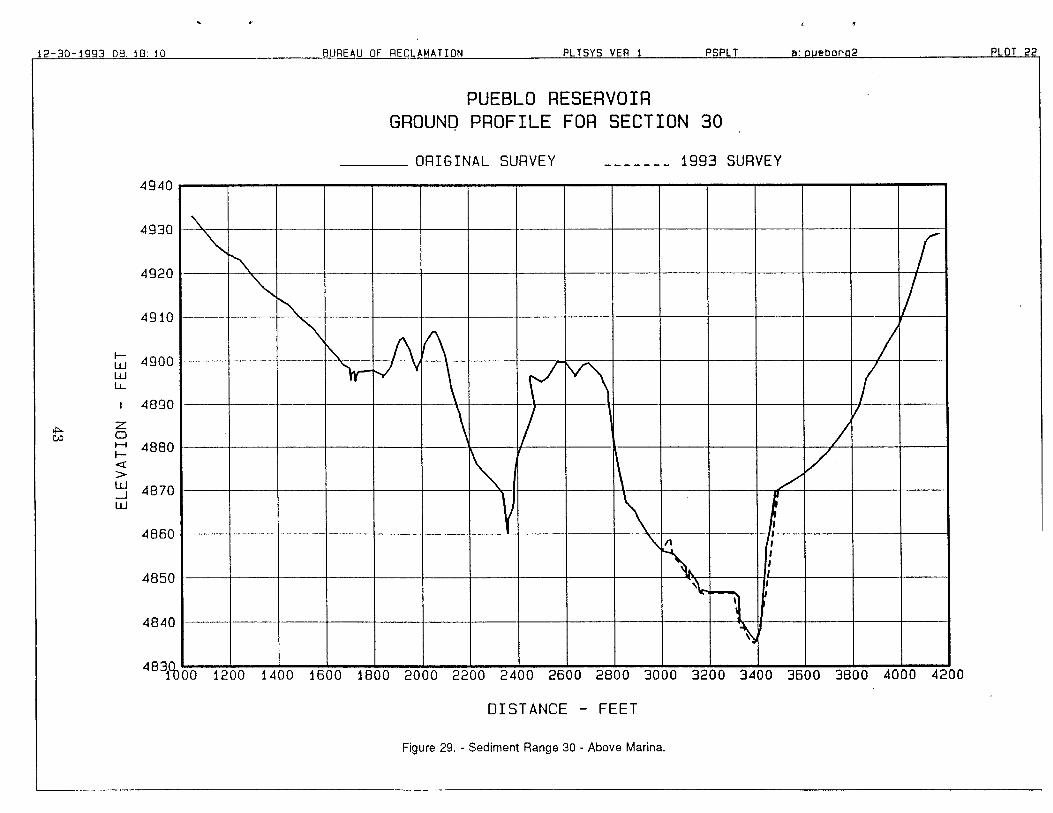
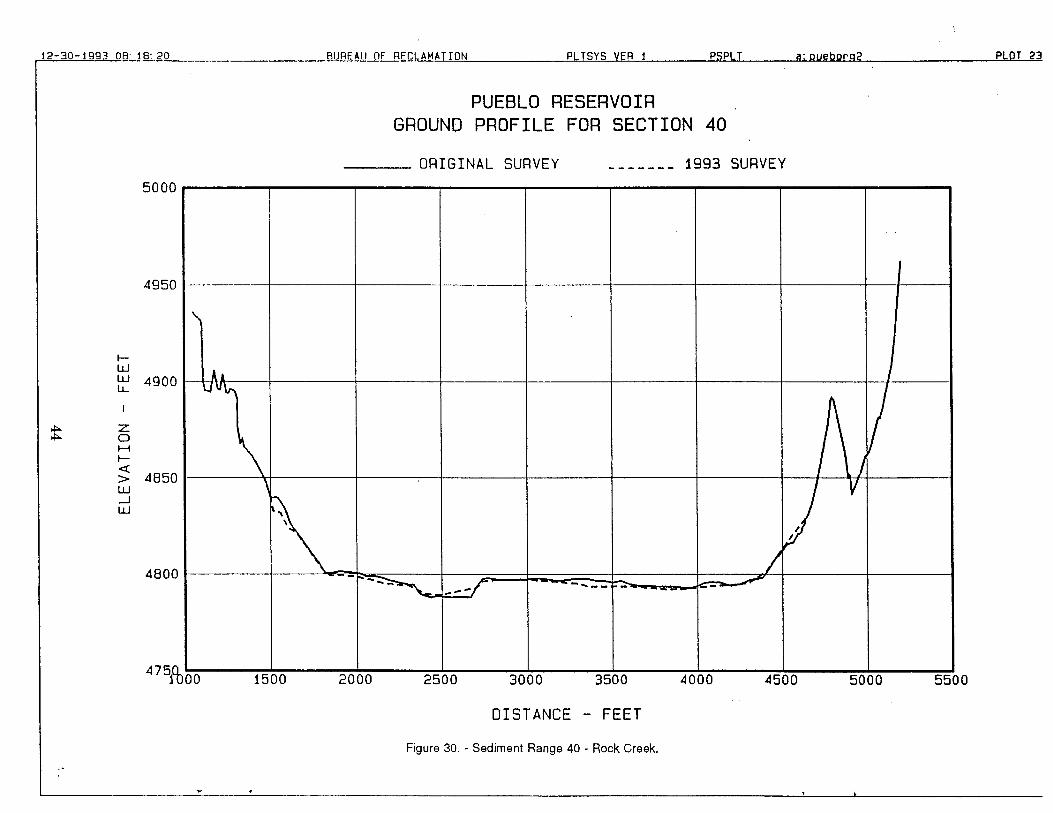
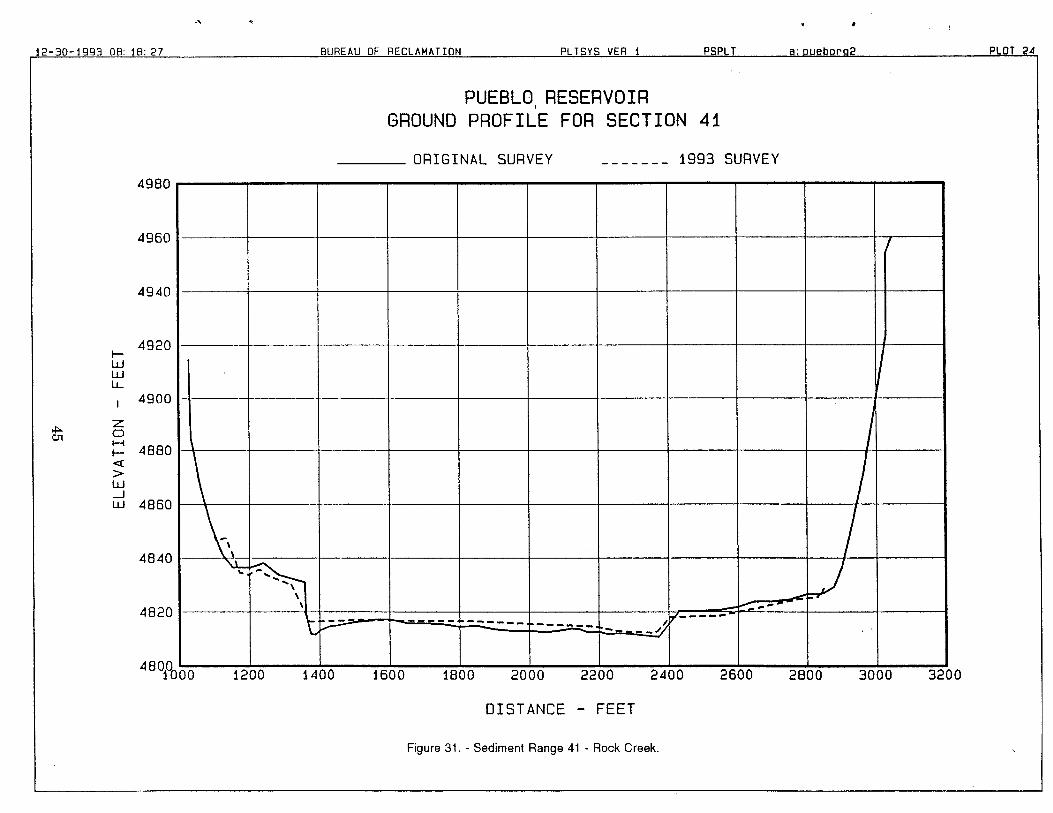
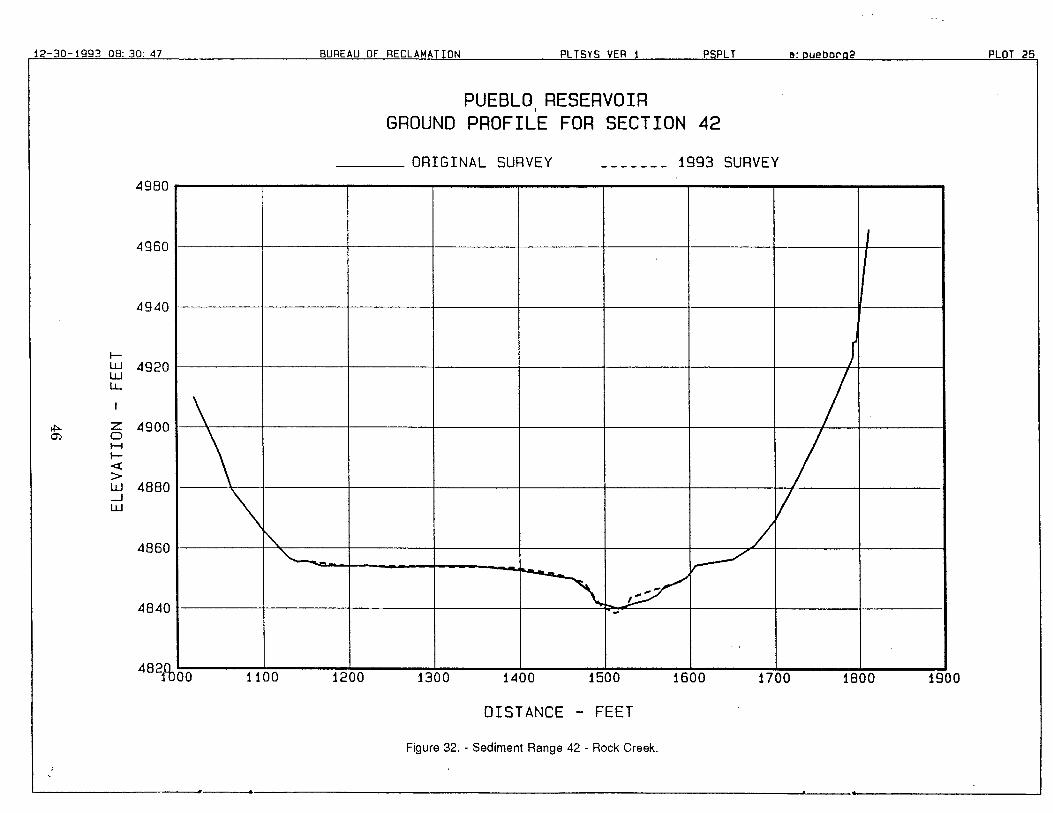
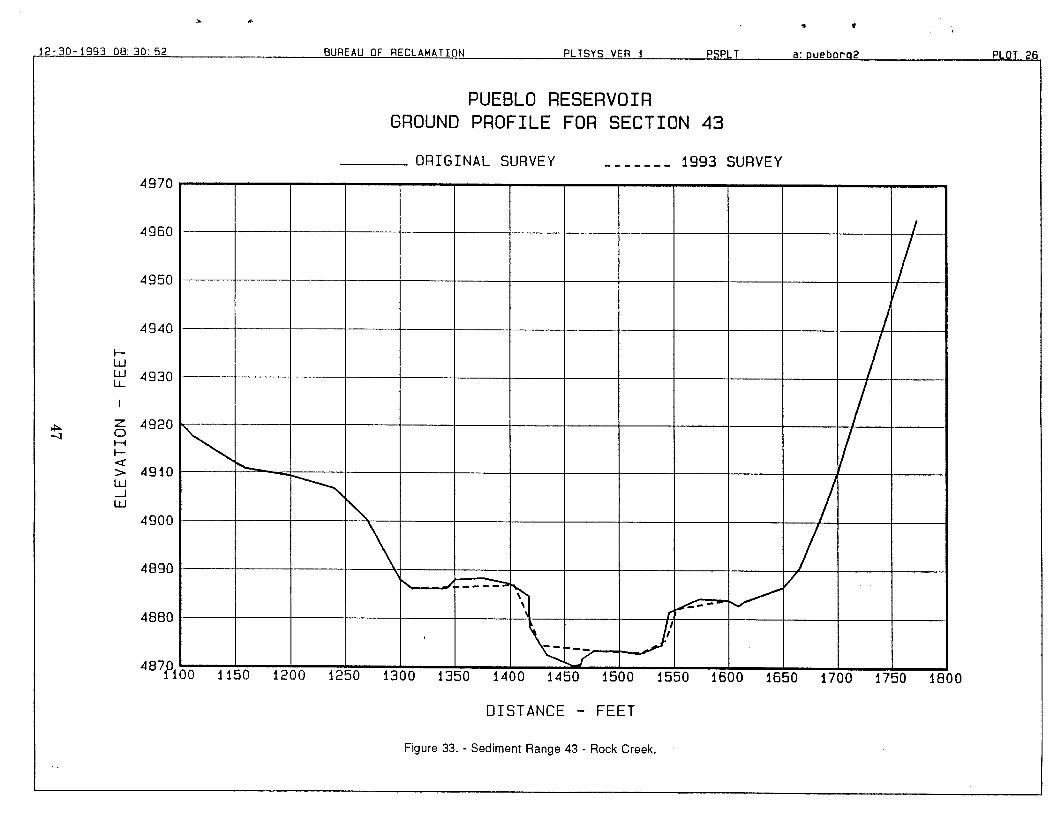
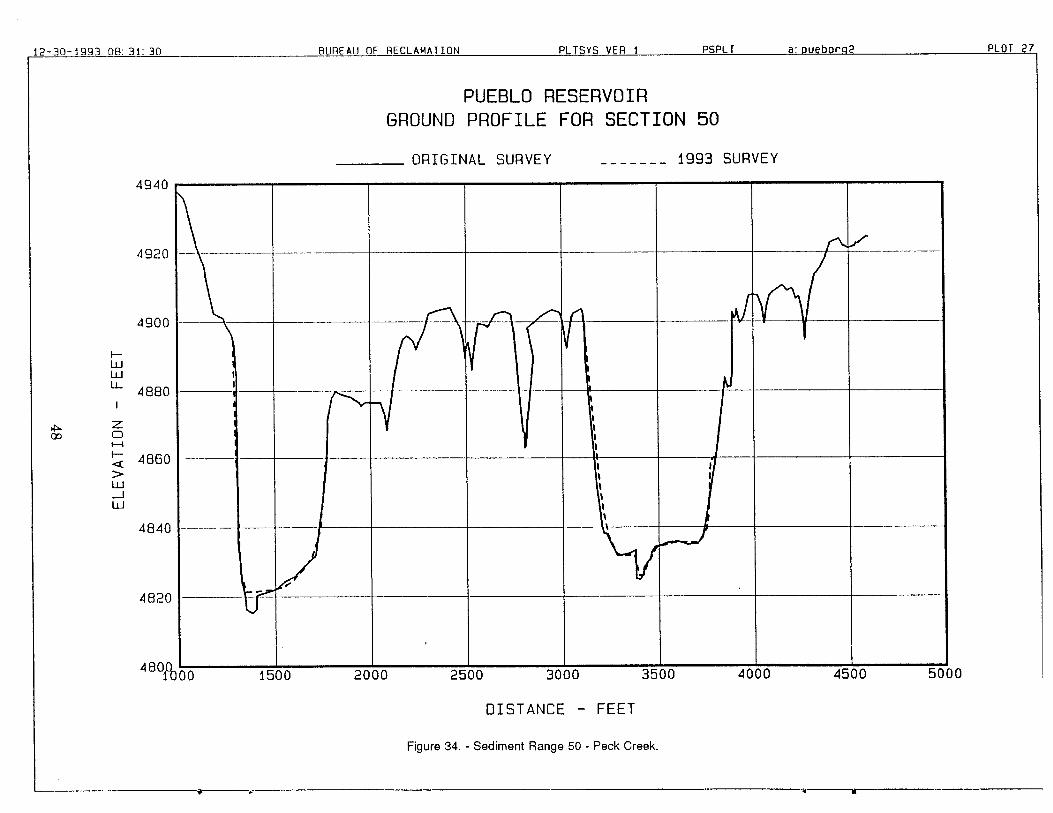
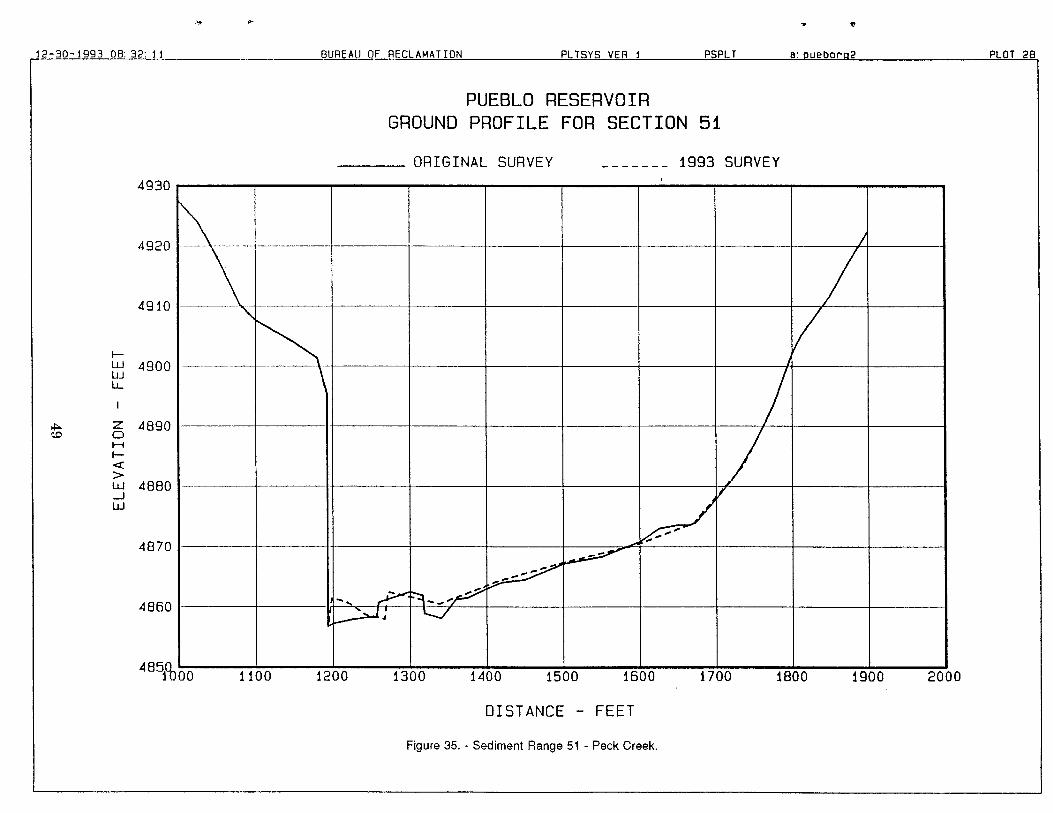
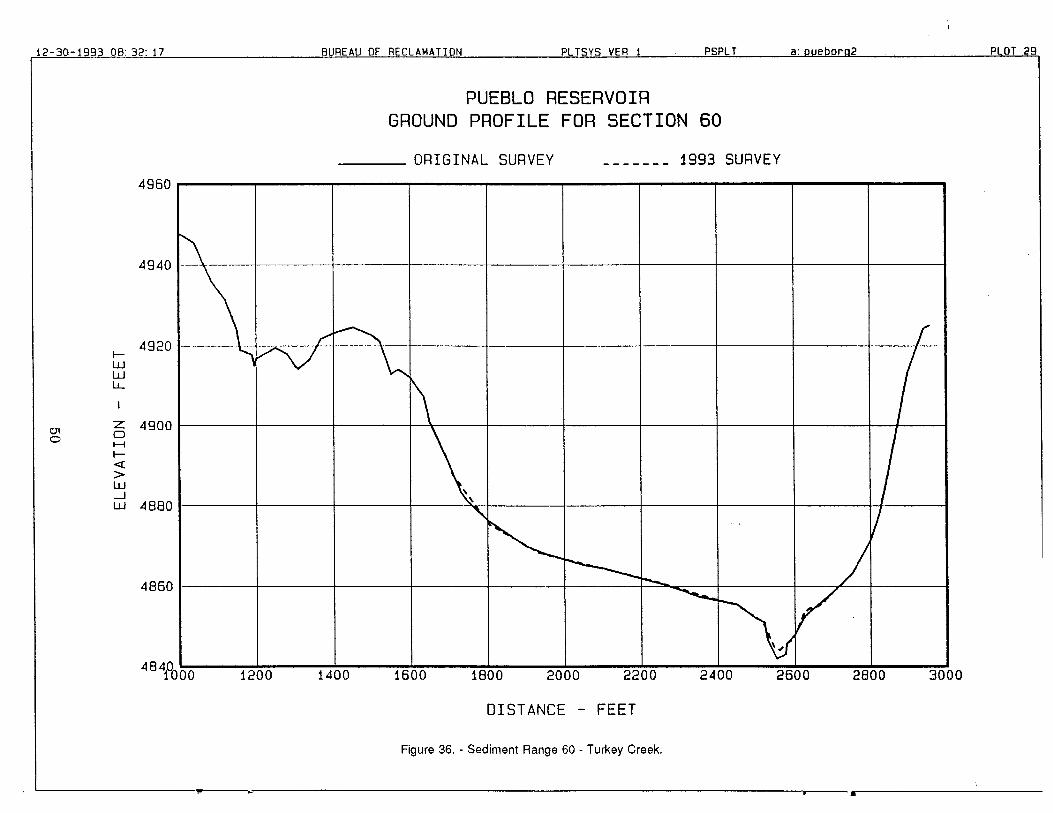
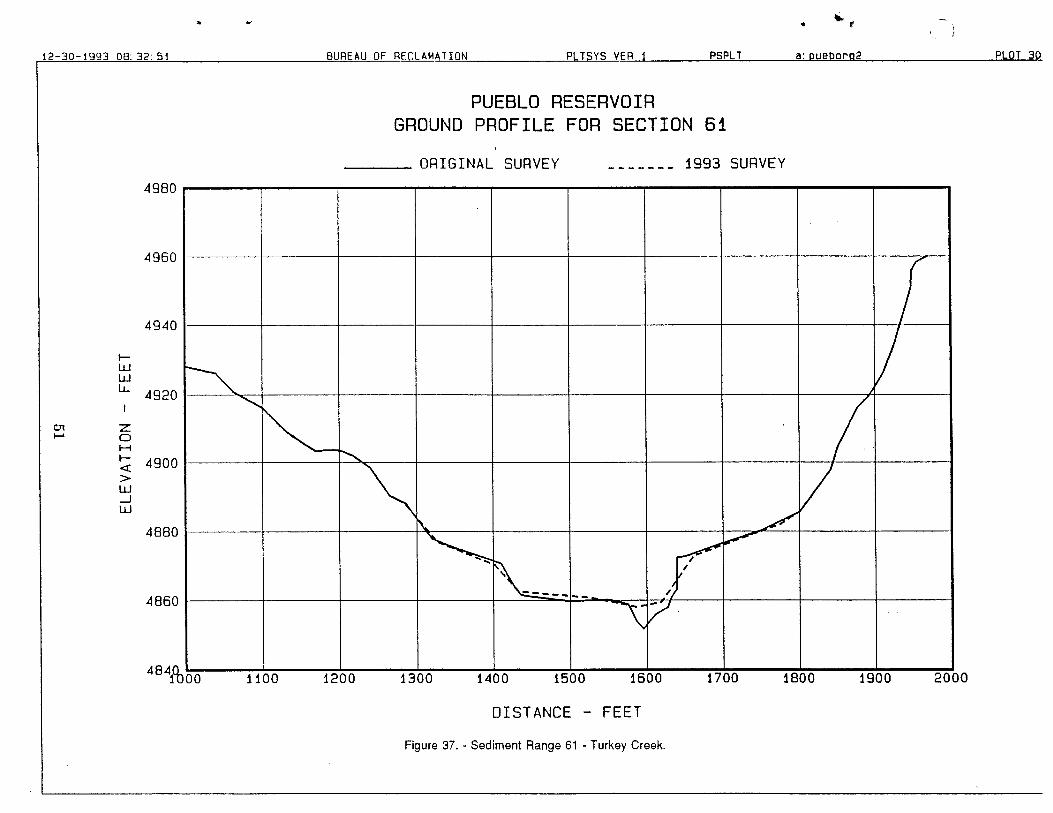
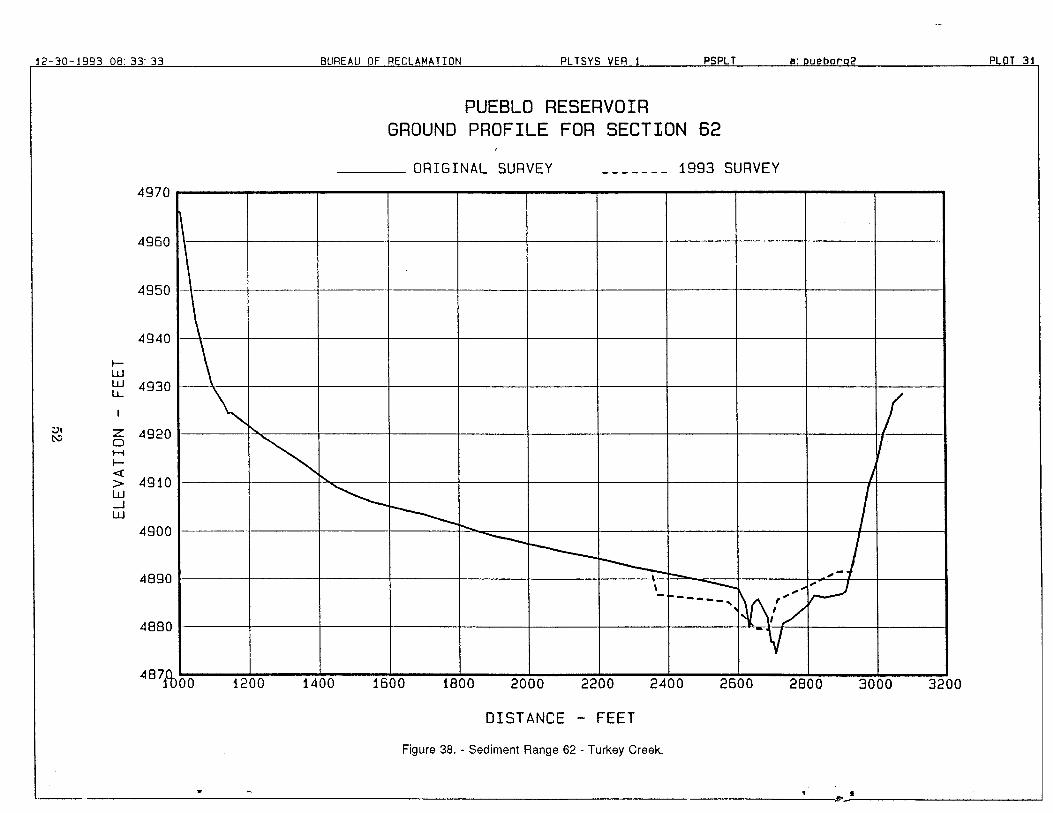
Ground profiles for the 31 original sediment ranges are shown on figures 8 through 38. Thesurvey data were obtained from copies of the original survey data books. Several of the lineshad portions resurveyed prior to reservoir inundation to account for borrow pit areas. Theoriginal data used for the sedimentation analysis accounted for the borrow pit areas. The1993 range profile data are superimposed on these plots to indicate the changes which haveoccurred and to represent in general the lateral distribution of sediment within the reservoir.A 1993 survey was not accomplished for range lines 17, 18, and 70 because they were locatedupstream from elevation 4900.0, and no reservoir deposition was judged to have occurredabove that elevation. For sediment computation purposes, a complete section was needed forall ranges; for this reason, the original data were inserted into the 1993 data file to completethe areas not surveyed in 1993.
6
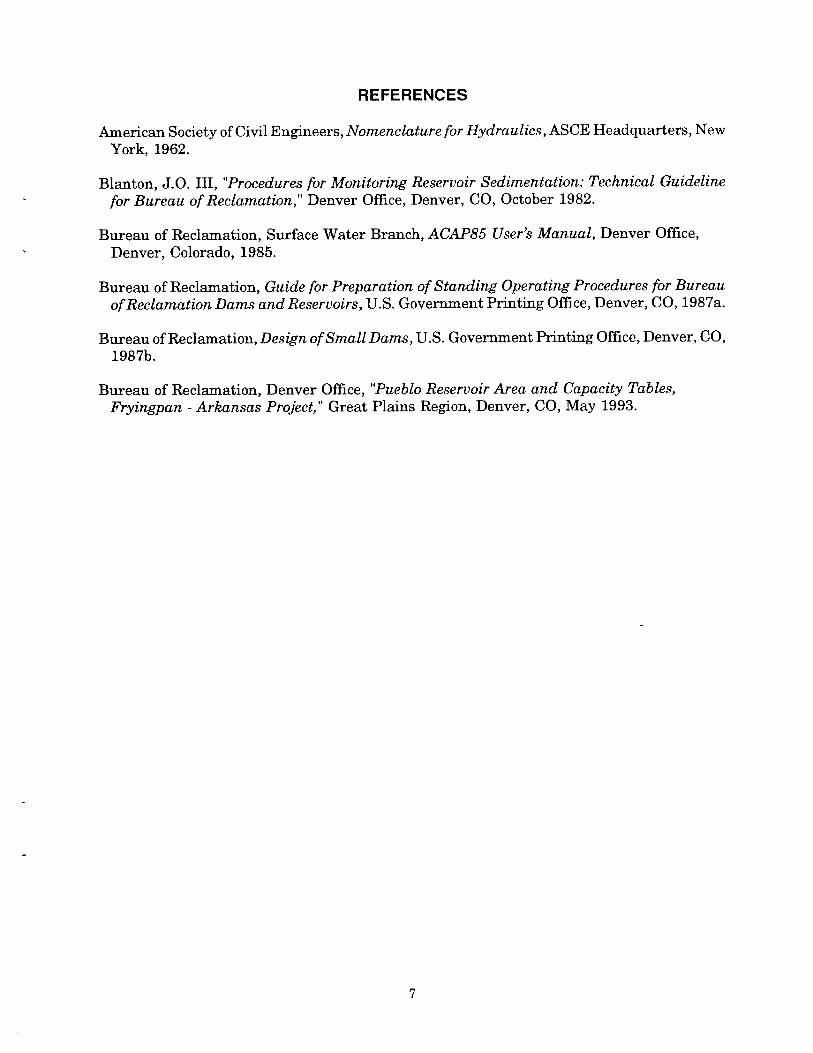
REFERENCES
American Society of Civil Engineers, Nomenclature for Hydraulics, ASCE Headquarters, NewYork, 1962.
Blanton, J.O. III, "Procedures for Monitoring Reservoir Sedimentation: Technical Guidelinefor Bureau of Reclamation," Denver Office, Denver, CO, October 1982.
Bureau of Reclamation, Surface Water Branch, ACAP85 User's Manual, Denver Office,Denver, Colorado, 1985.
Bureau of Reclamation, Guide for Preparation of Standing Operating Procedures for Bureauof Reclamation Dams and Reservoirs, U.S. Government Printing Office, Denver, CO, 1987a.
Bureau of Reclamation, Design of Small Dams, U.S. Government Printing Office, Denver, CO,1987b.
Bureau of Reclamation, Denver Office, "Pueblo Reservoir Area and Capacity Tables,Fryingpan - Arkansas Project," Great Plains Region, Denver, CO, May 1993.
7
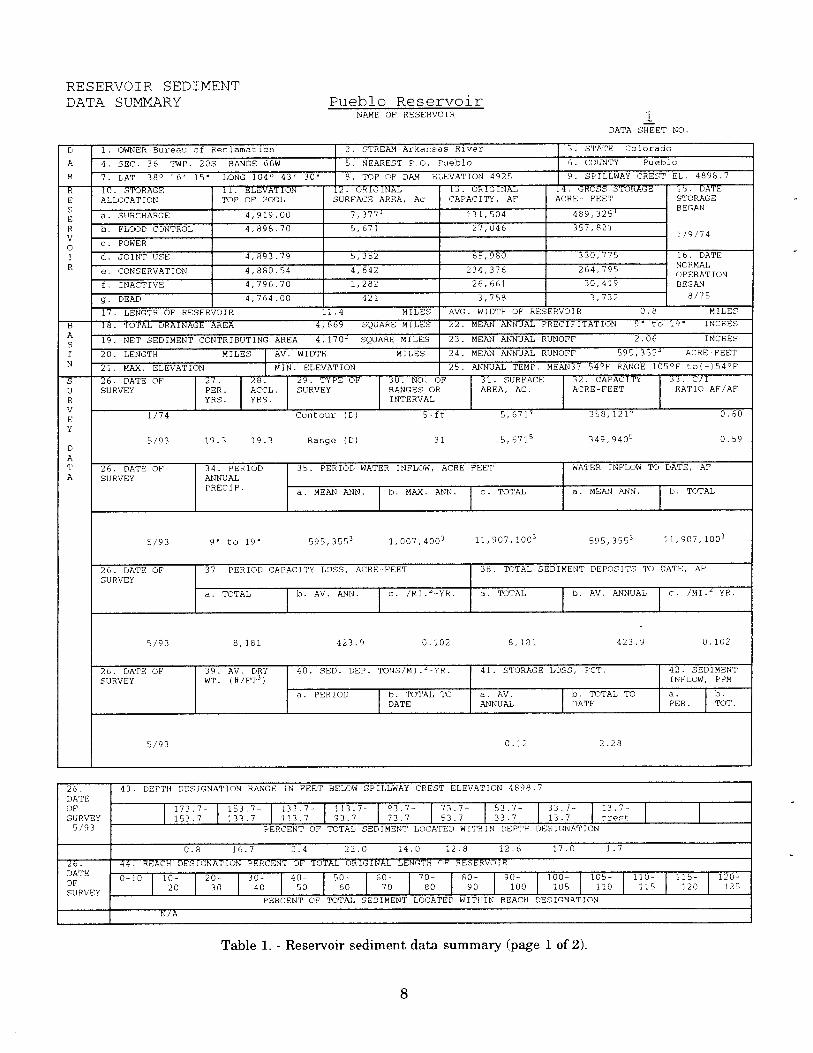
RESERVOIR SEDIMENTPueblo ReservoirDATA SY
NAME OF RESERVOIR 1DATA SHEET HO.
O 1. OWNER Bureau of Reclamation 2. STREAM Arkansas River 3. STATE Colorado
A 4. SEC. 36 TWP. 20S RANGE 66W 5. NEAREST P.O. Pueblo 6. COUNTY Pueblo
M 7. LAT 38° 16' 15 LONG 104° 43' 30 8. TOP OP DAM ELEVATION 4925 'F. SPILLWAY CREST EL. 4898.7
1 10. STORAGE 11. ELEVATION 2. ORIGINAL 13. ORIGINAL 4. CROSS STORAGE IS. DATE
E ALLOCATION TOP OF POOL SURFACE AREA, Ac CAPACITY, AF ACRE- FEET STORAGEBEGAN
a. SURCHARGE 4,919.00 7,377' 131,504 489,325'
H b FLOOD CONTROL 4,898.70 5,671 27,046 357,821.1/9/74V
oc. POWER
I 2. JOINT USE 4,893.79 5,352 65,980 110,775 16. DATE
R e. CONSERVATION 4,880.54 4,642 234,176 264,795IoN
f. INACTIVE 4,796.70 1,282 26,661 10,419 BEGAN
g. DEAD 4,764.00 421 3,758 1,732 8/75
17. LENGTH OF RESERvOIR 1 1.4 MILES AVG. WIDTH OF RESERVOIR 0.8 MILES
W 18. TOTAL DRAINAGE AREA 4,669 SQUARE MILED 22. MEAN ANNUAL PRECIPITATION 9 to 19 INCHES
19 NET SEDIMENT CONTRIBUTING AREA 4,l7O SQUARE MILES 23. MEAN ANNUAL RUNOFF 2.06 INCHES.
I 20. LENGTH MILES AV. WIDTH MILES 24. MEAN ANNUAL RUNOFF 595,355 ACRE-FEET
N21. MAX. ELEVATION WIN. ELEVATION 25. ANNUAL TEMP. MEANI7-54°F RANGE 105°F to(-)54°F
26. DATE OP 27. 28. 29. TYPE OF 30. NO. OF" 31. SURFACE 32. CAPACITY 33. C/I
U SURVEY PER. ACCL. SURVEY RANGES OR AREA, AC. ACRE-FEET RATIO AF/AF
R YRS. YRS. INTERVAL
1/74 Contour (D) 5-ft 5,671° 358,121° 0.60
5/93 19.3 19.3 Range (0) 31 5,671 349.940 0.590AT 26. DATE OF 34. PERIOD 35. PERIOD WATER INFLOW, ACRE FEET WATER INFLOW TO DATE, AFA SURVEY ANNUAL
PRECIP.a. MEAN ANN. b. MAX. ANN. c. TOTAL a. MEAN ANN. b. TOTAL
5/93 9 to 19 595,3553 1,007,400 11,907,100 595,3553 11,907,l00
26. DATE OF 37. PERIOD CAPACITY LOSS, ACRE-FEET 38. TOTAL SEDIMENT DEPOSITS TO DATE, AP
SURVEY
a. TOTAL b. AV. ANN. c. /MI.2-YR. a. TOTAL b. AV. ANNUAL c. /MI.2-YR.
5/93 8,181 423.9 0.102 8,181 423.9 0.102
26. DATE OF 39. AV. DRY 40. SED. DEP. TONS/MI.2-YR. 41. STORAGE LOSS, PCT. 42. SEDIMENT
SURVEY wr. )#/FT') INFLOW, PPM
a. PERIOD b. TOTAL TO a. AV. b. TOTAL TO a. b.DATE ANNUAL DATE PER. TOT.
5/93 0.12 2.28
26.DATE
43. DEPTH DESIGNATION RANGE IN FEET BELOW SPILLWAY CREST ELEVATION 4898.7
OFSURVEY
173.7-153.7
153.7-133.7
133.7-113.7
113.93.7
7- 93.7-73.7
73.7-53.7
53.7-33.7
33.7-13.7
13.7-crest
5/93 PERCENT OF TOTAL SEDIMENT LOCATED WITHIN DEPTH DESIGNATION
0.8 16.7 2.4 22. 0 14.0 12.8 12.6 17.0 1.7
26. 44. REACH DESIGNATION PERCENT OF TOTAL OR IGINAL LENGTH OP RESERVOIRDATE
OUR VEY
0-10 10-20
20-30
30-40
40-50
50-60
60-70
70-80
80-90
90-100
100-105
105-110
130-115
115-120
120-125
PERCENT OP TOTAL SEDIMENT LOCATED WITHIN REACH DESIGNATION
N/A
Table 1. - Reservoir sediment data summary (page 1 of 2).
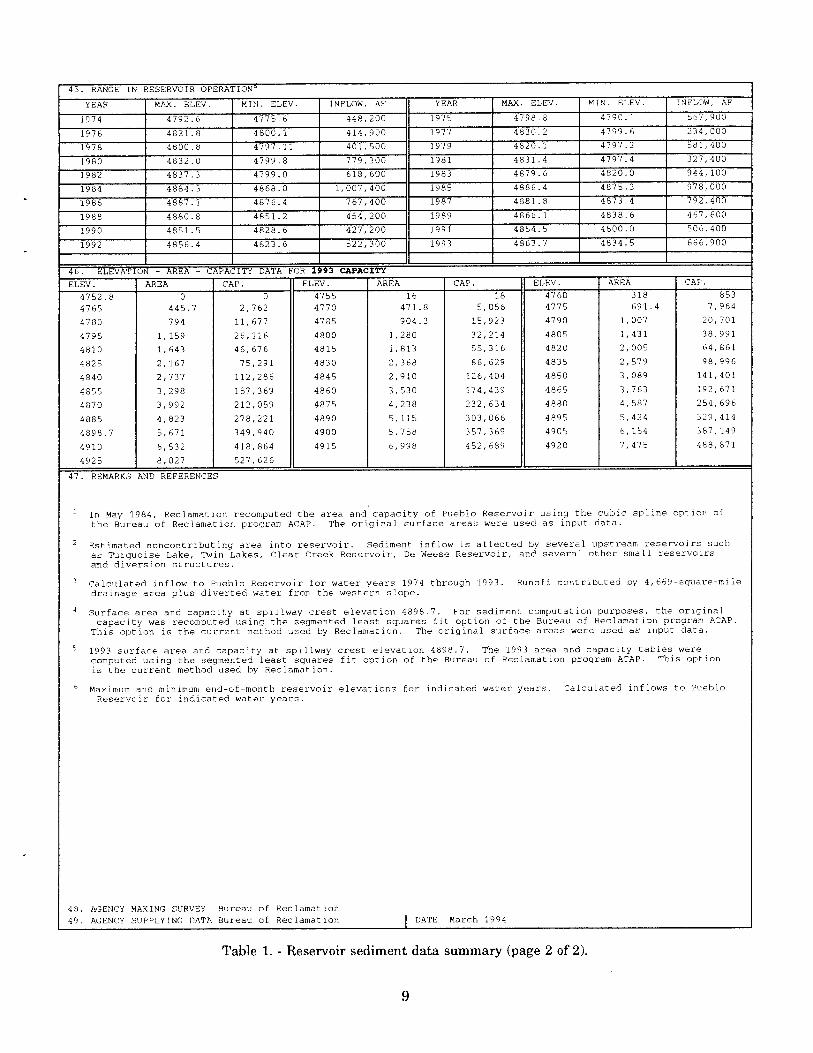
45. RANGE IN RESERVOIR OPERATION
YEAR MAX. ELEV. MIN. ELEV. INFLOW, AK YEAR MAX. ELEV. FIN. ELEV. INFLOW, AF
1974 4792.6 4775.6 448,200 1976 4798.8 4790.1 667,900
1976 4821.8 4830.1 414,900 1977 4830.2 4799.6 234,000
1978 4800.8 4797.11 401,500 1979 4820.1 4797.2 581,400
1980 4832.0 4799.8 779,300 1981 4831.4 4797.4 327,400
1982 4837.3 4799.0 618,600 1983 4879.6 4820.0 944,100
1984 4884.3 4868.0 1,007,400 1985 4886.4 4875.3 978,000
1986 4887.1 4876.4 767,400 1987 4881.8 4873.4 792,400
1988 4880.8 4853.2 454,200 1989 4866.1 4838.6 467,600
1990 4851.5 4828.6 427,200 1991 4854.5 4800.0 506,400
1992 4856.4 4823.6 522,300 1993 4863.7 4834.5 666,900
46. ELRVATIOn - AREA - cPA.ITY DATA FOR 199 CAPA'V ___________
ELEV. AREA CAP. ELEV. AREA CAP. ELEV. AREA CAP.
4752.8 0 0 4755 16 18 4760 318 853
4765 445.7 2,762 4770 471.8 5,056 4775 691.4 7,964
4780 794 11,677 4785 904.3 15,923 4790 1,007 20,701
4795 1,159 26,116 4800 1,280 32,214 4805 1,431 38,991
4810 1,643 46,676 4815 1,813 55,316 4820 2,005 64.861
4825 2,167 75,291 4830 2,368 86,629 4835 2,579 98,996
4840 2,737 112,286 4845 2,910 126,404 4850 3,089 141,401
4855 3,298 157,369 4860 3,530 174,439 4865 3,763 192.671
4870 3,992 212,059 4875 4,238 232,634 4880 4,587 254,696
4885 4,823 278,221 4890 5,115 303,066 4895 5,424 329,414
4898.7 5,671 349,940 4900 5,758 357,369 4905 6,154 387,149
4910 6,532 418,864 4915 6,998 452,689 4920 7,475 488,871
4925 8,027 527,626_____________ ____________ _____________ _____________
47. REMARKS AND REFERENCES
In May 1984, Reclamation recomputed the area and capacity of Pueblo Reservoir using the cubic spline option ofthe Bureau of Reclamation program ACAP. The original surface areas were used as input d ata.
2 Estimated noncontributing area into reservoir. Sediment inflow is affected by several upstream reservoirs suchas Turquoise Lake, Twin Lakes, Clear Creek Reservoir, De Weese Reservoir, and several ot her small res ervoirsand diversion structures.
Calculated inflow to Pueblo Reservoir for water years 1974 through 1993. Runoff contributed by 4,669- square-miledrainage area plus diverted water from the western slope.
Surface area and capacity at spillway crest elevation 4898.7. For sedime nt computation purposes, the originalcapacity was recomputed using the segmented least squares fit option of the Bureau of Reclamation program ACAP.This option is the current method used by Reclamation. The original surf ace areas were used as input data.
1993 surface area and capacity at spillway crest elevation 4898.7. The 1993 area and capacity tables werecomputed using the segmented least squares fit option of the Bureau of Re clamation program ACAP. Thi s optionis the current method used by Reclamation.
6 Maximum and minimum end-of-month reservoir elevations for indicated water years. Calcul ated inflows to PuebloReservoir for indicated water years.
48. AGENCY MAKING SURVEY Bureau of Reclamation49. AGENCY SUPPLYING DATA Bureau of Reclamation DATE March 1994
Table 1. - Reservoir sediment data summary (page 2 of 2).
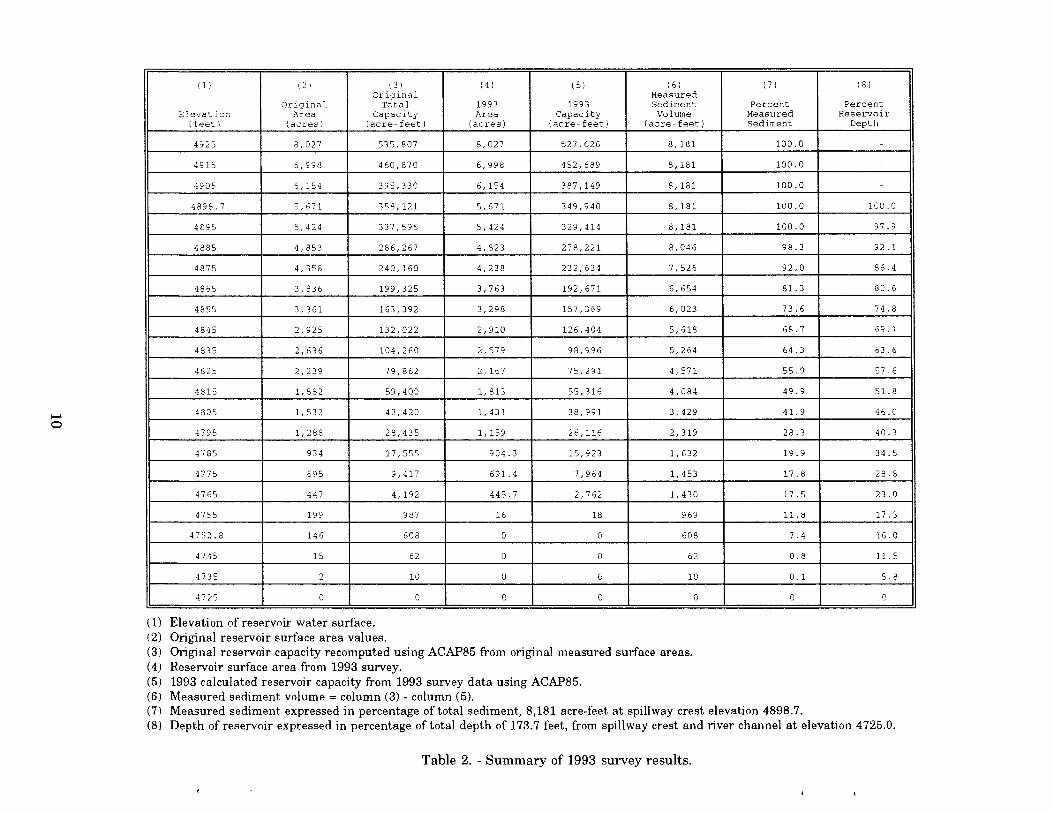
I.C
)l)
Elevation(feet)
(2)
OriginalArea
(acres)
(3)OriginalTotal
Capacity(acre-feet)
(4)
1993Area
(acres)
(5)
1993Capacity
(acre-feet)
(6)MeasuredSedimentVolume
(acre-feet)
(7)
PercentMeasuredSediment
(8)
PercentReservoir
Depth
4925 8,027 535,807 8,027 527,626 8,181 100.0 -
4915 6,998 460,870 6,998 452,689 8,181 100.0 -
4905 6,154 395,330 6,154 387,149 8,181 100.0 -
4898.7 5,671 358,121 5,671 349,940 8,181 100.0 100.0
4895 5,424 337,595 5,424 329,414 8,181 100.0 97.9
4885 4,853 286,267 4,823 278,221 8,046 98.3 92.1
4875 4,358 240,160 4,238 232,634 7,526 92.0 86.4
4865 3,836 199,325 3,763 192,671 6,654 81.3 80.6
4855 3,361 163,392 3,298 157,369 6,023 73.6 74.8
4845 2,925 132,022 2,910 126,404 5,618 68.7 69.1
4835 2,636 104,260 2,579 98,996 5,264 64.3 63.6
4825 2,239 79,862 2,167 75,291 4,571 55.9 57.6
4815 1,882 59,400 1,813 55,316 4,084 49.9 51.8
4805 1,532 42,420 1,431 38,991 3,429 41.9 46.0
4795 1,288 28,435 1,159 26,116 2,319 28.3 40.3
4785 934 17,555 904.3 15,923 1,632 19.9 34.5
4775 695 9,417 691.4 7,964 1,453 17.8 28.8
4765 447 4,192 445.7 2,762 1,430 17.5 23.0
4755 199 987 16 18 969 11.8 17.3
4752.8 146 608 0 0 608 7.4 16.0
4745 15 62 0 0 62 0.8 11.5
4735 2 10 0 0 10 0.1 5.8
4725 0 0 0 0 0 0 0
(1) Elevation of reservoir water surface.(2) Original reservoir surface area values.(3) Original reservoir capacity recomputed using ACAP85 from original measured surface areas.(4) Reservoir surface area from 1993 survey.(5) 1993 calculated reservoir capacity from 1993 survey data using ACAP85.(6) Measured sediment volume = column (3) - column (5).(7) Measured sediment expressed in percentage of total sediment, 8,181 acre-feet at spillway crest elevation 4898.7.(8) Depth of reservoir expressed in percentage of total depth of 173.7 feet, from spillway crest and river channel at elevation 4725.0.
Table 2. - Summary of 1993 survey results.
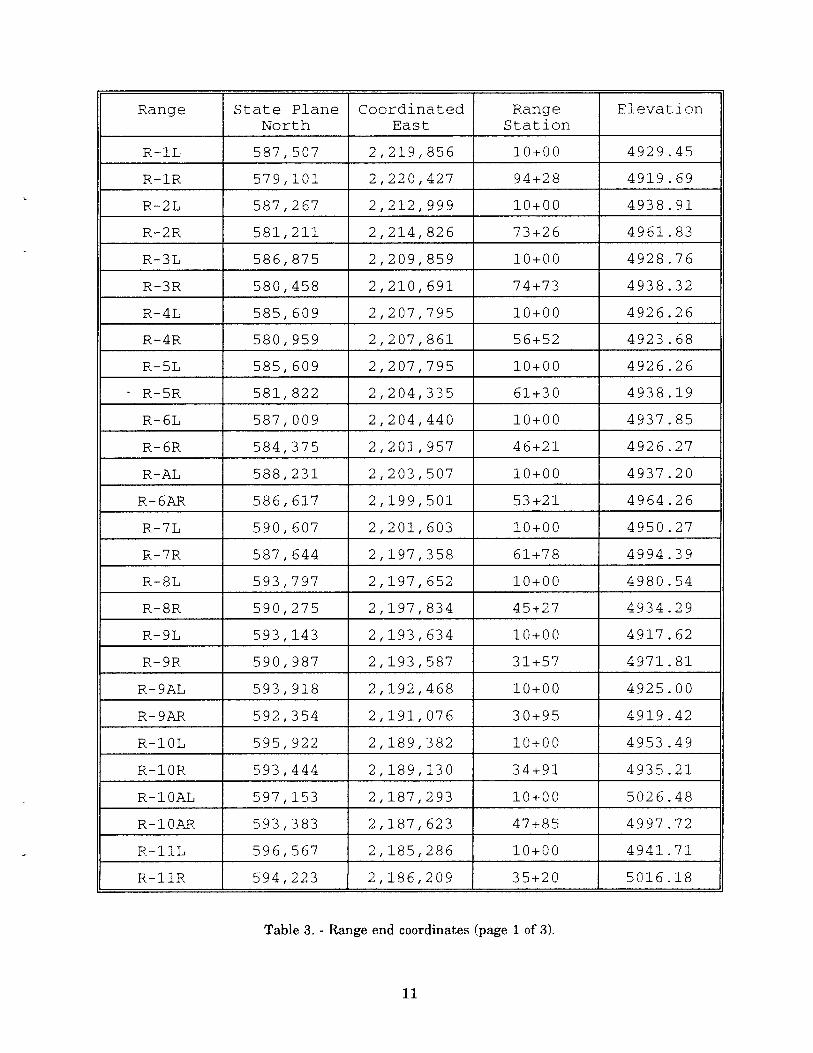
Range State PlaneNorth
CoordinatedEast
RangeStation
Elevation
R-1L 587,507 2,219,856 10+00 4929.45
R-1R 579,101 2,220,427 94+28 4919.69
R-2L 587,267 2,212,999 10+00 4938.91
R-2R 581,211 2,214,826 73+26 4961.83
R-3L 586,875 2,209,859 10+00 4928.76
R-3R 580,458 2,210,691 74+73 4938.32
R-4L 585,609 2,207,795 10+00 4926.26
R-4R 580,959 2,207,861 56+52 4923.68
R-5L 585,609 2,207,795 10+00 4926.26
- R-5R 581,822 2,204,335 61+30 4938.19
R-6L 587,009 2,204,440 10+00 4937.85
R-6R 584,375 2,201,957 46+21 4926.27
R-AL 588,231 2,203,507 10+00 4937.20
R-6AR 586,617 2,199,501 53+21 4964.26
R-7L 590,607 2,201,603 10+00 4950.27
R-7R 587,644 2,197,358 61+78 4994.39
R-8L 593,797 2,197,652 10+00 4980.54
R-8R 590,275 2,197,834 45+27 4934.29
R-9L 593,143 2,193,634 10+00 4917.62
R-9R 590,987 2,193,587 31+57 4971.81
R-9AL 593,918 2,192,468 10+00 4925.00
R-9AR 592,354 2,191,076 30+95 4919.42
R-1OL 595,922 2,189,382 10+00 4953.49
R-1OR 593,444 2,189,130 34+91 4935.21
R-1OAL 597,153 2,187,293 10+00 5026.48
R-1OAR 593,383 2,187,623 47+85 4997.72
R-I1L 596,567 2,185,286 10+00 4941.71
R-11R 594,223 2,186,209 35+20 5016.18
Table 3. - Range end coordinates (page 1 of 3).
11

Range State PlaneNorth
CoordinatesEast
RangeStation
Elevation
____________
R-12L 596,787 2,183,661 10+00 4958.50
R-12R 593,338 2,181,392 51+30 4951.77
R-13L 598,041 2,180,579 10+00 5096.39
R-13R 596,384 2,179,565 29+43 4952.85
R-14L 599,139 2,178,125 10+00 5126.88
R-14R 597,780 2,177,388 25+46 4958.83
R-15L 600,190 2,177,160 10+00 5130.88
R-15R 599,580 2,175,601 26+75 4973.79
R-l6L 602,340 2,174,976 10+00 5112.17
-R-16R 600,945 2,173,985 27+11 4979.47
R-17L 604,115 2,170,788 10+00 4939.50
R-17R 602,928 2,169,824 25+30 4949.46
R-1SL 606,968 2,168,478 10+00 4994.91
R-18R 605,201 2,167,850 28+75 5006.77
R-20L 579,326 2,216,463 10+00 4983.01
R-21R 575,943 2,218,757 33+18 4921.68
R-30L 587,267 2,212,999 10+00 4938.91
R-30R 586,875 2,209,859 41+65 4928.76
R-40L 580,458 2,210,691 10+00 4938.32
R-40R 581,211 2,214,826 52+04 4961.83
R-41L 578,340 2,210,256 10+00 4930.07
R-41R 577,707 2,212,202 30+47 4959.98
R-42L 574,679 2,210,598 10+00 4943.09
R-42R 574,714 2,211,410 18+12 4965.54
R-43L 572,053 2,209,129 10+00 4948.79
R-43R 571,389 2,209,557 17+90 5002.19
R-50L 581,822 2,204,335 10+00 4938.19
R-50R 580,959 2,207,861 46+31 4923.68
Table 3. - Range end coordinates (page 2 of 3).
12
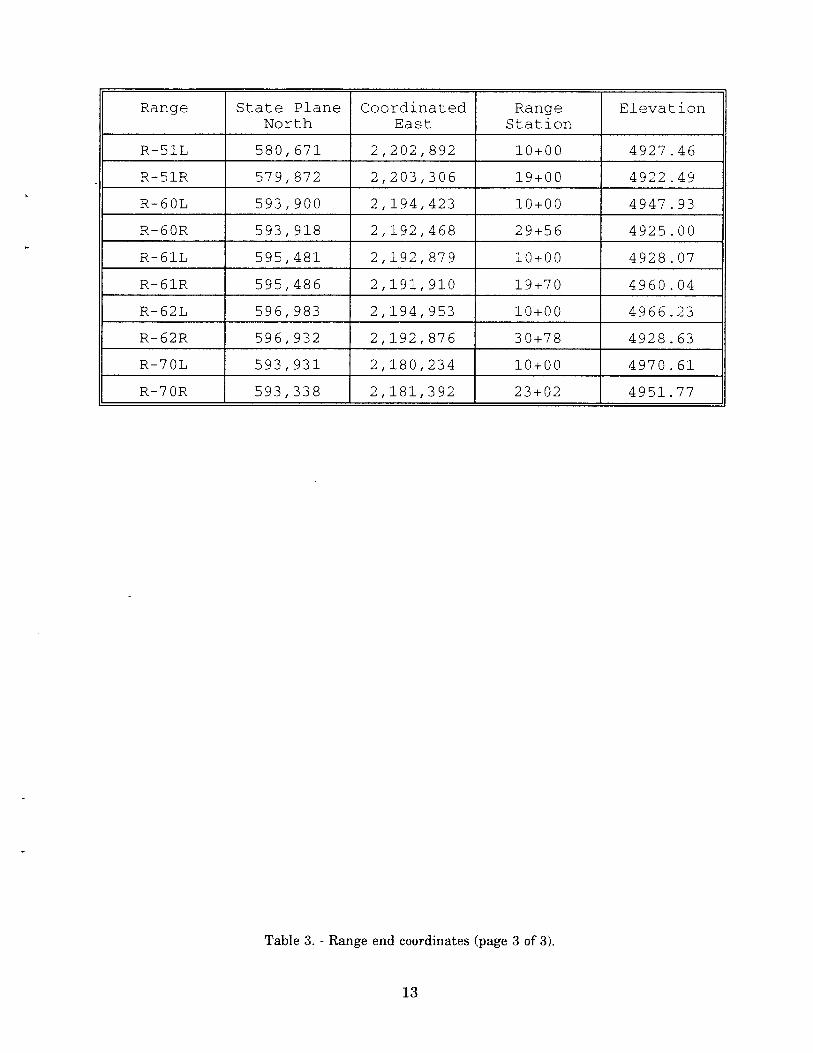
Range State PlaneNorth
CoordinatedEast
RangeStation
Elevation
R-51L 580,671 2,202,892 10+00 4927.46
R-5lR 579,872 2,203,306 19+00 4922.49
R-60L 593,900 2,194,423 10+00 4947.93
R-60R 593,918 2,192,468 29+56 4925.00
R-6lL 595,481 2,192,879 10+00 4928.07
R-61R 595,486 2,191,910 19+70 4960.04
R-62L 596,983 2,194,953 10+00 4966.23
R-62R 596,932 2,192,876 30+78 4928.63
R-70L 593,931 2,180,234 10+00 4970.61
R-70R 593,338 2,181,392 23+02 4951.77
Table 3. - Range end coordinates (page 3 of 3).
13

--------
/ DENvER
C
qL/
//NORTHSIDE - A P A N 0
0o COLLECTION ____ _____ _____ _____ _____
1enood SYS TEM' I - ____ _____ _____ _____
-.fSprings..IUCHARLES H. BOUSTEAD TUNNEL I
RUE\LLAKE J E L 8 E R T
(51./OAR 4OA DAM)OLeadyjile DOUGLAS I
flçsER VOIR'orP rw.,. LANEs DAM)SOUTHSIDE
COLLECTIO/1J/'.
LAKES_____• I _____
______________ --.'OTERO POWER PLANT I \SYSTEMEL P A S 0MT EL BERT cONDUIr\ I
ado SprinqsC 14 C V C N N C
POWERPLANT" LINCOLN)
MTELBERTPUMPEDSTOAAiEI
F0UNTA1N VALLEY CONDUIT ____
I _________ __________
UTA/N- _( W A
PueIoCROWI.frY j eltlb
UEBLO RESEVOICroIeyj
I
- -
EXPLANATION
CUSTER I PU EBYLO
/HUERryo( y'L A S
ILamar
ajunto a CIL,
ARKANSAS VALLEY CONDUITPROWCRS
P 0
1'
ANJIMAS
...RESERVOIR
4)-4. PIPELINE OR CONDUITPOWER PLANT
• PUMPING PLANT
TUNNEL
S 0 S 10 IS 20
SCALE OF MILES
Figure 1. - Pueblo Reservoir location map.

Space intentionally left blank due to security concerns

Space intentionally left blank due to security concerns
- "I
': i;'
9
''
H.
a'.'
4.- -. .
-'
-----.-.-
-
h rfl4 T11
I ) Ii']
.'ILVt'
7
/ "L,7V
i1'i . " ." .
* I,
:-. 'I -
'I-
- I-I \ f
'[i••"
ç; _-',-j _,.,.,f,.\ I
- . -,..1''1 -
'-. 0
-: '' '5• /;_
-! - ' ' rii I- - '- -, r'','
.;+--- Lw.I •
- 't'T, r
-i-
'- .; [' _)j7 -.
-: -
c1''Hcç^/:U;
JL_C /.:i_
-1'7 I.
/y ...
•1•--.---I
'../
I 7'
-.-
WIDTH ADJUSTMENT METHOD fOR REV/S/HGCON TOUR AREAS iN COFIPU TA TIOiV OF
RESERVOIR SEDIMENTATION
Sediment
SedimentRono.-,
Schematic Segmentof Reservoir
Initiøl Survey New SurveyContour 4reo 4, Contour Area (Computed)Downstream Width $',' Downstream Width
a Upstream Width W,"' Upstream Width
, I,,W,ILW,
fzA, ad0 ( W01,LW01'2
Figure 5. - Width adjustment method for revising contour area.
19
C
4920
4910
4900
4890
4880
'18/U
'1860
1850
H 4810
4830
4820
4810
4800
4790
4780
4770
4760
4750
4710
4730
'1721)
AREA (100 ACRES)61 713 75 72 (39 66 63 (51) 57 51 51 18 15 42 39 36 33 30 27 24 21 18 15 12 1) 13 3 1)
- -- - - - --- - - - - - - - -- - - - - - -
-
-- -
-
- -
- - - -- - - - -
/ CAPACIT Y- -- - -- - --
ARE A- - - - -- -
LEGEND
1 1993 SURVEY
1974 (UkIGINIIL) 5UPVLY
H . H0 2 0 4 0 6 0 80 100 120 140 160 180 200 220 24 0 260 280 300 320 34 0 360 380 100 420 14 0 460 180 500 520 54
CF1PHCITY (1000 ACRE-rEELFigure 6. - Area and capacity curves - Pueblo Reservoir.
I I
4900
4880
PUEBLO RESERVOIR SEDIMENTATION SURVEY
I I I I I I I I I J I
Arkansas River
1993 Thalweg
-1974 Thalweg -
)a: a:rca: aa:a: rca: a:ccrcrc
to-rca: cc \\
4860
• 4840a)U-
• 4820
4800
4780
4760
4740
4720 -
14 12 10 8 6 4 2Miles Above Axis of Dam
Figure 7. - Longitudinal profile - Arkansas River.
0
I-wwU-
zDIII-
>w-JLu
4950
4900
4850
4800
4750
4709
PUEBLO RESERVOIRGROUND PROFILE FOR SECTION 1
ORIGINAL SURVEY 1993 SURVEY
1 '/_ _
00 20 00 30 00 40 00 50 00 6000 70 00 8000 90 00 100
DISTANCE - FEET
Figure 8. - Sediment Range 1 - Arkansas River.
00
-------
12-30-lgg3 OR: 5: 11 BUREAU OF RECLAMATION PLTSYS VER I PSPLT a;Duebpr'g2 PLOT 2
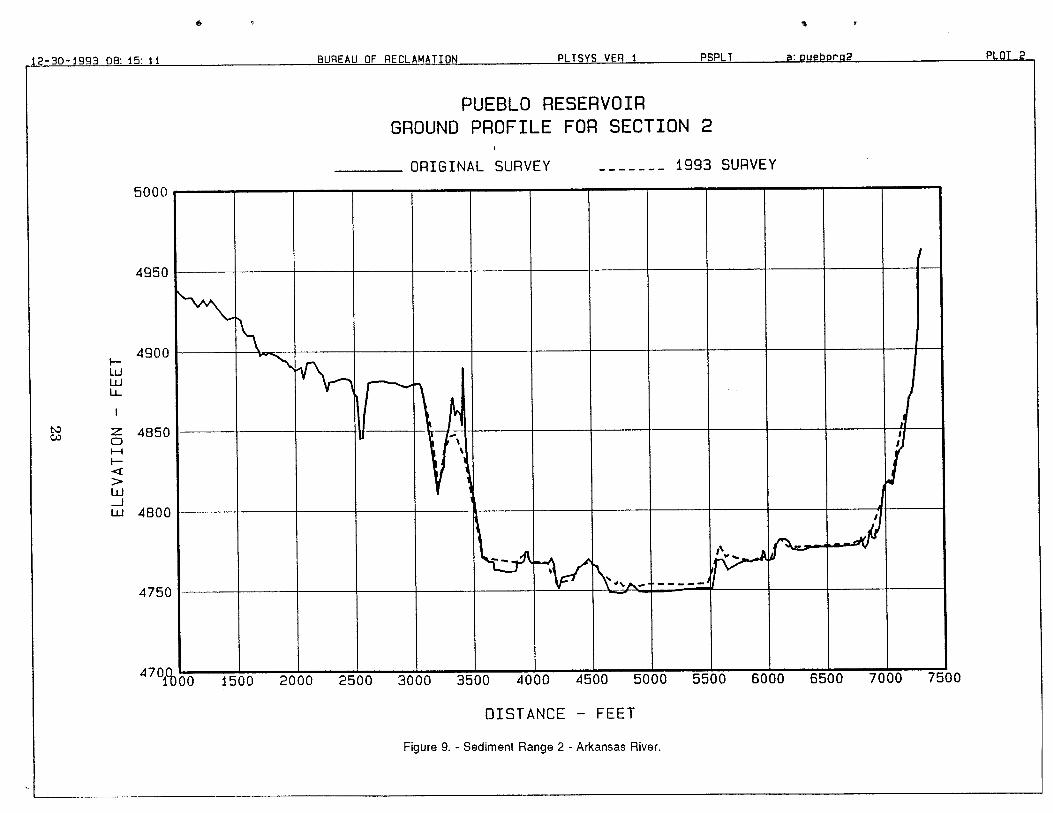
PUEBLO RESERVOIR
GROUND PROFILE FOR SECTION 2
1993 SURVEY_______ ORIGINAL SURVEY
5000
4950
4900LULU
4850
LU 4800
4750
DO
DISTANCE - FEET
Figure 9. - Sediment Range 2 - Arkansas River.
-___ 7_ _ ____ ___ __
/_ _ ________
o0 1500 20 00 2500 3000 3500 4000 4500 5000 5500 6000 6500 7000 751
12-30-1g93 08; 15: 24 BUREAU OF RECLAMATION PLTSY$ VER I PSPLT : etrnrp2 PLOT 3
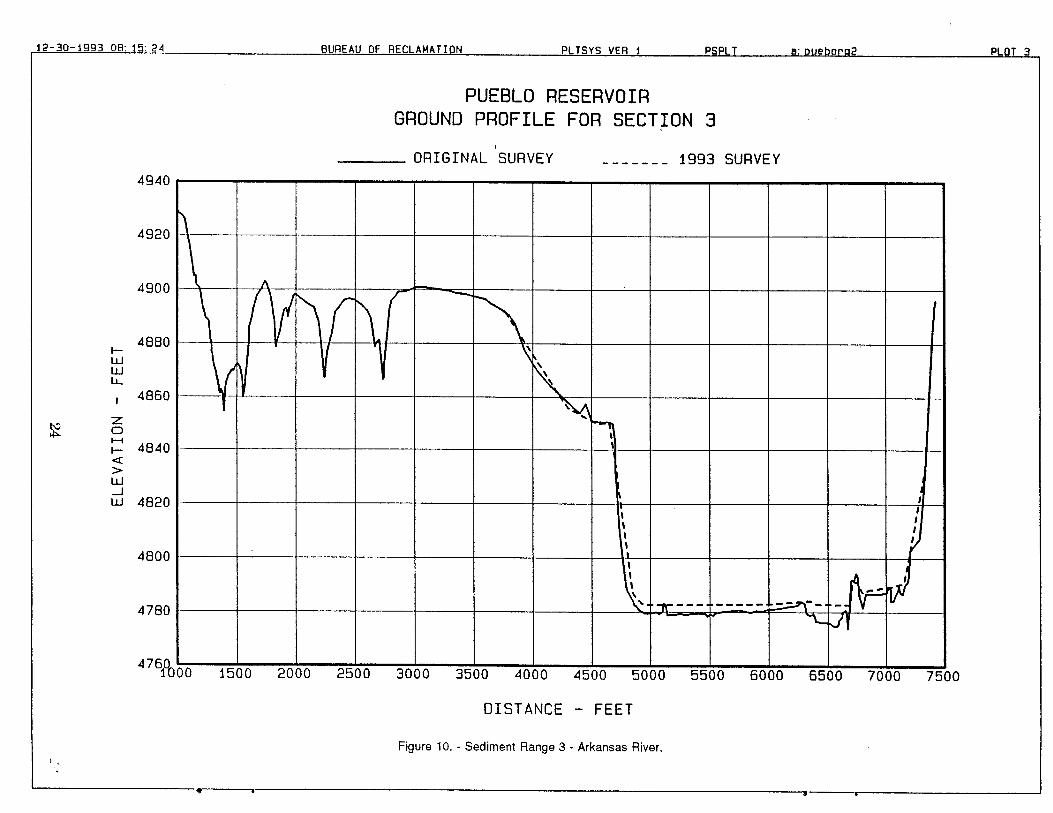
PUEBLO RESERVOIR
GROUND PROFILE FOR SECTION 3
_______ ORIGINAL SURVEY 1993 SURVEY
4940
4920
4900 _______ _______ ______ ______ ______ _______
4880
wwIL
4860
D
4840
>w-JW 4820
4800
4780
DISTANCE - FEET
Figure 10. - Sediment Range 3 - Arkansas River.
_______________________ _______________________ ______________________ _______________________ _______________________ _______________________ _______________________ t
__________________ __________________ __________________ __________________ __________________ __________________
_______________________ ______________________ ______________________ ______________________ ______________________
I__________________ -h- __________________ _________________ __________________ _________________
I
__ IS
__ - __ __ __ __ __
S________
00 1500 20 00 2500 30 00 3500 40 00 45 00 50 00 5500 60 00 65 00 70 00 75(
12-3o-1g93 08: 15: 36 BUREAU OF RECLAMATION PLTSYS VER I PSPLT a: ruebor'Q2 PLOT 4
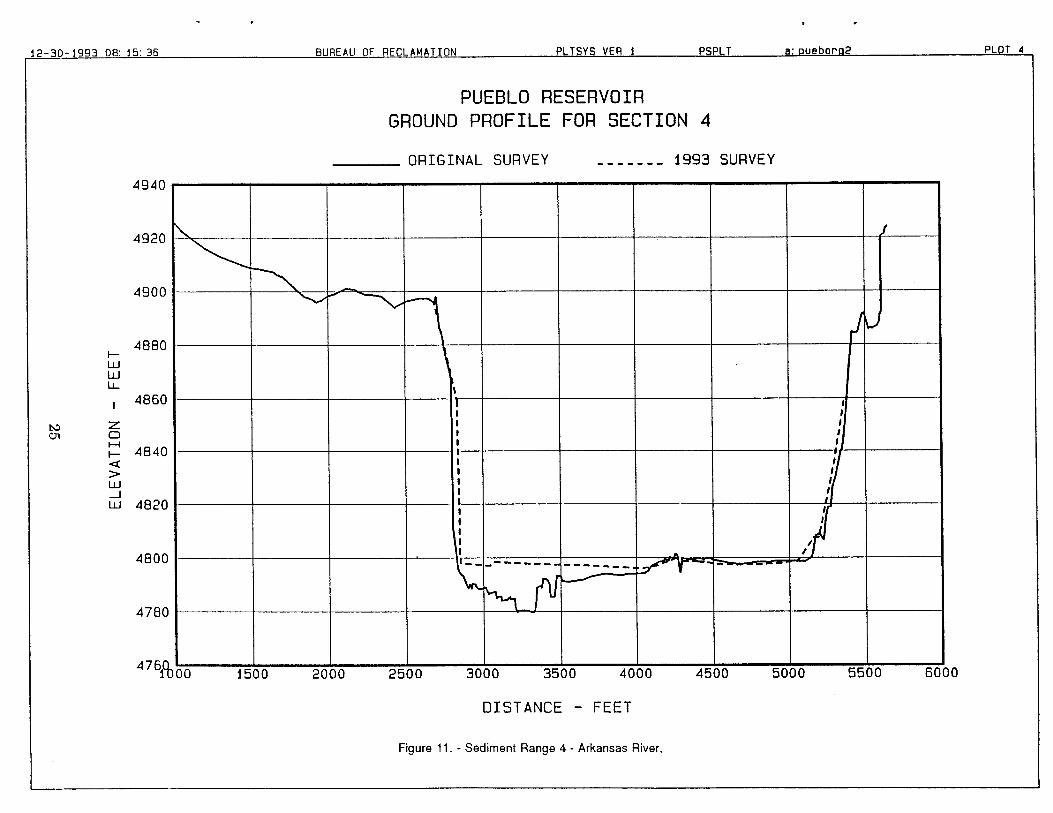
PUEBLO RESERVOIRGROUND PROFILE FOR SECTION 4
_______ ORIGINAL SURVEY ------- 1993 SURVEY
4940
4920
4900
4880LULU
4860
zcJl 0
4840
LU-JLU 4820
4800
4780
DISTANCE - FEET
Figure 11. - Sediment Range 4 - Arkansas River.
00 1500 2000 2500 3000 3500 4000 4500 5000 5500 60(
12-30-1993 08: 15: 48 BUREAU OF RECLAMATION PLTSYS VER I PSPLT a: rueborn2 PLOT S
PUEBLO RESERVOIRGROUND PROFILE FOR SECTION 5
________ ORIGINAL SURVEY 1993 SURVEY
4940
4920
4900
W 4880wU-
Z 4860C) C
>ILl 4840-Jw
4820
4800
-
DISTANCE - FEET
Figure 12. - Sediment Range 5 - Arkansas River.
'__ JJ J __00 1500 20 00 2500 3000 35
_00 4000 4500 50
_00 55_00 60_00 65(
-------
4940
4920
4900
F-
ft 4880U-
1
4860
Lij 4840-jUJ
4820
4800
478ft
PUEBLO RESERVOIRGROUND PROFILE FOR SECTION 6
ORIGINAL SURVEY 1993 SURVEY
________
-----__s
00 15 00 20 00 2500 30 00 35 00 40 00 45 00 50(
DISTANCE - FEET
Figure 13. - Sediment Range 6 - Arkansas River.
12-3o-e93 09: 5: 09 BUREAU OF RECLAMATION PLTSYS VER 1 PSPLT a: weborg2 PLOT 7
PUEBLO RESERVOIRGROUND PROFILE FOR SECTION 6A
_______ ORIGINAL SURVEY ------- 1993 SURVEY
5000
4980
4960
4940
F-Lu
4920
Z 490001-4F-
4680Lu-JuJ
4860
4840
4820
46O9
DISTANCE - FEET
Figure 14. - Sediment Range 6A - Arkansas River.
) u,AJ
"__ _L __
,_
r _ _ _00 15 00 20 00 25
_00 30 00 3500 40 00 4500 50 00 55(
5000
4980
4960
4940
LU4q20
4900I-IF-
4880LU-JLU
4860
4840
4820
-------
48 0
r
PUEBLO RESERVOIRGROUND PROFILE FOR SECTION 7
_______ ORIGINAL SURVEY 1993 SURVEY
1/
_ _ _ _
_-_ _ _
_ _ _ _
00 1500 2000 2500 3000 3500 4000 45_
00 50_
00 55_
00 60_
00 65(
DISTANCE - FEET
Figure 15. - Sediment Range 7 - Arkansas River.
iO
12-30-1993 OB: 16: 30 BUREAU OF RECLAMATION PLTSYS VER 1 PSPLT a: pueborc2 PLOT g
PUEBLO RESERVOIRGROUND PROFILE FOR SECTION 8
_______ ORIGINAL SURVEY 1993 SURVEY
5000
4980
4960
4940
I-LU
4920
0 Z 49000It
F-
4880LU-JLU
4860
4840
-
4820
4809
DISTANCE - FEET
Figure 16. - Sediment Range 8 - Arkansas River.
I
_____00 1500 20 00 2500 3000 3500 4000 4500 50(
-------
4980
4960
4940
F-
ft 4920IL
1
4900
w 4880-Jw
4860
4840
48
PUEBLO RESERVOIRGROUND PROFILE FOR SECTION 9
ORIGINAL SURVEY 1993 SURVEY
3 r
______::-_' __
00 12 00 1400 1600 1800 20 00 2200 24 00 26 00 28 00 30 00 32(
DISTANCE - FEET
Figure 17. - Sediment Range 9 - Arkansas River.
12-30-1993 08: 16: 46 BUREAU OF RECLAMATION PLTSYS VER 1 PSPLT a: puebprci2 PLOT ii
PUEBLO RESERVOIRGROUND PROFILE FOR SECTION 9A
_______ ORIGINAL SURVEY 1993 SURVEY
4930
4920
4910
4900
F-w
4890
_4880
4870w-Jw
4860
4850
4840
4839
DISTANCE - FEET
Figure 18. - Sediment Range 9A - Arkansas River.
I'_____ ____-
00 12 00 1400 1600 1800 2000 2200 24 00 2600 2800 3000 32(
- r
-------
__
12-30-1993 08: 16: 55 BUREAU OF RECLAMATION PLTSYS VER I PSPLT a: ruborg2 PLOT 12
PUEBLO RESERVOIRGROUND PROFILE FOR SECTION 10
_____ 1993 SURVEY__ ORIGINAL SURVEY
4960
4940
4920
wwIL. 4900
zcD
4880
4860
4840
-
DISTANCE - FEET
Figure 19. - Sediment Range 10 - Arkansas River.
-'p
I-
00 1200 14 00 1600 1800 2000 2200 2400 2600 2800 3000 3200 34 00 36
12-30-1993 08: 17: 03 BUREAU OF RECLAMATION PLTSYS VER 1 PSPLT a: puetorg2 PLOT 13
PUEBLO RESERVOIRGROUND PROFILE FOR SECTION IOA
_______ ORIGINAL SURVEY 1993 SURVEY
4940
4930
4920
4910
F-uJ
4900
4890
F-
> 4880uJ-JLu
4870
4860
4850
4841Q0
DISTANCE - FEET
Figure 20. - Sediment Range bA - Arkansas River.
00 1500 20 00 2500 3000 3500 4000 4500 50(
-------
-
4950
4940
4930
4920
tr. 4910wIL
I 4900
zD
4890
>
4880w
4870
4860
4850
48 49
PUEBLO RESERVOIRGROUND PROFILE FOR SECTION ii
ORIGINAL SURVEY 1993 SURVEY
p- _
00 1200 14 00 1600 1800 2000 2200 2400 2600 2800 3000 3200 34(
DISTANCE - FEET
Figure 21. - Sediment Range 11 - Arkansas River.
C)
4960
4950
4940
4930
Li; 4920wU-
I 4910
z0
4900
>
j 4890w
4880
4870
4860
4
PUEBLO RESERVOIRGROUND PROFILE FOR SECTION i2
ORIGINAL SURVEY 1993 SURVEY
1
00 15 00 20 00 2500 30 00 3500 40 00 45 00 50 00 55(
DISTANCE - FEET
Figure 22. - Sediment Range 12 - Arkansas River.

-------
12-30-IYY:3 08: 17: 28 BUREAU OF RECLAMATION PLTSYS VER I PSPLT a: oueborg2 PLOT 16
PUEBLO RESERVOIRGROUND PROFILE FOR SECTION 13
_______ ORIGINAL SURVEY 1993 SURVEY
4930
4920
4910
ww
4900
z-.1 0
4890
4880
4870
DISTANCE FEET
Figure 23. - Sediment Range 13 - Arkansas River.
/II
Ii///
"T_00 14 00 1600 1800 20 00 2200 24
_00 26_00 28_00 30(
12-30-1993 06: 17: 35 BUREAU OF RECLAMATION PLTSYS VER I PSPLT a: uebpr2 PLOT 17
PUEBLO RESERVOIRGROUND PROFILE FOR SECTION 14
_______ ORIGINAL SURVEY 1993 SURVEY
4930
4920
4g 10F-LULiiU-
c Z 4900
>LU-J
___LU 4890
4880 -
- --
DISTANCE - FEET
Figure 24. - Sediment Range 14 - Arkansas River.
/_ _ _ _ _ __ _
tOO 1400 1500 1600 1700 1800 1900 2000 21 00 2200 2300 24 00 25t
* t
-------
12-30-1993 08: 17: 41 BUREAU OF RECLAMATION PLTSYS VER 1 PSPLT a: pueborn2 PLOT jB
PUEBLO RESERVOIRGROUND PROFILE FOR SECTION 15
_______ ORIGINAL SURVEY 1993 SURVEY
4930
4920
4910LUuJLi
4900
I-
>LU-JLU 4890
4880
48 7
DISTANCE - FEET
Figure 25. - Sediment Range 15 - Arkansas River.
I- ____
00 14 00 1500 1600 1700 1800 1900 20 00 21 00 2200 2300 2400 2500 26(
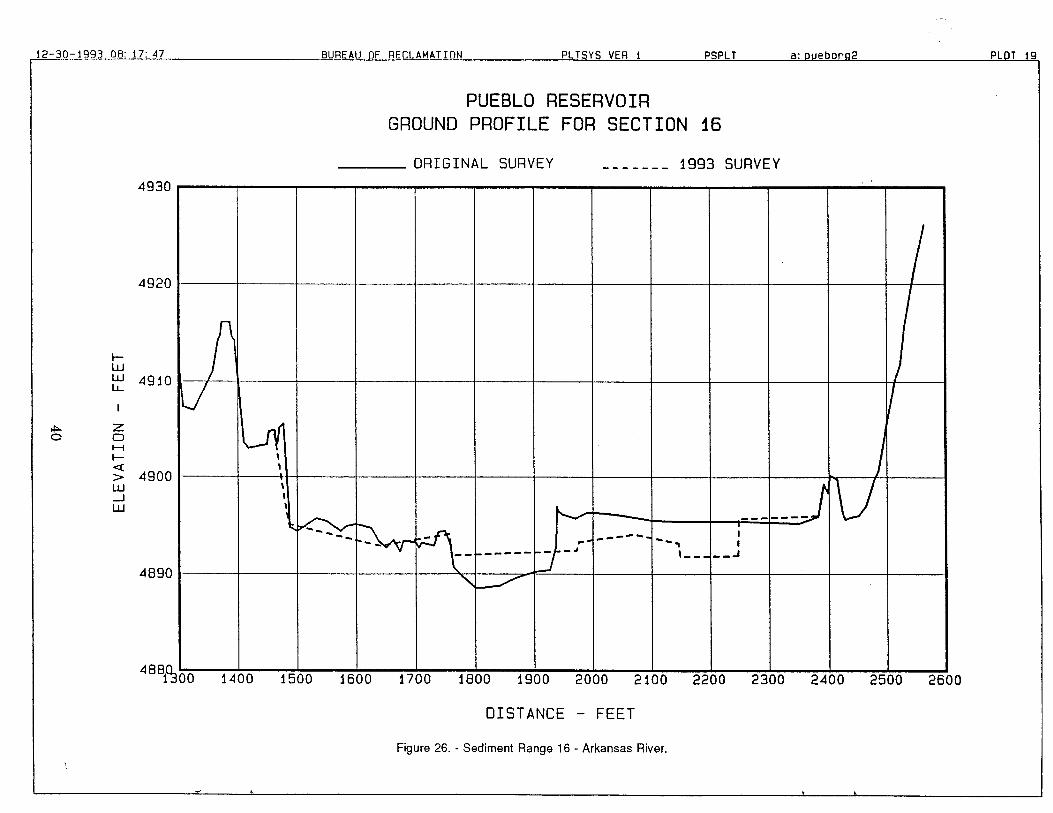
12-30-19g3 OB: 17: 47 BUREAU OF RECLAMATION PLTSYS VER I PSPLT a: pueborci2 PLOT 19
PUEBLO RESERVOIRGROUND PROFILE FOR SECTION 16
________ ORIGINAL SURVEY ------- 1993 SURVEY
4930 -______ _____ _____ _____ _____ _____ _____ _____ _____ ______ _____ _____
4920
F-w
4910
z0 D
III-
4900uJ-JuJ
4890
488Q3)0
DISTANCE - FEET
Figure 26. - Sediment Range 16 - Arkansas River.
00 14 00 1500 1600 1700 1800 1900 2000 21 00 2200 2300 2400 2500 26(
4960
4940
4920
49o0I-uJwU-
4880
zCD
4860
>UJ-JLii 4840
4820
4800
478ft
PUEBLO RESERVOIRGROUND PROFILE FOR SECTION 20
ORIGINAL SURVEY 993 SURVEY
00 1500 20 00 25 00 30 00 3500 4000 45 00 50(
DISTANCE - FEET
Figure 27. - Sediment Range 20 - Boggs Creek.
-------
LULiiU-
z0I-1I-
>LU-jLU
PUEBLO RESERVOIRGROUND PROFILE FOR SECTION 21
j93 SURVEY_______ ORIGINAL SURVEY
4930
4920 //\\\4910
4900
4690
4660
4870\__________
4860\ j ______4850
484j9ooo 1200 1400 1600 1800 2000 2200 2400 2600 2800 3000 3200 34(
DISTANCE - FEET
i0
Figure 28. - Sediment Range 21 - Boggs Creek.
4
12-30-1993 09: 16:10 BUREAU OF RECLAMATION PLTSYS VER I PSPLT p:pueborn2 PLOT 22
PUEBLO RESERVOIRGROUND PROFILE FOR SECTION 30
_______ ORIGINAL SURVEY 1 993 SURVEY
4940
4930
4920
4910
:I;3 4900LiiI-i-
948 0
z0
8804
>
4870w
4860
4850
4840
483Th - - --
DISTANCE - FEET
Figure 29. - Sediment Range 30 - Above Marina.
00 1200 14 00 1600 1800 20 00 2200 2400 2600 2800 3000 3200 3400 3600 3800 4000 42(
-------
5000
4950
I-LU
4900
z0
F-
4650uJ-jLU
4800
47
PUEBLO RESERVOIRGROUND PROFILE FOR SECTION 40
1993 SURVEYORIGINAL SURVEY
_ _
/
_ _ _
-----
_
------
_
00 1500 20 00 2500 30 00 3500 4000 4500 5000 55(
DISTANCE - FEET
Figure 30. - Sediment Range 40 - Rock Creek.
t0
-------
-
12-30-19Y3 08: tB: 27 BUREAU OF RECLAMATION PLTSYS VER I PSPLT a: puebrg2 PLOT 24
PUEBLO! RESERVOIRGROUND PROFILE FOR SECTION 4i
_______ ORIGINAL SURVEY 1993 SURVEY
4980
4960
4940
4920I-LULUU-
4900
2:D
4880
>LU-JLU 4860
4840
4820
480
- -- - ----
DISTANCE - FEET
Figure 31. - Sediment Range 41 - Rock Creek.
I
I-
.----
-.
00 1200 14 00 1600 1800 20 00 22 00 24 00 2600 2800 3000 32(
12-3o-lgg3 08: 30: 47 BUREAU OF RECLAMATION PLTSYS VER I PSPLT : pjeborp2 PLOT 25
PUEBLO RESERVOIRGROUND PROFILE FOR SECTION 42
________ ORIGINAL SURVEY 1993 SURVEY
4980
4960
4940
F-4920
U-
Z 4900D
F-
>L J 4880i-JUJ
4860
4840
4829
DISTANCE - FEET
Figure 32. - Sediment Range 42 - Rock Creek.
A •
00 11 00 1200 1300 1400 1500 1600 1700 1800 19(
-------
4970
4960
4950
4940
PUEBLO RESERVOIRGROUND PROFILE FOR SECTION 43
- ORIGINAL SURVEY 1993 SURVEY
LU
ft 4930
4920
4910LU-JLii
4900
4890
4880
48
I___-_______ _---.___ _00 1150 1200 1250 13 00 1350 1400 1450 1500 1550 1600 1650 1700 1750 IR(
DISTANCE - FEET
Figure 33. - Sediment Range 43 - Rock Creek.
12-30-1993 08: 31: 30 BUREAU OF RECLAMATION PLTSYS VER 1 PSPLT a: pueborg2 PLOT 27
PUEBLO RESERVOIRGROUND PROFILE FOR SECTION 50
_______ ORIGINAL SURVEY 993 SURVEY
4940
4920
4900
F-LULU
4880
D
4860
4840
4820
480j%c 1500 2000 2500 3000 3500 4000 4500 5000
DISTANCE - FEET
Figure 34. - Sediment Range 50 - Peck Creek.
4
-------
PUEBLO RESERVOIRGROUND PROFILE FOR SECTION 51.
j93 SURVEY_______ ORIGINAL SURVEY
4930
4920
4910
I-LU 4900LU
4890
I-
>Ii-' 4880-J
4870
4860
4°FbOO 1100 1200 1300 1400 1500 1600 1700 1800 1900 20C
DISTANCE - FEET
Figure 35. - Sediment Range 51 - Peck Creek.
4960
4940
F-4920
wuJLi
14900
LU 4080
4860
48i9
PUEBLO RESERVOIRGROUND PROFILE FOR SECTION 60
ORIGINAL SURVEY 1993 SURVEY
00 1200 14 00 1600 1800 20 00 2200 24 00 2600 2800 30(
DISTANCE - FEET
Figure 36. - Sediment Range 60 - Turkey Creek.
-------
4980
4960
4940
F-uJuJLL. 4920
zD
4900
4880
4860
48
PUEBLO RESERVOIRGROUND PROFILE FOR SECTION 6i
1993 SURVEY- ORIGINAL SURVEY
:00 11 00 12 00 13 00 1400 15 00 16 00 17 00 1800 1900 20(
DISTANCE - FEET
Figure 37. - Sediment Range 61 - Turkey Creek.
12-3O-19g3 08: 33: 33 BUREAU OF RECLAMATION PLTSYS VER I PSPLT a: pueborci2 PLOT 31
PUEBLO RESERVOIRGROUND PROFILE FOR SECTION 62
_______ ORIGINAL SURVEY 1993 SURVEY
4970
4960
4950
4940
I-uJ
4930ft
4920
49 01w-Jw
4900
4890
4880
48710. DO
DISTANCE - FEET
Figure 38. - Sediment Range 62 - Turkey Creek.
- 4
r..
00 1200 14 00 1600 1800 2000 2200 2400 2600 2800 30 00 32(
Mission
The mission of the Bureau of Reclamation is to manage, develop, andprotect water and related resources in an environmentally andeconomically sound manner in the interest of the American Public.