PUBLISHED VERSION - COnnecting REpositories · Vegetation Index(NDVI), ... entplanttypes, wheatand...
22
PUBLISHED VERSION http://hdl.handle.net/2440/101193 Jinhai Cai, Mamoru Okamoto, Judith Atieno, Tim Sutton, Yongle Li, Stanley J. Miklavcic Quantifying the onset and progression of plant senescence by color image analysis for high throughput applications PLoS ONE, 2016; 11(6):0157102-1-0157102-21 Copyright: © 2016 Cai et al. This is an open access article distributed under the terms of the Creative Commons Attribution License, which permits unrestricted use, distribution, and reproduction in any medium, provided the original author and source are credited. Originally published at: http://doi.org/10.1371/journal.pone.0157102 PERMISSIONS http://creativecommons.org/licenses/by/4.0/
Transcript of PUBLISHED VERSION - COnnecting REpositories · Vegetation Index(NDVI), ... entplanttypes, wheatand...

PUBLISHED VERSION
http://hdl.handle.net/2440/101193
Jinhai Cai, Mamoru Okamoto, Judith Atieno, Tim Sutton, Yongle Li, Stanley J. Miklavcic Quantifying the onset and progression of plant senescence by color image analysis for high throughput applications PLoS ONE, 2016; 11(6):0157102-1-0157102-21
Copyright: © 2016 Cai et al. This is an open access article distributed under the terms of the Creative Commons Attribution License, which permits unrestricted use, distribution, and reproduction in any medium, provided the original author and source are credited.
Originally published at: http://doi.org/10.1371/journal.pone.0157102
PERMISSIONS
http://creativecommons.org/licenses/by/4.0/

RESEARCH ARTICLE
Quantifying the Onset and Progression ofPlant Senescence by Color Image Analysis forHigh Throughput ApplicationsJinhai Cai1, Mamoru Okamoto2, Judith Atieno2, Tim Sutton3, Yongle Li2, StanleyJ. Miklavcic1*
1 Phenomics and Bioinformatics Research Centre, University of South Australia, Mawson Lakes, SA 5095,Australia, 2 Australian Centre for Plant Functional Genomics, University of Adelaide, Hartley Grove, UrrbraeSA 5064, Australia, 3 South Australian Research and Development Institute, 2b Hartley Grove, Urrbrae SA5064, Australia
AbstractLeaf senescence, an indicator of plant age and ill health, is an important phenotypic trait for
the assessment of a plant’s response to stress. Manual inspection of senescence, however,
is time consuming, inaccurate and subjective. In this paper we propose an objective evalua-
tion of plant senescence by color image analysis for use in a high throughput plant pheno-
typing pipeline. As high throughput phenotyping platforms are designed to capture whole-
of-plant features, camera lenses and camera settings are inappropriate for the capture of
fine detail. Specifically, plant colors in images may not represent true plant colors, leading to
errors in senescence estimation. Our algorithm features a color distortion correction and
image restoration step prior to a senescence analysis. We apply our algorithm to two time
series of images of wheat and chickpea plants to quantify the onset and progression of
senescence. We compare our results with senescence scores resulting from manual
inspection. We demonstrate that our procedure is able to process images in an automated
way for an accurate estimation of plant senescence even from color distorted and blurred
images obtained under high throughput conditions.
IntroductionEven though image processing and computer vision methods have been applied in a range ofplant biology contexts and over a span of years [1–6], the use of these techniques in a fullyautomated and high-throughput setting is still being established. This applies particularly tothe topic addressed in this paper: the automated phenotypic analysis of leaf senescence, one ofthe trademark indicators of plant age and ill health.
Leaf senescence is the integral response of leaf cells to the regular ageing process but also tounfavorable environmental conditions [7]. Many physiological, biochemical, and molecularstudies of leaf senescence [7–11] have shown that during senescence, leaf cells undergo highly
PLOSONE | DOI:10.1371/journal.pone.0157102 June 27, 2016 1 / 21
a11111
OPEN ACCESS
Citation: Cai J, Okamoto M, Atieno J, Sutton T, Li Y,Miklavcic SJ (2016) Quantifying the Onset andProgression of Plant Senescence by Color ImageAnalysis for High Throughput Applications. PLoSONE 11(6): e0157102. doi:10.1371/journal.pone.0157102
Editor: Panagiotis Kalaitzis, MediterraneanAgronomic Institute at Chania, GREECE
Received: November 30, 2015
Accepted: May 24, 2016
Published: June 27, 2016
Copyright: © 2016 Cai et al. This is an open accessarticle distributed under the terms of the CreativeCommons Attribution License, which permitsunrestricted use, distribution, and reproduction in anymedium, provided the original author and source arecredited.
Data Availability Statement: Instructions for users,software and sample image data will be availableonline at: https://sourceforge.net/projects/plant-senescence-analysis/.
Funding: The authors express their gratitude forpartial funding provided by the Australian ResearchCouncil, the Australian Grains Research andDevelopment Corporation, the South AustralianGovernment, and the South Australian GovernmentDepartment of Further Education, Employment,Science and Technology (http://www.sa.gov.au/) forpartial support of JC, MO, YL and JA; and the

coordinated changes in cell structure, metabolism and gene expression. The earliest and mostsignificant change is the breakdown of chloroplasts; leaf senescence leads to the degradation ofphotosynthetic pigments such as chlorophyll, with the degradation manifested in observableleaf colour changes from the usual deep green to pale green, to yellow and finally to brown.Given our ability to observe these visual cues, it would be natural to consider the use of imageprocessing techniques for a high-throughput plant leaf senescence analysis.
In this respect it would seem reasonable to consider employing the Normalized DifferenceVegetation Index (NDVI), which indeed has been widely used for vegetative studies to estimatecrop yield, pasture performance as well as plant senescence [12, 13]. However, this measure issensitive to many factors including soil condition and water content [14]. This sensitivity limitsthe reliable and practical use of NDVI to the detection of vegetation coverage. With the intro-duction of hyperspectral imaging, a richer variety of quantitative measures (vegetation indices)is possible and indeed has already been introduced [15, 16] to quantify leaf traits (such as chlo-rophyll content, detection of leaf disease symptoms or indeed senescence determination). Thesimplex volume maximization concept [15] appears particularly promising for drought stressdetection. A particularly recent technological development is HyperART [16], a hyperspectralimaging system which utilizes both reflectance and transmittance information to determine anabsorption spectrum, used to estimate leaf chlorophyll content. One key innovation withHyperART lies in its ability to non-destructively scan an entire leaf still attached to a plant.This represents an advance on previous methodologies which were limited to point measure-ments (scan area of a few cm2) and being of lower resolution. Despite advances such as Hyper-ART, the state of the art technology (compounded by the practical problem of costeffectiveness) is not yet geared for high throughput phenotyping applications on the wholeplant scale (or whole canopy scale). With NDVI unsuitable for senescence analysis and withvisual inspection [13], even by trained inspectors, being slow, weakly quantitative and prone tohuman subjectivity, and until high throughput hyperspectral phenotyping becomes viable, aneed exists in the interim for the application of non-destructive and fully automated RGBimage-based techniques for the objective estimation of plant senescence.
Ideally, using high definition, high resolution RGB images at the leaf level, one could attri-bute leaf image color into a few categories of classification and use the ensuing full color distri-bution to estimate the senescence level of an entire plant. However, for the high-throughputpractices we envisage, it is not feasible to take high definition images of all individual plantleaves. Instead, one resorts to taking a single image, or at most a few images from different per-spectives, of a whole plant, which are then analyzed to determine the degree of senescence atthe whole plant level. Under these pragmatic conditions, even if the global image resolution ishigh, the local resolution, at the leaf level, may not be. For example, Fig 1 shows an image of ayoung plant that in reality exhibits no actual senescence, but based on the image itself (a targetfor an automated procedure) would be assessed as already exhibiting senescence. Conse-quently, it can be problematic to apply a color classification scheme as such images may sufferfrom significant image blurring and therefore significant image color distortion, at the level ofan individual leaf. It is an inescapable fact that the color of a pixel in a blurred image is affectedby the colors of neighboring pixels [17]; the color of a pixel in a blurred image would then notrepresent the true color of an object feature at that specific location. For the analysis of plantsenescence, this has unfavorable implications: the application of an image-based, color classifi-cation scheme could result in significant error. Consequently, a deblurring or restoration stageis required to reduce the extent of color distortion in such blurred images.
In this paper, we propose a new approach for color distortion correction in blurred imagesfor the specific purpose of analyzing plant senescence. While this is important for the accuratequantification of senescence over the lifetime of the plant, it is absolutely essential for the
High Throughput Senescence Analysis: Onset and Progression
PLOS ONE | DOI:10.1371/journal.pone.0157102 June 27, 2016 2 / 21
Australia-India Strategic Research Fund, Departmentof Industry and Science, Australian FederalGovernment. Australian Research Council LinkageGrant # LP140100347 was received by SM and JC(http://www.arc.gov.au/). The funders had no role instudy design, data collection and analysis, decision topublish, or preparation of the manuscript.
Competing Interests: The authors have declaredthat no competing interests exist.

purpose of pinpointing the time at which senescence in a plant first appears. Both aspects areimportant phenotypic traits. The approach we adopt, described in the next section, does notassume any of the currently adopted circumstances (color channel independence and pointspread function (PSF)-based model de-blurring). However, we do make the reasonable andpractical assumption that during the course of an experiment, or for a given image data set to
Fig 1. The color distortion effect and its correction using the method presented in this paper. (a) original image of a young and greenleaf; (b) the corresponding color profile at the cross-section indicated by the arrow in (a); (c) image of the same leaf after color distortioncorrection; (d) corresponding color profile at the exact same cross-section.
doi:10.1371/journal.pone.0157102.g001
High Throughput Senescence Analysis: Onset and Progression
PLOS ONE | DOI:10.1371/journal.pone.0157102 June 27, 2016 3 / 21

be analyzed, the camera settings remain fixed. That is, we assume that the effects of blurringand color distortion remain consistent across all images acquired in a complete experiment.With this reasonable assumption of constant camera settings, we can take advantage of a prioriknowledge of the conditions of the experiment to develop an algorithm for the correction ofcolor distortion. In the results section we demonstrate and discuss the performance of our cor-rection and analysis approach through applications to two time series of images for two differ-ent plant types, wheat and chickpea plants. We make concluding comments in the finalsection, where we point out that the proposal has the potential for a broader range of applica-tions to quantify other phenotypic traits based on color discrimination.
Materials and Methods
Plant material and growth conditionWheat: Australian spring wheat (Triticum aestivum) cultivars Gladius and Kukri were grown inpots in glasshouse conditions between January and June, and between August and December,2013. Preselected similar sized seeds were sown in pots filled with 2.5kg of soil mix (coco-peatbased potting media containing different amounts of nitrogen (N)). Nitrogen as urea wasapplied at sowing at 10mg (N1), 25mg (N2), 75mg (N3), 150mg (N4), and 450mg (N5) N/kg ofsoil. Plants were grown and watered in a glasshouse with average temperatures ranging between22°C during the day and 15°C at night. At four weeks, the plants were transferred into a specialgrowth room at the Australian Plant Phenomics Facility, University of Adelaide, Australia (ThePlant Accelerator) for regular automated imaging using a LemnaTec imaging system (Lemna-Tec GbmH, Aachen, Germany). RGB images were automatically captured daily for 21 days.
Chickpea pilot experiment: Plant material consisted of two Cicer arietinum genotypes(Genesis 836 and Rupali). Experiments were again conducted in The Plant Accelerator. Tem-perature and humidity were controlled in the glasshouse and ranged from 24±2°C, 40% (day)and 16±2°C, and 90% (night), respectively. Three seeds were sown 2 cm deep in pots contain-ing Goldilocks mix (50% clay loam, 25% University of California (UC) mixture, and 25% coco-peat). Rhizobium inoculum was added to each planting hole at sowing. Prior to saltapplication, plants were uniformly thinned to 1 plant per pot. At 25 days after sowing (DAS),each pot received either 0, 30, 40 or 60 mMNaCl. Each treatment was replicated 4 times in aRandomized Complete Block Design (RCBD). Pots were watered and maintained at fieldcapacity to maintain the salt concentration and to avoid salt leaching.
Imaging and manual senescence scoringTo allow for quantification of onset and to track the progression of plant senescence (chlorosisand necrosis), plants were imaged from 18 DAS up to 39 DAS. For each plant, RGB imageswere taken automatically from three different views (one top and two side views, the latter witha relative rotation of 90°).
To establish a correlation between visual scoring and digital image estimation of plantsenescence, visual scores of the plants were taken based on a 1–10 scale [18] at 41 and 42 DAS.
Scoring scale:
1 = A green and healthy plant with no symptoms of illhealth (e.g., salinity stress);
2 = Bottom leaves beginning to yellow or become necrotic;
3 = Necrosis on a quarter of bottom leaves (25%) and yellowing on the rest of the bottom halfof the plant;
High Throughput Senescence Analysis: Onset and Progression
PLOS ONE | DOI:10.1371/journal.pone.0157102 June 27, 2016 4 / 21

4 = Necrosis on bottom half (50%) of plant;
5 = Necrosis on bottom half and yellowing appearing in the top half of the plant;
6 = Necrosis in the range 50%–75% of the plant;
7 = Necrosis on 75% of the plant;
8 = Necrosis on the whole plant with apical leaves still green/yellowing;
9 = Only stems and shoot tips remain green;
10 = Plant death.
Modeling color distortionDeblurring has been a subject of intensive study for decades [19]. Most deblurring algorithmsdeveloped thus far focus on estimating so-called shift-invariant point spread functions (PSFs)[20], under the assumption that blurring is caused either by the relative motion of the camera-object system, camera defocussing or by lens aberrations [21]. Recent research has alsoincluded the study of images blurred as a result of large depth differences (caused mainly bythe limited focal depth of cameras). In this case, the focus is placed on estimating the PSFs [19,21, 22] to produce better quality images, similar to those produced by an ideal pin-hole camera,except possibly for “ringing artifacts” [17, 20], a problem yet to be solved.
One assumption commonly adopted in previous works on deblurring is that the differentspectral bands of visible light have the same properties, which implies that these spectral bandshave identical PSFs. A second assumption is that of no interference between spectral band sig-nals detected by different image sensors. Unfortunately, as Fig 1 indicates, these assumptionsare not valid in the present context. Fig 1(a) is (actually) an image of a healthy green leaf of ayoung wheat plant. The image itself, however, clearly possesses significant yellowness aroundthe leaf edges, this color distortion effect is quantified in Fig 1(b). The latter figure demon-strates that the three spectral bands are affected to different degrees and thus have differentPSFs. Moreover, the curves appear asymmetric suggesting that they are not amenable tomodelling by PSFs at all. In summary, existing deblurring algorithms are not applicable andindeed do not produce restored images of suitable quality. To improve the quality of restoredimages for an accurate estimation of plant senescence requires a less restrictive approach.
The task of deblurring an image is commonly called image deconvolution. If the blur kernelis not known, the problem is referred to as blind image deconvolution. Many methods havebeen proposed for deblurring from a single image [23, 24]. Existing blind deconvolution meth-ods assume that the blur kernel has a simple parametric form, such as a Gaussian or a composi-tion of low-frequency Fourier components [25].
In our procedure, we define the blurring degradation process by the expression
X ¼ GDþ N; ð1Þwhere X is the observed or degraded image,D is the degradation matrix or PSF, G is the imagewithout degradation or blurring, andN denotes noise in the observed image. Note that we donot assume that any two spectral bands have the same PSF (D), nor do we assume that the PSFof a particular spectral band is independent of other spectral bands. In contrast to establishedmethods where knowledge of the PSF is essential, in the formulation represented by Eq 1, thePSF is not invertible as it is inhomogeneous and multi-channelled. In the approach proposedhere, we attempt to estimate directly the color distortion correction matrix (C) defined in the
High Throughput Senescence Analysis: Onset and Progression
PLOS ONE | DOI:10.1371/journal.pone.0157102 June 27, 2016 5 / 21

deblurring process, expressed mathematically as,
G ¼ ðX � NÞC;or
E ¼ G� XC:
ð2Þ
The matrix C denotes the matrix for the color distortion correction and E is the estimationerror for the given level of noise. By minimising the mean square error, we can estimate thecorrection matrix using knowledge of both the undistorted and the observed images
C ¼ ðXtXÞ�1XtG; ð3Þ
where Xt denotes the transpose of the matrix X and X−1 denotes the inverse of X. In Eq (3), weassume that at least one undistorted image G is available for the estimation of C.
Estimation of ground-truth colorIn a pragmatic sense, the problem of estimating the color distortion correction matrix in Eq (1)reduces to the problem of obtaining at least one undistorted image for the subsequent applicationof Eq (3) to all distorted images assuming the same camera settings. The solution of the reducedproblem could form part of an initialization step, being camera calibration; a standard color chartcan be used to reconstruct an undistorted image given that the colors of the individual pixels ofthe color chart image are known. However, in the possibly more common event that camera cali-bration has not been attempted, with the notional consequence that an undistorted image cannotbe reconstructed, it is still possible to estimate the undistorted image from the distorted image.
In the current application (which can be modified to suit other applications) we rely on thepremise that plant leaves are green at the early stage of plant growth and development, particu-larly under advantageous conditions (i.e., under no stress) to infer that any yellowness appear-ing in images of leaf edges is due solely to color distortion. As with conventional blinddeblurring approaches, we exploit the information from the edges of two objects. We observethat the red channel signal in Fig 1(a) is sharpest at the edges of leaves. With this feature, thered channel of an image of a young plant can be used in an initial segmentation attempt inorder to estimate the undistorted image of the young plant, for which leaf and stem color isunvarying across the whole plant. In this specific application we can estimate the real color at aleaf edge by the color of the interior section of that leaf image. We also manually select simplebackground regions of one image of the training set to estimate the true background color atboundaries between the plant and the background (and in this instance also between the blueplant support frame and the background). As there is color distortion in the original image, theinitial segmentation attempt based on the red channel signal alone is not perfect. To improvethe result, a manual correction is performed on this initial segmented image.
The results at the end of each step in the sequence of ground-truth color estimation are illus-trated in Fig 2. A tell-tale sign that the initial attempt at color estimation is imperfect, is the blu-ish appearance of the leaf tips and of leaves of only a few pixels width.
Color distortion correctionNow that an undistorted image has been obtained, we can use Eq (3) to estimate the correctionmatrix C. However, any two-dimensional image with multiple color channels cannot bedirectly represented by a single two-dimensional matrix. If, on the other hand, we assume thateach channel is independent of others, Eq (3) can be directly used to deduce the correctionmatrix for each channel. Unfortunately, different color sensor cells corresponding to a given
High Throughput Senescence Analysis: Onset and Progression
PLOS ONE | DOI:10.1371/journal.pone.0157102 June 27, 2016 6 / 21

pixel are physically close to each other in the sensor panel. Therefore, it is possible that blurringeffects are not channel independent. To treat the general case, we consider the correctionmatrix as aM × Ncmatrix, whereM = L2 × Nc, L is the kernel size of the correction matrix, andNc is the number of color channels, usually with Nc = 3. Furthermore, we arrange the estimatedundistorted image into a Si × Nc matrix, where Si is the image size, i.e., the total number ofimage pixels. We arrange the original, distorted image into a Si ×Mmatrix, which means thatall pixels within the kernel are included for a given position. With this formulation, we makeno explicit assumption about the correction matrix. The only disadvantage with this formula-tion is that the resulting size of matrix X is considerable making the calculation of C slow. For-tunately, the calculation of C is only required once for an entire experiment.
The final color distortion corrected matrix, R (the restored image), is obtained by a simplematrix multiplication: R = XC.
Results and Discussion
Analysis of the color distortion correctionGiven the absence of actual ground-truth information and given that a correction matrix isconstructed from distorted data, it is prudent to first assess the performance of our approachbased on an image of a young plant that we have used for training. Comparing Fig 3(a) withFig 3(b) and Fig 3(c) with Fig 3(d), the restored images are sharper than the original imagesand the problem of yellowish tinge between green leaves has been significantly reduced. Confir-mation of the effectiveness of the scheme can be derived from Fig 1(c) and 1(d), which high-light the improvement in color representation of the single leaf in Fig 1(a) and the effect on thecolor intensity profiles over the lateral cross-section indicated. The key feature of Fig 1(d) tonote is the increased sharpness in the intensity changes across the boundaries of the leaf, now
Fig 2. Example results at the end of each step in the process of ground-truth color estimation. In sequence:(a) the original image of a young plant; (b) the automatically segmented plant leaves with manual correction; (c)the automatically segmented frame with manual correction; and (d) the estimated image of the young plant aftercolor distortion correction.
doi:10.1371/journal.pone.0157102.g002
High Throughput Senescence Analysis: Onset and Progression
PLOS ONE | DOI:10.1371/journal.pone.0157102 June 27, 2016 7 / 21
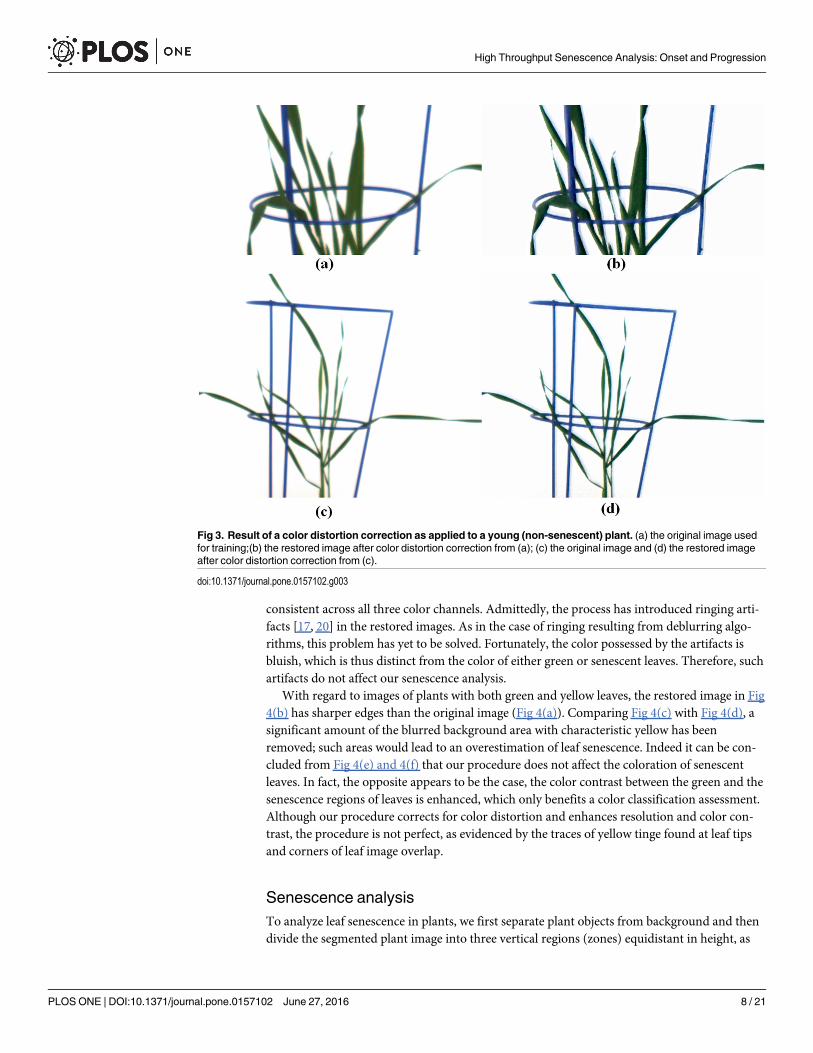
consistent across all three color channels. Admittedly, the process has introduced ringing arti-facts [17, 20] in the restored images. As in the case of ringing resulting from deblurring algo-rithms, this problem has yet to be solved. Fortunately, the color possessed by the artifacts isbluish, which is thus distinct from the color of either green or senescent leaves. Therefore, suchartifacts do not affect our senescence analysis.
With regard to images of plants with both green and yellow leaves, the restored image in Fig4(b) has sharper edges than the original image (Fig 4(a)). Comparing Fig 4(c) with Fig 4(d), asignificant amount of the blurred background area with characteristic yellow has beenremoved; such areas would lead to an overestimation of leaf senescence. Indeed it can be con-cluded from Fig 4(e) and 4(f) that our procedure does not affect the coloration of senescentleaves. In fact, the opposite appears to be the case, the color contrast between the green and thesenescence regions of leaves is enhanced, which only benefits a color classification assessment.Although our procedure corrects for color distortion and enhances resolution and color con-trast, the procedure is not perfect, as evidenced by the traces of yellow tinge found at leaf tipsand corners of leaf image overlap.
Senescence analysisTo analyze leaf senescence in plants, we first separate plant objects from background and thendivide the segmented plant image into three vertical regions (zones) equidistant in height, as
Fig 3. Result of a color distortion correction as applied to a young (non-senescent) plant. (a) the original image usedfor training;(b) the restored image after color distortion correction from (a); (c) the original image and (d) the restored imageafter color distortion correction from (c).
doi:10.1371/journal.pone.0157102.g003
High Throughput Senescence Analysis: Onset and Progression
PLOS ONE | DOI:10.1371/journal.pone.0157102 June 27, 2016 8 / 21

Fig 4. Results of application of the color correction process on plants exhibiting senescence. (a)shows the original image, while (b) shows the post processed, restored image. Panels (c) and (e) areenlarged regions of the original image in (a), while (d) and (f) are corresponding enlarged regions of therestored image (b).
doi:10.1371/journal.pone.0157102.g004
High Throughput Senescence Analysis: Onset and Progression
PLOS ONE | DOI:10.1371/journal.pone.0157102 June 27, 2016 9 / 21

illustrated in Fig 5 (see also S1 Appendix). In each zone, the colors are classified into four cate-gories: dark green, light green, light yellow and brown. Any part of a leaf with yellow or browncolor is classified as undergoing or having succumbed to senescence. Note that any leaves thathave dropped below the bottom line are assigned to the bottom zone.
Wheat experiment. Our procedure (as well as a color classification analysis) was appliedto images of wheat plants to assess the affect of nitrogen availability on the development of leafsenescence. A full biological analysis of this experiment will appear elsewhere. For the purposesof this paper, we show in Fig 6 examples of the color analysis on images of three plants, eachexposed to a different level of nitrogen (low, medium and high, respectively). The top row offigures shows restored images of the plants as they appeared on the same day. The bottom rowshows the corresponding four-category, color classification assessment as a function of zone aswell as measured overall.
It should come as no surprise that all images exhibit some degree of blurring and color dis-tortion. These effects can be substantial if the camera setting is far from optimal and if theplants being imaged are small; color distortion effects, extending across several pixels orthogo-nal as well as along leaf boundaries, can be significant. With the view to applying our methodin high throughput facilities. It makes sense to compare the outcome of our analysis with theoptions currently available in such systems. Accordingly, we consider results using a typicalsystem’s in-built, color analysis software (in the present case, The Plant Accelerator’s Lemna-Tec imaging system software). A direct application on the original images gives an estimatedsenescence level, measured as a percentage of whole plant area, of greater than 10%, even forinitial images in the sequence known not to exhibit any senescence. A quantitative comparison
Fig 5. Demonstration of the image segmentation process and zonal partitioning of plant foreground. (a) is the original image, while(b) shows just the segmented plant image with overlayed horizontal lines partitioning the image foreground into three zones.
doi:10.1371/journal.pone.0157102.g005
High Throughput Senescence Analysis: Onset and Progression
PLOS ONE | DOI:10.1371/journal.pone.0157102 June 27, 2016 10 / 21

of results using our method with those of a direct color scheme analysis applied to a specificplant image series is shown in Fig 7. In the case of our method, the results include an “Overall”measure (whole plant) and two separated measures, “Mid” and “Bottom”, to indicate thatonset appears primarily (though not always) in the bottom zone. Results of the LemnaTec sys-tem is not separated so only the “Overall”measure is given.
It is clear from Fig 7 that a direct application of color analysis results in a significant error.Two facts emerge from that analysis: first, when the plant is young and therefore small, blur-ring and color distortion significantly distorts the senescence estimation; second, when actual
Fig 6. Zonal assessment of green versus senescence leaf areas in pixels. Top figures show original images of three Gladius plants each grownunder a different level of nitrogen (N1, N3 and N5). The bottom figures show the results of color classification in pixel area as a function of zone, accordingto our four-category color scheme: dark green, light green, yellow and brown.
doi:10.1371/journal.pone.0157102.g006
High Throughput Senescence Analysis: Onset and Progression
PLOS ONE | DOI:10.1371/journal.pone.0157102 June 27, 2016 11 / 21

senescence is present and significant, the estimated level may qualitatively mimic the truedevelopment, but (a) is quantitatively overestimated and (b) cannot be used to establish thepoint of onset.
A recent LemnaTec software upgrade offers the user the option of using machine learningmethods to learn color differences between typical plant greens, recurring background colorsand colors associated with senescent leaves as well as the colors (usually light yellow) causedby burring and color distortion. This refinement dramatically improves the accuracy of thein-built tool. An updated comparison for the same image sequence is given in Fig 8; the differ-ence between the two analyses is significantly reduced (the bias is now between 2.0% and5.0%). To be more precise, when the plants are young, possessing small green leaves, themachine learning result slightly overestimates the senescence level (see figure inset), which isenough to eliminate any possibility of using this method to detect the onset of senescence. Thedisparity between the estimated senescence levels becomes greater when there is a significantlevel of senescence present. The disparity is due to the machine learning procedure itself: thecolor subspaces associated with the yellow due to blurring and color distortion and the yellowof plant senescence overlap. It is therefore inevitable that some parts of senescent leaves willbe classified as background, resulting in an underestimation of the level of senescence actuallypresent.
Fig 7. Comparison of senescence estimations using the method proposed here (curves denoted Overall, Mid andBottom) and a direct application of the color analysis software provided by The Plant Accelerator’s LemnaTecimaging system. For the Lemnatec results, only a whole-of-plant measure is available with which we compare acorresponding measure, which in turn is broken down into the senescence levels determined in the bottom and middlezones.
doi:10.1371/journal.pone.0157102.g007
High Throughput Senescence Analysis: Onset and Progression
PLOS ONE | DOI:10.1371/journal.pone.0157102 June 27, 2016 12 / 21

It is important also to point out that although there is a clear improvement in the LemnaTecsystem’s senescence estimation, it comes at a price and with limitations. The price is that somemanual labelling of images is required for training of the machine learning algorithm. Thisdetracts from the use of this solution for high throughput applications. As with all machinelearning techniques, another limitation is that the learning step, which is valid for one experi-ment, may not be valid for another experiment, even for the same plant species, if the camerasettings differ.
In Fig 9 we summarize the overall measures for two individual plants over the 15 days thatimages were taken. Two time series are shown. Fig 9(a) features the time series of total visibleplant area for the two plants, while Fig 9(b) highlights the percentage of senescence (yellow andbrown color categories) present relative to total plant area as a function of time.
The regular imaging of plants (particularly imaging from several perspectives at once) overa significant period of time offers the potential for the time-course capture of a significantamount of information on a number of important phenotypic traits. Realizing that potentialcannot be achieved using either subjective means or inadequate processing tools. Fig 9 high-lights the possibility of realizing the potential with the application of our color correction andclassification procedure to quantify traits such as plant growth over time. What is particularlyclear from Fig 9(b) is that the development of plant senescence and its dependence on appliedstress can now be quantified rigorously. Indeed, two specific features of the senescence processcan be quantified, namely, the day on which senescence first appears (onset) on an individualplant (and where) and the rate at which senescence progresses, either absolutely or as a relative
Fig 8. Comparison of senescence estimations using the method proposed here (curves denoted Overall andBottom) and the application of a machine-learned, color analysis provided by The Plant Accelerator’s LemnaTecimaging system (curve labelled “LemnaTec”.
doi:10.1371/journal.pone.0157102.g008
High Throughput Senescence Analysis: Onset and Progression
PLOS ONE | DOI:10.1371/journal.pone.0157102 June 27, 2016 13 / 21

Fig 9. Whole-of-plant assessment of growth (plant area) and senescence as a function of time for twoindividual plants under N2, chosen arbitrarily. Top figure features the time developments of total projectedplant area (all leaves and stems) for the two plants, depicting similar growth behavior. Bottom figure showsthe percentage of senescence present in the leaves of these plants relative to their total plant area. The twoindividual plants exhibit different rates of senescence development as well as different onset dates.
doi:10.1371/journal.pone.0157102.g009
High Throughput Senescence Analysis: Onset and Progression
PLOS ONE | DOI:10.1371/journal.pone.0157102 June 27, 2016 14 / 21

percentage of leaf area. Moreover, the latter information can be refined into zones for a detailedstudy of senescence.
These two specific features are exemplified in Fig 10, which summarizes the effects of nitrogentreatment on both the time of onset and on the final degree of senescence, the latter relative tothe total projected leaf area. Only one wheat variety (the genotype Gladius) is represented, withresults averaged over a number of repeats. The error bars therefore refer to variation over therepeats and are not indicative of errors in senescence estimation. A more extensive study com-paring plant responses to nitrogen across a range of genotypes is the subject of a separate publica-tion. Although the Gladius variety appears less sensitive to nitrogen level than do other varieties,it is nevertheless evident that the method is able to detect even minor variations with addednitrogen for this genotype. The delay of onset seen here with application of medium levels ofnitrogen agree with previous observations. The results in Fig 10 also demonstrate that ourmethod can quantify the final proportion of senescent leaves relative to the total leaf area, reflect-ing the stasis in senescence relative to total leaf mass that manifests with the addition of nitrogen.
Chickpea pilot experiment. The experiment on chickpea plants represents a pilot study ofthe effects of salt stress as well the influence of soil condition. This experiment exemplifies acommon case where only post-processing of an image sequence is possible, and where the reso-lution of plant images is satisfactory to quantify some features but is not sufficiently high toassess plant senescence. In these images, the color distortion between two pixels along leafboundaries is significant. Application of the in-built color analysis software on the originalimages estimated a senescence level, measured in terms of percentage of senescence to wholeplant area, of greater than 10% even for the first images in the sequence, of young plants exhib-iting no senescence. An application of our color correction procedure followed by a color anal-ysis on the recovered images found an estimated senescence level of less than 1.0%, while thein-built, machine-learned color analysis tool estimated a senescence level of around 2.0% forthese first images.
Fig 10. Summary of senescence dependence on nitrogen treatment (N1 −N5, horizontal axis) for theGladius wheat plant variety. Shown are mean values of onset determination (days after sowing, DAS,dashed curve and solid triangles, left vertical axis) and final degree of senescence (percentage of total projectleaf area, solid curve and open diamonds, right vertical axis). Error bars show the variation across threerepeats.
doi:10.1371/journal.pone.0157102.g010
High Throughput Senescence Analysis: Onset and Progression
PLOS ONE | DOI:10.1371/journal.pone.0157102 June 27, 2016 15 / 21

To further evaluate the performance of our color correction procedure, our results werecompared with those of manual inspection based on the 1–10 scale [18] described in the Mate-rials and Methods section. Note that the manual inspection was undertaken 2 and 3 days afterthe last imaging day. The results of both the subjective and the objective means of quantifyingsenescence level are presented for comparison in Table 1.
Despite the two diametrically contrasting measures of senescence, there remains a definitecorrelation between the outcomes, even though the manual inspections were conducted 2 and 3days after the final images were taken. This is demonstrated quite convincingly in Fig 11, whichexhibits a highly correlated functional (logarithmic) relationship between the two measures; theR-squared values are 0.7503 (0.754 in the case of the LemnaTec estimate) and 0.536, respec-tively, for the manual inspection 2 and 3 days after the last image was taken. A decreasing R-squared value is expected with increasing time difference between the day of imaging and theday of manual inspection. What is not yet clear from the results obtained so far (Fig 11), iswhether a more refined manual inspection score and more frequent inspections, to comparewith a simultaneous objective senescence measure, will add meaning to the fitted functionalrelationship. Unfortunately, manual inspection is time consuming, costly and highly subjective,which only highlights the effectiveness of the automated and objective process proposed here.
As with the wheat experiment, by utilizing the regularly taken sequence of chickpea plantimages we are able to track both the growth behavior as well as the senescence process overtime. In Fig 12 we demonstrate this functionality based on the time series of images for twoindividual plants. Although the growth behavior, in terms of projected plant area (all types), issimilar to wheat in the sense of increasing with time, in contrast to the wheat experiment, theanalysis reveals a decreasing trend in senescence of one plant and a semi-steady, but fluctuatingbehavior for the other plant. The differences can be attributed to the genotypic responses of thetwo plants under salt stress: for one plant (blue curve), the senescence pattern did not spread
Table 1. Evaluation of the performance of our senescence analysis algorithm as applied to chickpea images.
Treatment Our method Manual (after 2 days) Manual (after 3 days)
(Percentage of senescent leaves) (Senescence score) (Senescence score)
(mM NaCl) Genesis 836 Rupali Genesis 836 Rupali Genesis 836 Rupali
0 0.73 1.64 1 4 3 4
0.53 8.03 1 5 2 6
3.30 1.08 2 2 4 5
0.53 2.27 1 4 3 3
30 1.14 3.69 2 5 5 5
0.34 5.65 1 4 4 5
0.91 11.81 2 7 3 10
0.84 1.71 2 4 3 7
40 0.71 3.13 2 4 5 5
1.05 9.80 2 7 5 8
0.91 11.81 2 4 3 6
0.78 10.15 2 8 3 10
60 0.99 1.40 4 5 5 5
0.50 2.77 1 5 4 5
0.81 2.70 1 5 4 10
1.81 25.75 2 8 3 10
In this table our estimated level or percentage of leaf senescence is based on the last image in the sequence of 8 chickpea plant images.
doi:10.1371/journal.pone.0157102.t001
High Throughput Senescence Analysis: Onset and Progression
PLOS ONE | DOI:10.1371/journal.pone.0157102 June 27, 2016 16 / 21

over the plant during the plant’s continual growth, leading to a decreasing fraction of leafsenescence. This can be verified by appeal to the image comparison in Fig 13(a) and 13(b). Incontrast, for the other plant (red curve) senescence increased with time, but leaf fall resulted ina significant fluctuation in the percentage of leaves exhibiting senescence. This is exemplifiedin Fig 13(c) and 13(d).
Conclusions and Future WorkIn plant phenomics it is not only those characteristics associated with the plant growth phasethat are important factors to capture to assess a plant’s performance against growth conditions,
Fig 11. Scatter plots of manual inspection scores versus the objectively estimated senescencemeasure proposed in this paper and that of the machine learningmethod adapted by the LemnaTecsystem for a set of chickpea plants.Manual scoring was performed on two occasions: 2 days after the lastimaging day (top panel) and 3 days after the last imaging day (bottom panel).
doi:10.1371/journal.pone.0157102.g011
High Throughput Senescence Analysis: Onset and Progression
PLOS ONE | DOI:10.1371/journal.pone.0157102 June 27, 2016 17 / 21

i.e., a plant’s stress response. It is equally important to quantify traits indicative of a plant’s ageand ill health, such as senescence. In this paper we have proposed a fully automated algorithmictool for senescence estimation, encompassing the restoration of color, plant foreground seg-mentation and a color classification for senescence analysis. One less obvious outcome of ourefforts is the demonstration that manual inspection is inadequate as a means of assessing thesenescence state of a plant. Image analysis based on color differentiation is a sound alternative.However, under high throughput conditions where the entire plant is imaged, the resolution
Fig 12. Whole-of-plant assessment of growth (plant area) and senescence as a function of time fortwo individual chickpea plants. Top figure shows the time developments of total projected plant area (allleaves and stems) for the two plants, depicting qualitatively similar but quantitatively different growthbehavior. Bottom figure shows the percentage of senescence present in the leaves of these plants relative totheir total plant area. The two individual plants exhibit different rates of senescence development.
doi:10.1371/journal.pone.0157102.g012
High Throughput Senescence Analysis: Onset and Progression
PLOS ONE | DOI:10.1371/journal.pone.0157102 June 27, 2016 18 / 21

may be insufficient to accurately capture senescence onset and development. Another relatedmajor problem is the absence of adequate camera color calibration. The approach we advo-cated here addresses, in a practical way, these major problems. As a result, we not only canreduce image color distortion but also improve image quality sufficiently to quantify senes-cence accurately. To verify the procedure’s effectiveness, we compared our results with senes-cence scores attained by manual inspection and the senescence levels estimated by the in-builttool. We found that there is a correlation between the these measures, which no doubt has itsorigins in the fact that these measures are based on plant appearance.
It is worth reiterating that the process of labelling or annotating of images for the training ofa machine learning approach is time consuming, with the final result intrinsically dependenton the quality of annotation. As mentioned already, machine learning approaches have theirlimitations, which can prevent them from being used in high throughput applications. In con-trast, the philosophy of the approach proposed here is inherently high throughput, and whose
Fig 13. Two examples of senescence patterns. (a) and (b) depict similar sized leaf areas of the same planton different days; in (b) the plant has grown a little larger. Figs (c) and (d) show the same plant (different from(a) and (b)) on different days but at a much later stage of development when more leaves have becomesenescent and after some senescent leaves have fallen off.
doi:10.1371/journal.pone.0157102.g013
High Throughput Senescence Analysis: Onset and Progression
PLOS ONE | DOI:10.1371/journal.pone.0157102 June 27, 2016 19 / 21

full automation can be reinforced by using, as benchmark, the image of a standard color chartat the beginning of an experiment, instead of estimating an undistorted image of a young plant.
One direction for further study is to undertake a more extensive comparison between themanual and the automated approaches to identify (if possible) a reason for the observed func-tional form for this correlation. A second direction for further study was identified in the chick-pea study, where both the decreasing senescence trend and the fluctuating behavior of the twocurves in Fig 12(b) indicate that a detailed and aggregated monitoring of leaf senescence,including the (time) tracking of leaf fall, is required for a complete assessment of senescencefor this phenotypic trait to properly characterize a plant’s stress response.
Supporting InformationS1 Appendix. Detailed description of the segmentation process.(PDF)
AcknowledgmentsThe authors would like to thank Drs Hamid Laga and Jason Connor from the University ofSouth Australia, Associate Professor Qiongyan Li from Bejing Forest University and Dr. Bet-tina Berger from The Plant Accelerator at Adelaide University for many insightful discussions.Finally, we express our gratitude for partial funding provided by the Australian ResearchCouncil, the Australian Grains Research and Development Corporation, the South AustralianGovernment, and the Australia-India Strategic Research Fund, Department of Industry andScience, Australian Federal Government.
Author ContributionsConceived and designed the experiments: JC MO SM. Performed the experiments: JC MO JAYL. Analyzed the data: JC SM. Contributed reagents/materials/analysis tools: MO JA YL TS.Wrote the paper: JC SM. Designed the analysis algorithm: JC SM. Developed the software usedin analysis: JC.
References1. Harris BN, Sadras VO, Tester M. A water-centred framework to assess the effects of salinity on the
growth and yield of wheat and barley. Plant Soil. 2010; 336:377–389. doi: 10.1007/s11104-010-0489-9
2. Gerlai R. Phenomics: fiction or the future? Trends in Neurosciences. 2002; 25:506–509. doi: 10.1016/S0166-2236(02)02250-6 PMID: 12220878
3. Furbank RT. Plant phenomics: from gene to form and function. Functional Plant Biology. 2009; 36:5–6.
4. Niklas KJ, Enquist BJ. On the vegetative biomass partitioning of seed plant leaves, stems, and roots.American Naturlist. 2002; 159:482–497. doi: 10.1086/339459
5. Kumar P, Huang C, Cai J, Miklavcic SJ. Root phenotyping by root tip detection and classificationthrough statistical learning. Plant Soil. 2014; 380:193–209. doi: 10.1007/s11104-014-2071-3
6. Cai J, Zeng Z, Connor JN, Huang CY, Melino V, Kumar P, et al. RootGraph: a graphic optimization toolfor automated image analysis of plant roots. Journal of Experimental Botany. 2015; 66:6551–6562. doi:10.1093/jxb/erv359 PMID: 26224880
7. Lim PO, Kim HJ, Gil Nam H. Leaf Senescence. Annual Review of Plant Biology. 2007; 58(1):115–136.doi: 10.1146/annurev.arplant.57.032905.105316 PMID: 17177638
8. Can S, Amasino RM. Making Sense of Senescence: Molecular Genetic Regulation and Manipulation ofLeaf Senescence. Plant Physiology. 1997; 113(2):313–319.
9. Distelfeld A, Avni R, Fischer AM. Senescence, nutrient remobilization, and yield in wheat and barley.Journal of Experimental Botany. 2014; 65(14):3783–3798. doi: 10.1093/jxb/ert477 PMID: 24470467
High Throughput Senescence Analysis: Onset and Progression
PLOS ONE | DOI:10.1371/journal.pone.0157102 June 27, 2016 20 / 21

10. Gaju O, Allard V, Martre P, Gouis JL, Moreau D, Bogard M, et al. Nitrogen partitioning and remobiliza-tion in relation to leaf senescence, grain yield and grain nitrogen concentration in wheat cultivars. FieldCrops Research. 2014; 155:213–223. doi: 10.1016/j.fcr.2013.09.003
11. Gregersen P, Foyer C, Krupinska K. Photosynthesis and Leaf Senescence as Determinants of PlantProductivity. In: Kumlehn J, Stein N, editors. Biotechnological Approaches to Barley Improvement. vol.69 of Biotechnology in Agriculture and Forestry. Springer Berlin Heidelberg; 2014. p. 113–138.
12. Dibella CM, Paruelo JM, Becerra JE, Bacour C, Baret F. Effect of senescent leaves on NDVI-basedestimates of fAPAR: experimental and modelling evidences. International Journal of Remote Sensing.2004; 25(23):5415–5427. doi: 10.1080/01431160412331269724
13. Kant S, Burch D, Badenhorst P, Palanisamy R, Mason J, Spangenberg G. Regulated Expression of aCytokinin Biosynthesis Gene IPTDelays Leaf Senescence and Improves Yield under Rainfed and Irri-gated Conditions in Canola (Brassica napus L.). PLoS ONE. 2015 01; 10(1):e0116349. doi: 10.1371/journal.pone.0116349 PMID: 25602960
14. Nicholson SE, Farrar TJ. The influence of soil type on the relationships between NDVI, rainfall, and soilmoisture in semiarid Botswana. I. {NDVI} response to rainfall. Remote Sensing of Environment. 1994;50(2):107–120. doi: 10.1016/0034-4257(94)90038-8
15. Römer C, Wahabzada M, Ballvora A, Pinto F, Rossini M, Panigada C, et al. Early drought stress detec-tion in cereals: simplex volumemaximisation for hyperspectral image analysis. Functional Plant Biol-ogy. 2012; 39(11):878–890. doi: 10.1071/FP12060
16. Bergsträsser S, Fanourakis D, Schmittgen S, Cendrero-Mateo MP, Jansen M, Scharr H, et al. Hyper-ART: non-invasive quantification of leaf traits using hyperspectral absorption-reflectance-transmittanceimaging. Plant Methods. 2015; 11(1). doi: 10.1186/s13007-015-0043-0 PMID: 25649124
17. Whyte O, Sivic J, Zisserman A, Ponce J. Non-uniform Deblurring for Shaken Images. InternationalJournal of Computer Vision. 2012; 98(2):168–186. doi: 10.1007/s11263-011-0502-7
18. Maliro MFA, McNeil D, Redden B, Kollmorgen JF, Pittock C. Sampling strategies and screening ofchickpea (Cicer arietinum L.) germplasm for salt tolerance. Genetic Resources and Crop Evolution.2008; 55(1):53–63. doi: 10.1007/s10722-007-9214-9
19. Zhu X, Cohen S, Schiller S, Milanfar P. Estimating spatially varying defocus blur from a single image.IEEE Transactions on Image Processing. 2013; 22(12):4879–4891. doi: 10.1109/TIP.2013.2279316PMID: 23974627
20. Shan Q, Jia J, Agarwala A. High-quality motion deblurring from a single image. ACM Transactions onGraphics. 2008; 27(3):Article No 73. doi: 10.1145/1360612.1360672
21. Tai YW, BrownMS. Single image defocus map estimation using local contrast prior. In: the InternationalConference on Image Processing; 2009. p. 1797–1800.
22. Zhang L, Nayar S. Projection defocus analysis for scene capture and image display. ACM Transactionson Graphics. 2006; 25(3):907–915. doi: 10.1145/1141911.1141974
23. Campisi P, Egiazarian K. Blind Image Deconvolution: Theory and Applications. Taylor & Francis;2007.
24. NishiyamaM, Hadid A, Takeshima H, Shotton J, Kozakaya T, Yamaguchi O. Facial Deblur InferenceUsing Subspace Analysis for Recognition of Blurred Faces. IEEE Transactions on Pattern Analysisand Machine Intelligence. 2011 April; 33(4):838–845. doi: 10.1109/TPAMI.2010.203 PMID: 21079280
25. Fergus R, Singh B, Hertzmann A, Roweis ST, FreemanWT. Removing Camera Shake from a SinglePhotograph. ACM Transactions on Graphics. 2006 July; 25(3):787–794. doi: 10.1145/1141911.1141956
High Throughput Senescence Analysis: Onset and Progression
PLOS ONE | DOI:10.1371/journal.pone.0157102 June 27, 2016 21 / 21


![[WeMake Check-in] – 4 months of activities - Mar Jun 16](https://static.fdocuments.net/doc/165x107/587335d81a28abf21b8b45a1/wemake-check-in-4-months-of-activities-mar-jun-16.jpg)