Analisis pengembangan model bisnis properti pt hasta raya ...
1
PT Mega Manunggal Property Tbk
SEPTEMBER 2019

22
33
4
Disclaimer
The information contained in this presentation has been prepared by PT Mega Manunggal Property Tbk. (the “Company”) and is being furnished to you solely for your
information and may not be reproduced or redistributed to any other person, in whole or in part in any manners or for any purpose. In particular, neither the information
contained in this presentation nor any copy hereof may be, directly or indirectly, taken or transmitted into or distributed in any jurisdiction which prohibits the same except in
compliance with applicable securities laws.
This presentation does not contain all material information concerning the Company and the information set forth in these materials is subject to change without notice. The
third party information and statistical data in this presentation have been obtained from sources the Company believes to be reliable but there can be no assurance as to the
accuracy or completeness of the included information. No reliance should be placed on, the fairness, accuracy, completeness or correctness of the information, or opinions
contained herein.
None of the Company, its directors, officers, shareholders, advisors or representatives makes any representation or warranty, express or implied, as to the accuracy or
completeness of the information in this presentation, and nothing in this presentation is, or should be relied upon as, a promise or representation by any of them. None of the
Company, its directors, officers, shareholders, advisors or representatives shall have any responsibility or liability whatsoever (for negligence or otherwise) for any loss
howsoever arising from any use of this presentation or its contents or otherwise arising in connection with this presentation.
Certain statements in this presentation may constitute “forward-looking statements”, including statements regarding the Company’s expectations and projections for future
operating performance and business prospects. Such forward-looking statements are based on numerous assumptions regarding the Company’s present and future business
strategies and the environment in which the Company will operate in the future. Such forward-looking statements speak only as of the date on which they are made.
Accordingly, the Company expressly disclaims any obligation to update or revise any forward-looking statement contained herein to reflect any change in the Company’s
expectations with regard to new information, future events or other circumstances. The Company does not make any representation, warranty or prediction that the results
anticipated by such forward-looking statements will be achieved, and such forward-looking statements represent, in each case, only one of many possible scenarios and should
not be viewed as the most likely or standard scenario. Accordingly, parties reviewing this presentation should not place undue reliance on any forward-looking statements. The
information contained in this presentation should be considered in the context of the circumstances prevailing at the time and has not been, and will not be, updated to reflect
material developments which may occur after the date of the presentation.
This presentation is not intended to form basis any investment decision to purchase securities of the Company and does not constitute or form part of, and should not be
construed as, any offer for sale or subscription of or solicitation or invitation of any offer to buy or subscribe for any securities of the Company in any jurisdiction, including the
United States. The Company’s securities have not been and will not be registered under the United States Securities Act of 1933, as amended (the “Securities Act”), and may
not be offered, sold or delivered within the United States absent registration under or an applicable exemption from the registration requirements of the Securities Act and this
presentation does not constitute or form a part of any offer to sell or solicitation of an offer to purchase or subscribe for securities in Indonesia in which such offer, solicitation or
sale would be unlawful prior to registration and such registration being deemed effective by the Otoritas Jasa Keuangan.
By reviewing this presentation, you acknowledge this Disclaimer and agree to be bound by the foregoing limitations, and you acknowledge that you will be solely responsible for
your own assessment of the market and the market position of the Company and that you will conduct your own analysis and be solely responsible for forming your own view of
the potential future performance of the business of the Company.

5
Agenda Presentation
Section Pages
1 Who we are 6
2 Growth strategy 17
3 On the right track 23
4 Strong growth opportunity 28
5 Key financial 47
6 Assets in details 53
7 Other financial info 65

6
Section 1
Who We Are

7
Company At A Glance
Overview
PT. Mega Manunggal Property Tbk
(“MMP”) is a warehouse provider
that supports industrial property
needs in Indonesia focusing on
developing, owning and operating
logistic properties with a focus in
warehousing that specifically meet
international standards.
Established on mid 2010, currently
MMP has Net Leasable Area of
area total 321,395 m2 - including a
90,000 m2 NLA warehouse for PT
Unilever Indonesia, one of the
largest Unilever warehouses
globally.
Projects
Currently MMP has 9 assets in 5 different
strategic locations:
MM2100, Bekasi:
Unilever Mega DC
Li & Fung Logistic
Selayar
Block AE
Cikarang, Bekasi:
• Delta Silicon III
Halim Cililitan, East Jakarta:
Intirub Business Park
Tapos, Depok:
Lazada warehouse
Jababeka:
Cibatu warehouse
Cileungsi:
Cileungsi warehouse
MMP is currently developing Lazada
Phase 2 warehouse in Tapos, a
warehouse in Delta Silicon III Cikarang
Phase II & III, a warehouse in Pondok
Ungu Bekasi, a warehouse in Jababeka,
Bekasi, and a warehouse in Manyar, East
Java.
FacilitiesFacilities of PT. Mega Manunggal
Property Tbk are developed with
specifications which refer to
international standards to meet
the demand in the Indonesian
logistics services business while
keeping the specifications comply
to local regulations. MMP is
committed to give good quality
products and deliver added value
services to support the client’s
business.

8
Structure of PT Mega Manunggal Property Tbk
99.99%
MMP’s asset structure
PT Mega Manunggal
Property Tbk
Unilever
Mega DC
Li & Fung
Intirub Business
Park I & II
Selayar
PT Mega Khatulistiwa
Properti
PT Mega Tridaya
Properti
55.00%
PT Intirub
99.76%99.50%
45.00%
GIC
PT Mega
Properti
Logistik
Nusantara
99.99%
Cibitung
AirportCibitung
Cibatu
Depok
Cileungsi
Bekasi
Halim
Pondok Ungu
Manyar Jababeka
99.99%
99.99%
99.99% 99.99%
99.99%
99.99%
99.99%
95.00%
99.99%
Cikarang
PT Mega
Dharma
Properti
PT
Manunggal
Persada
Properti
PT Subang
HorisonProperti
PT Subang
Cakrawala
Properti
PT Mega
Buana
Properti
Logistik
PT
Manunggal
Timur
Properti
PT Bukit
Properti
Logistik
PT Mega
Cahaya
Properti
PT Mega
Angkasa
Properti
PT Ace
Dalle Mega
Properti
PT Mega Cakrawala
Internusa Properti
PT Mega Jaya
Lestari Properti
99.40%99.40%
99.62%
PT Mega Arga
Properti
99.62%
PT Mega
Surya
Properti
99.62%
PT Mega
Aruna
Nusantara
Properti

9
Board of Directors
Bonny Budi SetiawanPresident Director
Has been the Company’s Director since 2015 and appointed as the President Director in January 2017.Earned a Bachelor of Business Administration in Accounting and Finance from Simon Fraser University,Canada (1997). Previously served as Executive Director of PT UBS Securities Indonesia (2011-2015); SeniorVice President of PT Danareksa Sekuritas, Jakarta (2010 - 2011); Vice President of Research Division of PTDanareksa Sekuritas in Jakarta (2009 - 2010); Vice President of Research Division of Merrill Lynch, Jakarta(2007 - 2009); Vice President of Research Division of PT CIMB-GK Securities, Assistant Vice President ofresearch division of PT Danareksa Sekuritas (2005 - 2007); Supervisor Consultant Financial AdvisoryServices (FAS) of Prijohandojo Boentoro & Co. (2003 - 2005); Research Analyst of PT Panin Sekuritas (2002 -2003) and Export Supervisor of PT Pabrik Kertas Tjiwi Kimia (1998-2000).
Loa Siong LieDirector
Has been appointed as the Independent Director since 2017. He is in charge of technical and construction.He earned Civil Engineering Bachelor’s degree from University of Tarumanegara, Jakarta in 1996. He wasProject Manager for PT Sinar Menara Deli (2016 – 2017), Project Manager for PT Supra Megah Utama ( 2012 -2016), Site Manager for PT Pradani Sukses Abadi (2010 – 2012), Site Manager for PT Intersatria Budi KaryaPratama (2007 – 2010). Construction Manager for PT Praga Artamida ( 1996 – 2007).

10
Company Milestone
11
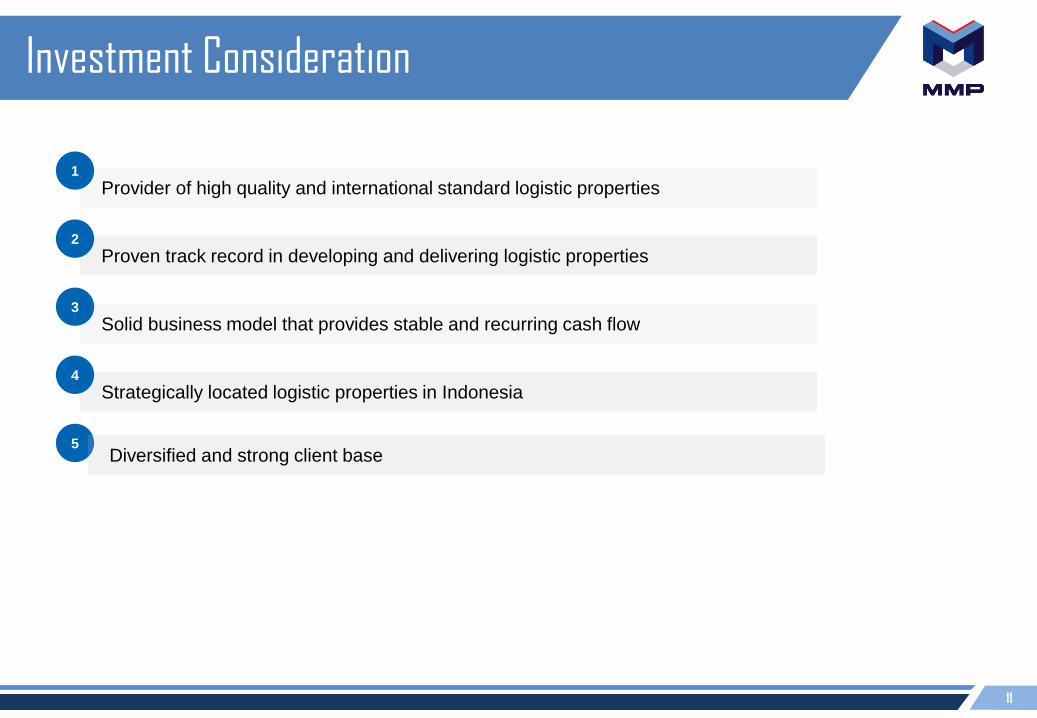
Investment Consideration
Provider of high quality and international standard logistic properties1
Proven track record in developing and delivering logistic properties2
Solid business model that provides stable and recurring cash flow 3
Strategically located logistic properties in Indonesia4
5Diversified and strong client base
12
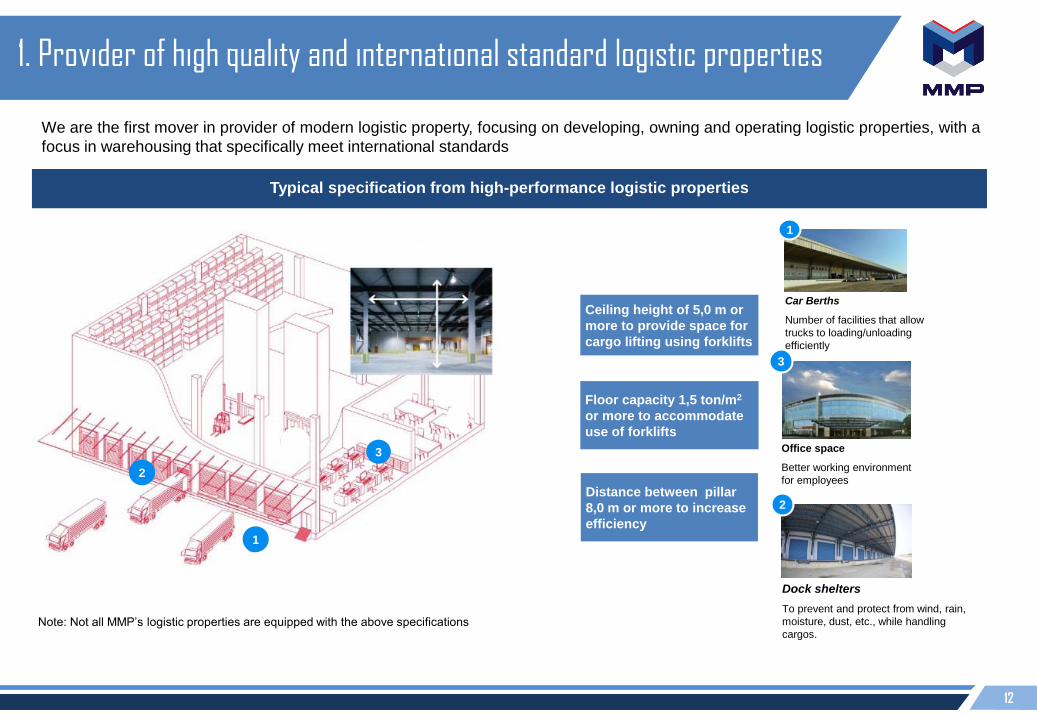
1. Provider of high quality and international standard logistic properties
Note: Not all MMP’s logistic properties are equipped with the above specifications
Typical specification from high-performance logistic properties
1
2
33 Office space
Better working environment
for employees
3
1
Car Berths
Number of facilities that allow
trucks to loading/unloading
efficiently
2
Dock shelters
To prevent and protect from wind, rain,
moisture, dust, etc., while handling
cargos.
Ceiling height of 5,0 m or
more to provide space for
cargo lifting using forklifts
Distance between pillar
8,0 m or more to increase
efficiency
Floor capacity 1,5 ton/m2
or more to accommodate
use of forklifts
We are the first mover in provider of modern logistic property, focusing on developing, owning and operating logistic properties, with a
focus in warehousing that specifically meet international standards
13
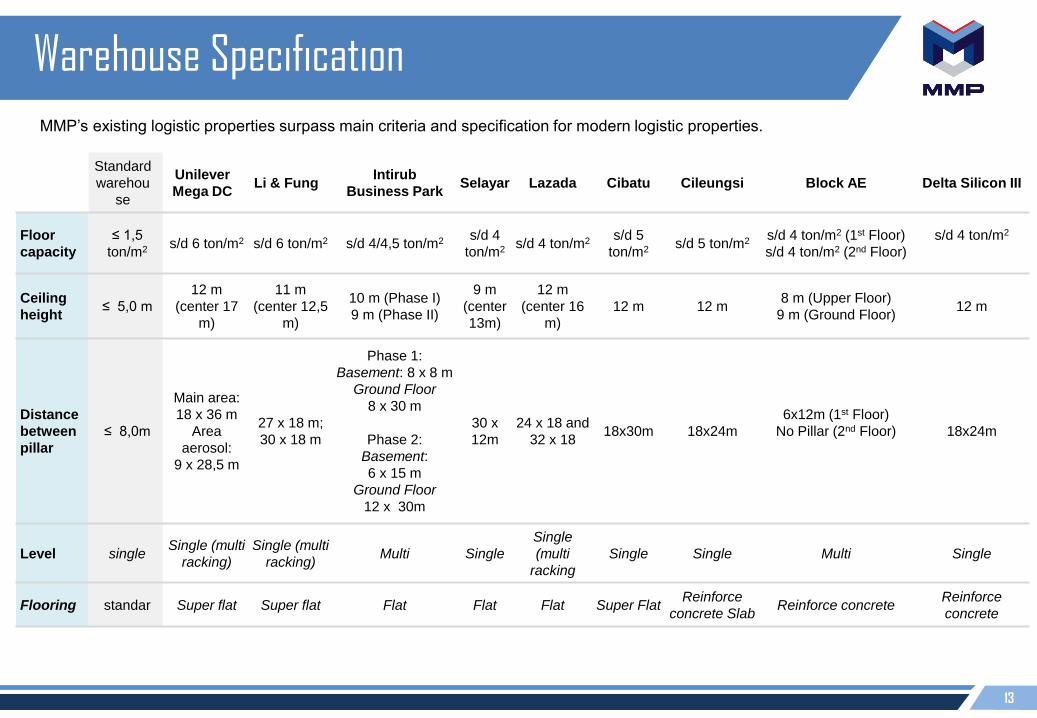
Warehouse Specification
Standard
warehou
se
Unilever
Mega DCLi & Fung
Intirub
Business ParkSelayar Lazada Cibatu Cileungsi Block AE Delta Silicon III
Floor
capacity
≤ 1,5
ton/m2 s/d 6 ton/m2 s/d 6 ton/m2 s/d 4/4,5 ton/m2 s/d 4
ton/m2 s/d 4 ton/m2 s/d 5
ton/m2 s/d 5 ton/m2 s/d 4 ton/m2 (1st Floor)
s/d 4 ton/m2 (2nd Floor)
s/d 4 ton/m2
Ceiling
height≤ 5,0 m
12 m
(center 17
m)
11 m
(center 12,5
m)
10 m (Phase I)
9 m (Phase II)
9 m
(center
13m)
12 m
(center 16
m)
12 m 12 m 8 m (Upper Floor)
9 m (Ground Floor)12 m
Distance
between
pillar
≤ 8,0m
Main area:
18 x 36 m
Area
aerosol:
9 x 28,5 m
27 x 18 m;
30 x 18 m
Phase 1:
Basement: 8 x 8 m
Ground Floor
8 x 30 m
Phase 2:
Basement:
6 x 15 m
Ground Floor
12 x 30m
30 x
12m
24 x 18 and
32 x 18 18x30m 18x24m
6x12m (1st Floor)
No Pillar (2nd Floor) 18x24m
Level singleSingle (multi
racking)
Single (multi
racking)Multi Single
Single
(multi
racking
Single Single Multi Single
Flooring standar Super flat Super flat Flat Flat Flat Super FlatReinforce
concrete SlabReinforce concrete
Reinforce
concrete
MMP’s existing logistic properties surpass main criteria and specification for modern logistic properties.

14
118,199 139,811 163,911 163,911
230,370
300,680 321,395
2013 2014 2015 2016 2017 2018 9M2019
2. Proven track record in developing and delivering logistic properties
MMP has proven track record in acquiring land and developing logistic properties, which generally takes around 15 to 18
months to complete construction.
Growth in NLA in the past years
Project Land Area Net Leasable Area Date of Contract Months to develop Delivery date
Unilever Mega DC 197,690 m2 90,288 m2 Dec 2010 16 months Apr 2012
Li & Fung 34,637 m2 21,612 m2 Jul 2012 11 months May 2013
Lazada Warehouse 90,041 m2 31,500 m2 Aug 2015 19 months Apr 2017
Cibatu 50,000 m2 36,335 m2 Jun 2016 15 months Dec 2017
Delta Silicon III (Ph 1) 100,000 m2 20,715m2 Mar 2018 24 months Jul 2019
Standard Warehouse Building
Project Land Area Net Leasable Area Date of ContractMonths to
developDelivery date
Intirub Business Park I 28,190 m2
36,622 m2 (warehouse) + 8,393 m2 (office)Dec 2011 9 months Jan 2012
Intirub Business Park II 32,380 m2 Dec 2013 18 months Apr 2014
Selayar 9,164 m2 5,620 m2 Apr 2015 12 months Apr 2015
Block AE 35,740 m2 38,854 m2 Sep 2016 18 months Feb 2018
Cileungsi 50,004 m2 31,456 m2 Sep 2016 18 months Feb 2018
Built-to-suit
m2
NLA

15
MMP focuses towards developing warehouse with size of 5.000 to 100.000 m2.
Stable operating cash flow with greater upside potential from improving economy cycle, while at the same time sheltered against
downside risks from economy slowing.
High operating leverage with high EBITDA margin.
Improve tenants’ efficiency and productivities through centralization of warehouses.
3. Solid business model that provides stable and recurring cash flow
Unilever Mega DC Li & Fung Intirub Business ParkSelayar
Operating assets that provide recurring and stable cash flow
Lazada
CibatuBlock AE Cileungsi DS III

16
Jakarta, Banten &
Jabar57%
Jateng6%
Jatim9%
Riau & Kep. Riau
9%
Sumut4%
Sumbar1%
Sulsel2%
Sulte…
Kaltim3%
Bangka Belitung
5%
Jakarta, Banten &
Jabar71%
Jateng5%
Jatim8%
Riau & Kep. Riau
8%
Sumut5%
Sumbar0%
Sulsel2%
Kaltim1%
4. Strategically located logistic property in Indonesia
Near centre of production and consumption
Easy access towards transportation network
Easy supply of labour workforce and convenient
transportation for employees
Provide benefits to tenants in reducing logistic costsSource: Himpunan Kawasan Industri% Industrial estate areas
% Industrial estates that are developed
Located in Java Island that is the centre for industries with the largest industrial estates in Indonesia
BESTCinere
Kunciran
Tangerang
CengkarengPenjaringan
Tanjung Priok
DKI
JakartaKebon
Jeruk
Ulujami
Veteran
(Pd Pinang)
Jagorawi
(Cimanggis)
Jawa Barat
Cibitung
Cikunir
Jatiasih
Hankam Raya
(Jatiwarana)Taman
Mini
Laut Jawa
Banten
Bekasi
Cakung
Cilincing
(Rorotan)
15
14
1312
9
8
765
3
2
1
16
17
11
4
10
Operational
In construction
Negotiation/tender
Contract signed
1 to 9 JORR I
10 to 17 JORR II
Located in Java Island that is the centre for industries with the largest industrial estates in Indonesia

17
36%
43%
16%
5%
Manufacture Logistics E-commerce Others
E-commerce
5. Diversified and strong client base
Logistic
Manufacturing
ClientsTenant profile of MMP’s logistic properties as of Sept 2019
18
Section 2
Growth Strategy

19
A strategy that focuses on three factors of success to reach scalable size
Three factors of success
Efficiency Funding
Volume
800,000 m2
NLA
To achieve our NLA target of 800,000 m2 by end of 2021
Continues to reduce construction cost to maximize yield
to cost
Sustainable of funding structure and recycle of cash
To accelerate growth and generate stable cash flow
Sustain profitability and greater EBITDA margin
Timely execution of development
To increase transparency and good corporate
governance
Our strategy is simplified into three factors – funding, efficiency and volume. Timely ability to seek flexible funding structure and continues effort to
reduce cost will maximize yield to cost. This will lead to greater profitability. Our initial scalable size to be achieved by end of 2021 is 800,000m2
NLA.
20
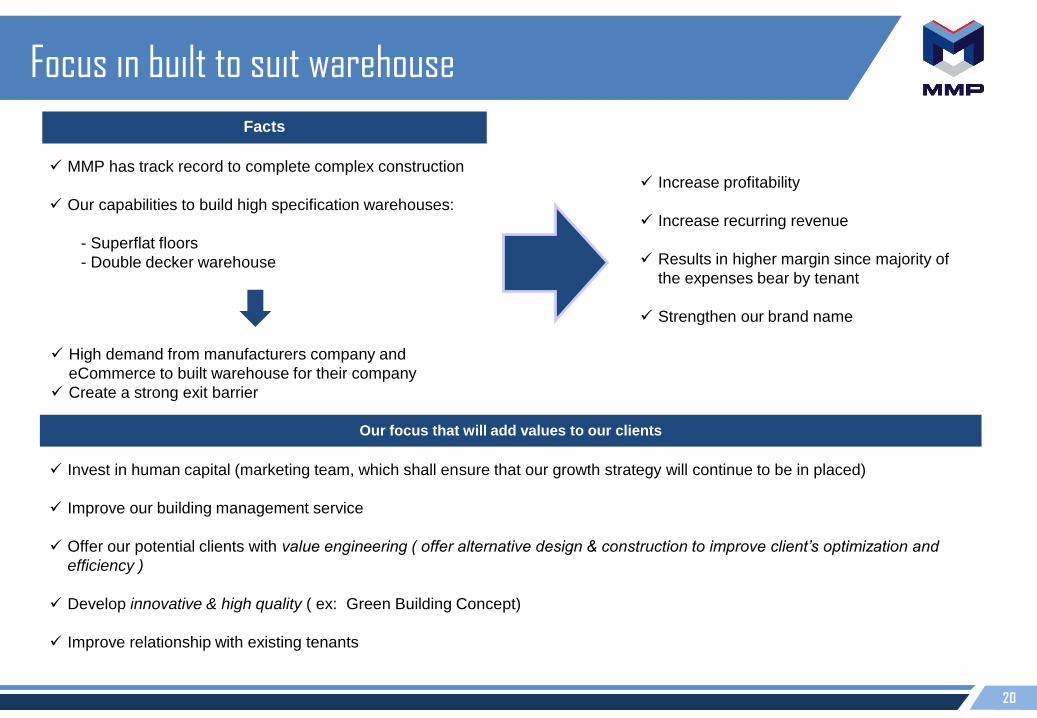
Focus in built to suit warehouse
Facts
MMP has track record to complete complex construction
Our capabilities to build high specification warehouses:
- Superflat floors
- Double decker warehouse
Increase profitability
Increase recurring revenue
Results in higher margin since majority of
the expenses bear by tenant
Strengthen our brand name
Invest in human capital (marketing team, which shall ensure that our growth strategy will continue to be in placed)
Improve our building management service
Offer our potential clients with value engineering ( offer alternative design & construction to improve client’s optimization and
efficiency )
Develop innovative & high quality ( ex: Green Building Concept)
Improve relationship with existing tenants
High demand from manufacturers company and
eCommerce to built warehouse for their company
Create a strong exit barrier
Our focus that will add values to our clients
21
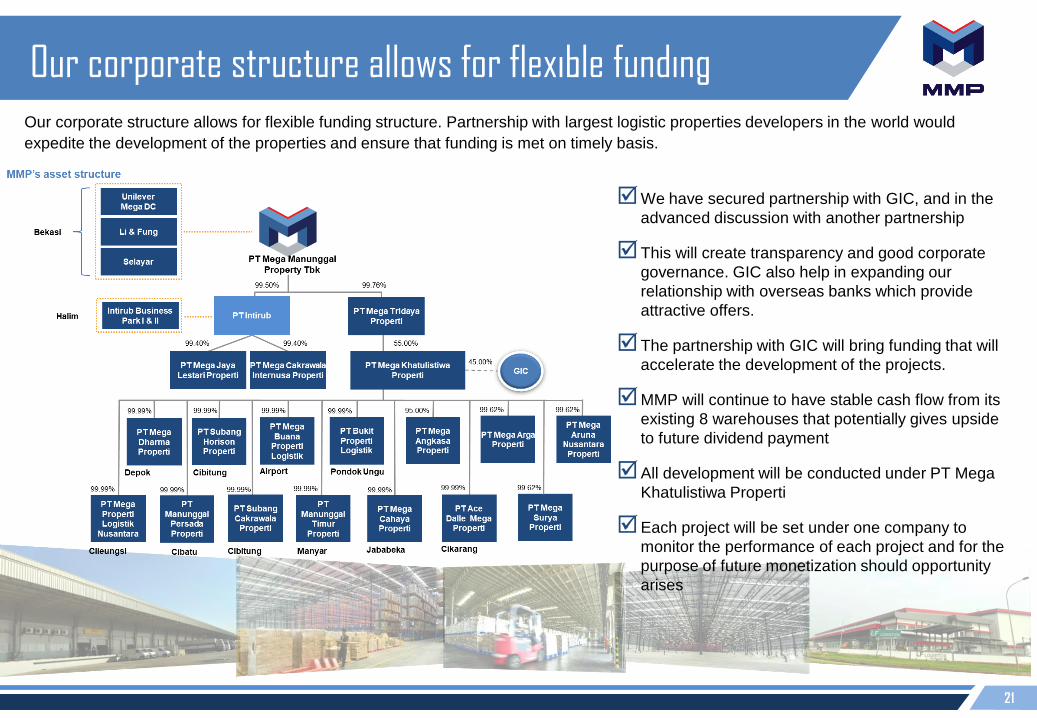
We have secured partnership with GIC, and in the
advanced discussion with another partnership
This will create transparency and good corporate
governance. GIC also help in expanding our
relationship with overseas banks which provide
attractive offers.
The partnership with GIC will bring funding that will
accelerate the development of the projects.
MMP will continue to have stable cash flow from its
existing 8 warehouses that potentially gives upside
to future dividend payment
All development will be conducted under PT Mega
Khatulistiwa Properti
Each project will be set under one company to
monitor the performance of each project and for the
purpose of future monetization should opportunity
arises
Our corporate structure allows for flexible fundingOur corporate structure allows for flexible funding structure. Partnership with largest logistic properties developers in the world would
expedite the development of the properties and ensure that funding is met on timely basis.

22
Continuous effort to cut costs amid aggressive capacity expansion
We have successfully cut down our construction cost by 10% on recent development plan
We set our yield to cost for at least of 9-10%
Our formula is to have land cost for 1/3 of total cost
We strengthen our engineers team to look for best possible design that will cut any
unnecessary cost
We continue to monitor construction progresses to align with existing budget
Efficiency
Volume CurPlan to construct 5 warehouses this year
rently under construction : Phase II warehouse for Lazada (35,000 m2) will be completed in
2019, DS-3 phase 1 project will be delivered as well in 2019.Pondok Ungu warehouse
(54,000 m2) will be delivered in 2021, Jababeka warehouse will be delivered in 2020, Manyar
Warehouse Phase II & III will be delivered in 2021.
23
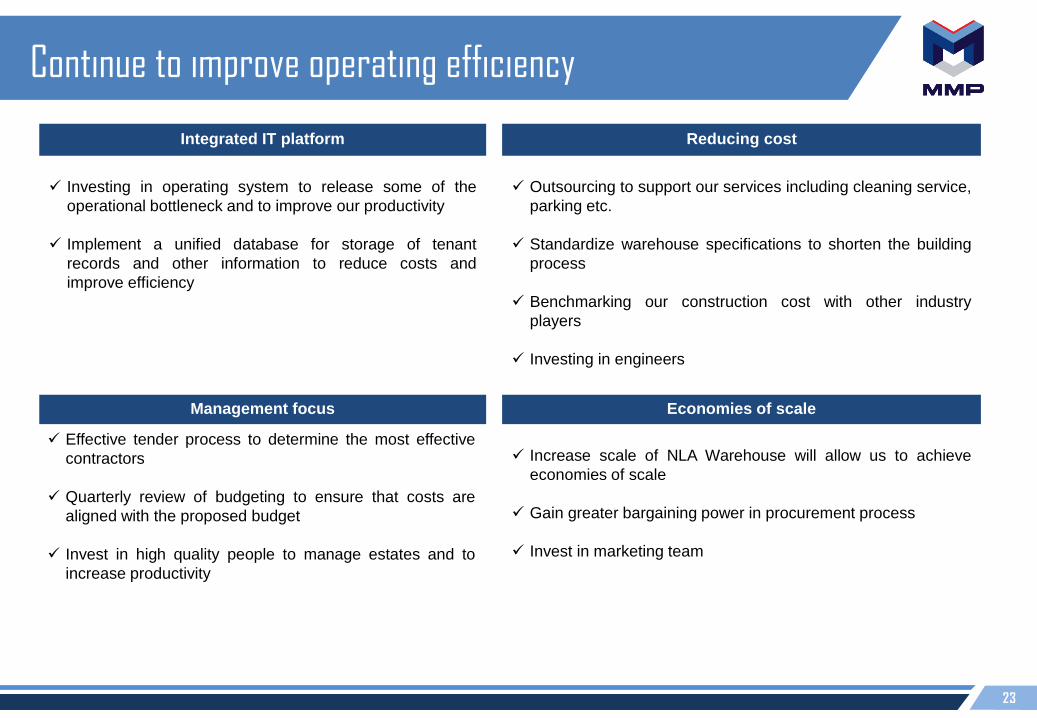
Continue to improve operating efficiency
Investing in operating system to release some of the
operational bottleneck and to improve our productivity
Implement a unified database for storage of tenant
records and other information to reduce costs and
improve efficiency
Increase scale of NLA Warehouse will allow us to achieve
economies of scale
Gain greater bargaining power in procurement process
Invest in marketing team
Integrated IT platform Reducing cost
Outsourcing to support our services including cleaning service,
parking etc.
Standardize warehouse specifications to shorten the building
process
Benchmarking our construction cost with other industry
players
Investing in engineers
Effective tender process to determine the most effective
contractors
Quarterly review of budgeting to ensure that costs are
aligned with the proposed budget
Invest in high quality people to manage estates and to
increase productivity
Management focus Economies of scale

24
Section 3
23
Projects Under Development
25
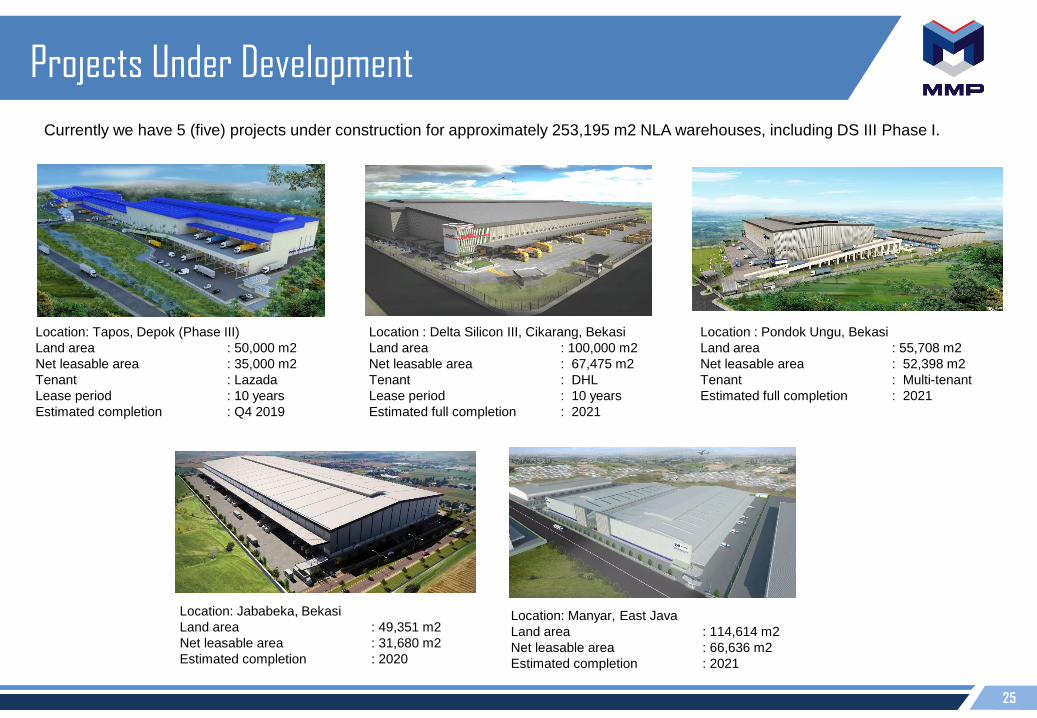
Projects Under Development
Currently we have 5 (five) projects under construction for approximately 253,195 m2 NLA warehouses, including DS III Phase I.
Location: Tapos, Depok (Phase III)
Land area : 50,000 m2
Net leasable area : 35,000 m2
Tenant : Lazada
Lease period : 10 years
Estimated completion : Q4 2019
Location : Delta Silicon III, Cikarang, Bekasi
Land area : 100,000 m2
Net leasable area : 67,475 m2
Tenant : DHL
Lease period : 10 years
Estimated full completion : 2021
Location : Pondok Ungu, Bekasi
Land area : 55,708 m2
Net leasable area : 52,398 m2
Tenant : Multi-tenant
Estimated full completion : 2021
Location: Jababeka, Bekasi
Land area : 49,351 m2
Net leasable area : 31,680 m2
Estimated completion : 2020
Location: Manyar, East Java
Land area : 114,614 m2
Net leasable area : 66,636 m2
Estimated completion : 2021
26
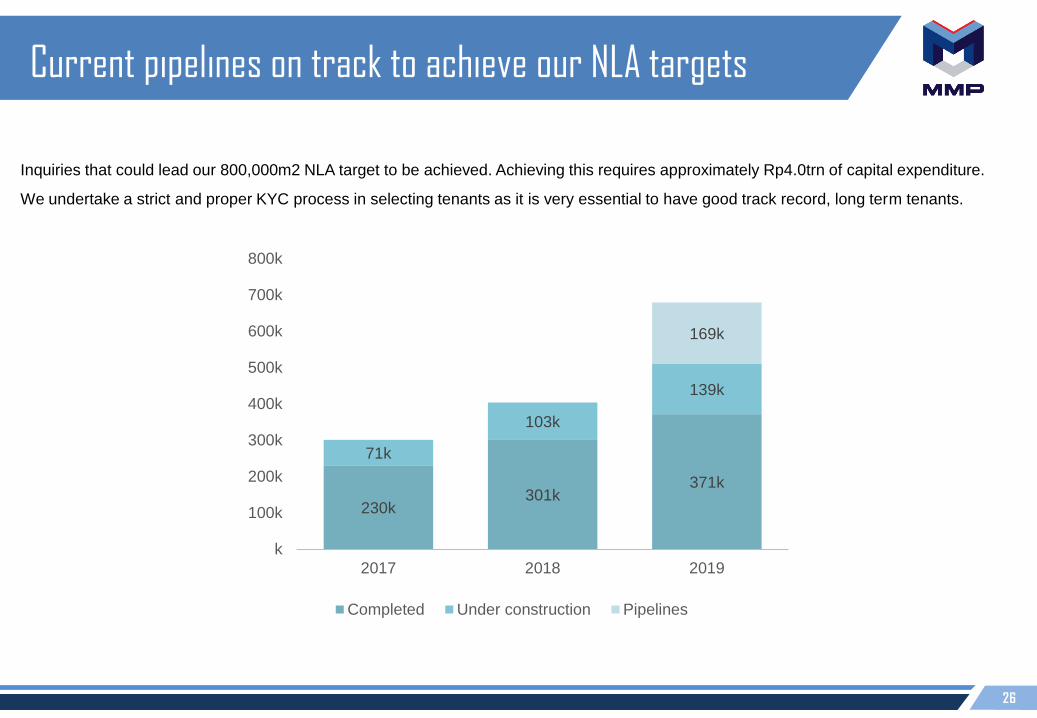
Current pipelines on track to achieve our NLA targets
Inquiries that could lead our 800,000m2 NLA target to be achieved. Achieving this requires approximately Rp4.0trn of capital expenditure.
We undertake a strict and proper KYC process in selecting tenants as it is very essential to have good track record, long term tenants.
230k301k
371k
71k
103k
139k
169k
k
100k
200k
300k
400k
500k
600k
700k
800k
2017 2018 2019
Completed Under construction Pipelines
27
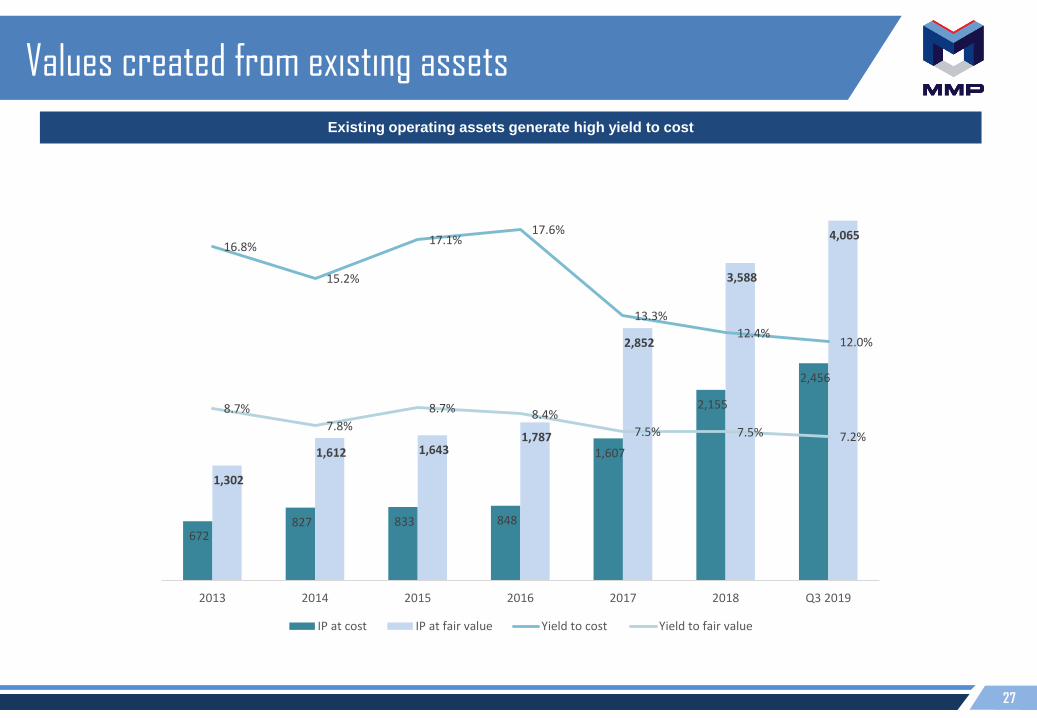
Values created from existing assets
Existing operating assets generate high yield to cost
672 827 833 848
1,607
2,155
2,456
1,302
1,612 1,643 1,787
2,852
3,588
4,065 16.8%
15.2%
17.1%17.6%
13.3%
12.4%12.0%
8.7%
7.8%
8.7% 8.4%
7.5% 7.5% 7.2%
0.0%
2.0%
4.0%
6.0%
8.0%
10.0%
12.0%
14.0%
16.0%
18.0%
20.0%
-
500
1,000
1,500
2,000
2,500
3,000
3,500
4,000
4,500
2013 2014 2015 2016 2017 2018 Q3 2019
IP at cost IP at fair value Yield to cost Yield to fair value
28
Section 4
Strong Growth Opportunity
29
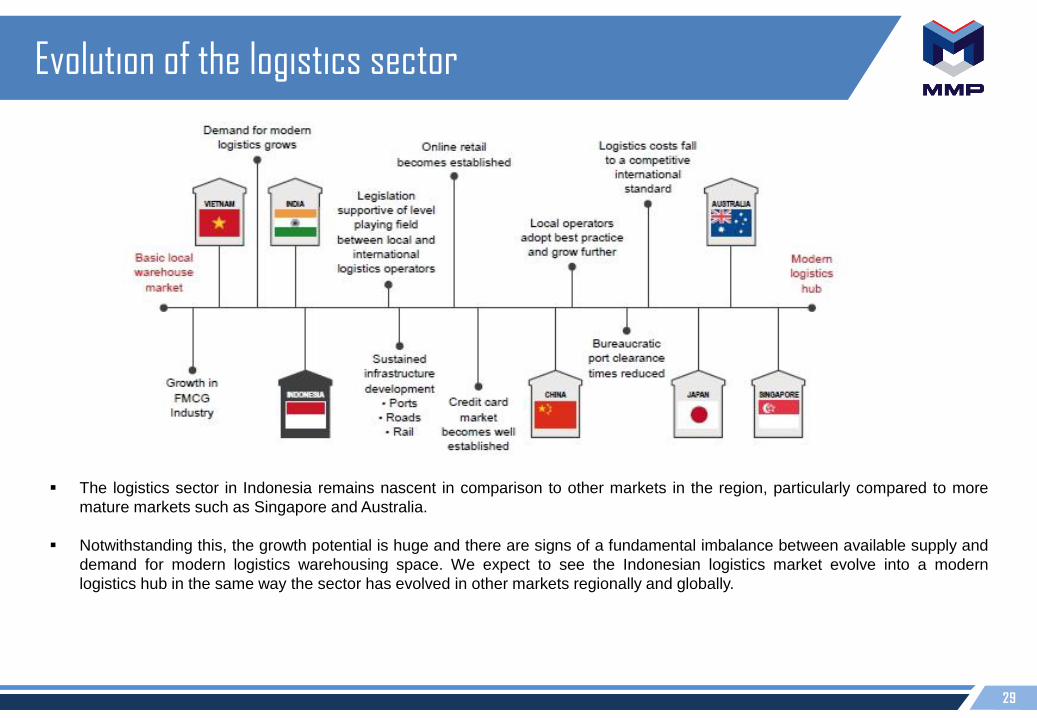
The logistics sector in Indonesia remains nascent in comparison to other markets in the region, particularly compared to more
mature markets such as Singapore and Australia.
Notwithstanding this, the growth potential is huge and there are signs of a fundamental imbalance between available supply and
demand for modern logistics warehousing space. We expect to see the Indonesian logistics market evolve into a modern
logistics hub in the same way the sector has evolved in other markets regionally and globally.
Evolution of the logistics sector
30
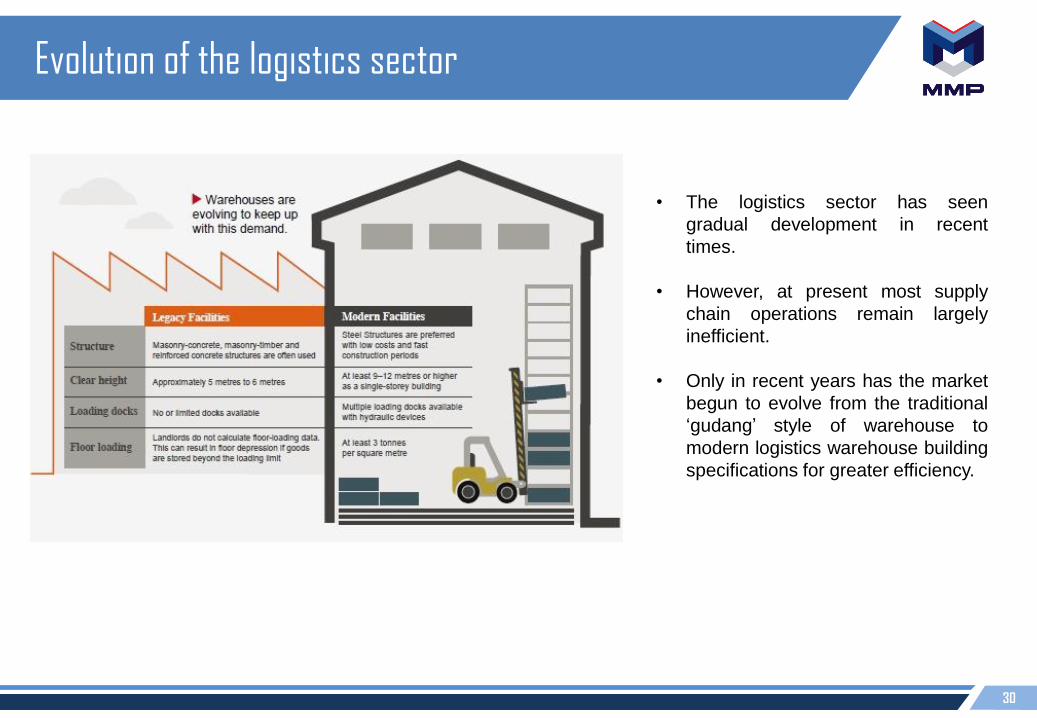
• The logistics sector has seen
gradual development in recent
times.
• However, at present most supply
chain operations remain largely
inefficient.
• Only in recent years has the market
begun to evolve from the traditional
‘gudang’ style of warehouse to
modern logistics warehouse building
specifications for greater efficiency.
Evolution of the logistics sector
31
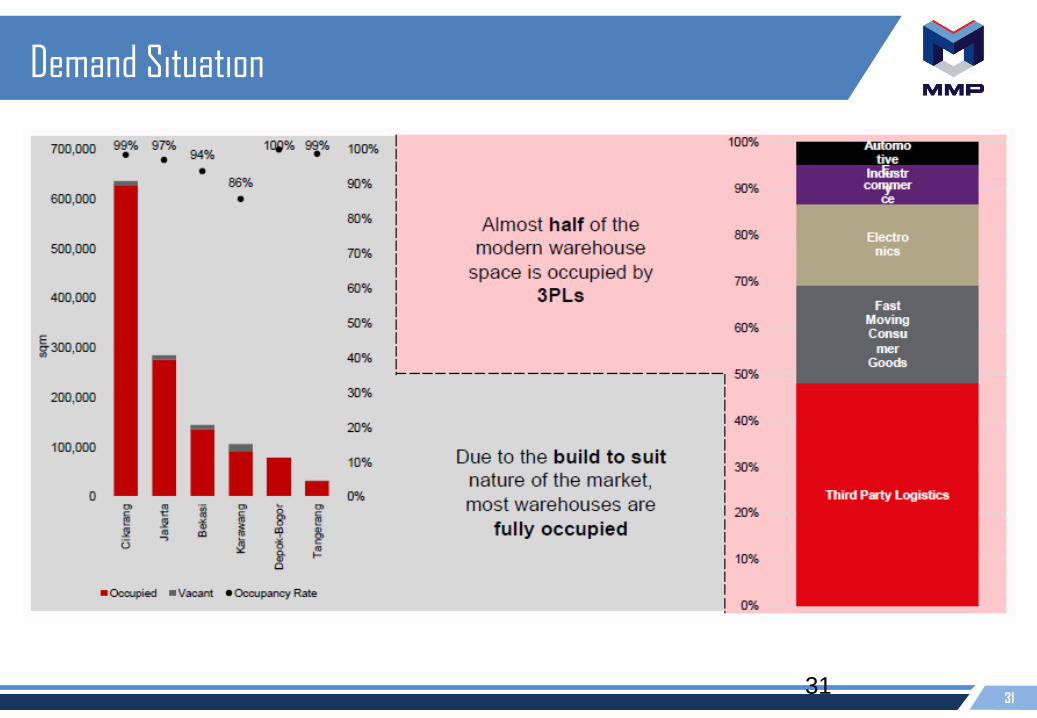
Demand Situation
31

32
A nascent industry to enter
26%
19%
9% 8%
14%
9%
13%
2016 2020 2035 Singapore Malaysia Japan South Korea
Logistic cost as % of total GDP
33
Asia logistics, industrial yields and rentals
Asia logistics / industrial yields by key centres Asia logistics / industrial rentals by key markets
0%
2%
4%
6%
8%
10%
12%
India China Japan Singapore Hongkong
Yie
ld (
%p
er
an
nu
m)
Yield (%p.a) Risk - free Rates
Source: Colliers International
5% 5%
0%
5%
4%
10%
3%
0%
2%
4%
6%
8%
10%
12%
0
5
10
15
20
25
HongkongSingapore Tokyo Delhi Shanghai Beijing Guangzhou
Rental, US$ per sq ft p.a. (LHS) Forecast growth, % YoY
Source: Colliers International
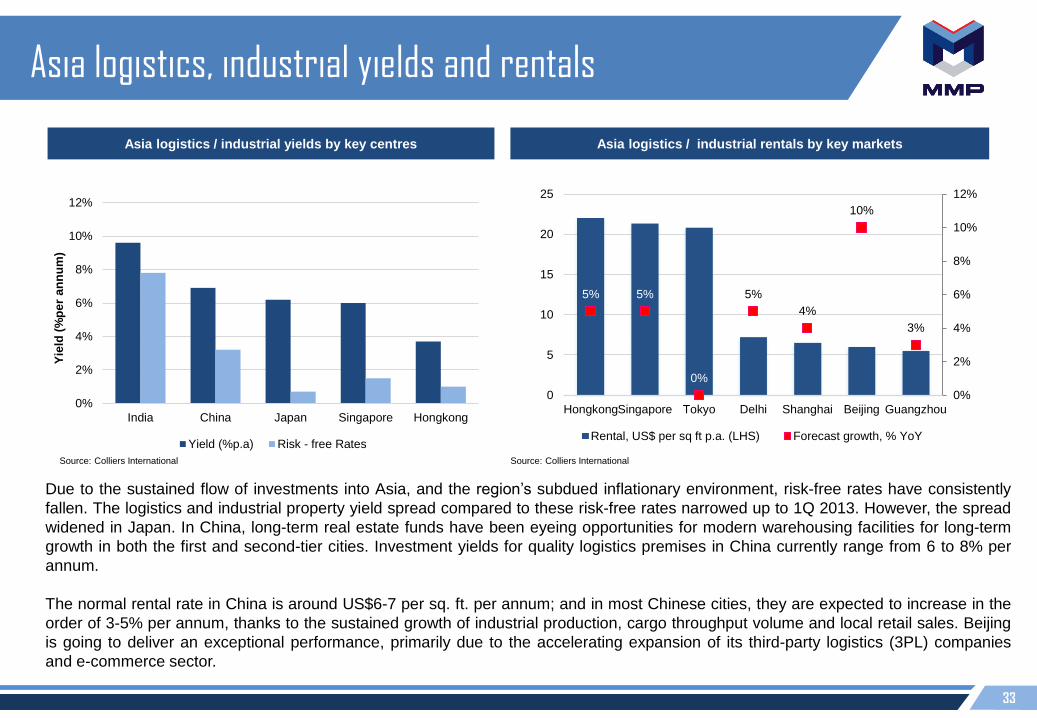
Due to the sustained flow of investments into Asia, and the region’s subdued inflationary environment, risk-free rates have consistently
fallen. The logistics and industrial property yield spread compared to these risk-free rates narrowed up to 1Q 2013. However, the spread
widened in Japan. In China, long-term real estate funds have been eyeing opportunities for modern warehousing facilities for long-term
growth in both the first and second-tier cities. Investment yields for quality logistics premises in China currently range from 6 to 8% per
annum.
The normal rental rate in China is around US$6-7 per sq. ft. per annum; and in most Chinese cities, they are expected to increase in the
order of 3-5% per annum, thanks to the sustained growth of industrial production, cargo throughput volume and local retail sales. Beijing
is going to deliver an exceptional performance, primarily due to the accelerating expansion of its third-party logistics (3PL) companies
and e-commerce sector.
34
Asia Logistics / Industrial Rental
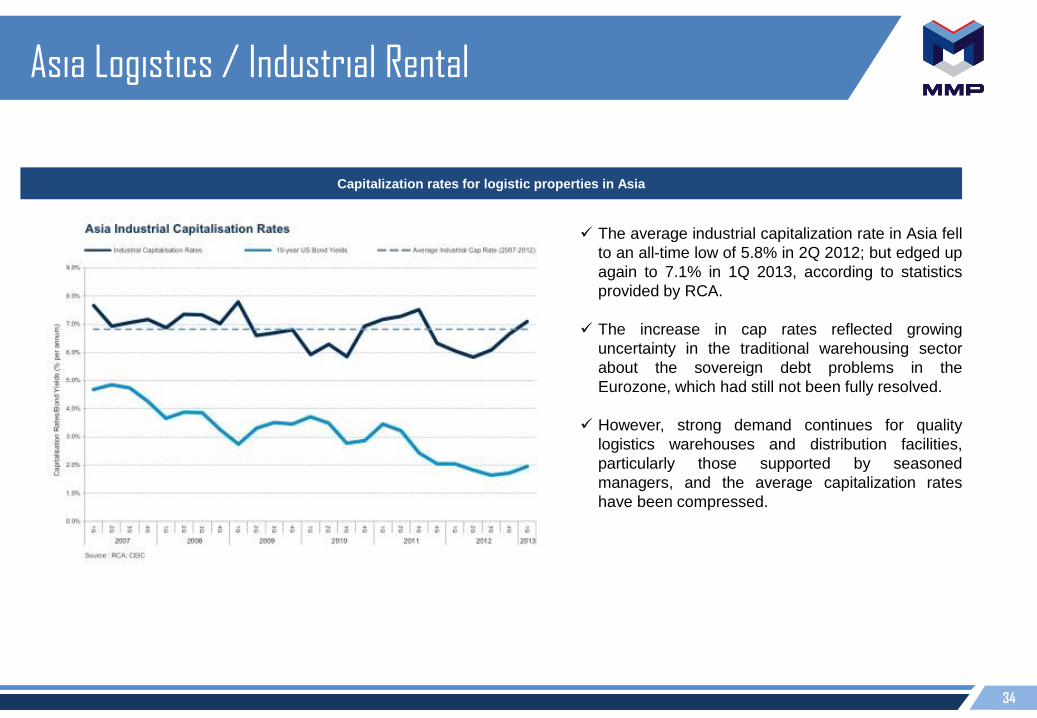
Capitalization rates for logistic properties in Asia
The average industrial capitalization rate in Asia fell
to an all-time low of 5.8% in 2Q 2012; but edged up
again to 7.1% in 1Q 2013, according to statistics
provided by RCA.
The increase in cap rates reflected growing
uncertainty in the traditional warehousing sector
about the sovereign debt problems in the
Eurozone, which had still not been fully resolved.
However, strong demand continues for quality
logistics warehouses and distribution facilities,
particularly those supported by seasoned
managers, and the average capitalization rates
have been compressed.
35
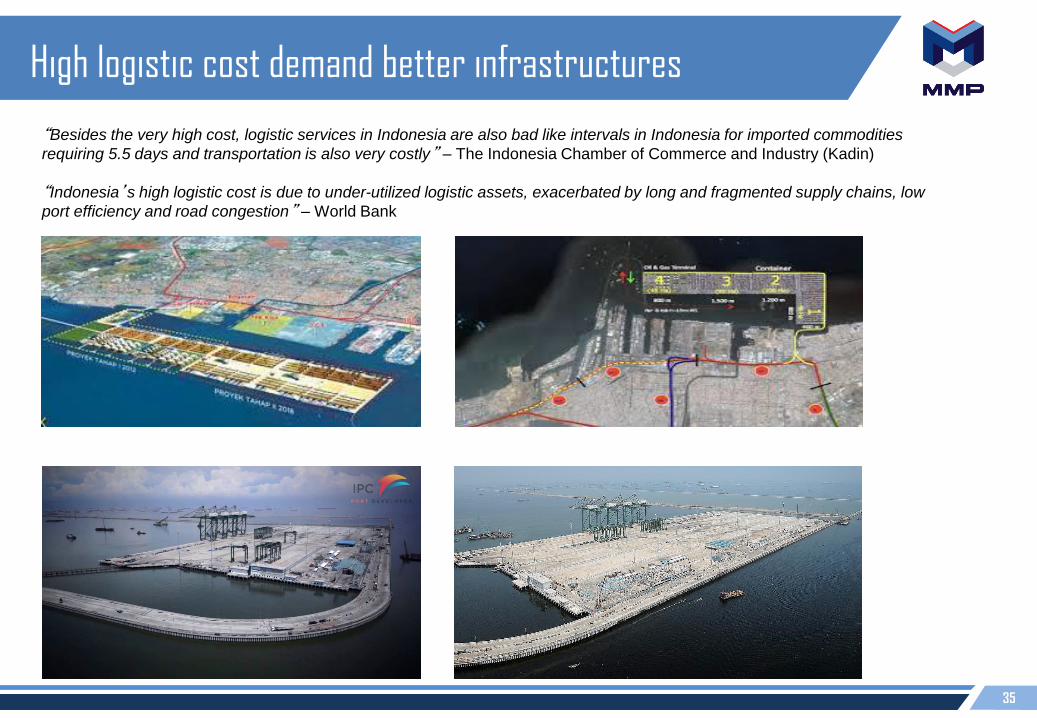
High logistic cost demand better infrastructures
“Besides the very high cost, logistic services in Indonesia are also bad like intervals in Indonesia for imported commodities
requiring 5.5 days and transportation is also very costly” – The Indonesia Chamber of Commerce and Industry (Kadin)
“Indonesia’s high logistic cost is due to under-utilized logistic assets, exacerbated by long and fragmented supply chains, low
port efficiency and road congestion” – World Bank
36
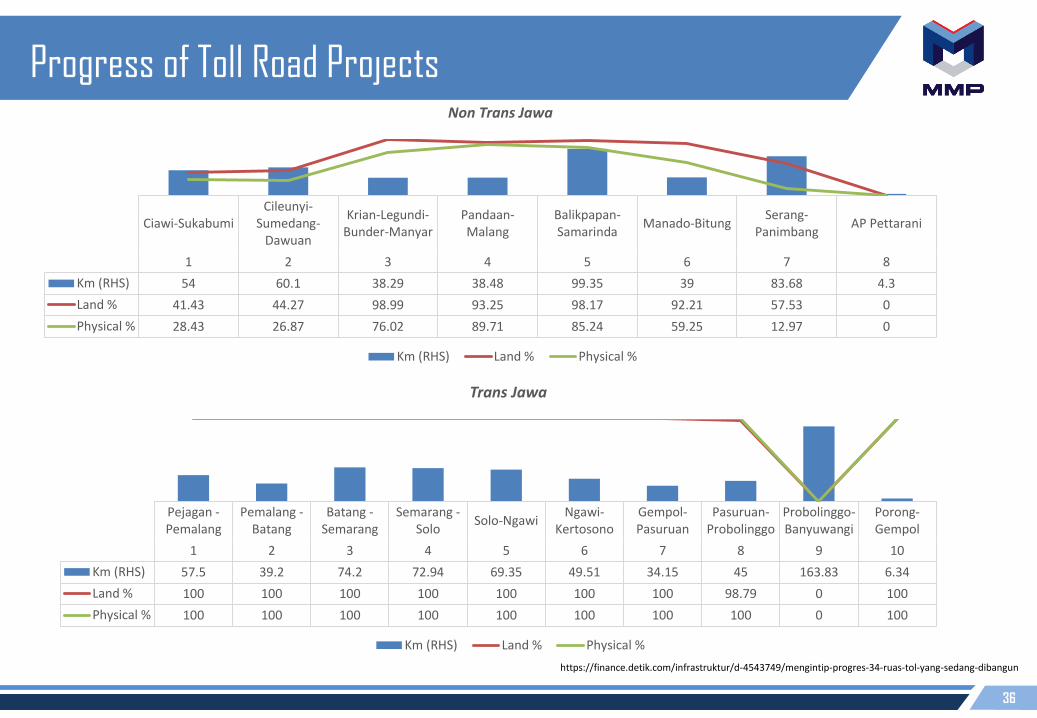
Progress of Toll Road Projects
Ciawi-SukabumiCileunyi-
Sumedang-Dawuan
Krian-Legundi-Bunder-Manyar
Pandaan-Malang
Balikpapan-Samarinda
Manado-BitungSerang-
PanimbangAP Pettarani
1 2 3 4 5 6 7 8
Km (RHS) 54 60.1 38.29 38.48 99.35 39 83.68 4.3
Land % 41.43 44.27 98.99 93.25 98.17 92.21 57.53 0
Physical % 28.43 26.87 76.02 89.71 85.24 59.25 12.97 0
020406080100120
020406080
100
Non Trans Jawa
Km (RHS) Land % Physical %
Pejagan -Pemalang
Pemalang -Batang
Batang -Semarang
Semarang -Solo
Solo-NgawiNgawi-
KertosonoGempol-Pasuruan
Pasuruan-Probolinggo
Probolinggo-Banyuwangi
Porong-Gempol
1 2 3 4 5 6 7 8 9 10
Km (RHS) 57.5 39.2 74.2 72.94 69.35 49.51 34.15 45 163.83 6.34
Land % 100 100 100 100 100 100 100 98.79 0 100
Physical % 100 100 100 100 100 100 100 100 0 100
020406080100120140160180
020406080
100
Trans Jawa
Km (RHS) Land % Physical %
https://finance.detik.com/infrastruktur/d-4543749/mengintip-progres-34-ruas-tol-yang-sedang-dibangun

37
Progress of Toll Road Projects
No Jabodetabek Km (RHS) Land % Physical %
1 Cengkareng-Kunciran 11 63.96 52.52
2 Kunciran-Serpong 10.14 98.7 88.76
3 Serpong-Cinere 11.19 79.23 56.55
4 Cinere-Jagorawi 14.64 65.73 62.6
5 Cimanggis-Cibitung 26.5 70.45 10.47
6 Cibitung-Cilincing 32.76 76.63 48.07
7 Depok-Antasari 21.54 56.6 38.94
8 Bekasi-Cawang-Kp Melayu 21.04 60.53 75.2
9 Semanan-Pulo Gebang 31.1 24.05 8.45
10Jakarta-Cikampek II Elevated
14.19 100 70.04
11 Japek II Sisi Selatan 62 0 0
https://finance.detik.com/infrastruktur/d-4543749/mengintip-progres-34-ruas-tol-yang-sedang-dibangun
38
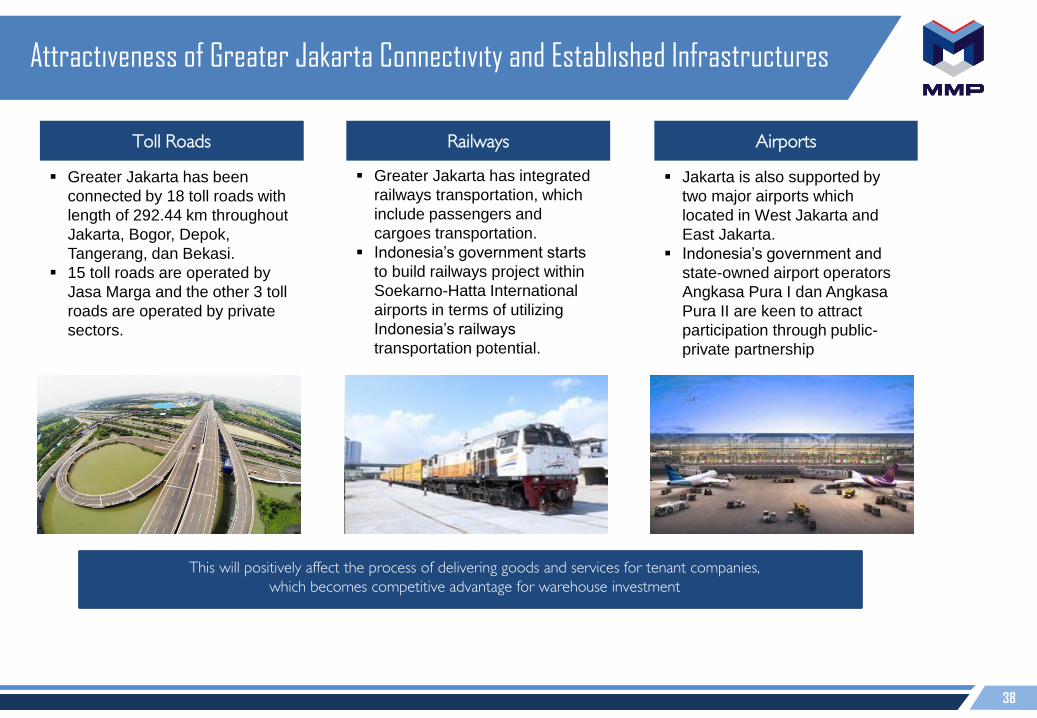
Attractiveness of Greater Jakarta Connectivity and Established Infrastructures
Toll Roads AirportsRailways
Greater Jakarta has been
connected by 18 toll roads with
length of 292.44 km throughout
Jakarta, Bogor, Depok,
Tangerang, dan Bekasi.
15 toll roads are operated by
Jasa Marga and the other 3 toll
roads are operated by private
sectors.
Greater Jakarta has integrated
railways transportation, which
include passengers and
cargoes transportation.
Indonesia’s government starts
to build railways project within
Soekarno-Hatta International
airports in terms of utilizing
Indonesia’s railways
transportation potential.
Jakarta is also supported by
two major airports which
located in West Jakarta and
East Jakarta.
Indonesia’s government and
state-owned airport operators
Angkasa Pura I dan Angkasa
Pura II are keen to attract
participation through public-
private partnership
This will positively affect the process of delivering goods and services for tenant companies,
which becomes competitive advantage for warehouse investment
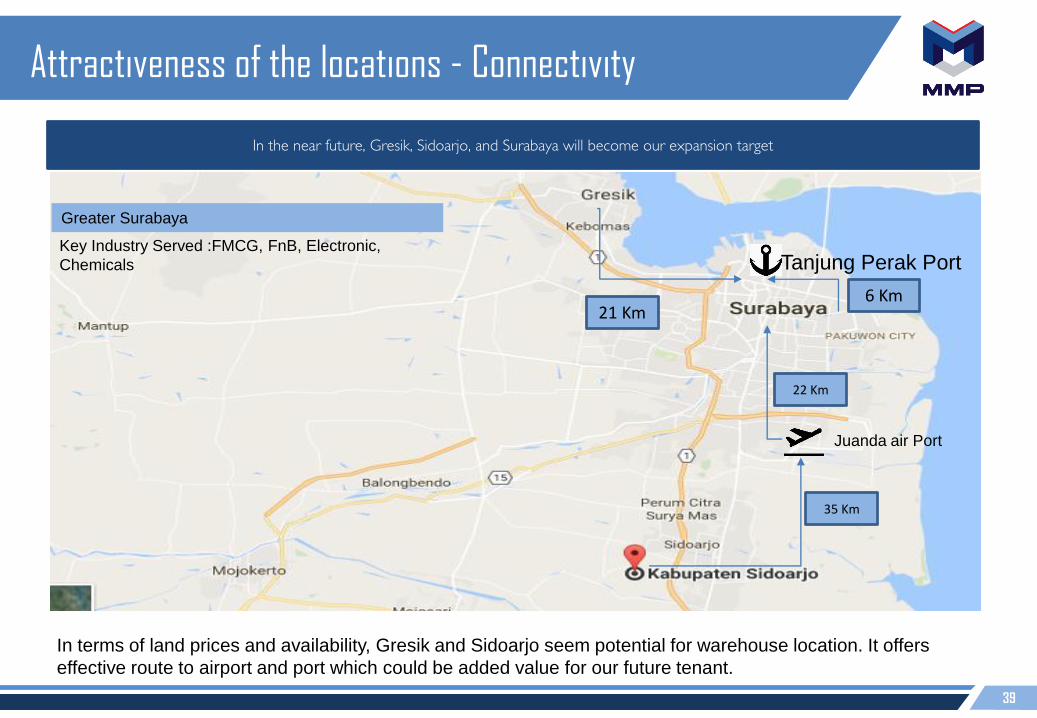
39
Tanjung Perak Port
Juanda air Port
In the near future, Gresik, Sidoarjo, and Surabaya will become our expansion target
21 Km
22 Km
In terms of land prices and availability, Gresik and Sidoarjo seem potential for warehouse location. It offers
effective route to airport and port which could be added value for our future tenant.
35 Km
6 Km
Key Industry Served :FMCG, FnB, Electronic,
Chemicals
Greater Surabaya
Attractiveness of the locations - Connectivity
40
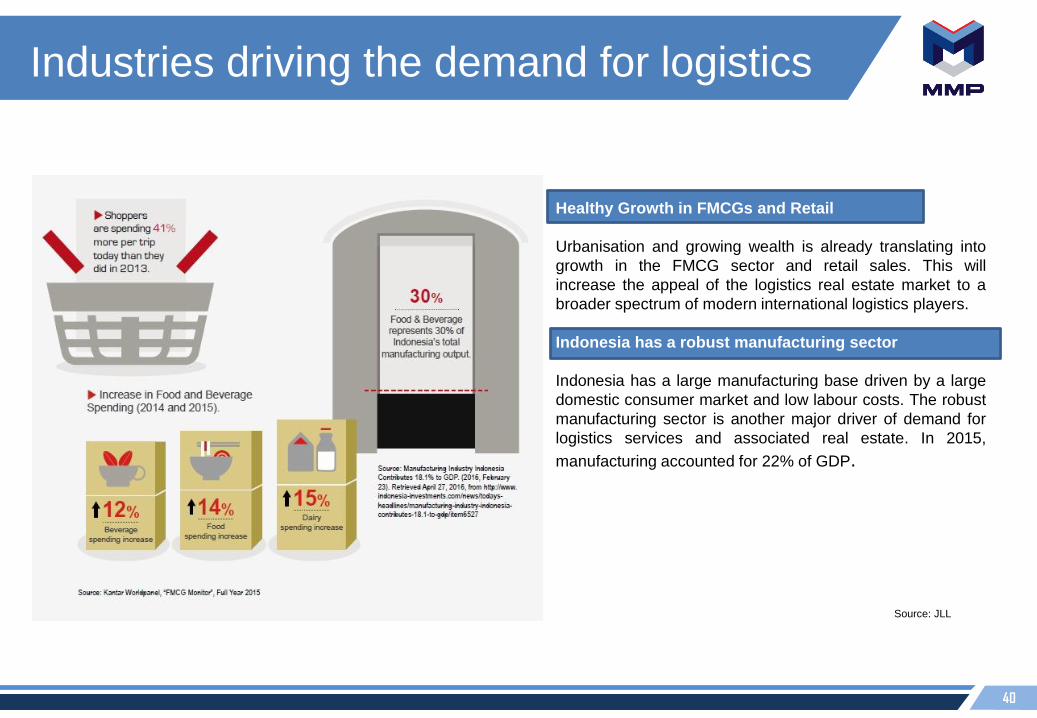
Industries driving the demand for logistics
Healthy Growth in FMCGs and Retail
Urbanisation and growing wealth is already translating into
growth in the FMCG sector and retail sales. This will
increase the appeal of the logistics real estate market to a
broader spectrum of modern international logistics players.
Indonesia has a robust manufacturing sector
Indonesia has a large manufacturing base driven by a large
domestic consumer market and low labour costs. The robust
manufacturing sector is another major driver of demand for
logistics services and associated real estate. In 2015,
manufacturing accounted for 22% of GDP.
Source: JLL
41
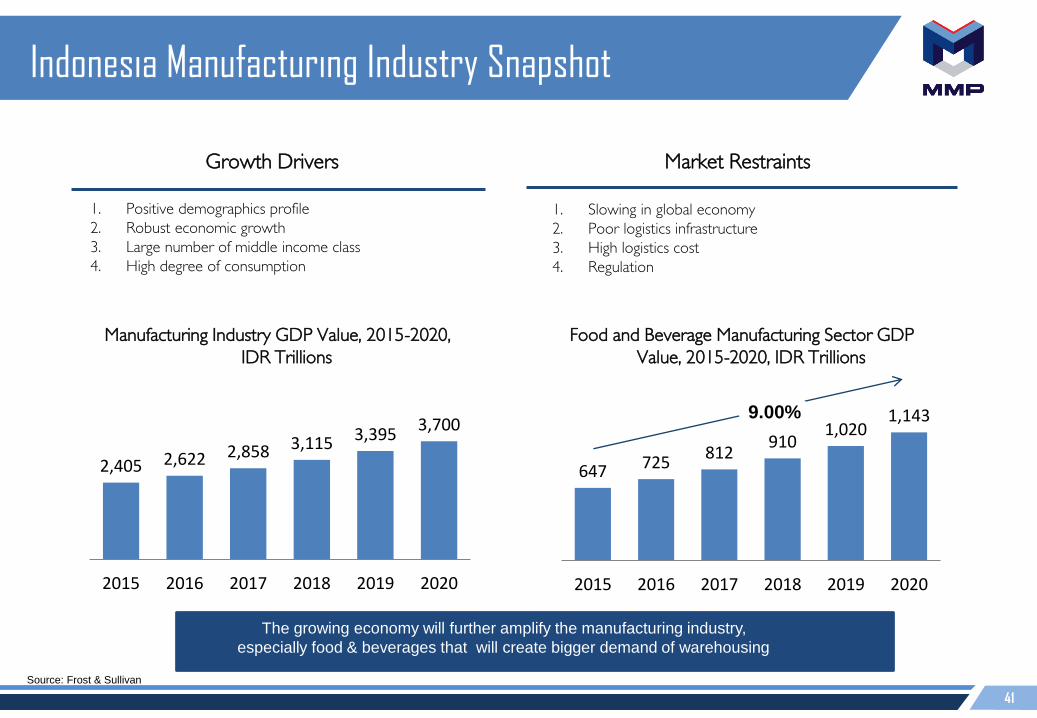
Indonesia Manufacturing Industry Snapshot
647 725812
9101,020
1,143
2015 2016 2017 2018 2019 2020
9.00%
Food and Beverage Manufacturing Sector GDP
Value, 2015-2020, IDR Trillions
2,405 2,622 2,858 3,115 3,3953,700
2015 2016 2017 2018 2019 2020
1. Positive demographics profile
2. Robust economic growth
3. Large number of middle income class
4. High degree of consumption
Growth Drivers Market Restraints
1. Slowing in global economy
2. Poor logistics infrastructure
3. High logistics cost
4. Regulation
Manufacturing Industry GDP Value, 2015-2020,
IDR Trillions
The growing economy will further amplify the manufacturing industry,
especially food & beverages that will create bigger demand of warehousing
Source: Frost & Sullivan
42
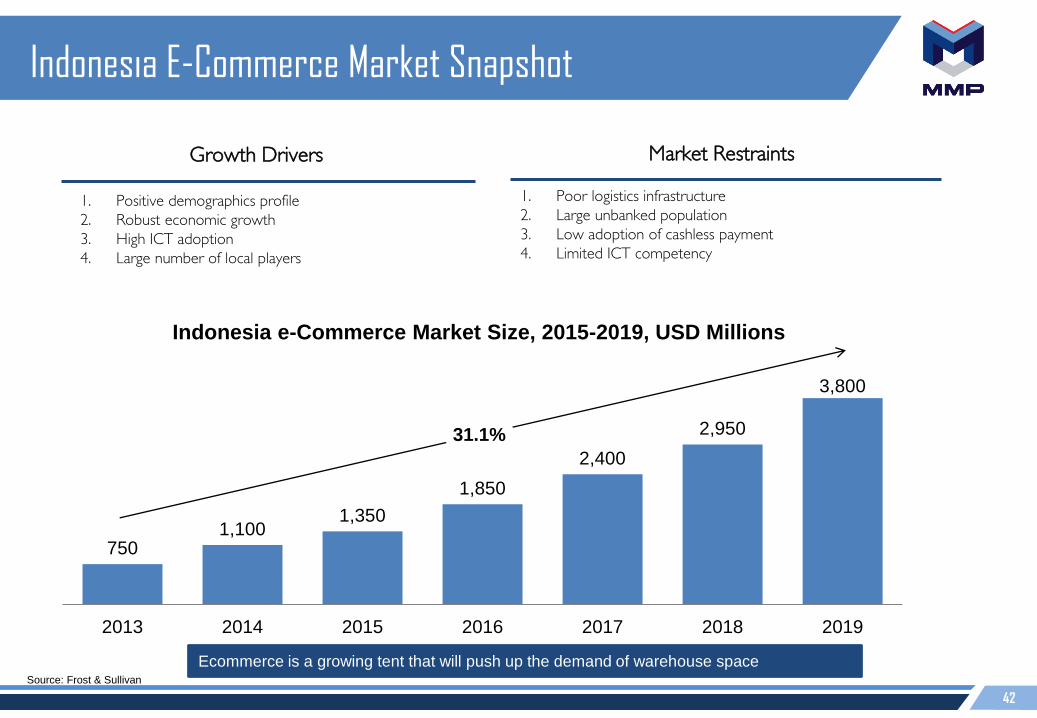
1. Positive demographics profile
2. Robust economic growth
3. High ICT adoption
4. Large number of local players
Growth Drivers Market Restraints
1. Poor logistics infrastructure
2. Large unbanked population
3. Low adoption of cashless payment
4. Limited ICT competency
7501,100
1,350
1,850
2,400
2,950
3,800
2013 2014 2015 2016 2017 2018 2019
31.1%
Indonesia e-Commerce Market Size, 2015-2019, USD Millions
Ecommerce is a growing tent that will push up the demand of warehouse spaceSource: Frost & Sullivan
Indonesia E-Commerce Market Snapshot
43
Source: EIU, Euromonitor
High growth, large domestic market
Low growth, small domestic
market
Low growth, small domestic market
Low growth, large domestic market
Indonesia
Singapura
Filipina
Thailand
Malaysia
Jepang
Australia
Vietnam
Myanmar
0
50
100
150
200
250
300
0.0% 1.0% 2.0% 3.0% 4.0% 5.0% 6.0% 7.0%
Popula
tio
n (m
n)
Estimated average real GDP growth 2012-2016F
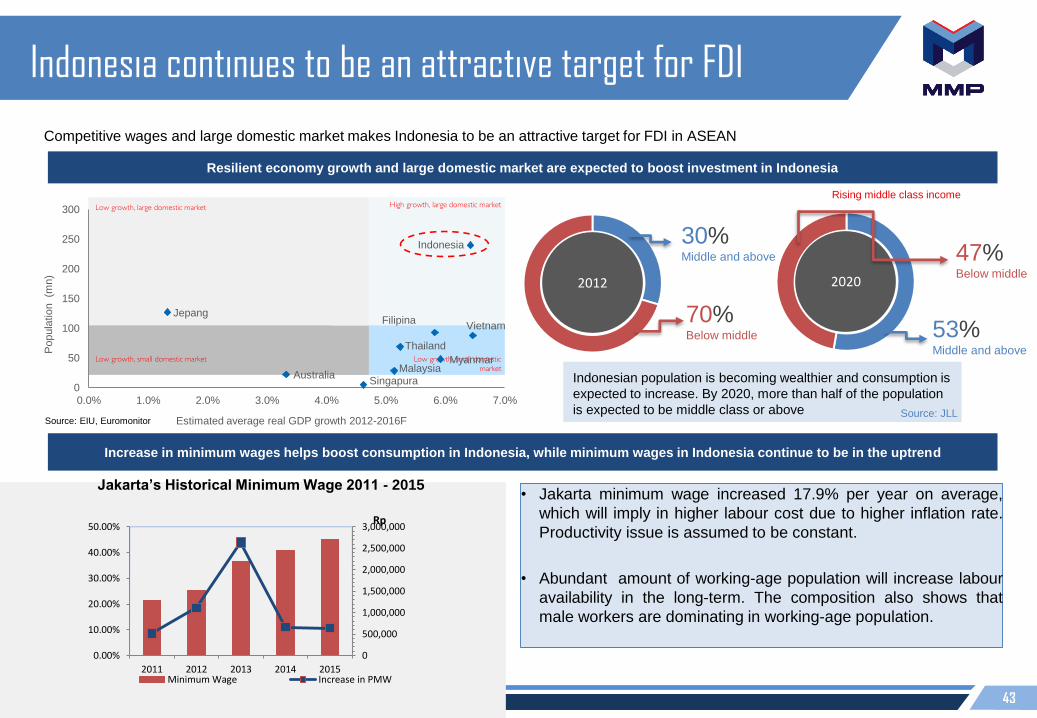
Indonesia continues to be an attractive target for FDI
Competitive wages and large domestic market makes Indonesia to be an attractive target for FDI in ASEAN
Rising middle class income
• Jakarta minimum wage increased 17.9% per year on average,
which will imply in higher labour cost due to higher inflation rate.
Productivity issue is assumed to be constant.
• Abundant amount of working-age population will increase labour
availability in the long-term. The composition also shows that
male workers are dominating in working-age population.
Resilient economy growth and large domestic market are expected to boost investment in Indonesia
Increase in minimum wages helps boost consumption in Indonesia, while minimum wages in Indonesia continue to be in the uptrend
0
500,000
1,000,000
1,500,000
2,000,000
2,500,000
3,000,000
0.00%
10.00%
20.00%
30.00%
40.00%
50.00%
2011 2012 2013 2014 2015Minimum Wage Increase in PMW
Rp
Jakarta’s Historical Minimum Wage 2011 - 2015
Source: JLL
2012 2020
Indonesian population is becoming wealthier and consumption is
expected to increase. By 2020, more than half of the population
is expected to be middle class or above
30%Middle and above
70%Below middle 53%
Middle and above
47%Below middle
44
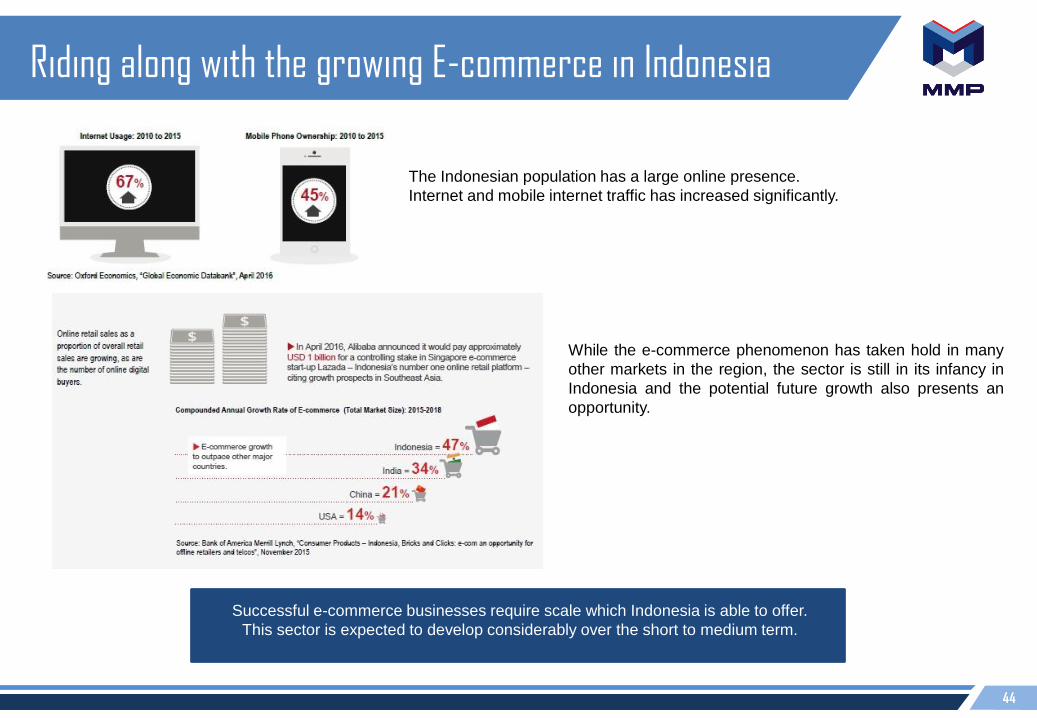
Riding along with the growing E-commerce in Indonesia
Successful e-commerce businesses require scale which Indonesia is able to offer.
This sector is expected to develop considerably over the short to medium term.
While the e-commerce phenomenon has taken hold in many
other markets in the region, the sector is still in its infancy in
Indonesia and the potential future growth also presents an
opportunity.
The Indonesian population has a large online presence.
Internet and mobile internet traffic has increased significantly.
45
Section 5
47
Key Financial

46
Solid revenues growth
Development of NLA and Occupancy Rate
MMP has successfully posted revenue Rp245.0 bn in 3Q19 supported by stable NLA and occupancy rate. Currently, our NLA stood at 321,395
sqm.
2013 2014 2015 2016 2017 2018 9M19
Net Leasable Area (sqm) 139,811 158,137 163,911 163,911 230,370 300,680 321,395
Leased area (sqm) 135,311 154,623 159,318 163,911 230,157 298,775 318,165
Occupancy Rate (%) 97.0% 94.0% 97.0% 100.0% 99.9% 99.4% 99.0%
139,811 158,137 163,911 163,911
230,370
300,680 321,395
96.8%94.0%
97.2%100.0% 99.9% 99.4% 99.0%
50.0%
55.0%
60.0%
65.0%
70.0%
75.0%
80.0%
85.0%
90.0%
95.0%
100.0%
2013 2014 2015 2016 2017 2018 9M19
-
50,000
100,000
150,000
200,000
250,000
300,000
350,000
47
261
65
323
217
144
107
-
142 163 175
209
299
245 220
2014 2015 2016 2017 2018 3Q19 3Q18
IDR
mili
ar
Increase in fair value of investmet properties Revenues
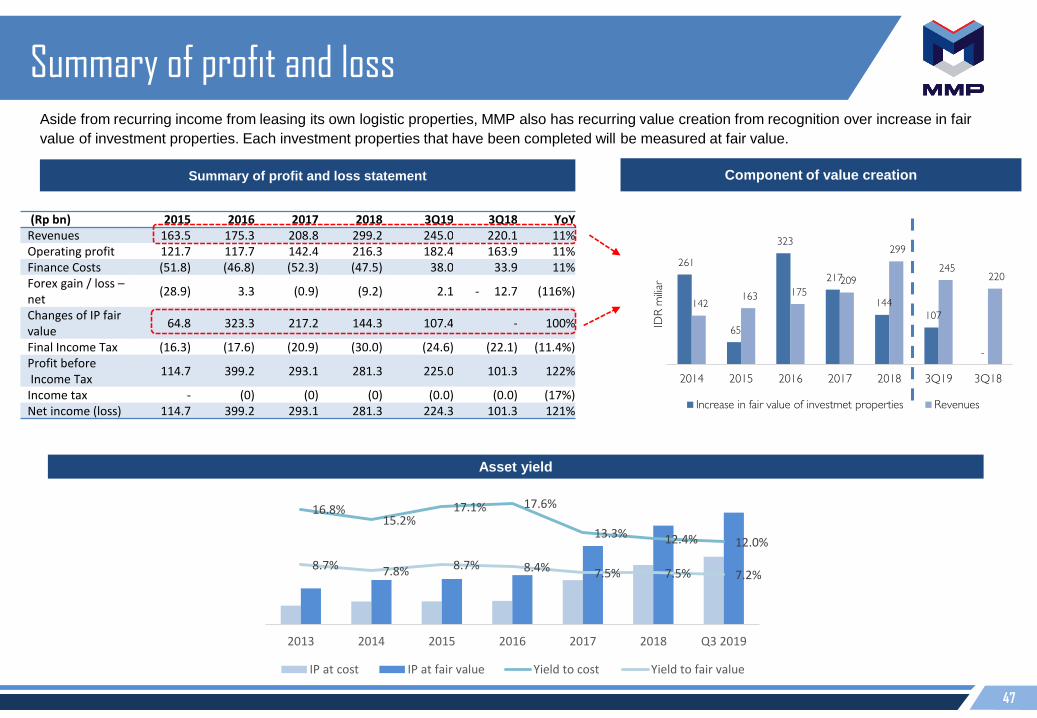
(Rp bn) 2015 2016 2017 2018 3Q19 3Q18 YoYRevenues 163.5 175.3 208.8 299.2 245.0 220.1 11%Operating profit 121.7 117.7 142.4 216.3 182.4 163.9 11%Finance Costs (51.8) (46.8) (52.3) (47.5) 38.0 33.9 11%Forex gain / loss –net
(28.9) 3.3 (0.9) (9.2) 2.1 - 12.7 (116%)
Changes of IP fair value
64.8 323.3 217.2 144.3 107.4 - 100%
Final Income Tax (16.3) (17.6) (20.9) (30.0) (24.6) (22.1) (11.4%)Profit beforeIncome Tax
114.7 399.2 293.1 281.3 225.0 101.3 122%
Income tax - (0) (0) (0) (0.0) (0.0) (17%)Net income (loss) 114.7 399.2 293.1 281.3 224.3 101.3 121%
Summary of profit and loss
Summary of profit and loss statement
Aside from recurring income from leasing its own logistic properties, MMP also has recurring value creation from recognition over increase in fair
value of investment properties. Each investment properties that have been completed will be measured at fair value.
Asset yield
Component of value creation
16.8%15.2%
17.1% 17.6%
13.3% 12.4% 12.0%
8.7% 7.8% 8.7% 8.4% 7.5% 7.5% 7.2%
0.0%
5.0%
10.0%
15.0%
20.0%
-
1,000
2,000
3,000
4,000
5,000
2013 2014 2015 2016 2017 2018 Q3 2019
IP at cost IP at fair value Yield to cost Yield to fair value
48
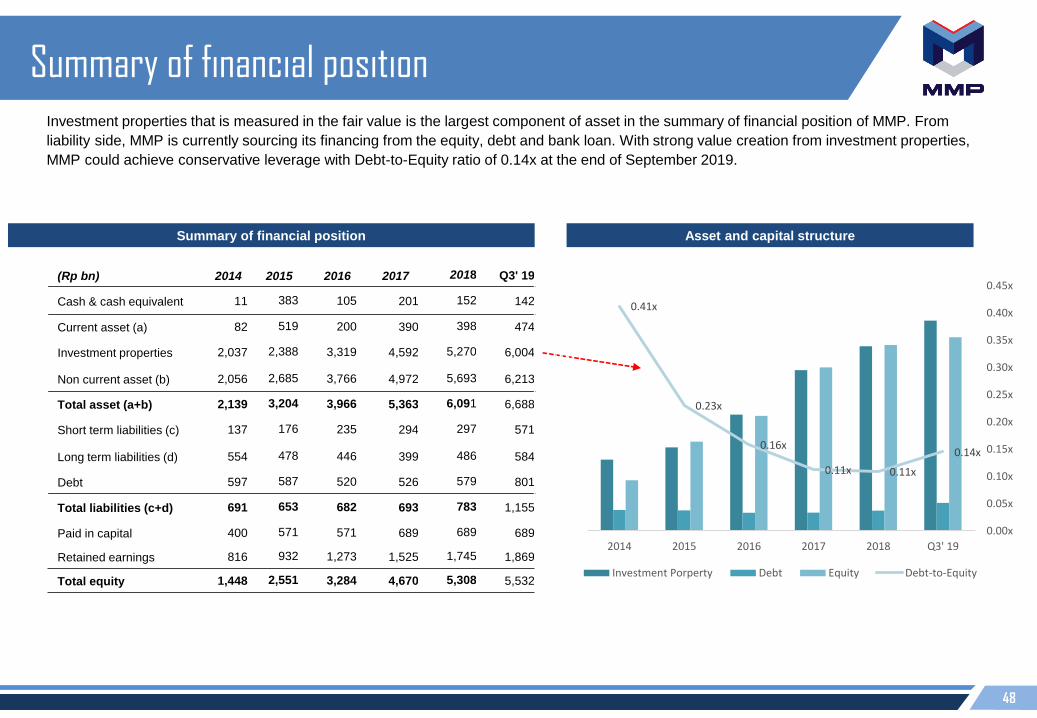
Summary of financial position
Summary of financial position Asset and capital structure
Investment properties that is measured in the fair value is the largest component of asset in the summary of financial position of MMP. From
liability side, MMP is currently sourcing its financing from the equity, debt and bank loan. With strong value creation from investment properties,
MMP could achieve conservative leverage with Debt-to-Equity ratio of 0.14x at the end of September 2019.
(Rp bn) 2014 2015 2016 2017 2018 Q3' 19
Cash & cash equivalent 11 383 105 201 152 142
Current asset (a) 82 519 200 390 398 474
Investment properties 2,037 2,388 3,319 4,592 5,270 6,004
Non current asset (b) 2,056 2,685 3,766 4,972 5,693 6,213
Total asset (a+b) 2,139 3,204 3,966 5,363 6,091 6,688
Short term liabilities (c) 137 176 235 294 297 571
Long term liabilities (d) 554 478 446 399 486 584
Debt 597 587 520 526 579 801
Total liabilities (c+d) 691 653 682 693 783 1,155
Paid in capital 400 571 571 689 689 689
Retained earnings 816 932 1,273 1,525 1,745 1,869
Total equity 1,448 2,551 3,284 4,670 5,308 5,532
0.41x
0.23x
0.16x
0.11x 0.11x
0.14x
0.00x
0.05x
0.10x
0.15x
0.20x
0.25x
0.30x
0.35x
0.40x
0.45x
-
1,000
2,000
3,000
4,000
5,000
6,000
7,000
2014 2015 2016 2017 2018 Q3' 19
Investment Porperty Debt Equity Debt-to-Equity
49
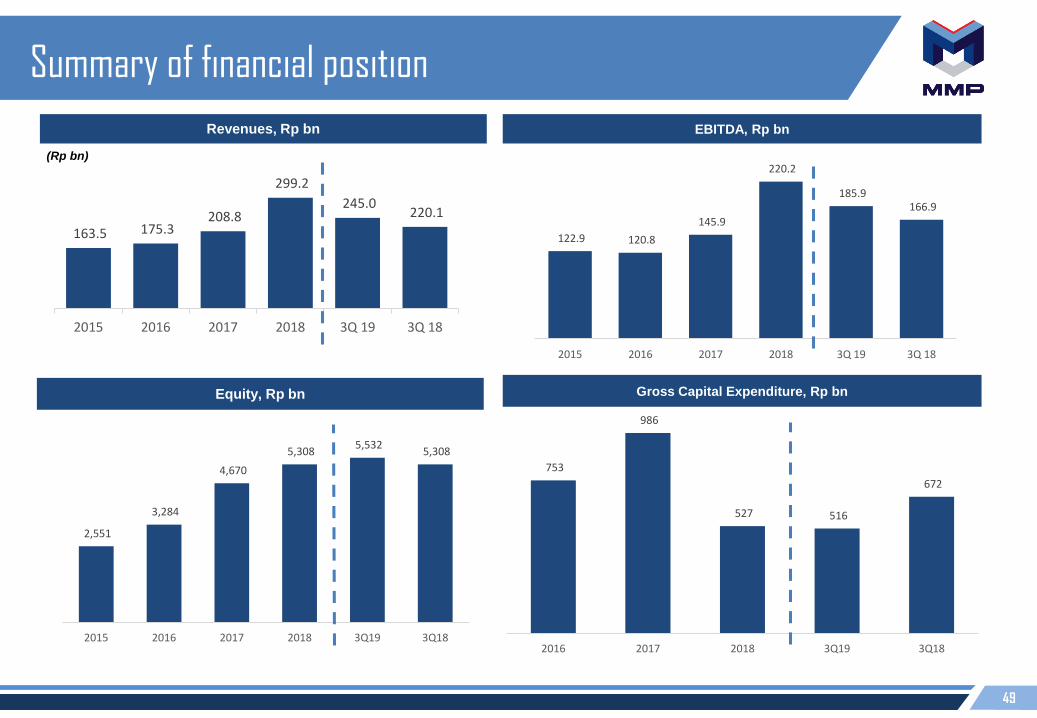
753
986
527 516
672
2016 2017 2018 3Q19 3Q18
2,551
3,284
4,670
5,308 5,532
5,308
-
1,000
2,000
3,000
4,000
5,000
6,000
2015 2016 2017 2018 3Q19 3Q18
122.9 120.8
145.9
220.2
185.9 166.9
-
50.0
100.0
150.0
200.0
250.0
2015 2016 2017 2018 3Q 19 3Q 18
163.5 175.3 208.8
299.2
245.0 220.1
2015 2016 2017 2018 3Q 19 3Q 18
Summary of financial position
Revenues, Rp bn EBITDA, Rp bn
Equity, Rp bn Gross Capital Expenditure, Rp bn
(Rp bn)

50
2014 2015 2016 2017 2018 3Q 19
Operational metric
Net Leasable Area, m2
Built to suit 111,900 117,520 117,520 185,355 185,355 206,070
Multi tenants 46,237 52,011 46,391 45,015 115,325 115,325
Total, m2 158,137 163,911 163,911 230,370 300,680 321,395
Occupancy rate, %
Built to suit 98% 97% 100% 100% 100% 100%
Multi tenants 98% 97% 100% 99% 99% 97%
Average occupancy rate, % 98.0% 97.0% 99.9% 99.9% 99.4% 99.0%
Average remaining lease term, years 6.5 6.0 5.4 5.4 4.4 4.4
Revenue by segment
Revenue, Rp bn
Rental built to suit 99,160 99,922 106,313 137,015 188.718 116,100
Rental multi tenants 42,758 63,570 69,006 72,452 110.516 128,925
Total revenues, Rp bn 141,918 163,492 175,320 209,467 299,234 245,025
Key performance matrix
Net leasable composition area
As of 30 September 2019
Built To Suit48%Multi Tenant
52%
51
Section 6
Assets in Details
52
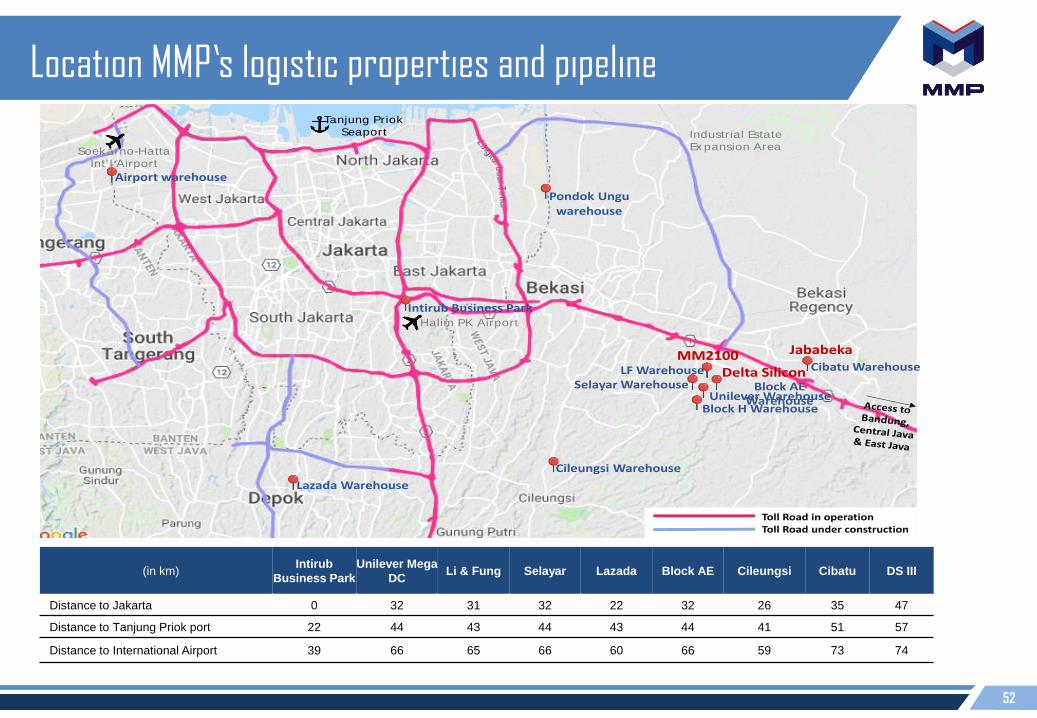
Location MMP’s logistic properties and pipeline
(in km)Intirub
Business Park
Unilever Mega
DCLi & Fung Selayar Lazada Block AE Cileungsi Cibatu DS III
Distance to Jakarta 0 32 31 32 22 32 26 35 47
Distance to Tanjung Priok port 22 44 43 44 43 44 41 51 57
Distance to International Airport 39 66 65 66 60 66 59 73 74
Tanjung Priok
Seaport Industrial Estate
Ex pansion Area
Halim PK Airport
Pondok Ungu warehouse
Lazada Warehouse
Cileungsi Warehouse
Intirub Business Park
JababekaMM2100Cibatu Warehouse
Block AE Warehouse
LF WarehouseSelayar Warehouse
Unilever WarehouseBlock H Warehouse
Delta Silicon
Airport warehouse
Soekarno-Hatta
Int’ l Airport
Toll Road in operation Toll Road under construction

53
Tanjung Perak Port
Juanda Air Port
Toll RoadsIn Operation
Under construction
Planning
In (Km) Manyar Warehouse
Distance to Surabaya 31
Distance to Airport 52
Distance to Tanjung Perak Port 29
Location MMP’s logistic properties and pipeline
MMP properties

54
Unilever Mega DC Warehouse
Location : MM2100 industrial estates, West
Cikarang, Bekasi
Land area : 197.690 m2
Gross floor area : 156.462 m2
NLA : 90.288 m2
Lease period : 10 years, with an option to extend
another 10 years
Operator : PT Linfox Logistics Indonesia
Floor capacity : 6 ton per m2
Ceiling height : 12 m (center 17 m)
Specification:
- Super flat floors (FF; Floor Flatness);
- Double deep pallet racking system;
- Heat shield;
- Parking area up to 104 truck;
- 85 loading doors;
- 8 loading dock levelers;
- Sprinkler on each rack, with immediate response;
- Fire extinguisher with standard of ULFM;
- Rental that include racking, sprinkler and office.
55
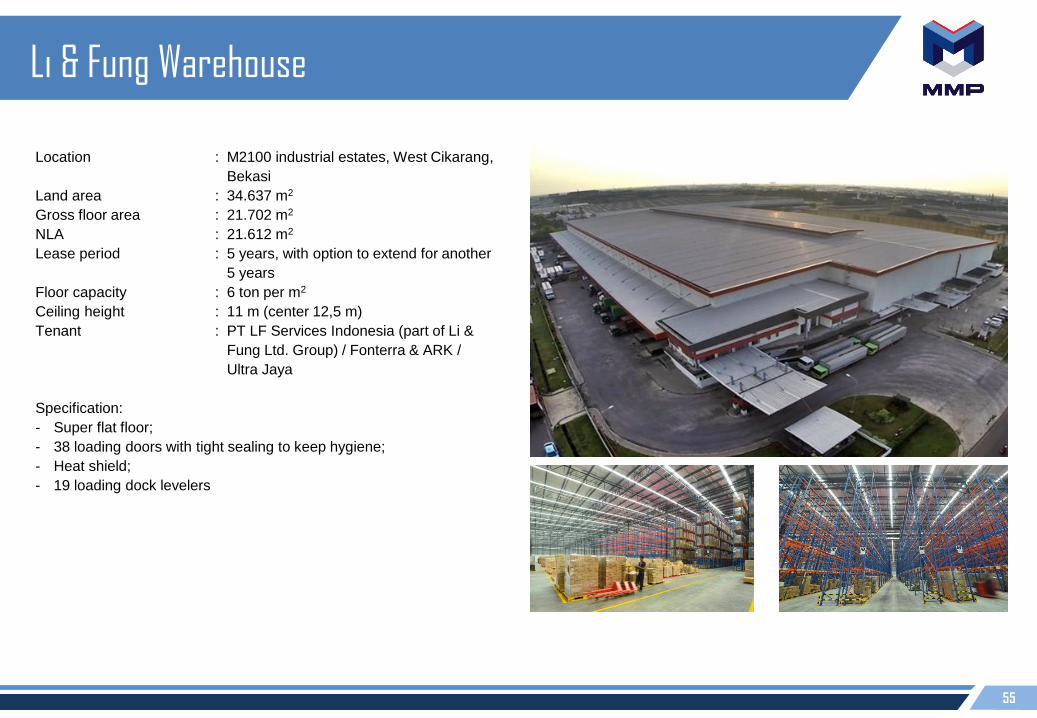
Li & Fung Warehouse
Location : M2100 industrial estates, West Cikarang,
Bekasi
Land area : 34.637 m2
Gross floor area : 21.702 m2
NLA : 21.612 m2
Lease period : 5 years, with option to extend for another
5 years
Floor capacity : 6 ton per m2
Ceiling height : 11 m (center 12,5 m)
Tenant : PT LF Services Indonesia (part of Li &
Fung Ltd. Group) / Fonterra & ARK /
Ultra Jaya
Specification:
- Super flat floor;
- 38 loading doors with tight sealing to keep hygiene;
- Heat shield;
- 19 loading dock levelers

56
Intirub Busines Park I & II Warehouse
Intirub Business Park
Location : Halim, East Jakarta
Land area : 60.575 m2
Gross floor area : 53.305 m2 (warehouse) + 11.151 m2 (office)
NLA : 36.622 m2 (warehouse) + 8.393 m2 (office)
Floor capacity : up to 4,5 ton per m2
Ceiling height : 10 m (IBP I)
9 m (IBP II)
Warehouse specification : warehouse with semi basement, 3 floor office
and parking area
Special specifications : 5 loading dock levelers (IBP I)
10 loading dock levellers (IBP II)
Tenants : DHL, ARK/Ingram, Yokogawa, aCommerce
(warehouse), Bank BNI46, DHL, Mahadasha,
Scan Global (office). Grundfos, DHL, ARK,
MHE-Demag (warehouse), Grundfos, Deraya,
MHE-Demag (office)
58
57
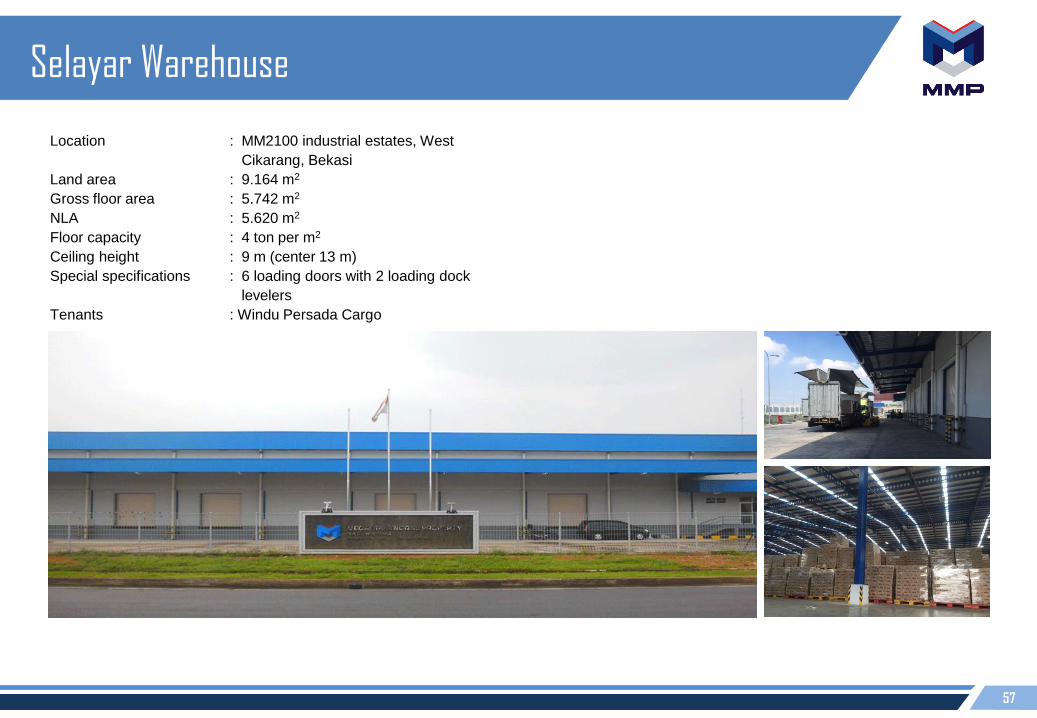
Selayar Warehouse
Location : MM2100 industrial estates, West
Cikarang, Bekasi
Land area : 9.164 m2
Gross floor area : 5.742 m2
NLA : 5.620 m2
Floor capacity : 4 ton per m2
Ceiling height : 9 m (center 13 m)
Special specifications : 6 loading doors with 2 loading dock
levelers
Tenants : Windu Persada Cargo
58
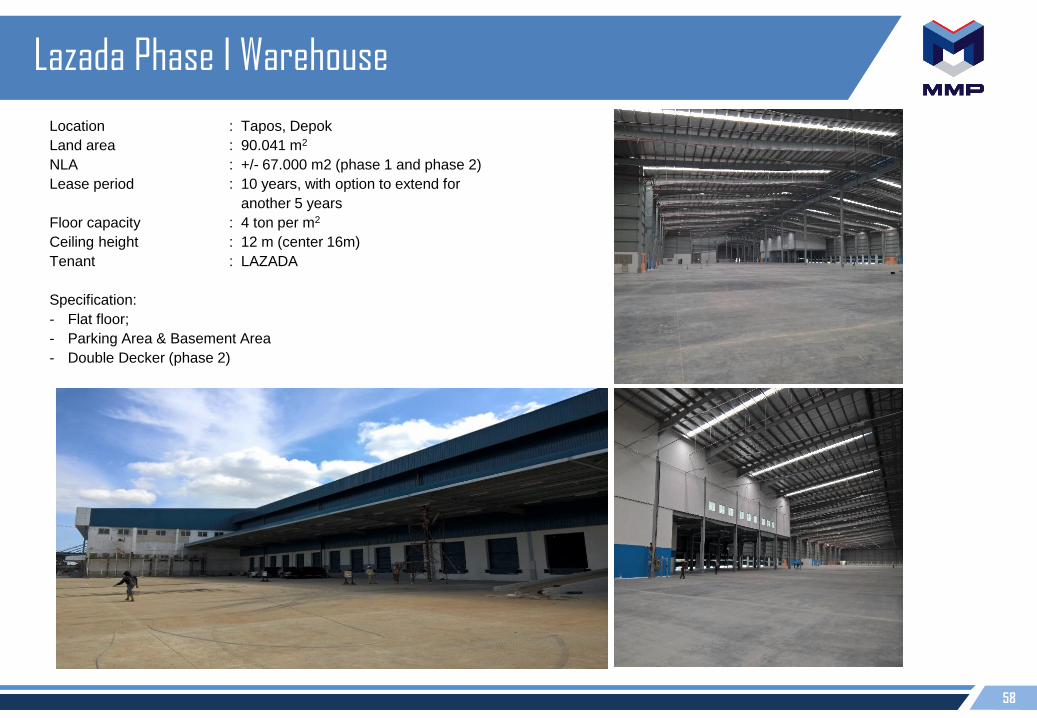
Lazada Phase I Warehouse
Location : Tapos, Depok
Land area : 90.041 m2
NLA : +/- 67.000 m2 (phase 1 and phase 2)
Lease period : 10 years, with option to extend for
another 5 years
Floor capacity : 4 ton per m2
Ceiling height : 12 m (center 16m)
Tenant : LAZADA
Specification:
- Flat floor;
- Parking Area & Basement Area
- Double Decker (phase 2)
59
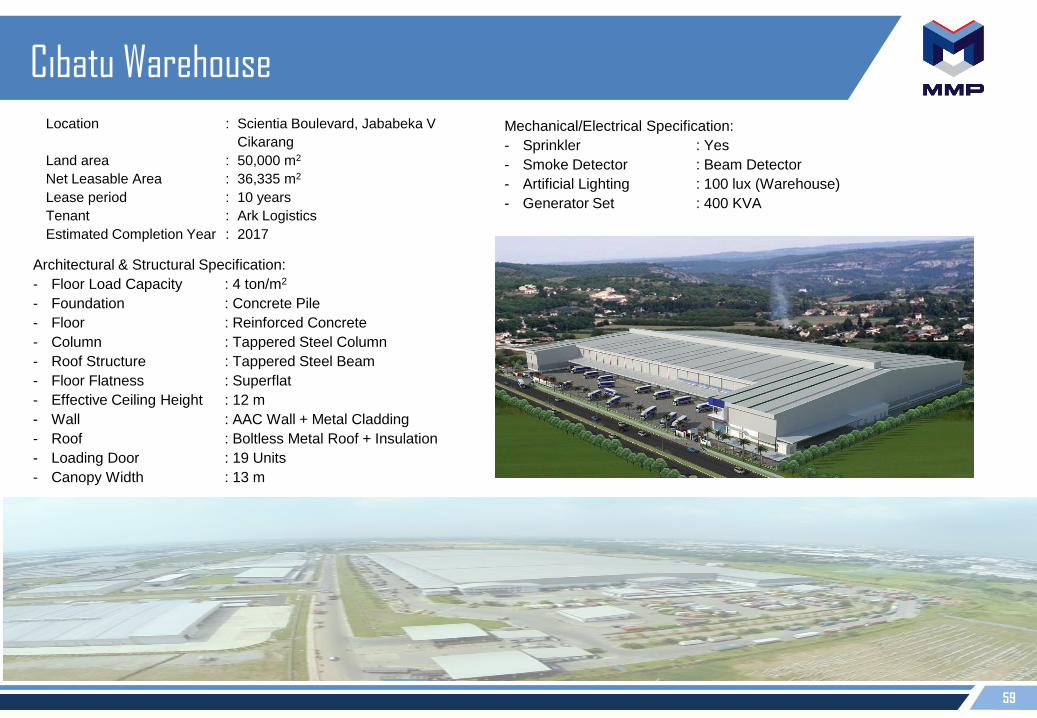
Cibatu Warehouse
Location : Scientia Boulevard, Jababeka V
Cikarang
Land area : 50,000 m2
Net Leasable Area : 36,335 m2
Lease period : 10 years
Tenant : Ark Logistics
Estimated Completion Year : 2017
Architectural & Structural Specification:
- Floor Load Capacity : 4 ton/m2
- Foundation : Concrete Pile
- Floor : Reinforced Concrete
- Column : Tappered Steel Column
- Roof Structure : Tappered Steel Beam
- Floor Flatness : Superflat
- Effective Ceiling Height : 12 m
- Wall : AAC Wall + Metal Cladding
- Roof : Boltless Metal Roof + Insulation
- Loading Door : 19 Units
- Canopy Width : 13 m
Mechanical/Electrical Specification:
- Sprinkler : Yes
- Smoke Detector : Beam Detector
- Artificial Lighting : 100 lux (Warehouse)
- Generator Set : 400 KVA

60
Building value delivering result
From Abandoned Factory In progress to become the largest DC for LAZADA Indonesia
61
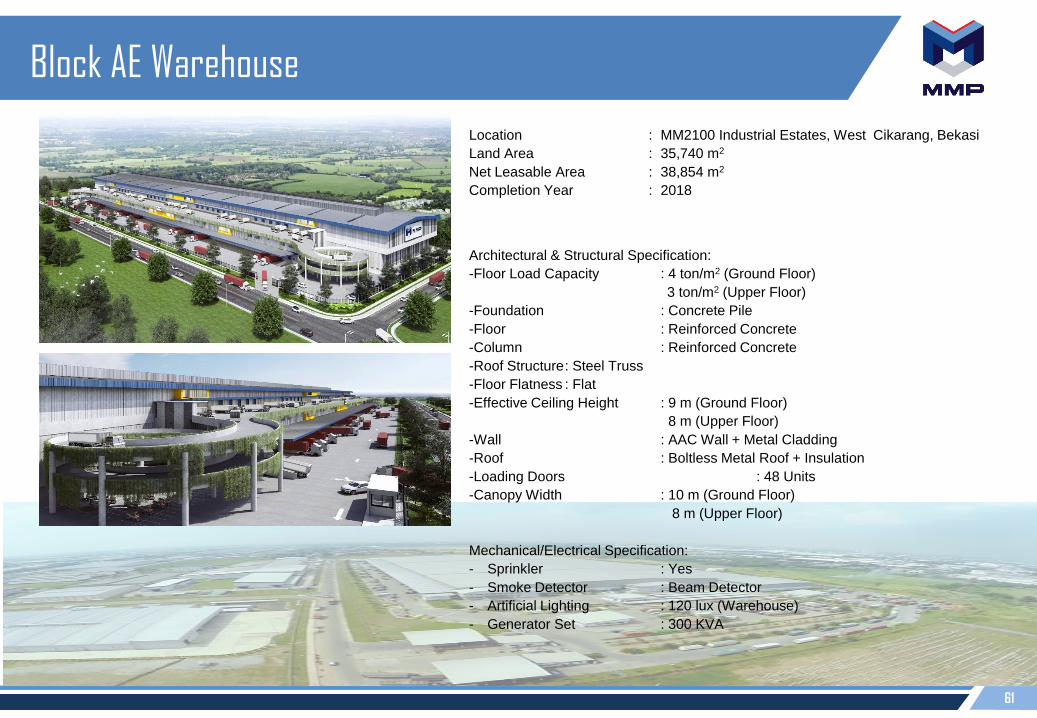
Block AE Warehouse
Location : MM2100 Industrial Estates, West Cikarang, Bekasi
Land Area : 35,740 m2
Net Leasable Area : 38,854 m2
Completion Year : 2018Cawang
Intersection Cikunir
Intersection
MM2100
Industrial Estate
Architectural & Structural Specification:
-Floor Load Capacity : 4 ton/m2 (Ground Floor)
3 ton/m2 (Upper Floor)
-Foundation : Concrete Pile
-Floor : Reinforced Concrete
-Column : Reinforced Concrete
-Roof Structure: Steel Truss
-Floor Flatness : Flat
-Effective Ceiling Height : 9 m (Ground Floor)
8 m (Upper Floor)
-Wall : AAC Wall + Metal Cladding
-Roof : Boltless Metal Roof + Insulation
-Loading Doors : 48 Units
-Canopy Width : 10 m (Ground Floor)
8 m (Upper Floor)
Mechanical/Electrical Specification:
- Sprinkler : Yes
- Smoke Detector : Beam Detector
- Artificial Lighting : 120 lux (Warehouse)
- Generator Set : 300 KVA
62
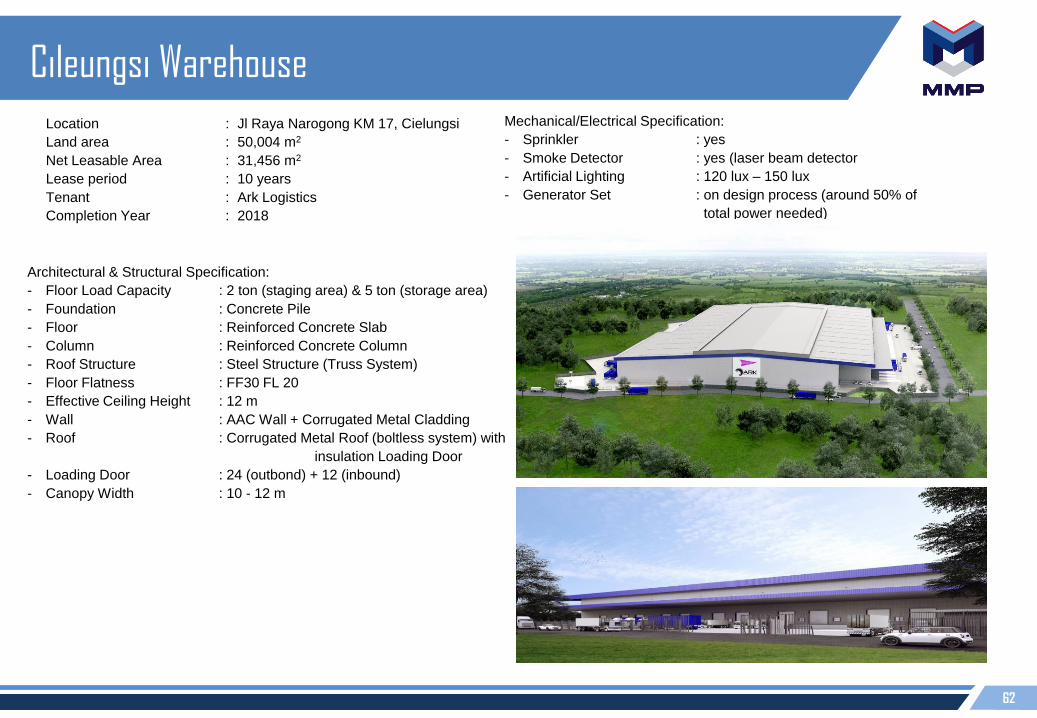
Cileungsi Warehouse
Location : Jl Raya Narogong KM 17, Cielungsi
Land area : 50,004 m2
Net Leasable Area : 31,456 m2
Lease period : 10 years
Tenant : Ark Logistics
Completion Year : 2018
Mechanical/Electrical Specification:
- Sprinkler : yes
- Smoke Detector : yes (laser beam detector
- Artificial Lighting : 120 lux – 150 lux
- Generator Set : on design process (around 50% of
total power needed)
Architectural & Structural Specification:
- Floor Load Capacity : 2 ton (staging area) & 5 ton (storage area)
- Foundation : Concrete Pile
- Floor : Reinforced Concrete Slab
- Column : Reinforced Concrete Column
- Roof Structure : Steel Structure (Truss System)
- Floor Flatness : FF30 FL 20
- Effective Ceiling Height : 12 m
- Wall : AAC Wall + Corrugated Metal Cladding
- Roof : Corrugated Metal Roof (boltless system) with
insulation Loading Door
- Loading Door : 24 (outbond) + 12 (inbound)
- Canopy Width : 10 - 12 m
63
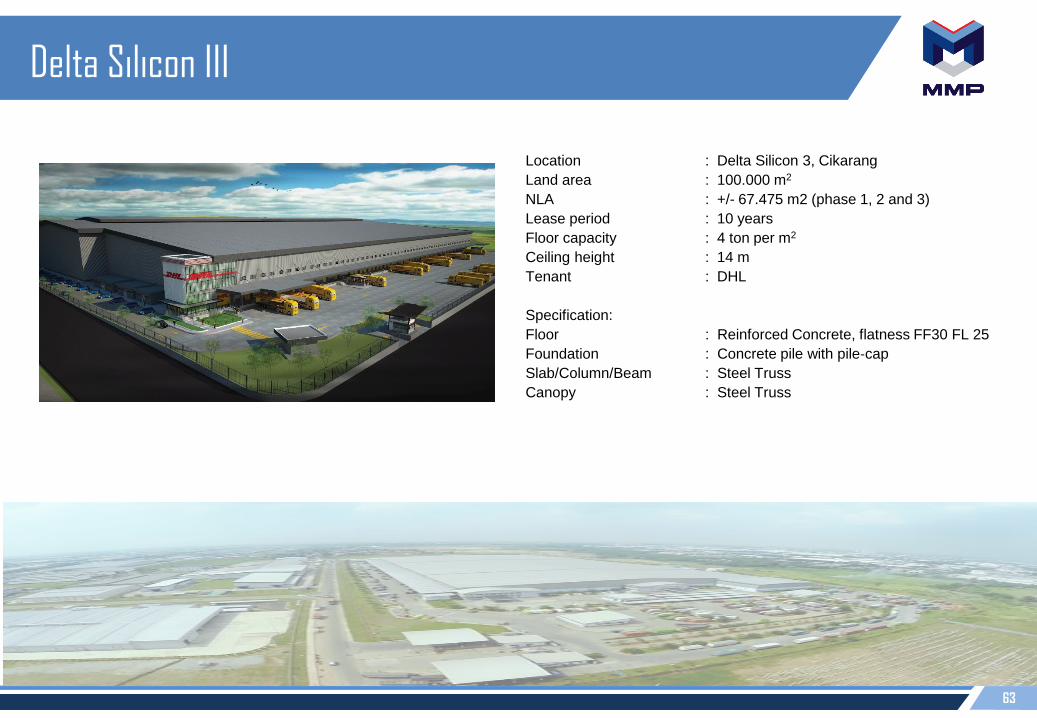
Delta Silicon III
Location : Delta Silicon 3, Cikarang
Land area : 100.000 m2
NLA : +/- 67.475 m2 (phase 1, 2 and 3)
Lease period : 10 years
Floor capacity : 4 ton per m2
Ceiling height : 14 m
Tenant : DHL
Specification:
Floor : Reinforced Concrete, flatness FF30 FL 25
Foundation : Concrete pile with pile‐cap
Slab/Column/Beam : Steel Truss
Canopy : Steel Truss
64
Section 7
Other Financial Info
65
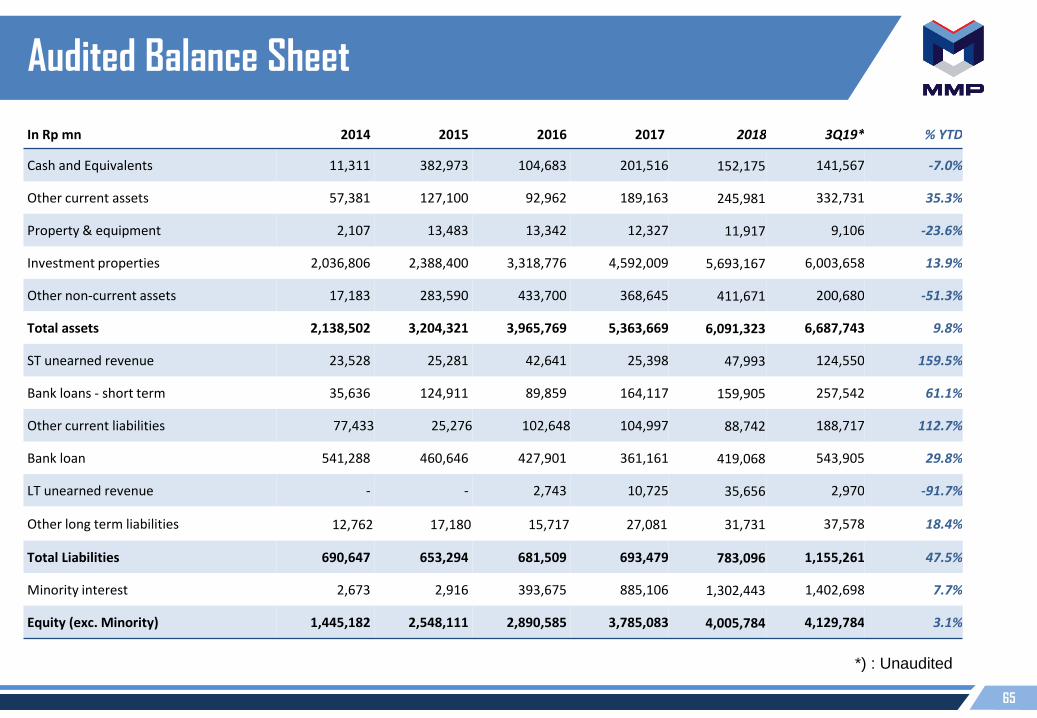
Audited Balance Sheet
In Rp mn 2014 2015 2016 2017 2018 3Q19* % YTD
Cash and Equivalents 11,311 382,973 104,683 201,516 152,175 141,567 -7.0%
Other current assets 57,381 127,100 92,962 189,163 245,981 332,731 35.3%
Property & equipment 2,107 13,483 13,342 12,327 11,917 9,106 -23.6%
Investment properties 2,036,806 2,388,400 3,318,776 4,592,009 5,693,167 6,003,658 13.9%
Other non-current assets 17,183 283,590 433,700 368,645 411,671 200,680 -51.3%
Total assets 2,138,502 3,204,321 3,965,769 5,363,669 6,091,323 6,687,743 9.8%
ST unearned revenue 23,528 25,281 42,641 25,398 47,993 124,550 159.5%
Bank loans - short term 35,636 124,911 89,859 164,117 159,905 257,542 61.1%
Other current liabilities 77,433 25,276 102,648 104,997 88,742 188,717 112.7%
Bank loan 541,288 460,646 427,901 361,161 419,068 543,905 29.8%
LT unearned revenue - - 2,743 10,725 35,656 2,970 -91.7%
Other long term liabilities 12,762 17,180 15,717 27,081 31,731 37,578 18.4%
Total Liabilities 690,647 653,294 681,509 693,479 783,096 1,155,261 47.5%
Minority interest 2,673 2,916 393,675 885,106 1,302,443 1,402,698 7.7%
Equity (exc. Minority) 1,445,182 2,548,111 2,890,585 3,785,083 4,005,784 4,129,784 3.1%
*) : Unaudited

66
Audited Profit and Loss Statement
In Rp mn 2014 2015 2016 2017 2018 3Q '19* 3Q '18 % Y/Y
Revenue 141,918 163,492 175,320 208,794 299,234 245,025 220,134 11.3%
Cost of revenue 13,084 16,059 18,444 20,146 25,396 20,341 18,856 7.9%
Gross profit 128,834 147,432 156,875 188,647 273,838 224,684 201,278 11.6%
G&A 14,616 25,754 39,143 46,202 57,539 20,341 37,352 -45.5%
Operating profit 114,218 121,677 117,732 142,445 216,299 204,343 163,926 24.7%
EBITDA 115,031 122,852 120,756 145,984 220,184 185,858 166,894 11.4%
Net interest income (expense) (42,818) (23,640) (29,262) (47,363) (39,377) (32,442) (27,116) 19.6%
Increase in fair value Invt Prop 261,127 64,787 323,288 217,211 144,270 107,388 - 0.0%
Other items (23,165) 31,822 5,073 (1,272) (668.9) (7,804) (13,157) -40.7%
Profit before tax 309,363 131,003 416,831 314,051 311,325 200,397 123,652 62.1%
Income Tax (14,192) (16,349) (17,624) (20,986) (30,011) (24,594) (22,388) 9.9%
Proforma adjustment (8,482) - - -
Net income (after NCI) 286,404 114,415 342,166 252,262 281,313 123,999 77,425 60.2%
*) : Unaudited
67
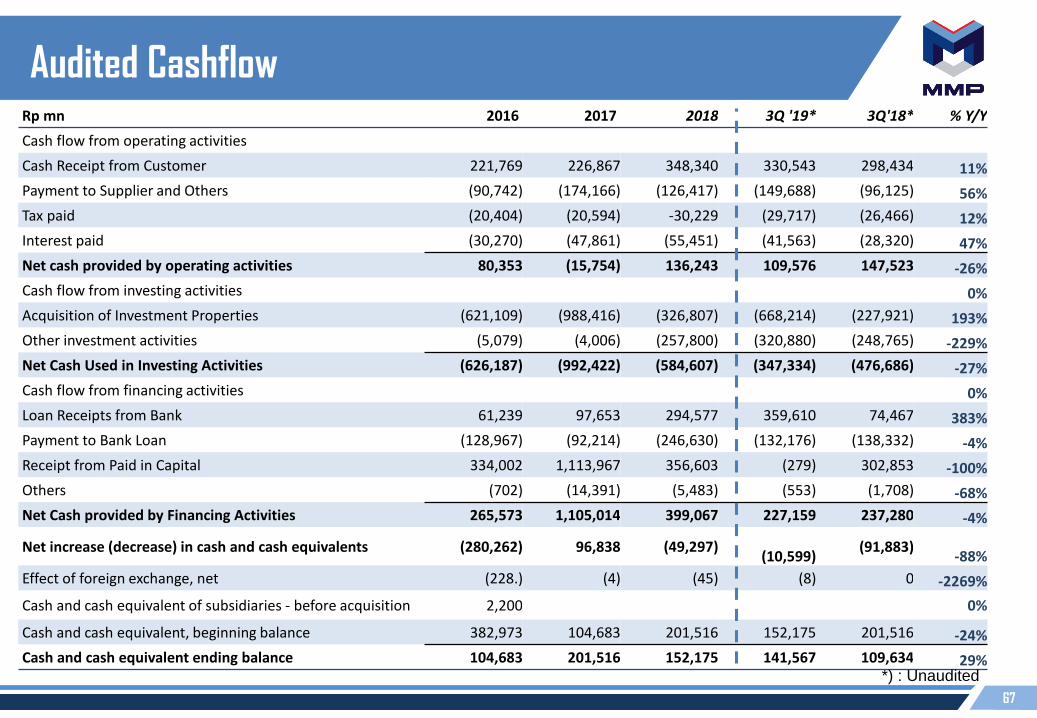
Audited CashflowRp mn 2016 2017 2018 3Q '19* 3Q'18* % Y/Y
Cash flow from operating activities
Cash Receipt from Customer 221,769 226,867 348,340 330,543 298,434 11%
Payment to Supplier and Others (90,742) (174,166) (126,417) (149,688) (96,125) 56%
Tax paid (20,404) (20,594) -30,229 (29,717) (26,466) 12%
Interest paid (30,270) (47,861) (55,451) (41,563) (28,320) 47%
Net cash provided by operating activities 80,353 (15,754) 136,243 109,576 147,523 -26%
Cash flow from investing activities 0%
Acquisition of Investment Properties (621,109) (988,416) (326,807) (668,214) (227,921) 193%
Other investment activities (5,079) (4,006) (257,800) (320,880) (248,765) -229%
Net Cash Used in Investing Activities (626,187) (992,422) (584,607) (347,334) (476,686) -27%
Cash flow from financing activities 0%
Loan Receipts from Bank 61,239 97,653 294,577 359,610 74,467 383%
Payment to Bank Loan (128,967) (92,214) (246,630) (132,176) (138,332) -4%
Receipt from Paid in Capital 334,002 1,113,967 356,603 (279) 302,853 -100%
Others (702) (14,391) (5,483) (553) (1,708) -68%
Net Cash provided by Financing Activities 265,573 1,105,014 399,067 227,159 237,280 -4%
Net increase (decrease) in cash and cash equivalents (280,262) 96,838 (49,297)(10,599)
(91,883)-88%
Effect of foreign exchange, net (228.) (4) (45) (8) 0 -2269%
Cash and cash equivalent of subsidiaries - before acquisition 2,200 0%
Cash and cash equivalent, beginning balance 382,973 104,683 201,516 152,175 201,516 -24%
Cash and cash equivalent ending balance 104,683 201,516 152,175 141,567 109,634 29%*) : Unaudited

68
PT Mega Manunggal Property Tbk