Proximate composition and antioxidant power of bee...
13
83 Agricultural Science Research Journal Vol. 7(3): 83 – 95, March 2017 Available online at http://resjournals.com/journals/agricultural-science-research-journal.html ISSN: 2026 –6073 ©2017 International Research Journals Full Length Research Paper Proximate composition and antioxidant power of bee collected pollen from moist Afromontan forests in southwest Ethiopia Admassu Addi 1 , Ensermu Kelbessa 1 , Teshome Soromessa 2 , Peter Gallmann 3 , Lulsegde Belayhun 4 and, Campos M. G. 5 1 College of Natural Sciences, Department of Plant Biology and Biodiversity Management Addis Ababa University, P. O. Box 3434, Addis Ababa, Ethiopia 2 Center for Environmental Science, Addis Ababa University, and P. O. Box No: 1176, Addis Ababa, Ethiopia 3 Swiss Bee Research Centre, Agrosope Liebefeld, Switzerland 4 Center for insect physiology and Ecology, Addis Ababa, Ethiopia 5 Coimbra Chemistry Center FCT/University of Coimbra and Laboratory of Pharmacognosy, Faculty of Pharmacy, Portugal Abstract Bee pollen is an aggregation of pollen grains from a wide range of botanical sources, which are collected by bees for brood rearing. It is rich in nutritional compounds constituted by carbohydrates, proteins, fats, vitamins and minerals as well as phenol compounds that among other constituents are involved in the antioxidant activity. The aim of this study was to identify the major pollen sources in the southwest of Ethiopia, assess its composition and compare the antioxidant potential, especially in correlation to the total polyphenol content in samples from moist Afromontane forest. The samples were collected using pollen traps. Its composition was analyzed for nutritional composition, phenol and antioxidant activity following the standard methods. Therefore, the content was for moisture, fat, ash and protein was (19.29- 23.07), (2.7-5.8), (1.27±3.47) and(15.87-29.07) % respectively, while vitamin C level was11.3-218.5 mg/kg. The mean minerals composition for iron, copper, phosphorus, calcium, sodium and potassium were 14.76, 0.71, 313.6, 335.8, 502.5, and 369.57 mg/100g respectively. The contents of phenolic compounds for different plant species ranged from 19.52 ± 39.84 mg/100g of Gallicacid equivalent /g pollen. The highest free radical DPPH recorded as 86 and 93.7 % for Datura inóxia and (Vernonia spp and Croton macrostchys) respectively. Conclusively, bee-collected pollen contributes phenolics as apitherapy products with high scavenging activity. This crude material has the start conditions to become an excellent food supplement for humans with important macro and micronutrients that could be taken to contribute for a better supplemented diet, when need be. Keywords: Antioxidant, Polyphenols, Pollen, Proximate composition Introduction Pollen is produced in stamen of flowers of the male gametophyte and collected by the honey bee (Apis mellifera) for feeding its larvae in the early growth stages of worker honeybees. It is collected from a wide range of flowering plants and stored in cells of honeybee combs (Almeida-Muradian et al., 2005). Pollen harvesting is done in a wide range of flowering plants, fulfills their dietary requirements for proteins, lipids, minerals, and vitamins (Winston, 1987). The protein content of pollen is a direct measure of its quality in the diet of the honeybee and it was found that the fresh samples contains high values and it is 100% effective in the development of the hypophrangeal glands of worker honeybees (Haydak,1970; Pernal and Currie 2001). Moreover, it is
Transcript of Proximate composition and antioxidant power of bee...

83
Agricultural Science Research Journal Vol. 7(3): 83 – 95, March 2017 Available online at http://resjournals.com/journals/agricultural-science-research-journal.html ISSN: 2026 –6073 ©2017 International Research Journals
Full Length Research Paper
Proximate composition and antioxidant power of bee
collected pollen from moist Afromontan forests in southwest Ethiopia
Admassu Addi1, Ensermu Kelbessa1, Teshome Soromessa2, Peter Gallmann3, Lulsegde
Belayhun4 and, Campos M. G.5
1College of Natural Sciences, Department of Plant Biology and Biodiversity Management Addis Ababa University, P. O.
Box 3434, Addis Ababa, Ethiopia
2Center for Environmental Science, Addis Ababa University, and P. O. Box No: 1176, Addis Ababa, Ethiopia
3Swiss Bee Research Centre, Agrosope Liebefeld, Switzerland
4Center for insect physiology and Ecology,
Addis Ababa, Ethiopia
5Coimbra Chemistry Center FCT/University of Coimbra and Laboratory of Pharmacognosy, Faculty of Pharmacy, Portugal
Abstract
Bee pollen is an aggregation of pollen grains from a wide range of botanical sources, which are collected by bees for brood rearing. It is rich in nutritional compounds constituted by carbohydrates, proteins, fats, vitamins and minerals as well as phenol compounds that among other constituents are involved in the antioxidant activity. The aim of this study was to identify the major pollen sources in the southwest of Ethiopia, assess its composition and compare the antioxidant potential, especially in correlation to the total polyphenol content in samples from moist Afromontane forest. The samples were collected using pollen traps. Its composition was analyzed for nutritional composition, phenol and antioxidant activity following the standard methods. Therefore, the content was for moisture, fat, ash and protein was (19.29- 23.07), (2.7-5.8), (1.27±3.47) and(15.87-29.07) % respectively, while vitamin C level was11.3-218.5 mg/kg. The mean minerals composition for iron, copper, phosphorus, calcium, sodium and potassium were 14.76, 0.71, 313.6, 335.8, 502.5, and 369.57 mg/100g respectively. The contents of phenolic compounds for different plant species ranged from 19.52 ± 39.84 mg/100g of Gallicacid equivalent /g pollen. The highest free radical DPPH recorded as 86 and 93.7 % for Datura inóxia and (Vernonia spp and Croton macrostchys) respectively. Conclusively, bee-collected pollen contributes phenolics as apitherapy products with high scavenging activity. This crude material has the start conditions to become an excellent food supplement for humans with important macro and micronutrients that could be taken to contribute for a better supplemented diet, when need be. Keywords: Antioxidant, Polyphenols, Pollen, Proximate composition Introduction Pollen is produced in stamen of flowers of the male gametophyte and collected by the honey bee (Apis mellifera) for feeding its larvae in the early growth stages of worker honeybees. It is collected from a wide range of flowering plants and stored in cells of honeybee combs (Almeida-Muradian et al., 2005). Pollen harvesting is done
in a wide range of flowering plants, fulfills their dietary requirements for proteins, lipids, minerals, and vitamins (Winston, 1987). The protein content of pollen is a direct measure of its quality in the diet of the honeybee and it was found that the fresh samples contains high values and it is 100% effective in the development of the hypophrangeal glands of worker honeybees (Haydak,1970; Pernal and Currie 2001). Moreover, it is
84
essential for proper development and function of body tissues, muscles, membranes and glands (Herbert, 1999). The protein levels in bee pollen have been reported in the range of 2.5% to 61% (Odoux et al., 2012; Schmidt et al. 1992 Yang et al., 2013).
Pollen is also a rich source of carbohydrates and lipids, including unsaturated fatty acids, and vitamins. Moreover bee pollen comprises various minerals such as sodium, potassium, magnesium, calcium, phosphorus, iron, copper and zinc that support physiological activities in honeybees and as well as in humans. Apart from its nutrition value, is composed of considerable units of polyphenolic compounds, primarily flavonoids, which may act as potent antioxidants (Kroyer et al. 2001). The flavonoids are secondary plant compounds which have different physiological and pharmacological functions including antioxidant, anti-aging, anti-carcinogen, anti-inflammatory, cardio protective and they improve the endothelial function (Bogdanov, 2016). The powerful anti-oxidative properties of polyphenols result from the presence of double bonds on the aromatic ring of hydroxyl and carboxyl groups. This allow them to scavenge reactive oxygen species (ROS) and inactivate organic radicals, which catalyze oxidation reactions (Kroyer and,Hegedus 2001); Budryn, and Nebesny, 2006). From a long time ago that research findings demonstrated that polyphenols, in general, have an ideal chemical structure for scavenging free radicals which makes them effective antioxidants. In practical application tests, pollen has been added to diets for domestic animals and laboratory insects with improvements of growth, general health and food conversion rates (Crane, 1990; Schmidt and Buchman, 1992).
Due to the growing interest of pollen as nutritional and api-therapeutic substance, involves the identification of major pollen source plants used by bees and the evaluation of their quality as paramount for promoting this product as food supplement are required to improve health. Ethiopia has the great potential for production of great quantity and quality of pollen since the country is endowed with great diversity of flora and high population density of Apis mellifera which creates suitable conditions for collecting of pollen all year-round. Bee pollen antioxidant activity as studied in Brazil (Morais etal 2011,
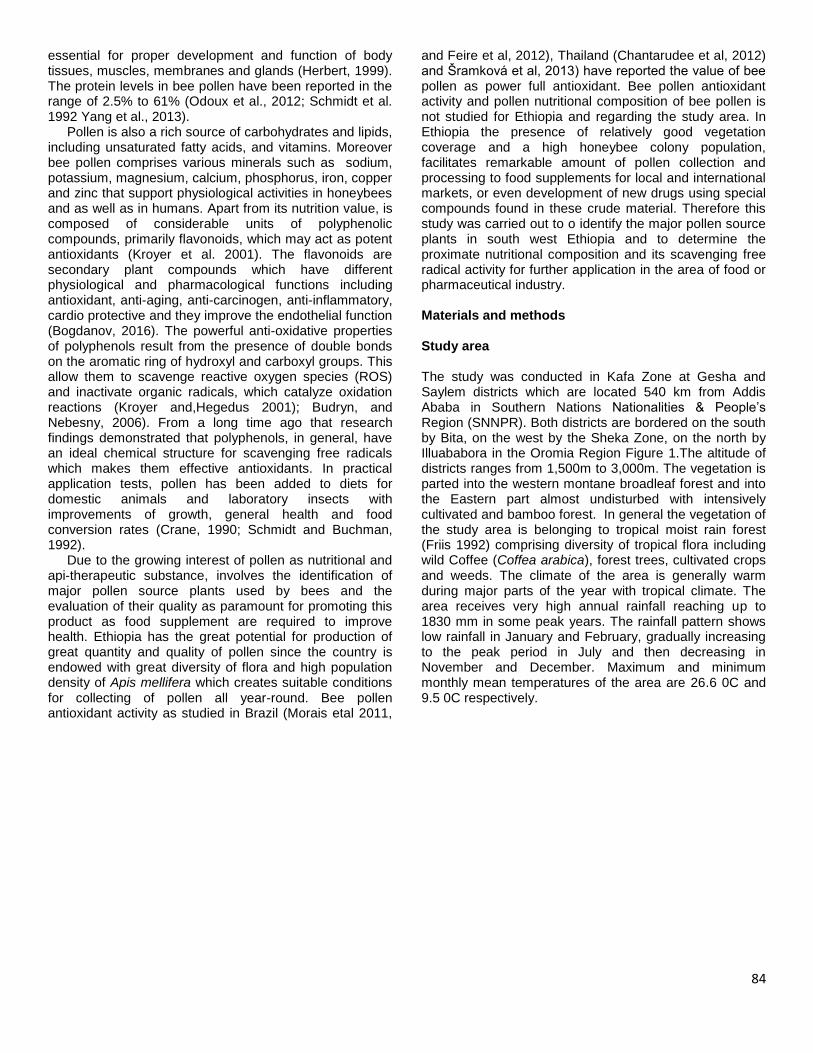
and Feire et al, 2012), Thailand (Chantarudee et al, 2012) and Šramková et al, 2013) have reported the value of bee pollen as power full antioxidant. Bee pollen antioxidant activity and pollen nutritional composition of bee pollen is not studied for Ethiopia and regarding the study area. In Ethiopia the presence of relatively good vegetation coverage and a high honeybee colony population, facilitates remarkable amount of pollen collection and processing to food supplements for local and international markets, or even development of new drugs using special compounds found in these crude material. Therefore this study was carried out to o identify the major pollen source plants in south west Ethiopia and to determine the proximate nutritional composition and its scavenging free radical activity for further application in the area of food or pharmaceutical industry. Materials and methods Study area The study was conducted in Kafa Zone at Gesha and Saylem districts which are located 540 km from Addis Ababa in Southern Nations Nationalities & People’s Region (SNNPR). Both districts are bordered on the south by Bita, on the west by the Sheka Zone, on the north by Illuababora in the Oromia Region Figure 1.The altitude of districts ranges from 1,500m to 3,000m. The vegetation is parted into the western montane broadleaf forest and into the Eastern part almost undisturbed with intensively cultivated and bamboo forest. In general the vegetation of the study area is belonging to tropical moist rain forest (Friis 1992) comprising diversity of tropical flora including wild Coffee (Coffea arabica), forest trees, cultivated crops and weeds. The climate of the area is generally warm during major parts of the year with tropical climate. The area receives very high annual rainfall reaching up to 1830 mm in some peak years. The rainfall pattern shows low rainfall in January and February, gradually increasing to the peak period in July and then decreasing in November and December. Maximum and minimum monthly mean temperatures of the area are 26.6 0C and 9.5 0C respectively.

85
Figure 1: Location Map of the study area
Pollen collection Pollen loads were collected for 12 months period from (September 2014 up to September 2015) using the pollen traps having 16% pollen trapping efficiency which was fitted at the entrance of beehives. The pollen samples were removed from the hind legs of honeybees and scraped off into tray. The pollen pellets were collected from tray and placed in clean paper bag and left for 24 hours to dry at room temperature. After drying, they were sorted on basis of color and identified to the genus or species level. A total of 307 samples of bee pollen loads were collected and stored in the freezers at 2.5
oC -
13.74oC for further analysis.
Identification of the main plant taxa available in the region Pollen pellets were collected, weighed, and dried overnight at room temperature and then sorted by color and size. Representative pellets of each color were washed with ether and mounted on glycerin jelly for microscopic examination. To identify the pollen pellets collected by the honeybees, a sample of ripe pollen grains were collected from mature flower buds directly from the field and flower samples were kept in individual envelopes to avoid contamination with the pollen grains of other species. The ripe pollen grains were shaken directly onto microscopic slides. The fat content was washed out using ether to enhance the transparency of pollen grains. The slides were covered with a cover slip and examined under a light microscope having 400 x magnifications. Pollen morphological analysis was made using light microscope (Zeiss, 2010)) linked with computer soft ware for taking pollen picture as shown in Figure 2.

86
Figure 2: Pollen grain morphology identified from pollen trap
Physico-chemical analysis Moisture content Moisture content was determined as suggested by (Ranganna 1977). Briefly 2g of each bee pollen sample was weighed and placed into dishes and dried in the oven for 3 hours at 105 0C. The dishes were cooled to room temperature in the desiccators and reweighted. Ash determination About 2 g of each bee pollen sample were placed in a quartz crucible and be ashen in a muffle furnace at 550°C for 5 hours. After they were removed from the muffle and cooled down in the desiccators and weighed. Previously dishes were placed on hot plate under a fume hood and the temperature was slowly increased until the smoking ceases and the sample became thoroughly charred. The
amount of the total ash was calculated by using the following formula (AOAC, 2000). % Ash = (M3 - M1)*100 M2 - M1 Where, m1= mass of crucible m2= sample mass with crucible m3 = final mass with crucible Determination of Crude protein The total Nitrogen content was determined by the Kjeldahl method (AOAC, 2000). Briefly 1 g of bee pollen sample was heated the with 20 mL of sulfuric acid (95– 97 %) at the presence of a catalyst (potassium sulphate, copper sulphate) for about 4 h until the solution becomes clear and blue-green in color. Then it was neutralized with 90 mL NaOH (30 %). The ammonia produced was distilled and collected in boric acid solution and later tittered with

87
standard solution of hydrochloric acid (Zenebon and Pascuet, 2005). For the conversion of nitrogen levels to protein the factor NX 6.25 was used. Determination of crude fat content Crude fat was determined by exhaustively extracting a 2 g of sample in diethyl ether (boiling point, 55
oC) in a Soxhlet
extractor. The ether was evaporated from the extraction flask. The amount of fat was quantified gravimetrically and calculated from the difference in weight of the extraction flask before and after extraction as percentage. The extraction flask were cleaned and dried in a drying-oven at 70
0C for 1 hour, cooled in a desiccator for 30 minutes and
then weighed(AOAC, 2003). About 2 mg of pollen were added into extraction thimbles and then covered with about 2 cm layer of fat free cotton. The cooling water was switched on and a 50 mL diethyl ether was added to extraction flask through condenser. The cooling water was switched on and a 50mL diethyl ether was added to extraction flask through condenser. % Fat content = (W2-W1) X100/W Where: W = weight of fat; W2=weight of extraction flask after exaction; W1= weight of flask before extraction; W0 of fresh sample Determination of mineral content Ash content was obtained from dry incinerating of the samples (AOAC, 2005).The ashes were wetted completely with 5 mL of HCL 6 N and dried on a low temperature on hot plate until the solution just boiled. The ash solution was cooled to room temperature in a hood and filtered using the filter paper. A 5 mL of HCL 3N was added into each crucible dishes and heated until the solution boiled and then cooled down and filtered into the flask. The crucible dishes were again washed three times with de-ionized water filtered into the flask. Then the solution was cooled and diluted to 50 mL with de-ionized water. A blank was prepared by taking the same procedure as the sample. Determination of Phosphorus Phosphorus was determined using the molybdovanadate method (AOAC, 1990). Briefly, 5 mL were measured from the sample digested for protein determination and placed in a 100 mL volumetric flask. 10mL of the molybdate and vanadate solution were added to the samples. After 10-30 minutes the color developed was measured at 460 nm wavelength in spectrophotometer. Data from the absorbance of the blank, sample and standard were used to calculate phosphorus content using the following formula:
P (ppm) = (c1*v1*v2* mcf) S*A Where: c1 = P concentration in sample digest read from the Curve, ppm. V1 = volume of the digest V2 = volume of the dilution S = weight of the pollen calcined in g A = Aliquot Determination of minerals Determination of Fe,,Na,Ca, were determined by( AOAC 2000) using microwave assisted acid digestion and quantization. Atomic absorption spectrometry was used to read the absorbance at selected wave length. Mineral content of the sample was read from relevant calibration curve Mineral content mg/100gm= [ (a-b) *V] 10*w Where W= weight (gm) of sample V=50ml= volume of extract a= concentration (µg/ml) of sample solution b= Concentration (µg/ml) of blank solution Determination of Vitamin C Vitamin C determination was carried by following the standard procedure of Vitamin Assay, 1966 and Manual for Nutrition Surveys (1963). About 5gm of pollen samples were grinded in mortar and extracted with 100ml of 6% of TCA and the solution was centrifuged. Then 1-2 drops of saturated Bromine reagent was added to the samples in a conical flask. About 10ml aliquot was taken and added with 2% thiourea and from this solution 4ml was pipptted into test tubes and 1ml of 2, 4-DNPH was added in remaining test tubes. All the test tubes put in water bath at 370Cfor 3 hour and cool in an ice bath for approximately for 5 min. About 5ml 85%H2SO4 was added slowly while the tubes are in an ice bath. 1ml of 2%DNPH was added to the blank and then all tubes are shaked and the absorbance was read at 515 nm. The Vitamin C content was calculated following formula mg AA/100g = [(As-Ab)*10]/[A10µg Std-Ab] Where: As Absorbance of samples Ab Absorbance of blank A10 µg Std. Absorbance of 10 µg AA standard Determination of Radical scavenging activity Preparation of pollen extract A two grams of dried pollen powder was extracted by stirring with 25 mL of methanol and 25 mL of distilled water and placed at 25
0C for 60 min maceration using
temperature shaker incubator (ZHWY-103B) and then filtered through Whatman N.º 4 paper. The residue was
88
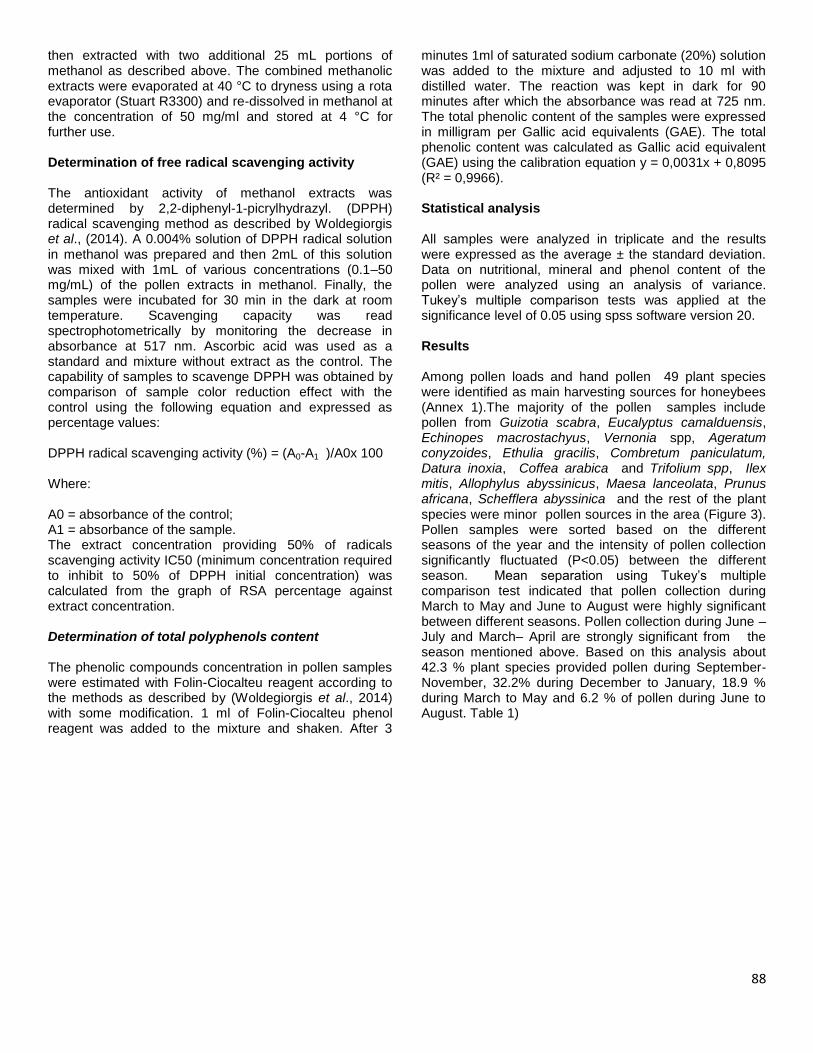
then extracted with two additional 25 mL portions of methanol as described above. The combined methanolic extracts were evaporated at 40 °C to dryness using a rota evaporator (Stuart R3300) and re-dissolved in methanol at the concentration of 50 mg/ml and stored at 4 °C for further use. Determination of free radical scavenging activity The antioxidant activity of methanol extracts was determined by 2,2-diphenyl-1-picrylhydrazyl. (DPPH) radical scavenging method as described by Woldegiorgis et al., (2014). A 0.004% solution of DPPH radical solution in methanol was prepared and then 2mL of this solution was mixed with 1mL of various concentrations (0.1–50 mg/mL) of the pollen extracts in methanol. Finally, the samples were incubated for 30 min in the dark at room temperature. Scavenging capacity was read spectrophotometrically by monitoring the decrease in absorbance at 517 nm. Ascorbic acid was used as a standard and mixture without extract as the control. The capability of samples to scavenge DPPH was obtained by comparison of sample color reduction effect with the control using the following equation and expressed as percentage values: DPPH radical scavenging activity (%) = (A0-A1 )/A0x 100 Where: A0 = absorbance of the control; A1 = absorbance of the sample. The extract concentration providing 50% of radicals scavenging activity IC50 (minimum concentration required to inhibit to 50% of DPPH initial concentration) was calculated from the graph of RSA percentage against extract concentration. Determination of total polyphenols content The phenolic compounds concentration in pollen samples were estimated with Folin-Ciocalteu reagent according to the methods as described by (Woldegiorgis et al., 2014) with some modification. 1 ml of Folin-Ciocalteu phenol reagent was added to the mixture and shaken. After 3
minutes 1ml of saturated sodium carbonate (20%) solution was added to the mixture and adjusted to 10 ml with distilled water. The reaction was kept in dark for 90 minutes after which the absorbance was read at 725 nm. The total phenolic content of the samples were expressed in milligram per Gallic acid equivalents (GAE). The total phenolic content was calculated as Gallic acid equivalent (GAE) using the calibration equation y = 0,0031x + 0,8095 (R² = 0,9966). Statistical analysis All samples were analyzed in triplicate and the results were expressed as the average ± the standard deviation. Data on nutritional, mineral and phenol content of the pollen were analyzed using an analysis of variance. Tukey’s multiple comparison tests was applied at the significance level of 0.05 using spss software version 20. Results Among pollen loads and hand pollen 49 plant species were identified as main harvesting sources for honeybees (Annex 1).The majority of the pollen samples include pollen from Guizotia scabra, Eucalyptus camalduensis, Echinopes macrostachyus, Vernonia spp, Ageratum conyzoides, Ethulia gracilis, Combretum paniculatum, Datura inoxia, Coffea arabica and Trifolium spp, Ilex mitis, Allophylus abyssinicus, Maesa lanceolata, Prunus africana, Schefflera abyssinica and the rest of the plant species were minor pollen sources in the area (Figure 3). Pollen samples were sorted based on the different seasons of the year and the intensity of pollen collection significantly fluctuated (P<0.05) between the different season. Mean separation using Tukey’s multiple comparison test indicated that pollen collection during March to May and June to August were highly significant between different seasons. Pollen collection during June –July and March– April are strongly significant from the season mentioned above. Based on this analysis about 42.3 % plant species provided pollen during September-November, 32.2% during December to January, 18.9 % during March to May and 6.2 % of pollen during June to August. Table 1)

89
Figure 3: The major pollen source plants identified from the collection with pollen traps.
Table 1: Seasonal availability of pollen yield for Apis mellifera of Ethiopia
Season mean SD Min Max
September-November 389.3a 30.5
359.00 420
Decmber - Feburary 282b 27.78 2160.50.0 300
March-May 171.3c 10.26 160.00 1800
June-August 63.2d 5.83 59.80 70
Values with different letters are significantly different (P<0.05).
Proximate composition Moisture The moisture content of bee pollen ranges from 19.29% in Combretum paniculatum to 23.07% in Vernonia amygdalina. These values are in line within the accepted ranges of 20-30% according to pollen composition and standardization of analytical methods set for Brazil national pollen (Campos et al., 2008). The analysis of proximate composition of different pollen source plants is shown in Table 2. The analysis of variance showed that there was no significance difference (P>0.05) for most plant species for moisture content however Vernonia spp is significantly from the rest of the species with mean moisture content of (24.95) .The analyized moisture content of bee pollen ranges from 19.29–24.95%. The highest moisture content was recorded for Vernonia spp (24.95 %) and the lowest for Combretumpaniculatum (19.29 %) Table 2. These values are in line within the accepted ranges of 20-30 % moisture according to pollen composition and standardization of analytical methods (Campos et al., 2008).The moisture content of pollen is affected by climatic condition of the area. The
Vernoniaamygdalina pollen collectedfrom higher rainfall area (23.07%) has higher moisture when compared to mid altitude area of Chora-Boter-Becho in Jimma zone, of southwest Ethiopia. Total Protein content The protein content of the pollen for different plant species were significantly different. The protein content of the pollen of different species are significantly different ( P<0.05) among the plant species. The protein content of Echinopes macrostachyus, Croton macrostachus and Vernoinly spp were significantly different from most species with mean protein content of 16.16, 16.76 and 19.20 . The protein content of Glycine weighti and combretum paniculatum strongly sigficant from the rest of pollen source plants with mean protein content of 27.18 and 29.09 respecteively. The total protein content of pollen samples ranged from 15.04 - 27.09 % with the lowest values for Ageratum conyzoides (15.04 %) and the highest for Combretumpaniculatum (27.09 %).
0
50
100
150
200
250
300
Po
llen
yie
ld in
(g)
Plant species
90
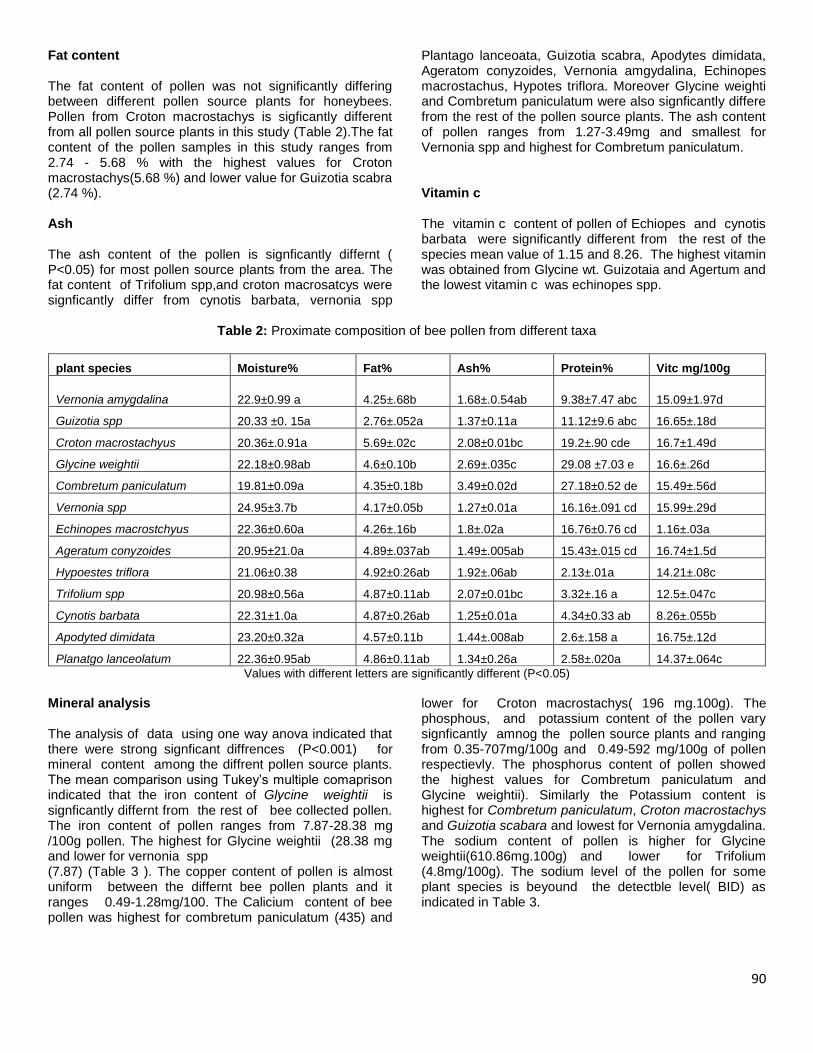
Fat content The fat content of pollen was not significantly differing between different pollen source plants for honeybees. Pollen from Croton macrostachys is sigficantly different from all pollen source plants in this study (Table 2).The fat content of the pollen samples in this study ranges from 2.74 - 5.68 % with the highest values for Croton macrostachys(5.68 %) and lower value for Guizotia scabra (2.74 %). Ash The ash content of the pollen is signficantly differnt ( P<0.05) for most pollen source plants from the area. The fat content of Trifolium spp,and croton macrosatcys were signficantly differ from cynotis barbata, vernonia spp
Plantago lanceoata, Guizotia scabra, Apodytes dimidata, Ageratom conyzoides, Vernonia amgydalina, Echinopes macrostachus, Hypotes triflora. Moreover Glycine weighti and Combretum paniculatum were also signficantly differe from the rest of the pollen source plants. The ash content of pollen ranges from 1.27-3.49mg and smallest for Vernonia spp and highest for Combretum paniculatum. Vitamin c The vitamin c content of pollen of Echiopes and cynotis barbata were significantly different from the rest of the species mean value of 1.15 and 8.26. The highest vitamin was obtained from Glycine wt. Guizotaia and Agertum and the lowest vitamin c was echinopes spp.
Table 2: Proximate composition of bee pollen from different taxa
plant species Moisture% Fat% Ash% Protein% Vitc mg/100g
Vernonia amygdalina 22.9±0.99 a 4.25±.68b 1.68±.0.54ab 9.38±7.47 abc 15.09±1.97d
Guizotia spp 20.33 ±0. 15a 2.76±.052a 1.37±0.11a 11.12±9.6 abc 16.65±.18d
Croton macrostachyus 20.36±.0.91a 5.69±.02c 2.08±0.01bc 19.2±.90 cde 16.7±1.49d
Glycine weightii 22.18±0.98ab 4.6±0.10b 2.69±.035c 29.08 ±7.03 e 16.6±.26d
Combretum paniculatum 19.81±0.09a 4.35±0.18b 3.49±0.02d 27.18±0.52 de 15.49±.56d
Vernonia spp 24.95±3.7b 4.17±0.05b 1.27±0.01a 16.16±.091 cd 15.99±.29d
Echinopes macrostchyus 22.36±0.60a 4.26±.16b 1.8±.02a 16.76±0.76 cd 1.16±.03a
Ageratum conyzoides 20.95±21.0a 4.89±.037ab 1.49±.005ab 15.43±.015 cd 16.74±1.5d
Hypoestes triflora 21.06±0.38 4.92±0.26ab 1.92±.06ab 2.13±.01a 14.21±.08c
Trifolium spp 20.98±0.56a 4.87±0.11ab 2.07±0.01bc 3.32±.16 a 12.5±.047c
Cynotis barbata 22.31±1.0a 4.87±0.26ab 1.25±0.01a 4.34±0.33 ab 8.26±.055b
Apodyted dimidata 23.20±0.32a 4.57±0.11b 1.44±.008ab 2.6±.158 a 16.75±.12d
Planatgo lanceolatum 22.36±0.95ab 4.86±0.11ab 1.34±0.26a 2.58±.020a 14.37±.064c
Values with different letters are significantly different (P<0.05)
Mineral analysis The analysis of data using one way anova indicated that there were strong signficant diffrences (P<0.001) for mineral content among the diffrent pollen source plants. The mean comparison using Tukey’s multiple comaprison indicated that the iron content of Glycine weightii is signficantly differnt from the rest of bee collected pollen. The iron content of pollen ranges from 7.87-28.38 mg /100g pollen. The highest for Glycine weightii (28.38 mg and lower for vernonia spp (7.87) (Table 3 ). The copper content of pollen is almost uniform between the differnt bee pollen plants and it ranges 0.49-1.28mg/100. The Calicium content of bee pollen was highest for combretum paniculatum (435) and
lower for Croton macrostachys( 196 mg.100g). The phosphous, and potassium content of the pollen vary signficantly amnog the pollen source plants and ranging from 0.35-707mg/100g and 0.49-592 mg/100g of pollen respectievly. The phosphorus content of pollen showed the highest values for Combretum paniculatum and Glycine weightii). Similarly the Potassium content is highest for Combretum paniculatum, Croton macrostachys and Guizotia scabara and lowest for Vernonia amygdalina. The sodium content of pollen is higher for Glycine weightii(610.86mg.100g) and lower for Trifolium (4.8mg/100g). The sodium level of the pollen for some plant species is beyound the detectble level( BID) as indicated in Table 3.
91
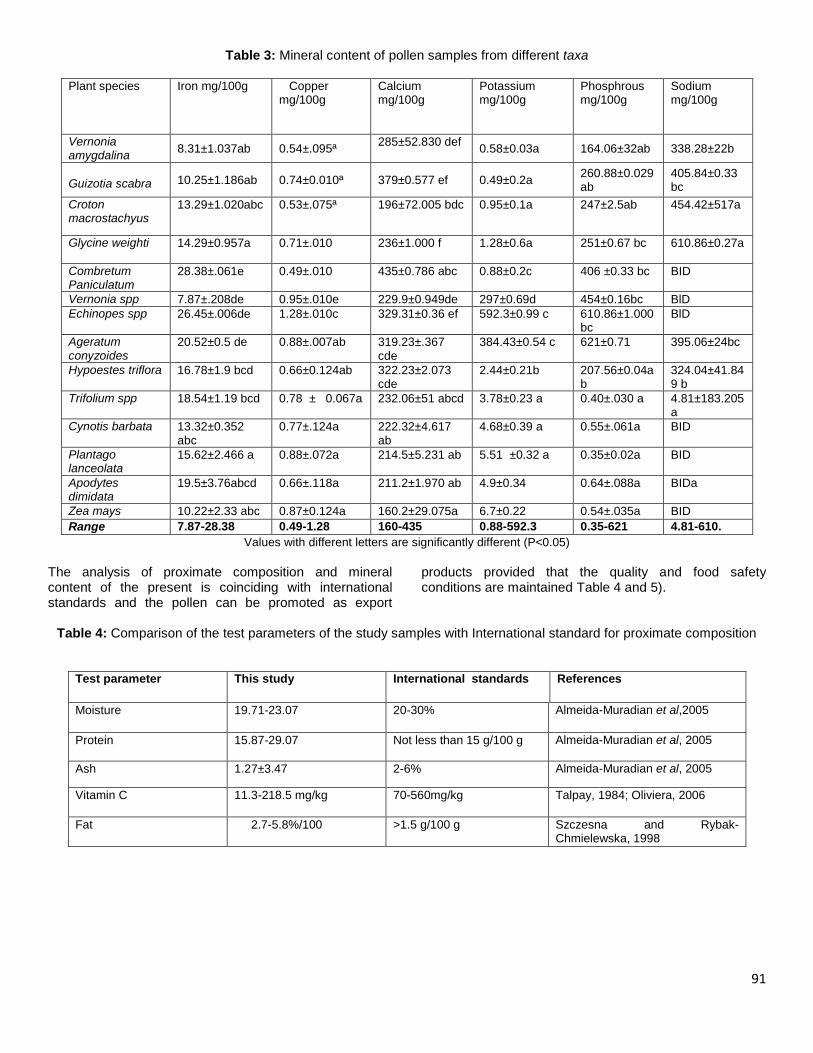
Table 3: Mineral content of pollen samples from different taxa
Plant species Iron mg/100g
Copper mg/100g
Calcium mg/100g
Potassium mg/100g
Phosphrous mg/100g
Sodium mg/100g
Vernonia amygdalina
8.31±1.037ab 0.54±.095ª 285±52.830 def
0.58±0.03a 164.06±32ab 338.28±22b
Guizotia scabra 10.25±1.186ab 0.74±0.010ª 379±0.577 ef 0.49±0.2a
260.88±0.029ab
405.84±0.33 bc
Croton macrostachyus
13.29±1.020abc 0.53±.075ª 196±72.005 bdc 0.95±0.1a 247±2.5ab 454.42±517a
Glycine weighti 14.29±0.957a 0.71±.010 236±1.000 f
1.28±0.6a 251±0.67 bc 610.86±0.27a
Combretum Paniculatum
28.38±.061e 0.49±.010 435±0.786 abc 0.88±0.2c 406 ±0.33 bc BID
Vernonia spp 7.87±.208de 0.95±.010e 229.9±0.949de 297±0.69d 454±0.16bc BlD
Echinopes spp 26.45±.006de 1.28±.010c 329.31±0.36 ef
592.3±0.99 c
610.86±1.000bc
BlD
Ageratum conyzoides
20.52±0.5 de 0.88±.007ab 319.23±.367 cde
384.43±0.54 c 621±0.71 395.06±24bc
Hypoestes triflora 16.78±1.9 bcd 0.66±0.124ab 322.23±2.073 cde
2.44±0.21b 207.56±0.04ab
324.04±41.849 b
Trifolium spp 18.54±1.19 bcd 0.78 ± 0.067a 232.06±51 abcd 3.78±0.23 a 0.40±.030 a 4.81±183.205a
Cynotis barbata 13.32±0.352 abc
0.77±.124a 222.32±4.617 ab
4.68±0.39 a
0.55±.061a BID
Plantago lanceolata
15.62±2.466 a 0.88±.072a 214.5±5.231 ab 5.51 ±0.32 a 0.35±0.02a BID
Apodytes dimidata
19.5±3.76abcd 0.66±.118a 211.2±1.970 ab 4.9±0.34 0.64±.088a BIDa
Zea mays 10.22±2.33 abc 0.87±0.124a 160.2±29.075a 6.7±0.22 0.54±.035a BID
Range 7.87-28.38 0.49-1.28 160-435 0.88-592.3 0.35-621 4.81-610.
Values with different letters are significantly different (P<0.05)
The analysis of proximate composition and mineral content of the present is coinciding with international standards and the pollen can be promoted as export
products provided that the quality and food safety conditions are maintained Table 4 and 5).
Table 4: Comparison of the test parameters of the study samples with International standard for proximate composition
Test parameter This study International standards References
Moisture 19.71-23.07 20-30% Almeida-Muradian et al,2005
Protein 15.87-29.07 Not less than 15 g/100 g Almeida-Muradian et al, 2005
Ash 1.27±3.47 2-6% Almeida-Muradian et al, 2005
Vitamin C 11.3-218.5 mg/kg 70-560mg/kg Talpay, 1984; Oliviera, 2006
Fat 2.7-5.8%/100 >1.5 g/100 g Szczesna and Rybak-Chmielewska, 1998
92
Table 5: Comparative study of mineral content of pollen samples with International standards
Test parameters This study International
standards References
Iron mg/100g 0.-28.38 11-170 Almeida-Muradian et al, 2005
Copper mg/100g 0.44-1.28 2-16 Almeida-Muradian et al, 2005
Calcium mg/100g 196-435 200-3000 Almeida-Muradian et al, 2005
Potassium mg/100g 4.4-5920mg/kg 4000-20000 Talpay, 1984; Oliviera, 2006
Phosphrous mg/100g 3.4-4100 800-6000 Szczesna and Rybak-Chmielewska, 1998
Sodium mg/100g 4.81-610 ND ND (not dectable)
Total phenolic and Vitamin C content and free radical scavenging activity Total phenolic content was expressed as milligrams of Gallic acid equivalent (GAE) per gram (mg/gm) of the pollen samples and the Free radical scavenging activity expressed in %. The data is shown together in Table 5 to simplify the approach in the discussion. The total phenolic content in the taxa analyzed ranges 19.52 - 39.84 mg/GAE (Gallic acid equivalents). There was no significant variation for total phenolic content among the pollen source plants. Relatively the higher polyphenol content was recorded for Zea mays, Guizotia spp, Vernonia amaygdalina, Croton macrostachyus and Datura
inoxia. The lowest was determined in Echinopes spp, Ageratum conyzoides, Combretum paniculatum, and Trifloium spp. The percentage of DPPH radical scavenging capacity of the analysed pollen samples was significantly different (P<0.05) between different pollen source plants (Table 6). The antioxidant power of Plantago lanceolata, Eucalyptus spp, Vernonia spp, Trifoilumspp and Zea mays were significantly different from remaining bee pollen and relatively higher radical scavenging power were 98, 93.3, 98, 93 and 89 % respectively). The lower values were recorded for Echinopes spp, Ageratum conyzoides, Combretum paniclutum, and Plantago lanceolatum.
Table 6: Percent yield for Free radical Scavenging activity and total phenolic content of pollen samples
Plant species Phenolic content (mg GAE/g)
DPPH (EC50) %
Vernonia amygdalina 35.65 ±0.44i 93.7±0.121c
Croton macrostchys 23.06 ±.44c 93.7±0.10c
Guizotia spp 38.87 ±0.24 88±1.0ab
Bidens spp 19.52 ±0.95a 89±1.0b
Ageratum conyzoides 24.03 ±06c 88±1.5ab
Plantago lanceolata 20.81 ±.06b 89±.57b
Trifolium spp 24.35 ±0.05ef 88±1.0b
Datura inoxia 26.29 ±0.080 86±1.0a
Zea mays 39.84 ±0.06i 89±0.57b
Eucalyptus spp 25.00 ±0.07f 93±1.0c
Values in a row with different letters are significantly different (P<0.05)
Discussion Main floral sources collected Pollen fulfills honey bees' nutritional demands for protein and fat. This agrees with fact that the colony development and reproduction are mainly related to the taxa collected and its composition (Avni et al., 2009). The identification of pollen loads from pollen traps is very important because it gives about the preferences and resource richness in
collecting plant species as the main sources pollen for honeybees. From our data 49 taxa were identified among sample collected in pollen traps, given the relevant reference that the highest proportion of taxa become from only a few sources. The highest harvested pollen was from Guizotia spp, Vernonia spp, Datura inoxia, Trifolium spp, Zea mays and Croton macrostachyus. Relatively small amount of pollen was collected during May and June to August. The plant species contributing during May to June for pollen were Schefflera abyssinica, Croton
93
macrostachyus, Syzygium guinnese and Coffea arabica. The identified pollen taxa from pollen trap was belong to published Honeybee flora of Ethiopia ( Fichtl and Admassu 1994). There was seasonal variability among the pollen source plants depending species richness, duration of flowering and length of the rainy period. In this investigation, the highest pollen load gathering occurs between September to January, whileApril to May with the lowest pollen collection. The dearth periods were February and July). The high pollen collection during septmber and november is due to the appearance of higher density of flowering plants after rainy seasons (June-August and March to April) reaching their peak flowering in October and April. The lower pollen yield was recorded during June to August which is the main rainy season throughout the country affecting the flight condition of honeybees which, in turn, affects pollen collection. This is in agreement with similar study in central parts of Ethiopia (Admassu Addi and Debissa Lamessa 2009) stating that during the rainy season, low temperatures possibly inhibit growth and flowering, whereas the higher temperature during dry period causes water deficiency in plants resulting in low nectar secretion and low pollen production. Moisture The analysis of bee pollen samples for moisture content from taxa study demonstrated that moisture content of pollen vary among taxa depending on environmental condition where the plant grows and hygroscopic property of the pollen. The moisture content was relatively higher for all taxa since the study area is located in one of the higher rainfall regions of the country and hence it receives substantial amount rainfall for nine months. This has great impacts on pollen quality and it is in line with other published studies once higher values could favor microbiological contamination, particularly by fungi and yeasts (Solange, 2009). Protein content The protein content from all samples under investigation fall in standard ranges 20-30% (Campos et al., 2008) and they are accepted by the International Food Safety Control. The total protein content, highest for Combretum paniclualtum (27.09 %) and lowest for Ageratum conyzoides (15.87 %) agrees with other studies that reported values at range of 16 to 29 %.(Tüylü and Sorkun, 2006; Odoux et al.,2012). The variation in the protein content of pollen reflects difference in plant taxa depending on plant origin (Szczęsna, 2006) and environmental factors such as climatic and soil conditions (Cirnu et al. 1969, Stanley and Linskens, 1974, Bosi and RicciardelliD'Albore 1975 during maturation, age and vigor of the plants. Similar study reported by Debissa etal.2008) indicating the content of crude protein varies from 13.25% to 28.68% for pollen producing plants for central parts of Ethiopia while it was lower for spore producing plant species (Pinus radiata ).
Minerals Minerals in pollen have different functions, as for example, Calcium and Phosphorus are essential for humans and animals particularly in cell physiology since deficit in Calcium and Phosphorous can affect the formation of bone and tooth. Potassium is also an important mineral involving in muscles contractions specially cardiac muscles resulting in heart arrhythmia. It affects lipids metabolism, proteins synthesis, maintaining the fluid and electrolyte balance in the body and is responsible in the nerve impulses sending. Sodium is responsible for depolarization of cellular membrane and for the water equilibrium in intra- and extra cellular medium. Varaion in the mineral composition of bee collected pollen and others refects the difference in the floral origin of pollen and the plant growth conditions such as soil and geographic origin (Campos et al., 2003; Almaraz-Abarca et al., 2004). Similar study by Stanley and Linskens( 1974) indicated that there are difference in mineral content of pollen collected by bees and pollen collected directly from flowers.The amounts determined in pollen give an add-value to the product when used for human purposes. Fat and Vitamin C content Pollen also vary with their relative proportion of fatty acid content. The fat content of the pollen samples ranges from 2.74 - 5.68 % with the highest values for Croton macrostachyus (5.68 %) and lower value for Vernonia amygdalina(2.74 %). Several factors can affect the type and proportion of the different chemical constituents in pollen including plant species and area in which plant growth with type of soil and climatic condition, season of the year and even time of day pollen is collected (Smchidt and Buchmann 1992). Like other components, there is a considerable variation, depending on the pollen type. Pollen contains significant amount of carotenoids, mainly β-carotene, are related to vitamin. But these, too depend on the botanical source of the pollen. Total phenolic content It has been recognized that total phenolic content of pollen extract is associated with their antioxidant activities due to their redox properties which allow them to act as reducing agents hydrogen donors. According to our finding the pollen collected by honeybees from different taxa shows characteristic amounts of total polyphenols and the result obtained from this study falls with bee pollen phenols range reported in most scientific literature: Bogdanov et al( 2004); Atip et al. (2012); Serra Bonvehı, (2001);.The amount of total polyphnol is low as compare to similar studies mentioned above due to different factors involved during data collection such as storage condition, geographic origin and modification of pollen during packing of the pollen loads by honeybees that may affect enzymatic reaction. The polyphenol content is vary among pollen source plants due to variation in chemical composition of pollen in different location and different

94
floral sources. Apart from this total phenolic compounds content of pollen extracts were solvent-dependent. Similar data was provided by (Solange et al. 2007), were they give information about pollen extracted with ethanol at 60, 70 and 80 % of concentration showed relatively higher levels of phenolic compounds (>10 mg/g). Campos, et al. 1997 showed that phenolics in pollen are specie-specific and contribute to the fingerprint of each taxon which could be used for identification of floral origin. Free radical scavenging activity The ability of pollen extract to quench reactive species by hydrogen donation was measured through DPPH radical scavenging activity test. Compounds with antioxidant activity can react with DPPH which solution has a violet color. The solution discoloration during the reaction can be quantified by measuring the absorbance at 517 nm which indicates the scavenging ability of these compounds. Pollen samples analyzed in the present work shown to have considerable variation in compounds that could be correlated to its antioxidant activity. These constituints were correlated to the bioactivity in the taxa, under evaluation in this work, that show values increased in the order of Eucalyptus spp>Trifolium rupplienaum>Vernoniaamygdalina>Datura arborea>Bidens spp>Guizotia spp> Croton macrostachys> and Combretum paniculatum. A significant correlation between the total phenolic content and antioxidant activity in bee pollen were reported ( Bogdanov, 2011) . However the variation in free radical scavenging values in the above cited plants species was not correlated with the variation in the levels of phenolic compounds present in samples, neither with vitamin C, or other of the constituents as proteins or fat content. This is in line with previous results carried out with different taxa (Campos et al, 2003; Almaraz et al., 2008; Lopes et al., 2011and Stanciu et al., 2016). This will stimulates further investigation to pursuit the full understanding of the mechanisms involved in this bioactivity. Conclusions and recommendation It is concluded that the proximate composition determined for protein, moisture, fat, ash, vitamin C and minerals indicated that bee pollen can be used as to supplement diets for humans since the results of nutritional analysis found are in line with the International ranges of food quality as it has high antioxidant factors. The samples from the flora collected during the year possess a considerable amount of polyphenolics which have relevant antiradical activity to protect body from damage caused by radicals are more significantly at September-November season with the good preservation schedule of the product. Therefore due to the biodiversity available in Ethiopia further investigations should be performed to evaluate the total profile of polyphenolic and amino acids composition, among other nutrients, to improve the consume once it is a very good source of macro and micronutrients which is fundamental for human health.
Acknowledgment
The authors highly acknowledged for the financial support
provided by thematic research division of Addis Ababa
University and Biovision foundation for Ethiopia. We also
thank the International Center for ecology and physiology
(ICIPE) for technical support in bee colony management.
References Admassu Addi & Debissa lamessa (2009). The pollen potentiality
and protein content of bee collected pollen from Mengesha suba state forest. Ethiop. J. Biol. Sci., 8(2): 85-97.
Almaraz-Abarca, N; Campos, M G; Ávila-Reyes, J A; Naranjo-Jiménez, N; Herrera-Corral, J; González-Valdez, L S (2008). Antioxidant activity of polyphenolic extract of monofloral honeybee-collected pollen from mesquite (Prosopisjuliflora, Leguminosae). Journal of Food Composition and Analysis 20(2): 119-124.
Almeida-Muradian, L B; Pamplona, L C; Coimbra, S; Barth, O M (2005) Chemical composition and botanical evaluation of dried bee pollen pellets. Journal of Food Composition and Analysis 18(1): 105–111.
AOAC(1990). Official Methods of Analysis of the Association of Official Analytical Chemists 15th Edition Washigton D.C. USA.
AOAC, (2000) .Official Methods of Analysis, Arlington, VA, USA.Aouali , N., Laporte
AOAC,( 2003). Official methods of analysis of AOAC
International. 17th edition
AOAC ( 2005). Official Methods of Analysis of AOAC IN TER NA TIONAL18
th edition
Atip Chantarudee, Preecha Phuwapraisirisan, Kiyoshi Kimura, Masayuki Okuyama, Haruhide Mori, Atsuo Kimura and Chanpen Chanchao (2012). Chemical constituents and free radical scavenging activity of corn pollen collected from Apis mellifera hives compared to floral corn pollen at Nan, Thailand.
Avni, D., Dag, A., Shafir, S., (2009). Pollen sources for honeybees in Israel: Source, periods
504 of shortage, and influence on population growth. Israel Journal of Plant Sciences 57, 263-505 .
Budryn, G. Nebesny, E. (2006). Phenolic acids-their properties, occurrence in plant materials, absorption and metabolism. Bromatol.Chem. 39, PP.103–110.
Bogdanov, S. (2011). Pollen Nutrition, Functional Properties, Health: A Review. Bee Product Science, Available online: http://www.bee- hexagon.net/files/file
BOGDANOV, S; BIERI, K; GREMAUD, G; IFF, D; KÄNZIG, A; SEILER, K; STÖCKLI, H; ZÜRCHER,K (2004). Swiss Food Manual: Pollen Bienenprodukte, BAG (Swiss Federal Office for Public Health); Berne
Bogdanov, S. (2016) Pollen: Production, Nutrition and Health: A Review. Bee-Hexagon.net. Available online: http://www.bee-hexagon.net/files/Review
Bosi G., Ricciardelli D'Albore G.(1975). Quantitative determination of amino acids in some bee collected pollens. XXXV Int. Beekeep. Congr. Apimondia,
Cirnu et al. (1969). do processo de desidratação”. Master Dissertation. Pharmaceutical Science
Campos, M G; Bogdanov, S; Almeida-Muradian, L B; Szczesna, T; Mancebo, Y; Frigerio, C; Ferreira, F (2008). Pollen composition and standardisation of analytical methods. Journal of Apicultural Research 47(2): 156-163.http://dx.doi.org/ 10.3896/IBRA.1.47.2.12

95
Campos, M G; Webby, R F; Markham, K R; Mitchell, K A; Da Cunha, A P (2003). Age-induced diminution of free radical scavenging capacity in bee pollens and the contribution of constituent flavonoids. Journal of Agricultural and Food Chemistry 51: 742-745.
Crane, E. (1990). Bees and beekeeping: Science, Practice and World Resources. Cornstock Publ., Ithaca, NY., USA.pp 593
Debissa Lamessa & Admassu Addi (2008). Importance of honey and bee pollen for vegetation characterization in Ethiopian. Journal of Natural Resource (ESNR) .
Friis Ib (1992). Forest and forest trees of north-east Tropical Africa. Kew Bull. Additional Ser. 15:1 -396.
Freire K, Antonio C. S. Lins, Marcos C. Dórea, Francisco A. R. Santos,
Celso A. Camara and Tania M. S. Silva(2012). Palynological Origin, Phenolic Content, and Antioxidant Properties of Honeybee-Collected Pollen from Bahia, Brazil.Molecules, 17, 1652-1664
Herbert, E.W., (1999). Honey Bee Nutrition, in: Graham, J.M. (Ed.).The Hive and the Honey.Dadant& Sons, Hamilton, Illinois, pp. 197-233
Haydak, M.H., (1970). Honey bee nutrition. Annual Reviews of Entomology 42, 611–643
Kroyer G.,Hegedus N.(2001). Evaluation of bioactive properties of pollen extracts as functional dietary food supplement. Innov. Food Sci. Emerg: 171-174
Lopes J., Stanciu O.G., Campos M.G., Almaraz-Abarca N., Muradian L.B., Marghitas L.A. (2011). Bee pollen antioxidant activity – a review: achievements and further challenges, J. of Pharmacognosy. 2: 25-38.
Methods of Vitamin Assay (third Edition) (1966). Inter science Publishers pp 320-327
Manual for Nutrition Surveys (Second Edition) ( 1963). pp 230-232
Morais, M.; Moreira, L.; Feás X. and Estevinho, L.M. (2011) : Honeybee-collected pollen from five Portuguese natural parks: Palynological origin, phenolic content, antioxidant properties and antimicrobial activity. Food Chem. Toxicol.49, 1096–1101).
Odoux, J.F. Feuillet, D., Aupinel, P. Loublier, Y. Tasei, J.N. Mateescu, C., (2012). Territorial biodiversity and consequences on physico-chemical characteristics of pollen collected by honey bee colonies.Apidologie 43, 561-575
Pernal, S. F. & Currie, R. W. (2001).The influence of pollen quality on foraging behavior in honeybees (Apismellifera L.).Behav.Ecol. Socio biol, Pp 53–68.
Ranganna, S. (1977). Plant Pigments. Manual of Analysis of fruit vegetable products: 77- 79 .
Reinhard Fitch and Admassu Addi (1994). Honey bee flra of Ethiopia. Margraf Verlag, Germany. Pp. 510.
Schmidt JO, Buchmann SL (1992). Other products of the hive, In Grahan JM (ed). The hive and the honeybee. Hamilton, Dadant & Sons, pp. 927-988.
Solange, T.C, Rosicler, B., Severino Matias A., Maria Lúcia, M. (2009). Study of preparations of bee pollen extracts, Antioxiant and Antibacterial activity. Ciênc. agrotec., Lavras, v. 31, p. 1818-1825
Šramková, Nôžková, Kačániová , Máriássyová , Rovná andStričík (2013) : Antioxidant and antimicrobial properties of monofloral bee pollen.J Environ Sci Health B. 48(2):133-138.
Stanley, R.G. Linskens, H.F. (1974). Pollen: Biology, Biochemistry, Management. Springer, New York.
Szczęsna T. (2006). Protein content and amino acid composition of bee collected pollen from selected botanical origins. Journal of Apicultural Science, 50: 81-90.
Tüylü, A.Ö., Sorkun, K., (2006). Protein analysis with kjeldahl of pollen grains collected by Apismellifera L. 6, 7-11
Serra Bonvethi, Soliva Torrento Ó, M.; Centelleslorente E. (2001). Evaluation of polyphenolic and flavonoid compounds in honeybee-collected pollen produced in Spain. Journal Agricultural Food Chemistry Easton, v. 49, n. 4, p. 1843-1853.
Talpay, B M (1984). Der pollen.Versuch einer standortbestimmung. Institut Für Honigfroschung Bremen: 1–84.
Woldegiorgis ,Dawit Abate, Gulelat Haki, D. Gregory R. Ziegler (2014). Antioxidant property
of edible mushrooms collected from Ethiopia. Winston, M.L., (1987). The Biology of the Honey Bee. Harvard
University Press ISBN 0-674-639 07408-4. Yang, K. Wu, D. Ye, X.Q. Liu, D.H., Chen, J.C., Sun, P.L.,
(2013).Characterization of Chemical Composition of Bee Pollen in China. Journal of Agricultural and Food Chemistry 61, PP 708-718.
Zenebon O. Pascuet N, S. (2005). Methods of fisico-quimicos para analise dealimentos.
![Proximate Content and Antioxidant Profile of Pumpkin ( L ...article.aascit.org/file/pdf/9070840.pdf · to combined analysis of variance SAS [17]. Means squares, where significantly](https://static.fdocuments.net/doc/165x107/5ea109f02adc2d22811b81c3/proximate-content-and-antioxidant-profile-of-pumpkin-l-to-combined-analysis.jpg)