
Providing Scope for Reducing the Carbon Footprint of … · of an Offshore Oil Rig Author: Jamie...
74
Department of Mechanical and Aerospace Engineering Providing Scope for Reducing the Carbon Footprint of an Offshore Oil Rig Author: Jamie MacDonald Supervisor: Cameron Johnstone A thesis submitted in partial fulfilment for the requirement of the degree Master of Science Sustainable Engineering: Renewable Energy Systems and the Environment 2014
Transcript of Providing Scope for Reducing the Carbon Footprint of … · of an Offshore Oil Rig Author: Jamie...

Department of Mechanical and Aerospace Engineering
Providing Scope for Reducing the Carbon Footprint
of an Offshore Oil Rig
Author: Jamie MacDonald
Supervisor: Cameron Johnstone
A thesis submitted in partial fulfilment for the requirement of the degree
Master of Science
Sustainable Engineering: Renewable Energy Systems and the Environment
2014

Copyright Declaration
This thesis is the result of the author’s original research. It has been composed by the
author and has not been previously submitted for examination which has led to the
award of a degree.
The copyright of this thesis belongs to the author under the terms of the United
Kingdom Copyright Acts as qualified by University of Strathclyde Regulation 3.50.
Due acknowledgement must always be made of the use of any material contained in,
or derived from, this thesis.
Signed: Jamie Stewart MacDonald Date: 06/09/2014

3
Abstract
Emissions associated with oil production condemn the oil industry; greenhouse gases and
environmental damages are the main association with refined oil and its effect on our planet.
The fear of global warming has led to many countries placing restrictions on the emissions
associated with oil production. Consequently a new market has opened up as engineers search
for a sustainable energy source for the future - a hunt that is primarily focussed on the
possibilities of renewable energy. In the light of this, this thesis investigates the changes
which can be made to current fuel sources used on offshore production platforms. Through a
four part analysis this thesis will demonstrate the huge potential that renewables have to
reduce the carbon emissions of the oil and gas industry - an industry which is almost uniquely
well financed to research and develop their practices.
The investigation is comprised of four chapters; the first two assess current methods of
energy generation on offshore platforms. The second half of this research builds on the first
to suggest ways in which renewable energy can take the place of current unsustainable power
sources.
Recent research conducted by Wei He [1] and Kolstad [2] found that there is an industrial
appetite for integrating some well-developed renewable devices, but there was no evidence
found of such projects in action. Resultantly, this thesis falls within a research lacuna and
supplies a gap in the existing knowledge. As there is little existing research on this topic the
investigation used a combination of research methods. To investigate the potential for
renewables in the oil and gas industry, the energy demands of a sample rig were calculated,
and the ability of several reviewed renewables in satisfying this energy demand was analysed.
The cost of energy of the renewable devices was compared and contrasted with that of the
fossil fuel driven power sources, showing the financial savings applicable whilst reducing the
overall carbon emissions of the sample rig.

4
Acknowledgements
Firstly I would like to thank Paul Strachan for granting entry to the Sustainable Engineering
course, an opportunity for which I am very grateful.
I would like to thank Cameron Johnstone for overseeing this project, and his assistance and
ideas throughout.
Thank you to my parentals Stewart and Carol MacDonald for being sound and helping with
everything en mi vida.
A special thanks to A Lizzle for her grammatical witchcraft, help throughout the year and a
deece 3 years.
Lastly I would like to say that everyone in the Sustainable Engineering course is dyno. You
have kept me going with our late night study sessions, Livingstone Tower pop quizzes and
extreme chess tournaments. It’s been emotional.

5
Table of Contents
Copyright Declaration ................................................................................................................ 2
Abstract ...................................................................................................................................... 3
Acknowledgements .................................................................................................................... 4
Table of Contents ....................................................................................................................... 5
List of figures ............................................................................................................................. 7
List of tables ............................................................................................................................... 8
Notations .................................................................................................................................... 9
Chapter 1 ................................................................................................................................ 11
1. Introduction ...................................................................................................................... 11
2. Current Power Sources on Offshore Oil Rigs .................................................................. 12
2.1. Diesel Generators .................................................................................................................. 13
2.2. Gas Turbines ......................................................................................................................... 14
3. Impacts Associated With the Functions of an Oil Rig ..................................................... 16
3.1. Environmental Degradation .............................................................................................. 16
3.1.1. From Oil Rigs Power Source .......................................................................................... 16
3.1.2. From Gas Flaring & Venting .......................................................................................... 17
3.1.3. Definition of Terms: Flaring .......................................................................................... 18
3.1.4. Definition of Terms: Venting ......................................................................................... 20
3.1.5. Impacts Associated with Gas Flaring/Venting .............................................................. 20
Chapter 2 ................................................................................................................................ 22
4. Existing Reforms to an Offshore Platforms Power Source .............................................. 22
4.1. Addition of Renewables ........................................................................................................ 22
4.2. Utilisation of Associated Gas ................................................................................................ 24
5. Review of Applicable Offshore Renewable Devices ....................................................... 27
5.1. Wind Power .......................................................................................................................... 27
5.2. Tidal Power ........................................................................................................................... 28

6
5.3. Wave Power .......................................................................................................................... 30
5.4. Solar Power ........................................................................................................................... 33
Chapter 3 ................................................................................................................................ 34
6. Specifications of Sample Rig for Analysis ....................................................................... 34
7. Energy Demands of a Sample Offshore Rig .................................................................... 36
7.1. North Sea .............................................................................................................................. 37
7.1.1. Electrical Living Quarters ............................................................................................. 38
7.1.2. Production Demand (Machinery) .................................................................................. 39
7.2. Gulf of Mexico ...................................................................................................................... 40
7.2.1. Electrical Living Quarters ............................................................................................. 41
7.2.2. Production Demand (Machinery) .................................................................................. 42
8. Conditions Offshore ......................................................................................................... 43
9. Renewables Reviewed that can Satisfy Energy Requirements ........................................ 47
9.1. Renewables in the North Sea ................................................................................................ 47
9.2. Renewables in the Gulf Mexico ............................................................................................ 48
Chapter 4 ................................................................................................................................ 49
10. Current Production Pricing ........................................................................................... 49
10.1. Living Quarters ................................................................................................................. 49
10.2. Production Platform .......................................................................................................... 50
11. Economic Analysis ....................................................................................................... 51
11.1. Wind Turbine Analysis ..................................................................................................... 54
11.2. Wave Dragon Analysis ..................................................................................................... 56
11.3. SurgeDrive Analysis ......................................................................................................... 58
12. Discussion ..................................................................................................................... 60
13. Conclusion .................................................................................................................... 63
References ................................................................................................................................ 64
Appendix A – Energy Demands of FPSO and Sample Rig ..................................................... 70
Appendix B – Cost of Energy of Renewables ......................................................................... 72

7
List of figures
Figure 1 Image of North Sea Oil Rig [3] ................................................................................. 12
Figure 2 Function of a Dual Fuel Diesel Generator [5] ........................................................... 13
Figure 3 Flare Stack on an Offshore Rig [18].......................................................................... 18
Figure 4 Flare Stack Schematic [22] ........................................................................................ 19
Figure 5 Elements of Associated Petroleum Gas [25] ............................................................. 21
Figure 6 Schematic of a Microturbine [39] .............................................................................. 25
Figure 7 Internal Process of Microturbine [40] ....................................................................... 25
Figure 8 Tidal Potential of the World [46] .............................................................................. 29
Figure 9 Pelamis P2 Being Tested in Open Water [49] ........................................................... 30
Figure 10 Functionality of the Wave Dragon [51] ................................................................... 31
Figure 11 SurgeDrive Schematic [52] ..................................................................................... 32
Figure 12 Offshore Rig Module [53] ....................................................................................... 35
Figure 13 Chart Showing Ratios of Energy Demands in Living Quarters .............................. 36
Figure 14 Distribution of Oil and Gas fields in North Sea [55]............................................... 37
Figure 15 Chart Showing Ratios of Energy Demands in Living Quarters (North Sea) .......... 39
Figure 16 Active Oil and Gas Rig Location in Gulf of Mexico [58] ....................................... 41
Figure 17 Chart Showing Ratio of Energy Demands in Living Quarters (Gulf of Mexico) ... 42
Figure 18 Map of Basins with Assessed Oil and Gas Formations [59] ................................... 43
Figure 19 Seasonal Wave Height of UK Waters [60] .............................................................. 44
Figure 20 Seasonal Mean Wave Power of UK Waters [60] .................................................... 44
Figure 21 Yearly Mean Global Horizontal Irradiation of UK [61] ......................................... 45
Figure 22 Capital Costs Associated with Installation of a Renewable Device [75] ................ 52
Figure 23 O&M Costs Associated with Installation of a Renewable Device [75] .................. 53
Figure 24 Average Global Wave Energy Flux Estimates in kW/m [79] ................................. 56
Figure 25 Comparison of Cost of Energy of Renewables and Fossil Fuel .............................. 60
Figure 26 Sample Realistic Energy Demand and Renewable Supply ..................................... 60

8
List of tables
Table 1 Effect of Greenhouse Gases [27] ................................................................................ 21
Table 2 Rig Specifications [53] ............................................................................................... 35
Table 3 Average Hourly Energy Demands of FPSO in Angola (Beadie. G, 2014) ................ 36
Table 4 Average Hourly North Sea Rig Strath Living Quarter Demands ............................... 38
Table 5 Power Supply Specifications for Drilling Rig Machinery [57] .................................. 40
Table 6 Average Hourly Gulf of Mexico Rig Strath Living Quarter Demands ...................... 41
Table 7 Capital Costs Associated with Renewable Energy Project [75] ................................. 51
Table 8 Operational & Maintenance Costs Associated with Renewable Energy [75] ............ 52
Table 9 Parameters and Cost of Energy of an Offshore Wind Turbine ................................... 54
Table 10 Parameters and Cost of Energy of Wave Dragon ..................................................... 57
Table 11 Parameters and Cost of Energy of SurgeDrive ......................................................... 59

9
Notations AC – Air Conditioning
Ah – Amp Hours
AG - Associated Natural Gas
C4H10 - Butane
CO2 - Carbon Dioxide
CHP - Combined Heat and Power
CO - Carbon Monoxide
C2H6 - Ethane
FPSO - Floating Production Storage and Offloading
GHG - Greenhouse Gas
GW - Gigawatt
GWh – Gigawatt hour
HVAC – Heating, Ventilation and Air Conditioning
H2S - Hydrogen Sulphide
kg – Kilogram
kW – Kilowatt
kWh – Kilowatt hour
LNG - Liquefied Natural Gas
LPG – Liquefied Petroleum Gas
CH4 - Methane
Mt – Metric Tonnes
MW – Megawatt

10
MWh – Megawatt hour
N2 - Nitrogen
N2O - Nitrous Oxide
O&M – Operations and Maintenance
C3H8 – Propane
p.a. – Per Annum
PV – Photovoltaic
SO2 - Sulphur Dioxide
TWh – Terawatt hour
WEC – Wave Energy Converter

11
Chapter 1
1. Introduction
Historically oil rigs have had a bad reputation and negative connotations associated with
them because of the work that is carried out on them, but the function of an oil rig as a work
and living space is something that can be reviewed, developed and upgraded to meet
changing policies and a worldwide demand for a more sustainable and less damaging fuel
source. The majority of offshore oil rigs make use of diesel generators for the high powered
machinery on-board and gas turbines for heating and electricity needs. Yet there is various
renewable technologies, and more specifically offshore technologies, being developed
throughout the world, and implementation of such technology on-board an oil rig could help
reduce the rigs overall carbon footprint and potentially lead to savings within the companies
that own the offshore platforms.
The dwindling of oil stocks has created a worldwide demand for an alternative sustainable
energy source; oil and gas companies have the revenue to research such alternatives, a lot of
which are renewable energy sources. The present moment is characterised by rising costs in
using fuel for production and so large companies are more motivated than ever to look for an
alternative. Implementing renewable technologies which could sustain life on-board the rig
could provide a screening and development process for new and existing renewable
technologies, helping towards the successful development of a future sustainable energy
source.
This thesis therefore, will look at the impacts associated with current oil production trends.
Both reviewing suitable offshore renewable energy systems and offering potential solutions
for improvements that could lead to a reduction in the carbon footprint of an operating oil rig

12
2. Current Power Sources on Offshore Oil Rigs
Many offshore oil rigs and platforms consist of detached living and working areas, sometimes
located on separate platforms on larger rigs, Figure 1 [3]. Heavy duty drilling and extraction
machinery operates in the working area and is usually powered by high-performance diesel
generators. The majority of electricity and power for other operations, including demands
made in the living and recreation areas, come from small-scale aero derivative gas turbines.
In optimal conditions oil rigs must function constantly. 24 hour operations are desired in
order to maximise output, and so the fuel sources required to power all facilities on-board
have to be constantly replenished. This can come from pipelines running to land from
platforms located relatively close to shore, or from fuelling ships that make the journey out to
the platform in order to refill all fuel stores. The constant refuelling process only adds to the
overall carbon emissions of an oil rig as the fuelling ships burn through 10’s of tons of fuel
[4], a seemingly counterproductive move given that their sole purpose is to provide more fuel
to the rig to burn through.
Figure 1 Image of North Sea Oil Rig [3]

13
2.1. Diesel Generators
Diesel generators provide essential power for drilling and extraction machinery on-board an
offshore platform. The higher efficiency associated with diesel fuel is one reason for this
utilisation, as well as the fact that many drilling rigs will have access to cheap fuel from the
petrochemical companies they are supplying the crude oil. The functionality and durability of
these generators is yet another reason why they are still the favourite for machinery power
generation.
Because diesel engines play such an integral part in the production of oil, many companies
accept the high fuel bill that comes with running these generators. However many old and
especially new diesel generators can be retrofitted to operate on a dual fuel mixture, in which
the engine makes use of a diesel and natural gas combination, significantly reducing the fuel
bill as more of the cheap natural gas can be used in place of the significantly higher priced
diesel fuel. Dual fuel diesel generators arise from normal diesel generators, but with the
addition of a dual fuel hardware that allows for addition of natural gas and air into the
combustion chamber, Figure 2 [5]. When operating in dual mode, natural gas enters the
intake system and is drawn into the cylinders, where an injection of diesel fuel into the
compression stroke allows for combustion which in turn ignites the natural gas mixture [6].
Depending on the ratio of diesel to gas looking to be used, some newer diesel generators can
function off the shelf utilising a dual fuel mix, with about 30% of liquid petroleum gas (LPG)
to the diesel blend.
Figure 2 Function of a Dual Fuel Diesel Generator [5]

14
As depicted in the figure above, additional single fuel and dual fuel diesel generators are
essential for emergency power requirements, in situations when one of the gas turbines or
hybrid diesel generators may have failed or in an emergency situation when all gas intakes
have to be closed for safety reasons. Back up emergency generators provide vital emergency
lighting and safety systems, without which there is a serious potential for injury or worse.
2.2. Gas Turbines
In addition to the diesel and dual fuel generators on-board, many offshore platforms make use
of aero-derivative gas turbines for electricity and heating requirements on the platform,
because of their economic and space saving values. Gas turbines allow for continuous and
relatively efficient power generation in spaces that other high intensity power production may
not be suitable. The gas turbines are fuelled by natural gas usually in the form of liquefied
natural gas (LNG), which is transported to the platform by piping or supply ships. Whilst the
gas turbines play a lesser role in power production in the sense that they provide power
mostly for electricity needs as opposed to the fuel thirsty production machinery, nonetheless
they are required to run 24 hours a day, seven days a week like the diesel generators, and so
multiple turbines are often run at one time to allow for maintenance and repairs to take place
without halting operations..
Smaller deep water rigs tend to outsource the gas required to power the turbines on-board
because of their hard to reach location or lack of infrastructure for onshore fuelling pipe
connections, however advances in purification methods and the realisation that the gas being
flared is a viable fuel source has allowed some rigs to make use of the associated natural gas
(AG) extracted in the mining process directly. Near shore rigs can transport the impure gas
extracted on shore for treatment and decontamination into a usable fuel that can then be fed
back offshore to the platform and run through the turbines. When located further offshore,
some larger and more technologically advanced platforms can process the gas retrieved on-
board for use in power generation [7]. The development of microturbine technology since the
1990’s has allowed, depending on the gases present, the ability to make use of the AG
retrieved with little to no treatment [8]. Microturbines are small and compact gas turbines that
can fit easily onto almost any offshore platform that does not have direct access to power
from on shore or a nearby power source such as a floating production storage and offloading
ship (FPSO). They range in size from 200kW to 1MW systems [9], and would allow for rigs

15
to swap between LNG and AG retrieved when available, as high levels of waste gas might
not always be accessible.

16
3. Impacts Associated With the Functions of an Oil Rig
From the outset the physical existence of an oil platform as working structure, both onshore
and offshore, is a noteworthy pollutant to the natural landscape they are situated in. In spite of
environmental degradation being the overwhelming focus in pollution associated with oil
rigs, there are other forms of pollution associated with oil and gas platforms that can have
less long term negative effects. Visual and sound pollution, depending on their location, can
have significant effects on populations within their vicinity, effecting human populations and
local wildlife, sometimes having an effect on that areas ecosystem. But in keeping with the
subject at hand, the large offshore oil and gas platforms located in many different waters
across the globe have a detrimental effect in all the oceans they are located, having a
potentially severe immediate effect on the environment surrounding them. The placement of
offshore rigs disturbs the sea life neighbouring it and as the drilling bits dig deep into the
ocean bed, it can release toxic gases and liquids buried deep beneath that can affect ocean life
and associated sea creatures. The extraction and processing of oil to produce fuel for the
world, in itself, burns thousands of gallons of petrol, diesel and gas in the process, expelling
vast amounts of greenhouse gases and other pollutants high into the atmosphere and into the
surrounding lands, which in some cases can be the settling location for human life. The
impacts caused by these structures are wide-ranging, and many are outside the scope of this
paper. For the purpose of this investigation the focus is specifically on the environmental
damages, with particular reference to atmospheric pollutants.
3.1. Environmental Degradation
With almost all industrial processes having a detrimental impact on our environment, the
production of Carbon Dioxide (CO2) in their operations is the greatest factor condemning
them. Oil rigs operate to provide materials to fuel many mechanical and manufacturing
processes on earth, with oil production reaching 90 million barrels per day in 2013 [10]. In
doing so the world’s oil platforms produce millions of tons of CO2 in the course, emitting
14.2 million tons of CO2 offshore alone in 2012 [11], only for the factories and operations
they are supplying to have the same negative effect on our environment, as they combust the
fuel oil supplied to them to produce yet more CO2.
3.1.1. From Oil Rigs Power Source
As above, the main sources of power generation on-board offshore platforms are diesel and
dual fuel generators as well as gas turbines. Both of these processes result in addition of CO2

17
to the atmosphere as the fuels are burnt for the energy harnessed within. CO2 is a greenhouse
gas (GHG) and like all greenhouse gases it absorbs and emits infrared radiation. GHG’s
present in the atmosphere trap infrared radiation passing through the ozone layer and retain
this heat causing global temperatures to rise [12]. On top of this, the aero-derivative gas
turbines used for electricity generation on-board produce a lot of waste heat in the process.
Whilst some more advanced and larger rig structures make use of this waste heat for
combined heat and power production (CHP), as well as reusing these high temperatures to
improve the gas turbines efficiency, many rigs simply let the hot by products out into the
atmosphere, and with exit temperatures as high as 500°C [13] this can affect the surrounding
environments.
With all the atmospheric pollutants rigs produce, some severe consequences can arise from
the exposure of crude oil extracted to the environments surrounding. Despite strict safety
measures in place, oil spills still occur, and the effect they have can be vast and disastrous,
costing millions of pounds to rectify, such as the BP Deepwater Horizon spill that was
estimated to have poured 4.9million barrels of oil into the Gulf of Mexico [14] and cost
upwards of $40Billion in clean-up costs and fines [15] [16]. Stormy seas when the rig
requires refuelling can also spell disaster. The oil platforms offshore refuel straight from large
refuelling ships that extend fuel lines to the rig for offloading. Unexpected storms and rough
seas can cause the connection between both to be severed and end in gallons of fuel being
dumped into the ocean as the boats lines are ripped away from the rig.
3.1.2. From Gas Flaring & Venting
Flaring and venting in the past occurred with much more intensity than now as oil companies
disposed of the seemingly useless and burdening gas that was retrieved in the process of oil
extraction. The carelessness of these actions led to the pointless disposal of a much needed
fuel, but the disposal outweighed any costs of treatment required and so senseless pollution of
the earth’s atmosphere occurred. As policies have become stricter and the potential harvested
within this gas has been realised, many companies, such as General Electric (GE) [17], make
use of associated natural gas for on-board power generation, or as a separate means of capital.
But not all functioning rigs can make use of this AG and many have to flare or vent the gas
retrieved for safety reasons or lack of infrastructure to store or transport the valuable fuel
onshore for transformation.

18
3.1.3. Definition of Terms: Flaring
Flaring is the process of combusting the natural gas retrieved in the course of routine oil and
gas operations, and the overarching goal of this process is to convert the raw substances
present in the retrieved AG into their safest possible form, which in this case is CO2 and
water vapour. Whilst technology has developed, and refining this impure AG has become
possible, many smaller or distant platforms lack the infrastructure for processing or
transporting the AG recovered on-board and so have to resort to flaring or venting when the
gas builds up. Flaring occurs for a multitude of reasons, such as; at well sites during oil
recovery, during pipeline and system maintenance, or in emergency situations as a quick
release for any gas build ups that might occur throughout the platform. The gas is collected
from the underground wells where the oil is present, and travels up towards the surface where
it enters the flare stack located at the extremities of offshore platforms, Figure 3. As Figure
3 demonstrates, flare stacks are tall, sometimes angled, visible structures. Not only is a flare
stack a visual pollutant, stacks generate a lot of noise and heat during their operation.
Figure 3 Flare Stack on an Offshore Rig [18]

19
The flare stack itself is a complex design to ensure safety and help burn efficiency at the tip
of the stack, Figure 4. A high burn efficiency is required to make sure that all associated gas
retrieved in the oil extraction is completely combusted, and so plumes of highly toxic gases
do not find their way into the closely located working environment. This is achieved with a
specialised flare tip design that assists entrainment of air or steam into the natural gas mixture
[19]. Addition of air and or steam into the AG helps create a smokeless flame and enhances
burn efficiency, with air entrainment achieving the highest level of combustion [20]. One of
the main safety features present in the flare stacks design is the inclusion of flash back
prevention sections, to stop the flame travelling down the flare stack towards the collecting
AG. Just below the flare tip there is a section to prevent flashback into the rest of the stack,
with a secondary prevention located at the bottom of the stack in the form of a water seal
drum [21]. As seen in Figure 4, resting at the bottom of the stack is a vessel used for drawing
any oil or liquid present in the gas mixture out prior to combustion, known as a knockout
drum, allowing continuous and uninterrupted burning of the AG as it enters the stack .
Figure 4 Flare Stack Schematic [22]

20
Successful combustion of the AG mixture results in water vapour and CO2, a damaging
greenhouse gas, but arguably less harmful than the un-combusted AG mixture being let off
into the atmosphere (vented).
3.1.4. Definition of Terms: Venting
Venting offshore is a process to prevent and relieve the build of retrieved gas in the oil
extraction process, the alternative to flaring, and it involves high pressure ejection of the AG
retrieved in a structure similar to a flare stack. The gas travels towards the ‘vent stack’ were it
undergoes high pressures to increase its escape velocity from the stack tip. This ensures that
the gas clears a distance away from the oil platform, where it can naturally dilute with the air
and dissipate so that it becomes non-flammable and there is no risk of explosion. Venting is
the preferred option when the AG holds to much moisture and will not efficiently burn [23].
Like the flaring process, venting can be noisy as the pressurised gas exits the stack, however
other than this the process is unseen and no heat is generated. Despite this seemingly better
gas rejection system, venting can be more harmful and degrading than the by-product of
flaring, as AG in its un-combusted form can contain some toxic gases, gases that are more
detrimental to the environment in their unreacted state.
3.1.5. Impacts Associated with Gas Flaring/Venting
The impacts and effects of gas flaring and venting are not too dissimilar in the sense that both
result in considerable pollution of the atmosphere. However the severity of pollution from the
end products of both differs greatly. In flaring, successful combustion of the AG recovered
results in addition of CO2 to the air, a well-known greenhouse gas, in addition to many kW’s
of waste heat energy that could be otherwise utilised. Conversely, when the process of
venting is favoured because the moisture content is too high within the extracted gas, the
vented gas can more often than not contain gases that fair worse than the after effects of CO2.
The associated gas retrieved from the oil extraction is composed of light hydrocarbons
including methane (CH4), ethane (C2H6), propane (C3H8) and butane (C4H10) [24], Figure 5,
as well as water vapour, hydrogen sulphide (H2S), Nitrogen (N2) and CO2 amongst other
impurities.

21
Figure 5 Elements of Associated Petroleum Gas [25]
The by-product gases released in flaring depend on how efficiently the AG is combusted. The
intended product of combustion is water vapour and CO2, the safest form the components of
the AG can be converted to. However, 100% efficient oxidisation of the gaseous substance at
all times is unlikely, resulting in some of the harmful hydrocarbons getting released without
combustion, as well as part combustion. Consequently carbon monoxide (CO) and various
other potentially harmful gases such as sulphur dioxide (SO2) and nitrous oxide (N2O) [26]
are produced: causes of acid rain. The intentional release of CO2 into the atmosphere may
seem irresponsible, however methane present in the hydrocarbon mixture causes more harm
to our environment than it would if it was oxidised to produce CO2, Table 1 [27].
Table 1 Effect of Greenhouse Gases [27]
Gas GWP1 (100-yr time
horizon)
Atmospheric
Lifetime (years)
Increased radiative
forcing2 (W/m
2)
CO2 1 ~100-300 1.88
CH4 28 12 0.49
N20 265 121 0.17
1 “The Global Warming Potential (GWP) provides a simple measure of the radiative effects of emissions of various
greenhouse gases, integrated over a specified time horizon, relative to an equal mass of CO2 emissions.” 2 “
Changes in radiative forcing since 1750 represent changes in the rate per square meter, at which energy is supplied to the atmosphere below the stratosphere.”
As can be seen from the table, the effects of methane in the atmosphere are 28 times more
damaging than that of CO2, and would incur global warming effects at a much higher rate,
hence the importance of utilisation of this AG be it flaring or processing for use as a fuel for
power generation.

22
Chapter 2
4. Existing Reforms to an Offshore Platforms Power Source
The knowledge that offshore oil and gas platforms are harming our planet is not new. Whilst
papers have been submitted which underline this fact like ‘The Potential Impacts of Oil and
Gas Production’ [28] [29], few academics around the world, such as Svendsen et al [30], have
investigated the ways in which renewable energy could be utilised to power these large and
energy-zapping rigs, with the average production platform consuming 1500-2000 gallons of
diesel per day [31]. Despite some progress in renewable energy research, the existing
discourse is undeveloped. Remaining at the hypothetical stage, offshore rigs continue to
operate on priorities which maximise economic profit – whatever the cost, environmental or
otherwise. The realisation of the associated natural gas’ energy potential has had an impact in
reducing overall fuel wastage and greenhouse emissions on some high output rigs. Yet
despite restrictions and regulations in regards to pollution control becoming tighter by the
day, these barriers do not lessen the oil companies’ main interests to operate at the cheapest
possible level to maximise profit outputs, and as far as fuel consumption goes, this means
making use of fossil fuels to power production.
4.1. Addition of Renewables
The majority of investigative papers published that analyse the possibility and potential for a
renewable energy solution to the power supply of offshore platforms look at the possibilities
afforded by wind power. The wide-scale and longitudinal research carried out by Wei He et
al [1] and Kolstad et al [2] exemplify this point, as their papers recommend making large
wind farms to create power for a large cluster of platforms. This proposal would likely be
achieved through creation of a microgrid, where interconnection of clusters of oil platforms
in existing oil fields would occur, and this microgrid would then be connected to a large
offshore wind farm [2]. Existing case studies confirm that Wei He [1] and Kolstad’s [2]
recommendations have great potential to generate hundreds of MW’s renewable energy. For
example the offshore capacity alone of the UK is in the range of 3500MW’s with 26TWh of
renewable wind energy produced so far [32]. Yet despite the environmental benefits
associated with these proposal’s, this layout would require retrofitting multiple offshore
platforms located in an oil field, and that oil field would presumably have to be positioned
near if not next to a large offshore wind farm. Although Wei He and Kolstad’s ideas are

23
promising, questions must be asked relating to the quantities of remaining oil reserves in
existing oil fields which have multiple rigs extracting from them. Moreover, the longevity of
such sites (like the Miller oilfield that produced from 1992-2007 [33]) is called into question
and resultantly troubles the viability and validity of retrofitting reform.
Wei He et al [1] take advantage of the advancements in offshore wind technology, looking at
how new structures sustaining floating wind turbines, which permits 2MW turbines to be
situated in far deeper water than previously achievable, allows them to be positioned in the
vicinity of deep sea offshore rigs. Floating turbine technology would enable immediate power
to that rig or rigs, as well as potentially supplying the onshore grid with the excess renewable
energy. The investigation reviews the operational benefits in reducing harmful gas emissions,
the electrical stability of the offshore grid and the technicality of the proposed project. Whilst
this is a viable solution to the carbon footprint reduction of offshore rigs, the infrastructure
and revenue required for such a project would require tens of millions [34]. There would be
associated benefits with such a project, like the ability for it to show any petrochemical
companies involved in a new light, yet it does not seem to be a feasible investment for any oil
company that might become involved, particularly with the short lifespan predicted of the
world’s remaining oil supplies. The financial investment involving installation of a single
floating turbine in interconnection with a larger rig found in deeper seas might be a more
acceptable cost to part with for any oil companies involved, as the fuelling costs for such
structures is multi-million pounds per year. Whilst the investment for such a project would be
high, the payback period in line with the years of mining remaining in these locations might
provide a reasonable and suitable energy alternative for these mega rigs.
Another, more unconventional, power production solution in the industrial sector is a solar
powered system developed by Seldon Energy [35] that boasts the ability to provide
interruptible 24/7 power for smaller scale start-up rigs, or function as long term power relief
system, helping reduce the diesel generator load of an existing site. However reliability of
diesel generators for machining requirements, along with the questionable scale to which this
technology can function is one reason it has not been deployed in high numbers. An
alternative company supplying offshore rigs with solar power in the oil and gas industry is
WhisperPower [36]. WhisperPower has provided 3 solar power systems to NAM
(Nederlandse Aardolie Maatschappij BV), a joint venture between Shell and Esso formed in
1947 [37]. The system powers navigation lights, alarm/detection instruments and remote
communication system on an unmanned oil/gas rig. The solar system comprises of a 1200Ah

24
Battery, 12kW generator, 10kW inverter and 10kW’s of solar panels. This is definite progress
in reducing the carbon emissions linked with the oil industry, as small as it might be in the
grand scheme of operations. Yet combination of these existing technologies could be the key
to providing a significant reduction in greenhouse gas production, reducing the carbon
footprint of the world’s offshore rigs.
4.2. Utilisation of Associated Gas
There is great potential for utilising associated natural gas which is retrieved in oil extraction.
Over the years, companies such as BP [38] have begun to exploit recent advances in
technology to harness the energy found in AG, which is then supplied as a fuel for many
offshore production platforms. Not only does processing this gas help to convert the toxic
mixture into a less harmful by-product, this process reduces the carbon footprint of some rigs
that make use of their own processed natural gas as a fuel source; instead of flaring or venting
gas as well as burning separate natural gas and diesel fuel for power, the AG can be utilised
for power production and would cut down the overall carbon emissions associated with
production on that rig. However, this technology is highly dependent on location and
infrastructure, and so the alternatives such as microturbines, that make use of the raw AG
extracted, could be the solution to the problem of wastage of this valuable natural fuel
resource.
Microturbines function exactly like their larger gas turbine and aero-derivative counter parts,
only on a much smaller scale and with the ability to utilise impure gases for fuel, Figure 6
[39]. The contaminants present in the AG mixture effect the energy density of the fuel,
however it is still able to provide a reliable source of power if there is a constant source of
waste gas contained within the retrieved oil gas mixture [9].

25
Figure 6 Schematic of a Microturbine [39]
As the gas is extracted from the crude oil, it is transported towards the combustion chamber
of the microturbine, Figure 7 [40]. Here it is met with hot, high pressure air after
compression, and the air gas mixture is then combusted and expanded through the turbine to
perform work, turning a generator to provide electricity. The hot exhaust gases from the
turbine exit are then transferred through a heat exchanger to capture and re-use in raising the
inlet air temperature, which increases efficiency and withdraws some waste heat from the
exhaust gases.
Figure 7 Internal Process of Microturbine [40]

26
The use of microturbines as a power source is growing within the oil and gas industry, and
becoming the standard power source on many small scale rigs as an electrical power
generation source. One such client making use of this technology is the West Newport Oil
Company, as described in the Los Angeles Business Journal [41].
On a marshy oil patch next to a gated Costa Mesa community,
Chatsworth manufacturer Capstone Turbine Corp. has finally found
a home.
There, at the West Newport oil field, tiny West Newport Oil Co. is
using a Capstone turbine generator. Fuelled by natural gas that comes
up along with crude oil, the generator produces electricity that helps
power oil pumps and other equipment.
That natural gas, which comes in quantities so small it’s not worth
selling to a utility, normally would be “flared off” or burned at the
site. Instead, West Newport uses the by-product to produce about one-
third of the well’s electricity needs.
“The (small) amount of gas we produce, it’s just a problem,” said
Tom McCloskey, operations manager for the oil company. “So we
like to use what little gas we do produce to produce electricity in-
house. It’s a great advantage to produce your own electricity.”
It’s the same story at oil and gas fields near and far, from Signal Hill
in Los Angeles County to the deserts of southwest Texas to Russia’s
vast Siberian wilderness.
Quote from the LA Business Journal [41]

27
5. Review of Applicable Offshore Renewable Devices
Whilst the current market for retrofitting offshore platforms to make use of renewable energy
sources is near non-existent, the functionality of these devices to produce immediate clean
energy is something that must be considered for offshore power consumption. Many of the
offshore devices in working order or in their testing and development stages make use of the
natural resources out at sea (e.g. wind, wave and tidal currents) to create some form of
movement in the renewable energy device, which either instantaneously converts the
momentum into electricity via a gearbox and generator, or in the cases of some wave
powered devices, make use of hydraulic fluid which is pumped and turns a generator again
producing electricity. The assortment of offshore devices available has been reviewed for
their applicability to power generation on an offshore platform and will analyse wind
turbines, wave powered devices, tidal flow stream devices, as well as the application of solar
PV systems for use in areas with warmer climates and higher direct and diffuse solar
radiation.
5.1. Wind Power
Wind turbines both onshore and offshore are currently one of the most common and well
harvested forms of renewable energy available. Wind turbines as a source of electricity
generation have been in use for well over 100 years, where the technology was first
developed by James Blyth of Anderson’s College (now Strathclyde University) in Glasgow in
1887 [42]. Since then energy providers have been using wind turbines to generate electricity-
preferred for their ability to function both on and offshore, making wind turbines an
important resource in our hunt for sustainable energy generation. The power achievable from
wind power has slowly increased as the technology has become more advanced; currently
some onshore turbines are capable of 7.5MW rated power output [43].
However offshore wind turbines are significantly more powerful than their smaller onshore
counterparts. The reasons for this relates to the development of the sub-structures and jackets
they are resting upon, enabling offshore turbines to produce 10MW of rated power [44],
2.5MW more than the rated power of the largest onshore wind turbine. Techniques for
supplying wind powered renewable energy to offshore rigs has been investigated but have
not been seen as economically viable at this stage due to the large input revenue. Coupled
with the financial barrier is the fact that clients are wary about investing in a project which
has an unknown lifespan due to the diminishing amount of oil.

28
Exploration to look for new oil wells is ongoing and there is undoubtedly, still, a vast amount
of oil to be harvested with 2013 oil reserve predictions at over 1500 Billion Barrels [45]. In
the light of this it could be argued that renewable energy solutions should be of interest to
stakeholders involved in new-build offshore rigs – where the investment may still be
financially worthwhile to investigate the impact of adding a single large floating turbine, or a
few smaller turbines to help with the power supply to living quarters and on-board electricity
demands. Such an approach could also provide additional revenue for the companies
involved as any excess, and unused energy could be transported onshore and input to the
national grid. Depending on the lifespan of certain wind turbines, such a project could also
serve as research into the potential of wind power at the oil wells location, giving real time
information, which could later be used as a site location for an offshore wind farm to give a
constant source of renewable power.
Implementation of wind turbines for power to existing or newly discovered oil fields would
be a great advancement in reducing carbon emissions offshore, however smaller rigs making
use of such vast structures is not quite feasible when at low production some of these mega
turbines can still be producing 3MW of power. For smaller, self-sufficient rigs it may be
more suitable to take advantage of the vast range of small scale wind turbines available for
local power production. There is no shortage of wind turbine designs and different
functionalities, and many are suited for mounting on top of buildings or in business estates
etc. Therefore these devices could easily be mounted on an outer portion of an oil platform,
or on top of the living quarters, the area that will require purely electricity for its energy
needs. This solution would provide instantaneous power to the living area, and in stormy
conditions or when there is a lack of wind, other natural technologies could be utilised, or if
slightly larger the rig could make use of an array of devices for constant power generation.
5.2. Tidal Power
Tidal flow turbines remain in their early stages of development and do not have a very high
rated power in comparison to the offshore wind turbines available. Resultantly, these turbines
are not yet deployed in large numbers around the world. Tidal flow turbines are designed and
function like an underwater wind turbine, where the tidal currents pass over the blades
rotating the hub and turning a gearbox to spin a generator [46]. Like all renewable
technology, tidal turbines rely on natural forces for power generation, except the forces
related with power production in tidal flow turbines is not intermittent like wind, wave and

29
solar. The wind does not always blow and the sun is not always shining, however tidal
currents are influenced by the phases of the moons movement, and so can be reliably
predicted [47] [48]. Another benefit to newly designed tidal turbines is that they can function
in forward and reverse. This means that wherever they are positioned they can make use of
incoming and receding currents, as the rotor functions both ways.
Tidal current devices require a minimum operating depth of approximately 15-40m, and so
this makes them more suited to power supply on platforms slightly nearer to shore. Such a
position would imaginably result in platform’s receiving a minimal share of the power
produced, as other land based applications would favour this renewable energy source located
so close to shore, with the realisation that all power generated might be put into the main
electricity grid. The tidal power potential of the world is vast, and the UK has the highest
power potential in its surrounding coasts and seas at a rated potential of around 10GW,
representing 50% of Europe’s complete tidal potential Figure 8 [46].
Figure 8 Tidal Potential of the World [46]
30
5.3. Wave Power
Wave power is a somewhat different type of renewable energy generation because it makes
use of various movements and turbines for is electricity generation such as utilisation of
hydraulic pumps that move as waves pass over them, which in turn produces electricity. It is
an intermittent production device, and makes use of the wind conditions and their effect on
the ocean’s surface. Wave devices vary greatly in size in shape. Some are best used near to
shore where waves break, creating great forces on the wave device, where as other,
potentially more suitable devices for this investigation, can be used in deeper waters as they
raise and move with the rolling waves far offshore. The greater suitability of deep-water
wave devices is their ability to provide onsite generation, with all production fed directly to
the rig.
In many cases deep water wave devices are harnessed to the sea bed and rest on the ocean’s
surface, reacting to the movement generated by passing waves. Whilst conditions in the
North Sea are particularly suited to this type of energy generation because of the turbulent
seas, some devices can understandably only function in certain conditions and are not well
suited to rougher seas and stormy weather. The North Sea is notorious with rough seas and
this would limit the energy potential of such devices as the Pelamis sea snake, where as other
newly developed deep sea wave devices are in built with programs to react to changing
weather and are durable enough to cope with rough seas.
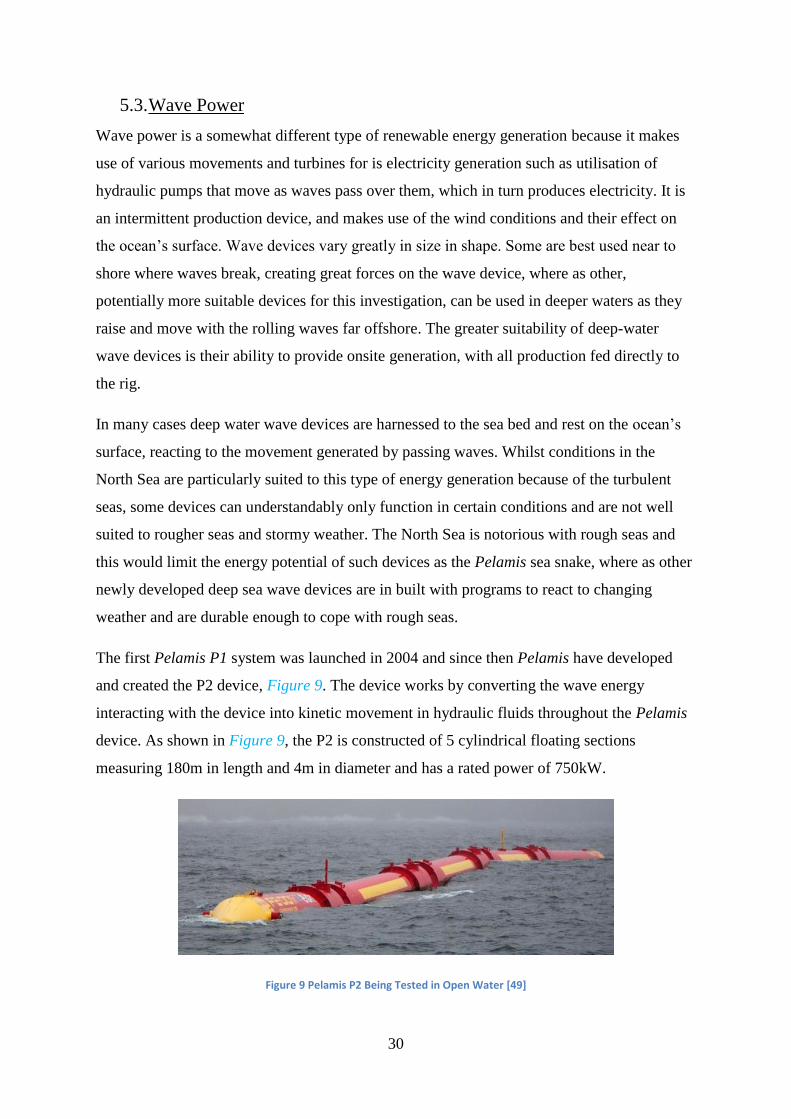
The first Pelamis P1 system was launched in 2004 and since then Pelamis have developed
and created the P2 device, Figure 9. The device works by converting the wave energy
interacting with the device into kinetic movement in hydraulic fluids throughout the Pelamis
device. As shown in Figure 9, the P2 is constructed of 5 cylindrical floating sections
measuring 180m in length and 4m in diameter and has a rated power of 750kW.
Figure 9 Pelamis P2 Being Tested in Open Water [49]

31
The two most suited devices to deep sea wave power generation that have emerged from
recent advancements are the Wave Dragon and AquaGens SurgeDrive technology. Both
systems are floating devices but generate power in very different ways. Firstly the Wave
Dragon is one of the only developed wave devices that can be freely expanded depending on
the wants of the consumer. The Wave Dragon makes use of a floating reservoir situated
above sea level and created by the buoyancy of the device. There is an angled flexible edge
that acts as a ramp and elevates the ocean waves into the reservoir. Here gravity plays its part
and the waters want to flow back downwards towards the ocean cause it to flow down
through multiple turbines to generate electricity at the source [50]. This system is extremely
unique in the renewable energy market, as most offshore devices take extreme precautions to
avoid the elevation of waves over the device, known as overtopping, Figure 10 [51]. One of
the huge benefits of this wave system is that it is preferred in deeper waters where there is
greater movement in the waves generated by the wind. For example a rig located in the North
Sea will incur some very rough and choppy seas, which happens to be the ideal setting for the
Wave Dragon. To cope with the changeability of the sea surface and its constant alternation
between choppy and rough seas, the Wave Dragons floating components are controlled by air
cavities, which can fill and deflate to cope with the changing seas and therefore change in
wave height. As it stands the wave dragon is still in its testing stages, however the single unit
currently in testing is rated at 1.5MW.
Figure 10 Functionality of the Wave Dragon [51]

32
Another example of a more suited wave power device is the SurgeDrive created by AquaGen
Technologies. The SurgeDrive is comprised of a centrally located standing structure, similar
to a very small oil rig substructure with only a helipad for landing to allow maintenance,
Figure 11 [52]. Surrounding the central rig is a number of floating buoys that rise and fall
with the passing waves, and it is this movement that, once transferred to cables resting on the
sea bed below, converts the pure wave forces into electricity via an energy conversion
module [52].
Figure 11 SurgeDrive Schematic [52]
Whilst this system is a free standing wave farm which uses a centralised structure, AquaGen
have been working on the RigDrive system which specifically makes use of an oil rig as the
centralised standing source, with the wave farm surrounding. A great benefit of the
SurgeDrive wave farm is its storm survivability system. As the seas get rougher and waves
gain in size, the buoys in the surrounding farm automatically retract below the surface and
out of the extreme elements, protecting the wave device as it waits for the weather to pass and
generation to resume. AquaGen Technologies claim that the limit to the SurgeDrive’s power
output is only limited by the marine environment surrounding, which suggests the ability for
consumer expansion to potentially meet all electrical requirements, however pricing and
power capacity is still unknown in this patent pending technology, so it cannot be cemented
just yet as a potentially viable solution to the carbon emission problem of offshore oil
production.

33
5.4. Solar Power
Much like wind turbines, solar photo voltaic (PV) and solar thermal panels are a well-known
and well developed renewable energy technology available to almost anyone looking to
retrofit their home or workplace to use less energy from fossil fuels.. Whilst not perfectly
suited to northern climates and without ability to function to their full potential, utilisation of
this valuable energy source is more effective closer to the equator in places that receive
greater sun exposure. Solar thermal panels are something that would be greater utilised in the
North Sea where there will be higher hot water and heating demands, however the conditions
are more often than not cloudy and there is little sun exposure, letting very little direct
radiation through.
Solar PV utilisation in areas nearer the equator such as the Gulf of Mexico could help satisfy
a portion of electricity demands on a rig located in these waters. The real benefit of most PV
modules is their ability to be added simply and efficiently to the façade of a building and
even integrated as part of the cladding materials of a building as solar technology has
advanced. This allows older structures the ability to make use of new technology without
intrusive and vast retrofitting required to the buildings structure. This is extremely suited to a
rig located in sunny waters, where PV solar panels could be rigged onto the living quarters
directly to provide a steady and reliable renewable energy contribution towards the energy
requirements of that area.
Solar thermal panels in southerly waters as well as colder northern climates can help reduce
the energy expelled in hot water heating. Regardless of location, measures have to be taken in
hot water storage to prevent legionella disease, and so most water systems are heated to 60°
or above. However the levels of sunshine located off the Gulf of Mexico would allow for a
lower temperature differential between the pre heated water after it has cycled through the
solar thermal system and the temperature of the stored water.

34
Chapter 3
To effectively assess the demand of an offshore rig, the energy demands of a sample rig were
calculated for analysis. The energy demands of the sample rig, referred to as Rig Strath, were
split amongst living demands and production requirements, to assess the scale of energy
required for each area on the platform. The demands were calculated for two different
climates, to assess the effect this had on energy demands. Renewable devices were then
reviewed for each climate, and there applicability to successful energy generation questioned.
6. Specifications of Sample Rig for Analysis
Without direct access to an offshore rigs energy demands and demand profiles, the energy
data of a functioning hotel was manipulated and presented to match that of a functioning
living quarters on an offshore rig. To ensure the data was within appropriate ranges, it was
compared with the energy demands of a 140 man FPSO Table 3, provided by a PSVM
(Plutão, Saturno, Vênus and Marte) Offshore Installation Manager for BP working in Angola.
The living quarters of Rig Strath were assumed to be on a separate platform. In order to allow
for 75 person groups to carry out daily 12 hour shifts, the housing requirement was stated as
150 people. Resultantly, the living quarters undergo two 12 hour working days in one 24 hour
period. The working platform reflects this schedule with two 12 hour shifts. Although all
processes on the working platform are assumed to be functioning constantly, the living
quarters are characterised by energy spikes which coincide with regular events such as the
serving of dinner or a demand for hot water for showers after shift.
For all renewable technology possibilities to be considered, and their functionality tested, a
comparison will be carried out in two different climates; assessing the effect this has on
renewable energy potential and its ability to satisfy energy demand. Firstly Rig Strath’s
power demand will be calculated for a platform located in the North Sea off the north-east
coast of Scotland. Energy demand data will then be calculated for a rig located in the Gulf of
Mexico, a much warmer and sun-blessed climate. The difference in demands will be
calculated with regards to the climates effect on energy demands, where an initial energy load
was calculated for the North Sea climate, and altered accordingly for the more southern Gulf
of Mexico climate.

35
The dimensions of the living quarters are drawn with reference to a living quarter installation
available for sale to offshore rigs [53]. An image of the rigs structure is shown in Figure 12
and depicts one of the 50 man living quarters. Table 2 lists the dimensions of the structure
and the features of the four floors [53]. The main criteria of the living quarters on the
majority of offshore rigs are; cabins (bedrooms), recreational area, kitchen, bathroom and
showers, offices, and more common than not a gymnasium. All of these areas require
lighting, heating and cooling and ventilation systems.
Figure 12 Offshore Rig Module [53]
Table 2 Rig Specifications [53]
Dimensions
(LxBxH)
Material Used Accommodation
Capacity
Technical
Specifications
20.8mx32.4mx20.3m Complete steel structure
of weight 1653 tonnes
150
Features
45 2person cabins of
12.4 or 9.25m2
15 4prson cabins of
13.9 or 10m2
Aluminium Helicopter
Deck designed for
Sikorsky S-61N [54]
Male/Female
Locker Rooms
36m2 Tea room 135m
2 Mess room 36m
2 Fitness Area 44.1m
2 Health
Office
93m2
Recreation Day
Room
75m2 Smokers
Recreation Day
Room
180m2 Control Room 3 36m
2 Office
Areas

36
7. Energy Demands of a Sample Offshore Rig
The energy demands of the rig were split into North Sea and Gulf of Mexico. The
surrounding seas and climate will result in a call for different renewable technologies at each
location, and the comparison will show the broadness of devices available for power supply,
as well as their suitability to this industry. In order to clarify that the sample energy demands
are valid, the following FPSO living quarter energy demands will be used as a base case
reference, Table 3 (Beadie. G, 2014) and Figure 13.
Table 3 Average Hourly Energy Demands of FPSO in Angola (Beadie. G, 2014)
% of Total Energy Use kWh Usage
Galley (Kitchen) 5 20
Laundry 3 12
Heating, Ventilation and
Air Conditioning (HVAC)
50 200
Lighting 13 52
Elevators 5 20
Safety Systems 8 32
Chillers 6 24
Sewage System 4 16
Water System 5 20
Radio Communications 1 4
Total 100 400kWh
Figure 13 Chart Showing Ratios of Energy Demands in Living Quarters
20 12
200 52
20
32
24
16 20 4
Energy Demands of FPSO (kWh)
Galley (Kitchen)
Laundry
HVAC
Lighting
Elevators
Safety Systems
Chillers
Sewage System
Water Supply
Radio

37
The energy demands on-board Rig Strath will be split amongst electrical living demands,
including heating, and production demands with machinery loads. In order to integrate
renewables more effectively, the demand load should be a constant value, as fluctuating
demands with intermittent energy production can prove hard to satisfy.
7.1. North Sea
North Sea oil and gas platforms are primarily located off the North East of Scotland’s
Aberdeenshire coast, but do run further south as shown in Figure 14 [55]. The conditions in
this area are often cold and wet, with mild summers and harsh, dark winters that can affect
energy demands and working conditions.
Figure 14 Distribution of Oil and Gas fields in North Sea [55]

38
7.1.1. Electrical Living Quarters
The ratio of electrical demand in the living quarters of the rig varies relatively evenly, with
prevalence given to the heating demands and lighting requirements. Heating, ventilation and
air conditioning (HVAC) energy demands are relatively constant throughout the day as
temperature has to be maintained for people off shift residing in the living quarters. The
overall HVAC demand required on a rig located in the North Sea is heating, with space
heating and hot water requirements requiring the majority of energy for the living quarters.
Air conditioning (AC) is most likely to occur in the gym area, but it will be a relatively small
load in comparison and so will only result in a slight addition to the overall HVAC demand.
Table 4 shows the various electrical demands and the ratio split of each for the living quarters
of a North Sea located rig.
Table 4 Average Hourly North Sea Rig Strath Living Quarter Demands
% of Total Energy Use kWh Usage
Galley (Kitchen) 7 35
Laundry 2 10
HVAC 45 225
Lighting 15 75
Elevators 2 10
Safety Systems 8 40
Chillers 7 35
Sewage System 4 20
Water System 4 20
Radio Communications 1 5
Recreation Facilities 3 15
Gym Equipment 2 10
Total 100 500kWh
39
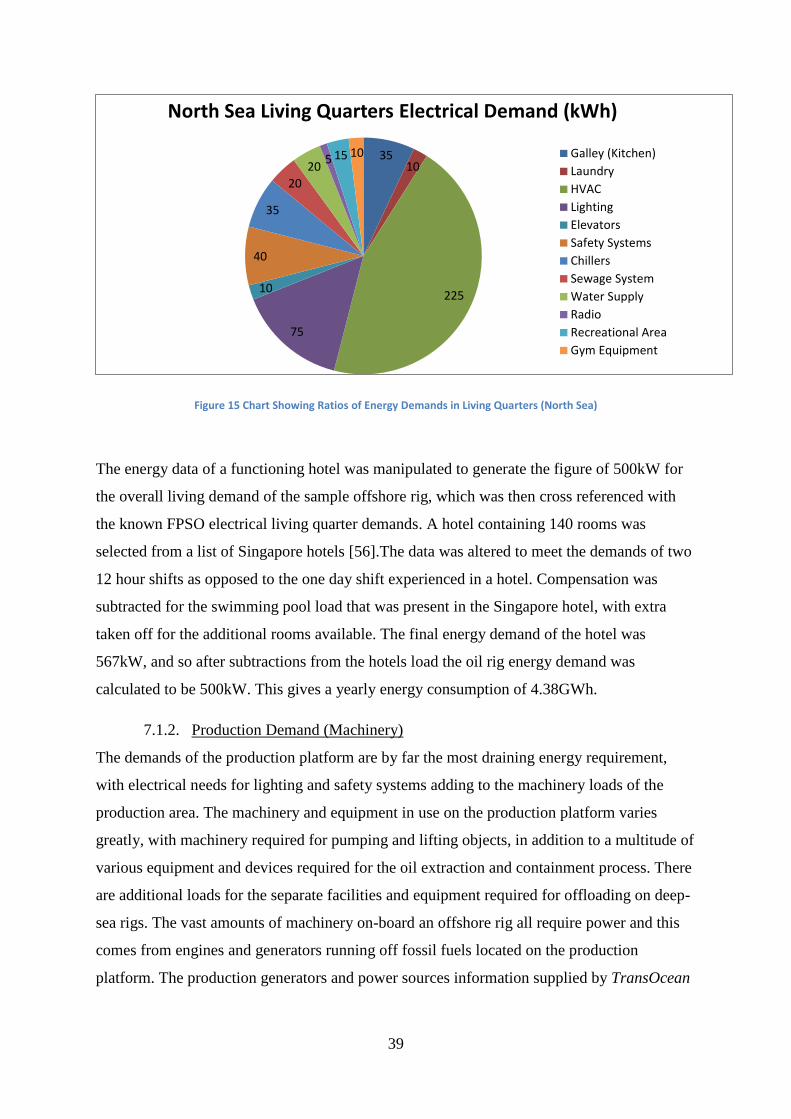
Figure 15 Chart Showing Ratios of Energy Demands in Living Quarters (North Sea)
The energy data of a functioning hotel was manipulated to generate the figure of 500kW for
the overall living demand of the sample offshore rig, which was then cross referenced with
the known FPSO electrical living quarter demands. A hotel containing 140 rooms was
selected from a list of Singapore hotels [56].The data was altered to meet the demands of two
12 hour shifts as opposed to the one day shift experienced in a hotel. Compensation was
subtracted for the swimming pool load that was present in the Singapore hotel, with extra
taken off for the additional rooms available. The final energy demand of the hotel was
567kW, and so after subtractions from the hotels load the oil rig energy demand was
calculated to be 500kW. This gives a yearly energy consumption of 4.38GWh.
7.1.2. Production Demand (Machinery)
The demands of the production platform are by far the most draining energy requirement,
with electrical needs for lighting and safety systems adding to the machinery loads of the
production area. The machinery and equipment in use on the production platform varies
greatly, with machinery required for pumping and lifting objects, in addition to a multitude of
various equipment and devices required for the oil extraction and containment process. There
are additional loads for the separate facilities and equipment required for offloading on deep-
sea rigs. The vast amounts of machinery on-board an offshore rig all require power and this
comes from engines and generators running off fossil fuels located on the production
platform. The production generators and power sources information supplied by TransOcean
35 10
225
75
10
40
35
20
20 5 15 10
North Sea Living Quarters Electrical Demand (kWh)
Galley (Kitchen)
Laundry
HVAC
Lighting
Elevators
Safety Systems
Chillers
Sewage System
Water Supply
Radio
Recreational Area
Gym Equipment

40
for their Sovereign Explorer drilling rig is shown in Table 5 [57], and gives an understanding
of the machinery energy usage that might be incurred on a production platform.
Table 5 Power Supply Specifications for Drilling Rig Machinery [57]
Machinery Power Supply
Main Power 4xWartsila 12-V-25 diesel engines rated 3698 hp each, driving 4x
2640kW ABB AC Generators
Emergency Power 1x Cummins KT-2300 diesel engine rated 650 hp, driving 1 x
650kW ABB Stromberg generator
Power Distribution Hill Graham SCR system, 7 Units, 1200 amps, 720V output
Deck Cranes 2 x Wolffkran HDK 1100HM electro-hydraulic cranes, 131ft boom,
55mt @ 66ft
Thrusters 2 x 2400kVA Kamewa azimuthing thrusters
Propulsion As Above
Despite the Sovereign Explorer rig making use of diesel engines and generators for its
machinery power, the majority of offshore platforms are fitted with aero derivative gas
turbines and dual fuel generators for all energy needs. The energy demands were calculated
using the information provided by the BP contact. The Angolan FPSO is fitted with four
22MW dual fuel gas turbines, as well as four diesel generators and one emergency diesel
generator all on standby for additional or emergency power requirements. The FPSO
typically runs two to three of the gas turbines daily, and so the daily output of two 22MW
turbines was calculated to give a yearly energy figure. Two 22MW turbines running all day at
40% efficiency produces 422.4MWh per day. The living quarter’s power consumption is
4.38GWh yearly and so the yearly average power consumption of the production platform
equates to 149.8GWh
7.2. Gulf of Mexico
Oil and gas rigs located in the Gulf of Mexico are located off the southeast coast of Texas,
running in parallel with the coast eastwards and down towards Mexico (See Figure 16). The
climate in this area is often subject to high temperatures and sun exposure, with long dry
summers from April till September and fairly mild winters in comparison to northern
climates

41
Figure 16 Active Oil and Gas Rig Location in Gulf of Mexico [58]
7.2.1. Electrical Living Quarters
The electrical energy requirements of the living quarters were assumed to be much like that
of the North Sea located rig, with the exception of lighting, which was assumed to be a lesser
load as there are longer and brighter days nearer the equator. The HVAC demand is assumed
to be greater, as AC will be the main heating/cooling demand throughout the day and uses
more energy than heating, as it produces waste heat in its process which has to be vented out.
Table 6 shows the living quarter energy demands of the Gulf of Mexico sample rig.
Table 6 Average Hourly Gulf of Mexico Rig Strath Living Quarter Demands
% of Total Energy Use kWh Usage
Galley (Kitchen) 7 35
Laundry 2 10
HVAC 48 240
Lighting 10 50
Elevators 2 10
Safety Systems 8 40
Chillers 8 0
Sewage System 4 20
Water System 4 20
Radio Communications 1 5
Recreation Facilities 4 20
Gym Equipment 2 10
Total 100 500kWh

42
Figure 17 Chart Showing Ratio of Energy Demands in Living Quarters (Gulf of Mexico)
7.2.2. Production Demand (Machinery)
The equipment functioning on-board for extraction is assumed to be identical to that of the
North Sea rig as they are both carrying out the same process, and climate was regarded as
having little effect on energy consumption. Therefore the Gulf of Mexico rig also incurred
149.8GWh production energy consumption.
35 10
240
50
10
40
40
20
20 5 20 10
Gulf of Mexico Living Quarters Electrical Demand (kWh)
Galley (Kitchen)
Laundry
HVAC
Lighting
Elevators
Safety Systems
Chillers
Sewage System
Water Supply
Radio
Recreational Area
Gym Equipment

43
8. Conditions Offshore
Aside from financial investment costs and generation capabilities, the conditions experienced
in offshore climates is one of the main deciding factors on which renewable device is most
suitable for energy generation, if any. With oil fields located all over there world and in every
which climate, see Figure 18, the renewable devices available for power generation vary
greatly.
Figure 18 Map of Basins with Assessed Oil and Gas Formations [59]
The conditions in the North Sea give way to cold winters, resulting in snow storms and
choppy seas. The harsh winters can make working offshore in the North Sea considerably
harder, as workers have to work longs shifts while battling the cold winter elements. Yet this
harsh weather can harvest a lot of power, which can be utilised by the renewable resources
available. During the winter, waters of the north-east coast of Scotland can generate waves of
heights ranging from 2-4m, see Figure 19. Whilst this can make sailing in these waters a
challenge, the energy harnessed within these waves can be anywhere from 40kW/m of wave
crest off the coast of Aberdeen up to 80kW/m in the waters surrounding the Shetland Islands,
see Figure 20.

44
Figure 19 Seasonal Wave Height of UK Waters [60]
Figure 20 Seasonal Mean Wave Power of UK Waters [60]

45
The conditions in the North Sea favour wind and wave for power generation as the deeper,
and significantly further offshore oil rigs would not suit tidal turbines as the tidal flows often
take place closer to shore. Solar PV panels for electricity generation are also less likely to be
efficiently utilised because of the lack of direct sunshine experienced in the northern climate
as shown in Figure 21.
Figure 21 Yearly Mean Global Horizontal Irradiation of UK [61]
In comparison, the waters in the Gulf of Mexico surrounding Americas south-east coast can
be relatively tame in the spring and summer months, where temperatures can soar to +35°C
[62] and the horizontal irradiation experienced yearly can reach 1900kWh/m2 [63]. However
the waters of the Gulf of Mexico become a different place between the months of June and
November, where the surrounding waters of the south-eastern coast of America face
hurricane season [64]. The region has previously felt the disastrous effects of hurricanes as
they gain power across the ocean on their path towards land. The effect of extreme weather
on oil rigs in this region was seen in 2005 when hurricane Katrina made its way across the
Gulf towards the American coast [65]. The Minerals Management Service (MMS) reported

46
that 12 rigs were damaged in the storm, with at least 5 rendered unusable after severe
damages. Nonetheless, a hot climate gives way to different energy demands than that of the
North Sea rig, and could potentially allow for the introduction of a variant of different
renewable devices from that of the north east climate.

47
9. Renewables Reviewed that can Satisfy Energy Requirements
The applicability of certain renewables and their ability to satisfy demand primarily depends
on the portion of energy demands that they have to supply. If a renewable device was
installed to satisfy 5% of the required energy demand of a building when working at full
potential, then this device could be installed with relatively no intrusion as there would be
sufficient supply from other sources to cover any losses in renewable energy production. It
would also mean that any excess would not be of a significant loss to require storage. When
the dependency of renewables for power supply increases, the intermittency of the
technologies installed becomes a problem, as storage options for excess demand become a
necessity. The reliance on the renewable device for power supply must also be questioned
when the device is not producing enough power, and the building will have to rely on an
external power source on standby as to not halt proceedings.
9.1. Renewables in the North Sea
Of the wave devices reviewed in Chapter 2, deep-sea initiatives such as Wave Dragon and
SurgeDrive are most suited to the North Sea conditions. The process of the Wave Dragon
which revolves around overtopping makes it particularly suited to the choppy conditions of
the North Sea, however the storm survivability of this system is not defined in any literature,
and so there is the possibility that large waves could destabilise the large floating structure.
Thus the SurgeDrive would be the recommended device as production is increased with
greater movement in the seas and it already integrates a storm safety system. The Wave
Dragon could increase its suitability to offshore power supply by incorporating such a safety
system as the SurgeDrive, which retracts under water in rough seas. The Wave Dragon’s
remote controlled flotation devices could be emptied of air bringing it below the surface and
thus out of the harsh elements experienced in a North Sea storm, after which it could be
remotely re-inflated and resume power generation.
Wind power in the North Sea is a well-developed technology and is implemented along the
coast of the United Kingdom; however interconnection with oil rigs as discussed in Wei et al
[1] is something that would require a large financial investment and time to do so, with the
average cost of a wind turbine alone ranging from £1.5-3million per MW [66]. Regardless of
the financial barriers, wind power is still one of the most probable renewable solutions for
lowering the carbon emissions associated with rigs found in the North Sea. Although a
sustained partnership between renewable energy companies and oil companies has not yet

48
been practiced, many oil and gas companies have investigated renewables in the past, such as
BP and Shell [67] [68]. However these investigations have been regarding small scale
renewables, and so for effective action to ensue, the need for carbon reduction has to be
stressed.
9.2. Renewables in the Gulf Mexico
The oceanic conditions in the Gulf of Mexico favour Wind, Wave and Solar power. There is
a much higher direct sunshine intensity in this region of the world, with an average direct
horizontal irradiation of 1900kWh/m2. Rigs in the gulf could prosper with utilisation of solar
PV panels, yet some high power solar devices such as the Seldon Energy device could prove
too ‘delicate’ for such conditions when the storm season begins. Despite the potential for
damage, oil rigs located in these threatened waters are developed and equipped to deal with
stormy, rough conditions, and so utilisation of the high irradiation levels for power generation
or hot water needs would help in the direction of carbon reduction in the Gulf of Mexico.
The threat of hurricanes during storm season rule’s out the use of floating wind turbines near
deep-water rigs as a permanent energy source, due to the risk of damage and potential loss of
these multi million pound devices. However solid structure wind turbines exist offshore in the
Gulf of Mexico [69] and so interconnection of wind power for rig power requirements is still
a feasible option in the Gulf.
From the wave devices reviewed the SurgeDrive again proves most feasible because of its
storm control measures. Whilst the climates of each location are so far apart, the forces of
nature felt by each environment prove to be similar at times during the year. Resultantly the
two technologies best suited for renewable power supply to offshore rigs in both
environments are the well-developed offshore wind turbines and the SurgeDrive wave energy
converter (WEC).

49
Chapter 4
ExxonMobil and GE rank amongst the top 10 companies in the world in measures of revenue
and profit margins [70]. Resultantly, these firms have little financial justification for avoiding
action to reduce carbon emissions of oil and gas rigs, especially where the technology is
available. This chapter initially analyses the current price of fossil fuel energy production
before assessing the cost of energy from a range of renewable energy devices which would be
suited to offshore energy production for oil platforms. Subsequently, the cost of energy for
the renewable devices is compared and contrasted against the cost of energy for the fossil
fuels currently used by oil production companies, like ExxonMobil and GE.
10. Current Production Pricing
Every rig built is different, and so each rig operates with different machinery and makes use
of different technologies for their energy production. Despite this, the majority of operating
rigs make use of natural gas and diesel for generation. Whilst the fuel that rigs are receiving
is either subsidised or produced ‘in house’, western fuel prices are used here to put the fuel
usage into perspective. The fuel requirements for producing electricity for the living quarters,
and the fuel consumption of the production platform, were calculated for analysis.
10.1. Living Quarters
The total demand of the living quarters is solely electrical and is provided from an aero-
derivative gas turbine. The turbines efficiency and power output, as well as the cost of natural
gas, were used to estimate the cost of fuel in powering the living quarters of the sample
offshore rig. A daily fuel usage was calculated and a yearly average approximated.
The turbines run on the Angolan FPSO used 22MW dual fuelled gas turbines. Assuming
there are no re-heat cycles or CHP recovery in place, the efficiency of such a turbine
exclusively generating electricity would be around 40% [71]. With the load of Rig Strath’s
living quarters estimated around 500kW, the consumption of the living quarters in one day is
12MWh. The price of natural gas to consumers is 4.9p per kWh [72] and the price of diesel is
13p per kWh, taking the price per litre of diesel to be £1.38 [73] and using the ratio of
11kWh/litre of diesel [74]. Using the estimated efficiency of the turbine, it would require 2.5
times of each fuel to satisfy the 12MWh daily demand. Assuming the dual fuel gas turbine
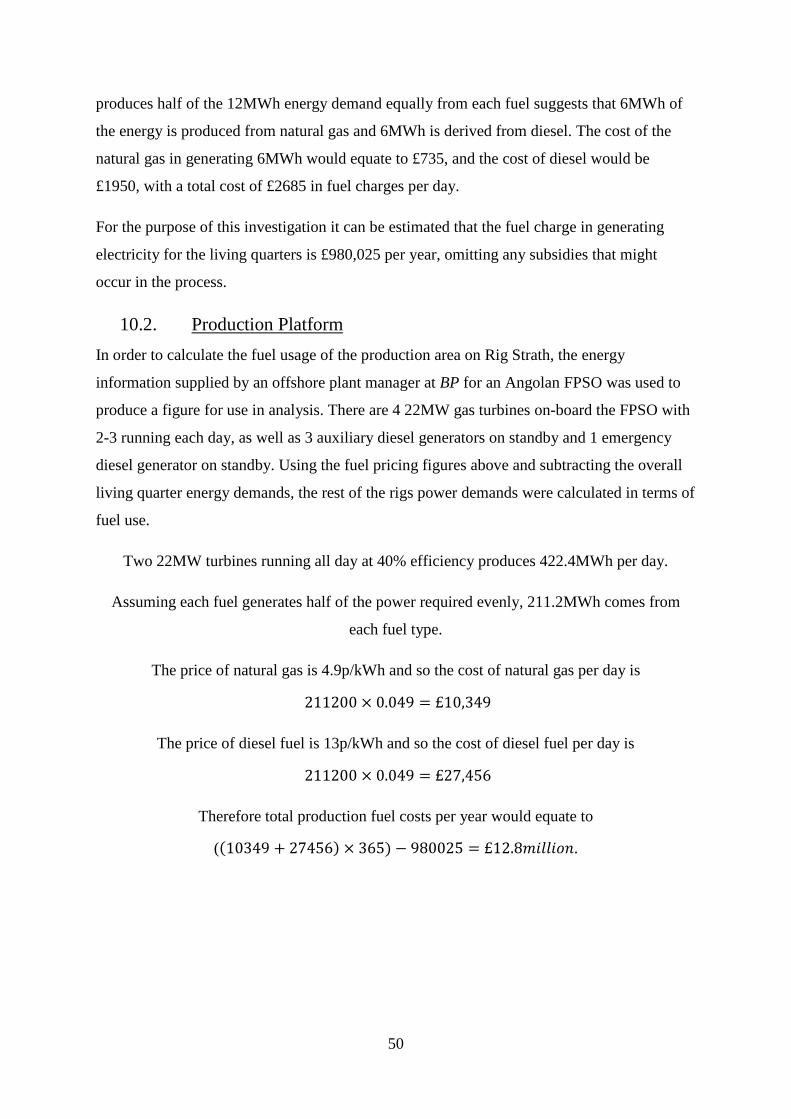
50
produces half of the 12MWh energy demand equally from each fuel suggests that 6MWh of
the energy is produced from natural gas and 6MWh is derived from diesel. The cost of the
natural gas in generating 6MWh would equate to £735, and the cost of diesel would be
£1950, with a total cost of £2685 in fuel charges per day.
For the purpose of this investigation it can be estimated that the fuel charge in generating
electricity for the living quarters is £980,025 per year, omitting any subsidies that might
occur in the process.
10.2. Production Platform
In order to calculate the fuel usage of the production area on Rig Strath, the energy
information supplied by an offshore plant manager at BP for an Angolan FPSO was used to
produce a figure for use in analysis. There are 4 22MW gas turbines on-board the FPSO with
2-3 running each day, as well as 3 auxiliary diesel generators on standby and 1 emergency
diesel generator on standby. Using the fuel pricing figures above and subtracting the overall
living quarter energy demands, the rest of the rigs power demands were calculated in terms of
fuel use.
Two 22MW turbines running all day at 40% efficiency produces 422.4MWh per day.
Assuming each fuel generates half of the power required evenly, 211.2MWh comes from
each fuel type.
The price of natural gas is 4.9p/kWh and so the cost of natural gas per day is
The price of diesel fuel is 13p/kWh and so the cost of diesel fuel per day is
Therefore total production fuel costs per year would equate to
(( ) ) .

51
11. Economic Analysis
The overarching aim of oil and gas companies is profit output; consequently any large cost
which can be avoided such as the installation of a large renewable energy device will often be
overruled if a cheaper option is viable. In order to compare renewable devices against the
industry preferred fossil fuel counterpart, the cost of energy for each device must be
calculated and compared to fossil fuel devices on-board the Angolan FPSO. The equation for
the cost of energy was obtained from Entec UK LTD’s report for the Carbon Trust [75]:
( ) ( ) ( )
( )
Equation 1 Cost of Energy
where PV indicates the present value over the service life.
This simple equation allows estimation of the cost of energy produced from installation of a
renewable energy device. However, other factors entailed in each of the three device costs are
more complicated. The capital costs of the project would require an initially vast investment,
followed by operation and maintenance (O&M) costs throughout the lifespan of the device. A
final, immediate and pre-planned investment is also required at the end of the device’s
lifespan for decommissioning. Table 7 shows the costs associated with the capital investment,
and Table 8 shows the costs associated with operation and maintenance of the renewable
device.
Table 7 Capital Costs Associated with Renewable Energy Project [75]
Capital Costs
Costs Incurred Components Involved
Structure Material Costs, Power Devices, Assembly
Mechanical & Electrical Energy Conversion Devices, Generators
Project Management Project Planning and Implementation
Mooring Steel structures, Weighted Anchors, Water Depth
Installation Ships to transport, Jack-ups, Lifting Devices
Grid Connection Cables, Transformers, Switchgear

52
Table 8 Operational & Maintenance Costs Associated with Renewable Energy [75]
Operation & Maintenance Costs
Costs Incurred Components Involved
Planned Maintenance
Cost of replacement parts
Cost of servicing vessels and personnel
Shutdown cost due to weather conditions on ability to service
device
Unplanned Maintenance
Cost of spares in case of failure
Cost of emergency replacement parts if not available
Cost of stand-by service equipment and personnel in case of
failure
Cost of emergency servicing and personnel
Shutdown costs incurred while waiting for repairs
The costs incurred at each stage vary from project to project, but it is often the case that the
structure and its mechanical and electrical components are often very costly in the production
process of the device. Figures 22 and 23 show an example cost breakdown for a sample wave
device given by Carbon Trust.
Figure 22 Capital Costs Associated with Installation of a Renewable Device [75]
29%
46%
2% 5%
15% 3%
Capital Costs
Structure
Mechanical & Electrical
Project Management
Mooring
Installation
Grid Connection

53
Figure 23 O&M Costs Associated with Installation of a Renewable Device [75]
To calculate the energy production required for the cost of energy equation, the capacity
factor of each device was applied to the rated power to obtain a yearly average power output.
For a more in depth analysis, weather data could be analysed and an average production
figure calculated for each device, after efficiencies and days without production were taken
into consideration. The most suitable energy devices were analysed and so the cost of energy
for the Wave Dragon and SurgeDrive wave devices were calculated, as well as an offshore
wind turbine of comparable size.
For analytical purposes, a generic O&M cost was applied to both wave devices, and a
separate O&M cost applied to the offshore wind turbine, although this would differ in actual
operation and currently these figures are not published. Operational and maintenance costs
for wave devices are expected to be substantial due to the conditions experienced in the ocean
environment. The forces experienced by wave devices during power generation coupled with
the corrosive nature of the ocean’s seas points towards high levels of maintenance. These
stressors could lead to device failures, requiring substantial funds for emergency repair and
personnel expenses. Although O&M stats for wave devices are not publicly available,
offshore oil platforms tend to have higher O&M costs than their onshore counterparts. At the
outset this means that wave devices are likely to be more costly due to their offshore nature.
The capital costs of each renewable device were estimated per kW, and so an energy cost
29%
28% 1%
14%
24%
4%
Operation & Maintenance Costs
Planned Maintenance
Unplanned Maintenance
Licences
Insurance
Refit
Monitoring

54
calculation could be carried out and a comparison made with that of the current production
costs utilising fossil fuels. In each case the lifespan of the renewable device has been
estimated at 20 years’ service life, to allow a breakdown of cost requirements on a yearly
basis.
In all cases, estimations have been made with reference to average energy figures and the
calculated energy prediction is of efficient and constant energy production year round. Real
time analysis is expected to show fluctuation of the figures produced. The costs are likely to
be more than suggested, with investment in storage for un-interrupted energy supply to the
living quarters, or adding cables and transformers for connection to the main grid.
11.1. Wind Turbine Analysis
Wind turbines which are based onshore and those which are offshore are a well-developed
technology. Resultantly technical figures are readily available online for their energy
production. Using the European Wind Energy Associations (EWEA) electricity cost calculator
[76], the data for a 2MW offshore wind turbine was derived from the results of a 10MW
turbine analysis. Table 9 shows the parameters for the turbine and the cost of energy results.
Table 9 Parameters and Cost of Energy of an Offshore Wind Turbine
Category Cost Component Data
Energy
Calculations
Installed Capacity (MW) 2
Capacity Factor (%) 35
Energy Produced in Year (MWh) 6,132
Inflation (%) 2
Discount Rate1 (%) 5.39
Years of Operation (Lifetime) 20
Technology Cost
Learning Rate2 (%) 5
Capital Cost (£/kW) 1,990
Percentage of Total Cost (%) 62.34
O&M O&M (£/kWh) 0.02
Percentage of Total Cost (%) 37.66
Result Cost of Electricity (£/kWh) 0.05

55
To confirm the results of the EWEA calculator’s results, the cost of energy was also
calculated using Equation 1 from the Carbon Trust.
A* - Average decommissioning costs of offshore wind turbine £40,000/MW, obtained from [77]
With reference to the current production pricing, the cost per kWh of energy from the dual
fuelled gas turbines is £0.223/kWh, 4 times more than the cost of energy from a 2MW wind
turbine. The average energy production of the wind turbine per year is more than enough to
satisfy the energy demand of the living quarters, with an excess of approximately 2GWh per
annum (p.a.). However, these figures are calculated with the assumption that the wind
conditions are always suitable for generation, which is not the case in operation, and so the
excess is more likely to be significantly less. Despite the actual energy produced totalling at a
lower amount, there will still be some excess. Consequently, storage options would have to
be investigated if the energy was to be utilised on-board, enabling constant power of the
living quarters during energy production troughs from the wind turbine.
The fuel costs of the living quarters is estimated at £980,025 p.a. Combining this figure with
the O&M costs for 20 years and its final decommissioning expenses gives a total figure of
£6,500,000 approximately. If the wind turbines function was solely to power the living
quarters of Rig Strath, the payback period of the wind turbine at the rate of fuel savings from
the renewable’s installation would be 6.6years, allowing for 13 years of potentially free clean
renewable energy production.

56
11.2. Wave Dragon Analysis
The size requirement of the Wave Dragon is dependent on the wave power per metre of
waves generated, and ranges from 4MW-15MW. The North Sea conditions yield a wave
power of 38kW/m on average, as depicted in Figure 24, and so the 7MW Wave Dragon is
best suited to these waters. Previous research conducted by Ian Fairley has demonstrated that
the capacity factor of the Wave Dragon device after testing was between 14-18% [78], in
comparison to the 35% capacity factor stated by Hans Soerenson [79], and so a capacity
factor of 16% was applied for calculation purposes, giving a yearly power output of 9.8GWh
for the Wave Dragon. Table10 shows the parameters of the Wave Dragon device and the cost
of energy results, calculated using Equation 1 (see page 49). Assuming capital costs from the
information available via the Wave Dragon developers, the capital cost of the Wave Dragon
is approximately £2.5Million/MW.
Figure 24 Average Global Wave Energy Flux Estimates in kW/m [80]
The maintenance costs of the wind turbine predicted by the EWEA calculator presented a
value of £0.02/kWh for an offshore wind turbine, equating to approximately £125,000 per
year of service life. The maintenance costs of WEC’s is assumed to be higher as the devices
function in the water and so are heavily exposed to corrosive salt water. In addition to this,
the wave Dragon will be subject to large forces from colliding waves and so a generic
maintenance cost for each wave device was set at approximately £300,000 p.a.

57
Table 10 Parameters and Cost of Energy of Wave Dragon
Category Cost Component Data
Energy
Calculations
Installed Capacity (MW) 7
Capacity Factor (%) 16
Energy Produced in Year (MWh) 9,811
Years of Operation (Lifetime) 20
Technology Cost Capital Cost (£/kW) 2,5001
Percentage of Total Cost (%) 74.51
O&M O&M (£/kWh) 0.031
Percentage of Total Cost (%) 25.49
Result Cost of Electricity (£/kWh) 0.12
1 Capital Cost obtained from Wave Dragon Presentation [79]
The cost of energy for the dual fuel turbines is 1.8 times that of an installed 7MW Wave
Dragon energy converter system. The average calculated energy production of the Wave
Dragon, if conditions were suitable every day, would produce over and above the energy
requirements of the living quarters. However, this estimation is based the assumption that the
Wave Dragon is constantly producing energy. The intermittency of the energy demand along
with the intermittency of wave energy generation would require storage for autonomous
energy supply to the living quarters. The daily load of the living quarters is 12MWh per day,
and the potential generation of the 7MW Wave Dragon is 26MWh per day. With constant
production in ideal conditions, there would be an excess load of 5GWh per year, and so
considerations for this excess would be required, adding to the final cost of the WEC. The
steady energy load of the production platform could utilise the excess energy supply of the
WEC, however the dips in power production would not be sufficient to allow the platform to
rely on the WEC for part of the production platforms energy supply, and so turbines of
suitable capacity would still have to be present on-board to supplement power dips.
With the fuel costs of the living quarters estimated at £980,025 yearly, the total cost of the
Wave Dragon over its 20 year life including O&M and decommissioning costs is

58
approximately £23,860,000. If the Wave Dragon’s function was solely to power the living
quarters of Rig Strath, the payback period of the WEC at the rate of fuel savings from the
renewable’s installation would be 24years, resulting in a debt period of 4 years after
decommissioning. Yet with a renewable technology of this size, there are various options for
the excess energy generated, thus reducing the payback period of the Wave Dragon over its
20 year service life.
11.3. SurgeDrive Analysis
The size requirement of the SurgeDrive system is only dependent on the consumer’s needs.
The SurgeDrive system is deployed as a wave farm and is expandable, so the system can
theoretically be retrofitted for power generation of any size.
AquaGen Technologies employed the help of Worley Parsons to perform a technical review
of their system, showing a cost of energy at 8-24cents/kWh (AUD) [81]. Manipulation of this
data against the 70MW wave farm to be deployed in Europe [82]gives a capital cost of
£2,665/kW. Fairley’s research found that the capacity factor of the SurgeDrive device after
testing was between 9-17% [78] and so a capacity factor of 15% was applied for calculation
purposes. Analysis of a 4MW wave farm using AquaGens SurgeDrive technology would
yield a yearly power output of 5.26GWh. Table 11 shows the parameters of the SurgeDrive
device and the cost of energy results, calculated using Equation 1.
As with the Wave Dragon, the maintenance costs of the SurgeDrive are likely to be higher
than the wind turbine as the device operates underwater and is heavily exposed to corrosive
salt water and stressful forces. Resultantly, the O&M costs of the SurgeDrive were estimated
at £300,000 per year.

59
Table 11 Parameters and Cost of Energy of SurgeDrive
Category Cost Component Data
Energy
Calculations
Installed Capacity (MW) 4
Capacity Factor (%) 15
Energy Produced in Year (MWh) 5,256
Years of Operation (Lifetime) 20
Technology Cost Capital Cost (£/kW) 2,665
Percentage of Total Cost (%) 64.36
O&M O&M (£/kWh) 0.057
Percentage of Total Cost (%) 35.64
Result Cost of Electricity (£/kWh) 0.16
The cost of energy from the dual fuel gas turbines is 1.4 times that of an installed 4MW
SurgeDrive wave farm. The average calculated energy production of the SurgeDrive,
assuming operational conditions occur year long, would more than satisfy the daily energy
demand of the living quarters. Again this is based on the assumption that there is constant
energy production from the SurgeDrive device, and the peaks in energy demand can be
satisfied with standard energy production from the wave farm. Like all renewable devices,
the issues associated with intermittent power production brings into question the reliability of
the SurgeDrive device as an autonomous energy system for the living quarters of Rig Strath.
Incorporation of the SurgeDrive’s output into the overall demands of the production platform
would allow for reasonable fossil fuel reduction, and with the 22MW gas turbines on-board,
there will be enough back power available if the WEC is not producing energy when
required. This would allow for the gas turbines to run at a lower capacity, with the option for
upping power output if necessary.
The total estimated cost of the SurgeDrive wave farm over its 20 year life including O&M
and decommissioning costs is approximately £16,800,000. If the SurgeDrive’s sole function
was to power the living quarters of Rig Strath the payback period of the SurgeDrive wave
farm at the rate of fuel consumption, i.e. £980,025 a year, would be 17.1years, allowing for
2.9 years of potentially free clean renewable energy production.
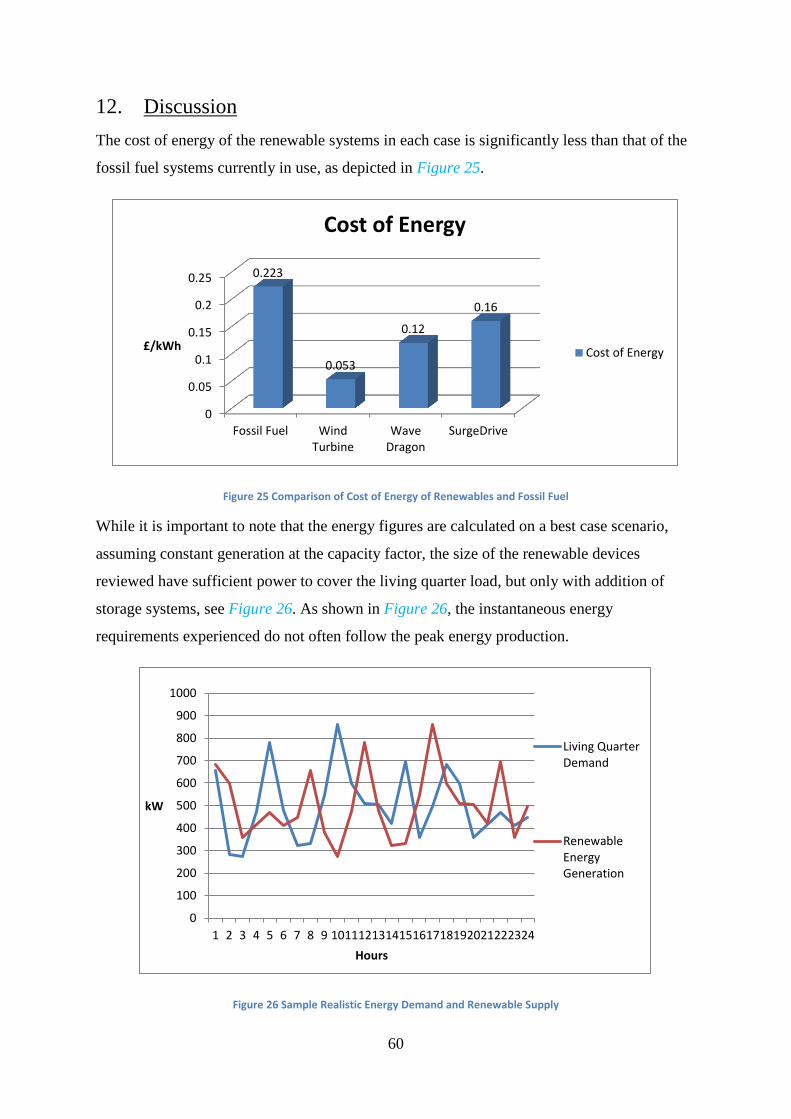
60
12. Discussion
The cost of energy of the renewable systems in each case is significantly less than that of the
fossil fuel systems currently in use, as depicted in Figure 25.
Figure 25 Comparison of Cost of Energy of Renewables and Fossil Fuel
While it is important to note that the energy figures are calculated on a best case scenario,
assuming constant generation at the capacity factor, the size of the renewable devices
reviewed have sufficient power to cover the living quarter load, but only with addition of
storage systems, see Figure 26. As shown in Figure 26, the instantaneous energy
requirements experienced do not often follow the peak energy production.
Figure 26 Sample Realistic Energy Demand and Renewable Supply
0
0.05
0.1
0.15
0.2
0.25
Fossil Fuel WindTurbine
WaveDragon
SurgeDrive
0.223
0.053
0.12
0.16
£/kWh
Cost of Energy
Cost of Energy
0
100
200
300
400
500
600
700
800
900
1000
1 2 3 4 5 6 7 8 9 101112131415161718192021222324
kW
Hours
Living QuarterDemand
RenewableEnergyGeneration

61
The majority of the electrical load is heating, and so hot water storage options could be
utilised as a simple and cheap storage system for the living deck. This is on the basis that the
heating system on-board the rig is a hot water system. For hot water storage tanks, the useful
energy storage is dependent on the temperature the tank is maintained at. The useful energy
storage potential of a 500L tank with an average temperature of 60°C is approximately
11.3kWh, whereas the same tank with an average temperature of 80°C is 23kWh [83]. Each
floor of Rig Strath could accommodate one of these storage tanks, or alternatively a larger
tank could be used as storage for the entire living quarters giving sufficient heat capacity
when required.
Electrical storage options for use offshore are restricted. Onshore there are many
environmentally friendly storage options like pumped hydro, or compressed hydrogen, but
offshore space limitations are very strict, and so if storage options are going to be utilised
sacrifices have to be made. Higher efficiency batteries utilise precious metals and as a result
are considerably more costly [84], so it is more common that lead acid batteries are used.
Lead Acid batteries are the oldest form of rechargeable battery, and despite advances in the
technology making use of different metals, the lead acid battery is still an efficient and cheap
storage option. However making use of batteries for storage only exacerbates the
environmental issues associated with offshore rigs.
In situations where the power produced far surpasses the requirements of the living quarters,
it has to be assessed whether this excess energy will be utilised on the production deck of the
rig or if it is better to transport the energy produced back on land for integration into the
national grid. With the cabling in place for transferring the renewable energy generated to the
living quarters, it would be financially viable to make use of this excess energy on-board the
rig. However the intermittency of power generation experienced with all renewables and the
importance of consistent power supply on the production platform means that this is not a
suitable option for offshore rigs. Transportation of the excess energy generated on land for
integration into the national grid would be the financially viable option if required.
If an offshore rig was to integrate a renewable energy system, the carbon emissions of that rig
would decrease as less fossil fuel would be required. The CO2 reduction in substituting fossil
fuels for renewable energies can be vast. If the renewables were to take over supply of the
living decks energy needs, the energy savings from fossil fuels would be 12MWh daily, and
4.28GWh per year. The amount of CO2 produced per kWh can be calculated by multiplying

62
the CO2 emissions factor of that fuel by the efficiency of the generator, and dividing the
result by 1,000,000 [85]. 0.55 kilograms (kg) of CO2 is produced for every kWh of natural
gas combusted, and 0.76kg of CO2 is produced when consuming 1kWh of diesel. The
efficiency of the turbine means that more fuel has to be combusted to achieve the required
energy, and so 1.375kg of CO2 is produced for every kWh of useful energy from natural gas
and 1.9kg of CO2 is created from 1kWh of useful energy from diesel. This results in addition
of 0.0029 metric tonnes (Mt) of CO2 to the atmosphere every year. This may seem to be an
extremely small amount, but the living quarter demands only account for 2.7% of the total
energy demands of the sample rig, which would produce approximately 0.107Mt of CO2 per
year in its operations. When considered that the total CO2 emission allocation for offshore Oil
and Gas in the UK is 18.1Mt/year [86], the benefits of this reduction can be understood. This
is just a small portion of the carbon emissions of offshore oil rigs, but if this amount can be
reduced by addition of renewables to one rig, it shows the benefit and importance of
renewables for power generation.

63
13. Conclusion
On reviewing the renewable modification’s which exist in the oil and gas industry, it was
found that very few of these solutions are deployed in practice. After analysing various
renewable devices and conducting an economic analysis for their suitability in the oil
industry, it was found that renewables can be integrated as a sufficient source of power for
offshore oil platforms. However, the renewable devices alone cannot be relied upon for
power generation and so storage devices would be required to ensure constant power, or the
availability of substantial backup power on standby.
Whilst it is apparent that there are factors which restrict the use of renewables as a power
supply for offshore oil platforms, cost is not one of them, with the cost of energy from the
renewables analysed less than the current fossil fuel systems. The variety of climates around
the world which harbour oil enables a variety of renewables to be utilised for power
generation in the most remote of locations. Whilst some of these technologies might not be
the most efficient source of generation at present, technology is continually advancing, and
the benefits that can be reaped from renewable devices can be plentiful. The oil and gas
industry is not disappearing anytime soon, however these industries should work to ease their
environmental impact on the world by reducing carbon emissions, a goal that is achievable
through adaptation and integration of renewables.

64
References
[1] W. He, K. Uhlen, M. Hadiya, Z. Chen, G. Shi and E. d. Rio, "Case Study of Integrating an Offshore Wind Farm with
Offshore Oil and Gas Platforms and with an Onshore Electrical Grid," Journal of Renewable Energy, vol. 2013,
2013.
[2] M. L. Kolstad, A. R. Ardal, D. I. K. Sharifabadi and P. T. M. Undeland, "Grid Integration of Offshore Wind Power
and Multiple Oil and Gas Platforms," Trondheim.
[3] "Riding the North Sea price waves: turbulent times for Brent crude," 2012. [Online]. Available: www.offshore-
technology.com/features/featurenorth-sea-price-turbulent-times-brent-crude/featurenorth-sea-price-
turbulent-times-brent-crude-3.html. [Accessed 2014].
[4] "Cruise Ship Fuel Consumption," [Online]. Available: http://www.shipcruise.org/cruise-ship-engine-propulsion-
fuel/.
[5] "Cummins dual fuel engines," [Online]. Available: http://cumminsengines.com/dual-fuel.
[6] Dual Fuel Orginization, "Converting Diesel Engines to Bi_Fuel," [Online]. Available:
http://www.dualfuel.org/technology/converting-diesel-engines-to-dual-fuel/.
[7] Offshore technology, "Sanha / Bomboco Development, Angola," 2011. [Online]. Available: http://www.offshore-
technology.com/projects/sanha/.
[8] Capstone, "10 Things You Didn't Know About Microturbines," [Online]. Available:
http://www.cogeneration.org/111011Conf/Presentations/McAvoy.pdf.
[9] C. T. Corporation, "Turning Waste into Power," [Online]. Available:
http://www.capstoneturbine.com/prodsol/solutions/rrbiogas.asp.
[10
]
U.S. Energy Information Administration , "International Energy Statistics," [Online]. Available:
http://www.eia.gov/cfapps/ipdbproject/iedindex3.cfm?tid=5&pid=53&aid=1&cid=ww,&syid=2013&eyid=2013&
unit=TBPD.
[11
]
Oil & Gas UK, "Environment Report 2013," London, 2013.
[12
]
Beacon, "What is a Greenhouse Gas?," [Online]. Available: http://beacon.berkeley.edu/GHGs.aspx.
[13
]
J. Palsson, A. Selimovic and L. Sjunnesson, "Combined solid oxide fuel cell and gas turbine systems for efficient
power and heat generation," Journal of Power Sources, vol. 86, no. 1-2, pp. 42-448, 2000.
[14
]
Ocean Portal and Smithsonian National Museum of Natural History, "Gulf Oil Spill," http://ocean.si.edu/gulf-oil-
spill.

65
[15
]
The Telegraph and E. Gosden, "BP warns Gulf spill costs will exceed $42.4bn as compensation costs rise," 2013.
[16
]
The Financial Times and E. Crooks, "BP warns of ‘staggering’ oil spill compensation costs," New York, 2014.
[17
]
Clarke Energy and GE, "Associated Petroleum Gas/ Flare Gas," [Online]. Available: http://www.clarke-
energy.com/gas-type/associated/.
[18
]
[Online]. Available: http://www.thecyberhawk.com/inspections/offshore-oil-gas/.
[19
]
J. Hong, C. Baukel, M. Bastianen, J. Bellovich, K. Leary and John Zink Company, "New steam assissted flare
technology," pp. 1-5.
[20
]
J. Z. C. LLC, "Refining & Petrochemical Flares," 2004.
[21
]
ChemEngineering, "Gas Flares," [Online]. Available: http://chemengineering.wikispaces.com/Gas+flares.
[22
]
"Flare Stack System," 2012. [Online]. Available:
http://en.wikipedia.org/wiki/Gas_flare#mediaviewer/File:FlareStack_System.png.
[23
]
Oil and Gas Industries, "Flaring and Venting," [Online]. Available: http://oilandgas.livingearth.org.uk/key-
challenges/flaring-and-venting/.
[24
]
Gazprom Informatorium, "What is associated petroleum gas," [Online]. Available:
http://www.gazprominfo.com/articles/associated-gas/.
[25
]
[Online]. Available: http://www.gazprominfo.com/f/ru/global/i/articles/article_17/lens2b.png.
[26
]
O. S. Ismail and G. E. Umukoro, "Global Impact of Gas Flaring," Energy and Power Engineering, no. 4, pp. 290-
302, 2012.
[27
]
T. J. Blasing, "Recent Greenhouse Gas Concetrations," Cardon Dioxide Information Analysis Center, 2014.
[28
]
TEEIC and Tribal Energy and Environmental Information, "Potential Impacts of Oil and Gas Production".
[29
]
Defender of Wildlife, "Outer Continental Shelf Drilling".
[30
]
H. G. Svendsen, E. V. Oyslebo, M. Hadiya and K. Uhlen, "Integration of offshore wind farm with multiple oil and
gas platforms".

66
[31
]
Global Hunter Securities and Mike Kelly, "Thought of the Day: Converting diesel powered drilling rigs to natural
gas," 2012.
[32
]
renewableUK, "UK Wind Energy Database (UKWED)," [Online]. Available:
http://www.renewableuk.com/en/renewable-energy/wind-energy/uk-wind-energy-database/.
[33
]
Miller Dome, "About the Miller Platform," [Online]. Available: http://www.millerdome.co.uk/.
[34
]
G. Hassan, "Cost of energy of floating wind," [Online]. Available: http://www.gl-
garradhassan.com/assets/downloads/Cost_of_energy_of_floating_wind.pdf.
[35
]
S. Energy, "Off-Grid Power," 2011. [Online]. Available: http://www.seldonenergy.com/.
[36
]
WhisperPower. [Online]. Available: http://www.whisperpower.com/1/home.html.
[37
]
NAM, "Our History," 2013. [Online]. Available: http://www.nam.nl/en/about-nam/our-history.html.
[38
]
British Petroleum, "Liquefied Natural Gas," [Online]. Available:
http://www.bp.com/en/global/corporate/products-and-services/liquified-natural-gas.html.
[39
]
Capstone Turbine Corporation, "C65 Microturbine," [Online]. Available:
http://www.capstoneturbine.com/_docs/datasheets/C65%20Oil%20&%20Gas_331040F_lowres.pdf.
[40
]
"Combined Heat and Power Using Turbines," [Online]. Available: http://i-
dacta.digibel.be/pages/turbines.php?param=en.
[41
]
J. R. Koren, "Gas, Oil PowerTurbine Maker," Los Angeles Business Journal, vol. 34, no. 32, p. 41, 2012.
[42
]
T. J. Price, "Jamies Blyth - Britain's first modern wind power pioneer," Wind Engineering, vol. 29, pp. 191-200,
2005.
[43
]
Enercon, "E-126 / 7,580 kW," [Online]. Available: http://www.enercon.de/en-en/66.htm.
[44
]
AMSC, "SeaTitan 10MW Wind Turbine," Massachusetts.
[45
]
U.S. Energy Information Administration, "International Energy Statistics," 2013. [Online]. Available:
http://www.eia.gov/countries/data.cfm.
[46
]
Marine Current Turbines, "Tidal Energy," [Online]. Available: http://www.marineturbines.com/Tidal-Energy.

67
[47
]
Ocean Explorer, "Predicting the Tides," 2013. [Online]. Available:
http://oceanexplorer.noaa.gov/edu/learning/10_tides/activities/predicting_tides.html.
[48
]
Yachting Monthly, "How to Work out the Tidal Stream," 2012.
[49
]
Pelamis, "Pelamis P2," [Online]. Available: http://www.pelamiswave.com/image-library.
[50
]
Wave Dragon, "Principles," [Online]. Available:
http://www.wavedragon.net/index.php?option=com_content&task=view&id=6&Itemid=5.
[51
]
"Ocean Energy Classification," [Online]. Available:
http://ikionrenewableenergy.files.wordpress.com/2010/02/6.jpg.
[52
]
AquaGen Technologies, "SurgeDrive," [Online]. Available:
http://www.aquagen.com.au/technologies/surgedrive.
[53
]
"Offshore Accomodation Module," [Online]. Available:
http://www.worldoils.com/marketplace/equipdetails.php?id=486.
[54
]
"Sikorsky S-61N," [Online]. Available: http://en.wikipedia.org/wiki/Sikorsky_S-61.
[55
]
D. L. Gautier, "Kimmeridgian Shales Total Petroleum System of the North Sea Graben Province," Reston, VA,
2005.
[56
]
R. Priyadarsini, W. Xuchao and L. S. Eang, "A study on energy performance of hotel buildings in Singapore,"
Energy and Buildings, no. 41, pp. 1319-1324, 2009.
[57
]
TransOcean, "Sovereign Explorer Specifications," [Online]. Available:
http://www.deepwater.com/Documents/RigSpecs/Sovereign%20Explorer.pdf.
[58
]
Skytruth. [Online]. Available: http://blog.skytruth.org/2011_04_01_archive.html.
[59
]
EIA, "World Maps," May 2013. [Online]. Available:
http://www.eia.gov/analysis/studies/worldshalegas/images/fig1map_large.jpg.
[60
]
BERR, "Atlas of UK Marine Renewable Energy Resources," Crown Copyright, 2008.
[61
]
Contemporary Energy, "Yearly total of global horizontal irradiation [kWh/m2]," 9 Jun 2010. [Online]. Available:
http://www.contemporaryenergy.co.uk/picts/solarMap2.png.
[62
]
The Weather Channel, "Monthly Averages for Gulf of Mexico," 2014. [Online]. Available:
http://www.weather.com/weather/wxclimatology/monthly/graph/26894:21.

68
[63
]
SolarGIS, "Global Horizontal Irradiation USA Mainlands," GeoModel Solar, 2013.
[64
]
Oil & Gas Journal, "Hurricane Preparedness," 29 July 2013. [Online]. Available:
http://www.ogj.com/articles/print/volume-111/issue-7d/regular-features/journally-speaking/hurricane-
preparedness.html.
[65
]
Rigzone, "Special Report: Hurricane Katrina Damage Assessment," 02 September 2005.
[66
]
P. Greenacre, R. Gross and P. Heptonstall, "Great Expectations: The cost of offshore wind in UK waters -
understanding the past and projecting the future," UK Energy Research Centre, 2010.
[67
]
Shell, "Wind and sum power one-legged platform," [Online]. Available: http://www.shell.com/global/future-
energy/innovation/inspiring-stories/monotower.html.
[68
]
Renewable Energy World, "When Renewables Meet the Oil and Gas Industry, Opposites Attract," 2014. [Online].
Available: http://www.renewableenergyworld.com/rea/news/article/2014/04/when-renewables-meet-the-oil-
and-gas-industry-opposites-attract.
[69
]
Bureau of Ocean Management, "Offshore Wind Energy," 2014. [Online]. Available:
http://www.boem.gov/renewable-energy-program/renewable-energy-guide/offshore-wind-energy.aspx.
[70
]
Forbes, "The World's Biggest Public Companies," July 2014. [Online]. Available:
http://www.forbes.com/global2000/.
[71
]
General Electric Company, "LM2500 Gas Turbine Fact Sheet," 2013.
[72
]
Biomass Energy Centre, "Fuel Cost per kWh," [Online]. Available:
http://www.biomassenergycentre.org.uk/portal/page?_pageid=75,59188&_dad=portal.
[73
]
"The Price of Fuel," 2013. [Online]. Available: http://www.petrolprices.com/the-price-of-fuel.html.
[74
]
Carbon Trust, "Conversion Factors," 2013.
[75
]
Entec UK Ltd, "Cost Estimation Methodology: The Marine Energy Challange approach to estimating the cost of
energy produced by marine energy systems," 2006.
[76
]
EWEA, "European Wind Energy Association Cost Calculator," 2013. [Online]. Available:
http://www.ewea.org/policy-issues/economics/.
[77
]
Climate Change Capital, "Offshore Renewable Energy Installation Decommissioning Study".
[78 I. Fairley, "Wave Resources in South Wales and a Comparison with Wave Climate at the Wave Hub," Marine

69
] Energy Research Group, Swansea, 2012.
[79
]
H. C. Soerensen, "Wave Dragon," 2006. [Online]. Available:
http://ec.europa.eu/research/energy/pdf/gp/gp_events/ocean_energy/1010_wave_dragon_en.pdf.
[80
]
Renewable Energy Holdings plc, "Wave Energy," 2013. [Online]. Available: http://www.reh-
plc.com/technology_wave_energy.asp.
[81
]
AquaGen Technologies, "Worley study reports that SurgeDrive will be competitive with wind and solar," 2012.
[Online]. Available: http://www.aquagen.com.au/press/latest-news/51-worley-report-indicates-that-surgedrive-
will-be-competitive-with-wind-and-solar.
[82
]
AquaGen Technologies, "Agreement signed for 70Mw wave farm in Southern Europe," 2014. [Online]. Available:
http://www.aquagen.com.au/press/latest-news/43-agreement-signed-for-70mw-wave-farm-in-southern-
europe.
[83
]
L. R. Perez, J. B. Copeland, J. S. MacDonald, S. Vivaudou and A. Girona, "Load Shifting Utilising Thermal Storage,"
2014. [Online]. Available: http://www.esru.strath.ac.uk/EandE/Web_sites/13-
14/Findhorn/heatingsystems.html#LoadShiftingUtilisingThermalStorage.
[84
]
Battery University, "Cost of Power," [Online]. Available:
http://batteryuniversity.com/learn/article/cost_of_power.
[85
]
U.S. Energy Information Administration, "How much carbon dioxide is produced per kilowatthour when
generating electricity with fossil fuels?," April 2014. [Online]. Available:
http://www.eia.gov/tools/faqs/faq.cfm?id=74&t=11.
[86
]
S. Gomersall and A. James, "Oil and Gas Emissions: A Carbon and Storage Perspective," 2009.

70
Appendix A – Energy Demands of FPSO and Sample Rig

71

72
Appendix B – Cost of Energy of Renewables

73

74