Proteomics: A Challenge for Technology and Information Science CBCB Seminar, November 21, 2005 Tim...
22
Proteomics: A Challenge for Technology and Information Science Seminar, November 21, 2005 riffin Biochemistry, Molecular Biology and Biophysics [email protected]
-
date post
21-Dec-2015 -
Category
Documents
-
view
214 -
download
0
Transcript of Proteomics: A Challenge for Technology and Information Science CBCB Seminar, November 21, 2005 Tim...

Proteomics: A Challenge for Technology and Information Science
CBCB Seminar, November 21, 2005Tim GriffinDept. Biochemistry, Molecular Biology and [email protected]

What is proteomics?
“Proteomics includes not only the identification
and quantification of proteins, but also the
determination of their localization, modifications,
interactions, activities, and, ultimately, their
function.”
-Stan Fields in Science, 2001.
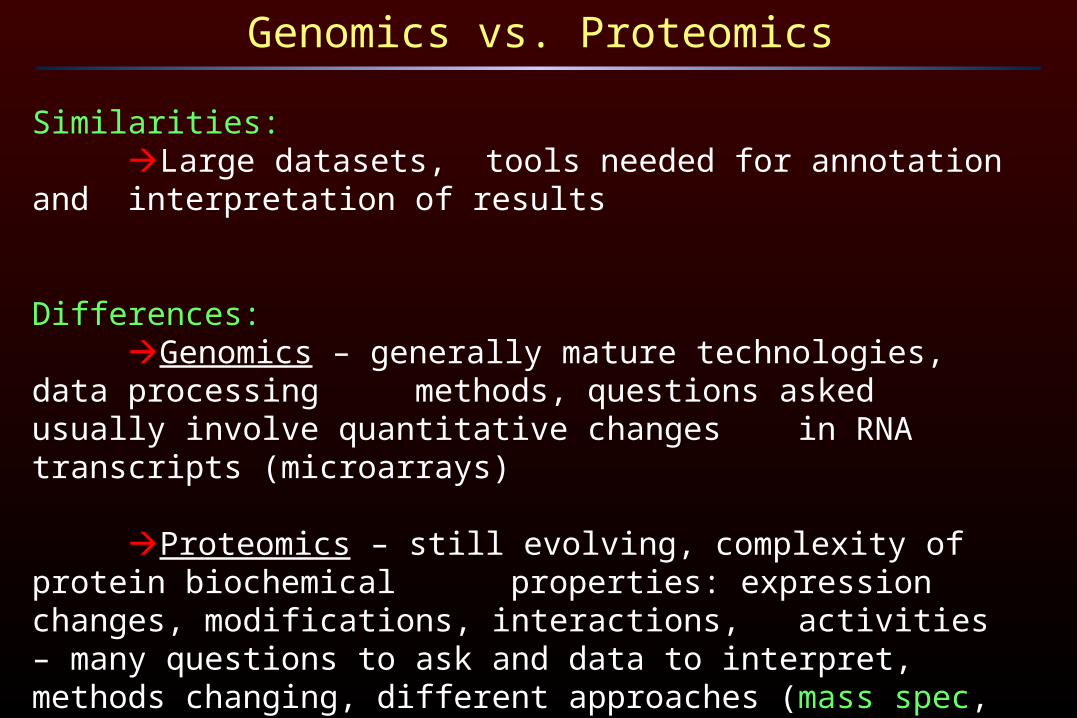
Genomics vs. Proteomics
Similarities: Large datasets, tools needed for annotation and
interpretation of results
Differences: Genomics – generally mature technologies, data processing methods, questions asked usually involve quantitative changes in RNA transcripts (microarrays)
Proteomics – still evolving, complexity of protein biochemical properties: expression changes, modifications, interactions,
activities – many questions to ask and data to interpret, methods changing, different approaches (mass spec, arrays etc.),

Genomics, Proteomics, and Systems Biology
mat
ure
pr
otot
ype
em
ergi
nggenomic
DNAmRNA
sequencingarrays
genomics
proteincataloguing
protein products
functionalprotein
quantitativeprofiling
protein phosphorylation
Protein dynamics
ProteinModifications
sub cellularlocation
catalytic activity
descriptive proteininteraction maps
3D structure
proteomics
measure and defineproperties
system
identifysystem
components
interactionsbetween
components
computational biology

Protein(s)
Digestion
µLCseparation
(50-100 um)
Tandem mass spectrum(thousands in a matter of hours)
“Shotgun” identification of proteins in mixtures by LC-MS/MS
Liquid chromatography coupled to tandem mass spectrometry (MS/MS)
Ionization:MALDI
orElectrospray
Isolation Fragmentation MassAnalysis
peptidefragments
peptides++
+
+
++
+++
+
++
++++ ++
++
+
+
+
++++ +
m/z

200200 400400 600600 800800 10001000 12001200m/zm/z
Rel
ativ
e A
bund
ance
Rel
ativ
e A
bund
ance
Peptide sequence determination from MS/MS spectra
H2N-N--S--G--D--I--V--N--L--G--S--I--A--G--R-COOHb2 b3 b4 b5 b6 b7 b8 b9 b10b11 b12 b13 b14b1
y13 y12 y11 y10 y9 y8 y7 y6 y5 y4 y3 y2 y1y14
Collision-induced dissociation (CID) creates two prominent ion series:
y-series:
b-series:

HH22NN-NSGDIVNLGSIAGR--NSGDIVNLGSIAGR-COOHCOOH
200200 400400 600600 800800 10001000 12001200m/zm/z
Rel
ativ
e A
bund
ance
Rel
ativ
e A
bund
ance
LGSIAGRLGSIAGR
GSIAGRGSIAGR
SIAGRSIAGR
IAGRIAGR
AGRAGRGRGRRR
NLGSIAGRNLGSIAGRVNLGSIAGRVNLGSIAGRIVNLGSIAGRIVNLGSIAGRDIVNLGSIAGRDIVNLGSIAGRGDIVNLGSIAGRGDIVNLGSIAGR
Peptide sequence identifies the protein
YMR134W, yeast protein involved in iron metabolism

High-throughput protein identification by LC-MS/MS and automated sequence database searching
Protein sequence and/or DNA sequence database search
HH22NN--NSGDIVNLGSIAGRNSGDIVNLGSIAGR--COOHCOOH
200200 400400 600600 800800 10001000 12001200m/zm/z
Rela
tive A
bu
nd
ance
Rela
tive A
bu
nd
ance
LGSIAGRLGSIAGR
GSIAGRGSIAGR
SIAGRSIAGRIAGRIAGR
AGRAGRGRGRRR
NLGSIAGRNLGSIAGRVNLGSIAGRVNLGSIAGRIVNLGSIAGRIVNLGSIAGRDIVNLGSIAGRDIVNLGSIAGRGDIVNLGSIAGRGDIVNLGSIAGR
200200 400400 600600 800800 10001000 12001200m/zm/z
Rela
tive A
bun
dance
Rela
tive A
bun
dance
200200 400400 600600 800800 10001000 12001200m/zm/z
Rela
tive A
bun
dance
Rela
tive A
bun
dance
Raw MS/MS spectrum
Peptide sequence match
Direct identification of 1000+ proteins from complex mixtures
Protein identification
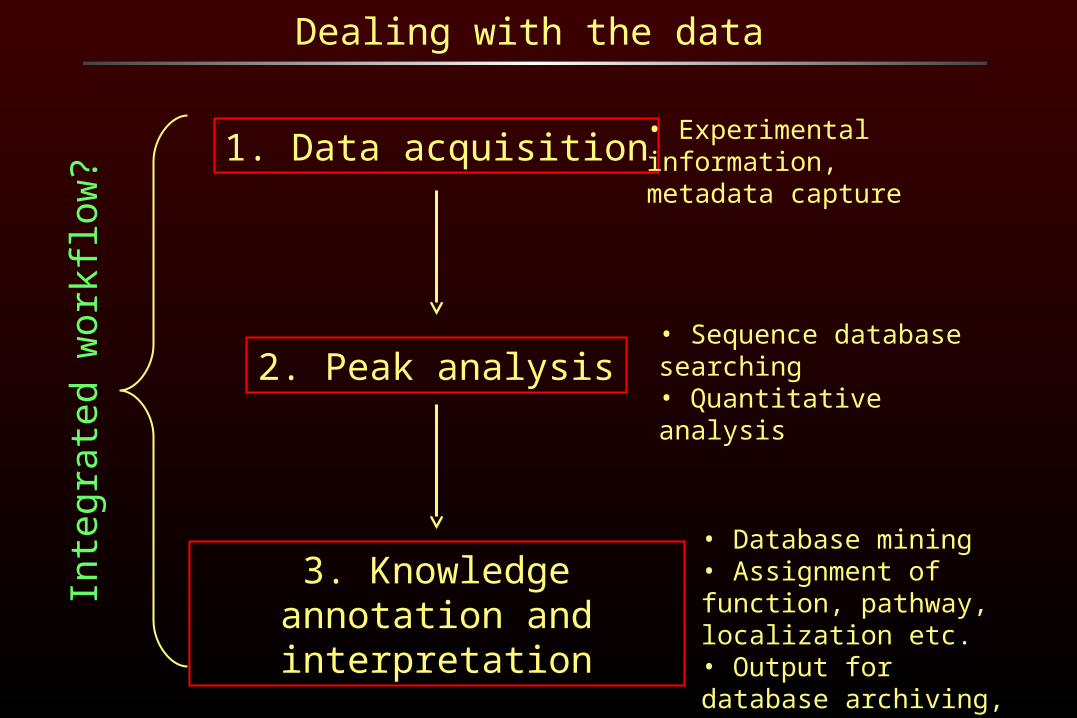
Dealing with the data
1. Data acquisition
2. Peak analysis
3. Knowledge annotation and interpretation
• Experimental information, metadata capture
• Sequence database searching• Quantitative analysis
• Database mining• Assignment of function, pathway, localization etc.• Output for database archiving, publication
Inte
grat
ed w
orkf
low
?

1. Data acquisition: capturing experimental information
Proteomics Experimental Data Repository(PEDRo)
Proposed schema
• Similar to genomic needs, but experimental info a bit different

2. Peak Analysis
ProFound Mascot PepSea MS-Fit MOWSE Peptident Multident Sequest PepFrag MS-Tag
200200 400400 600600 800800 10001000 12001200m/zm/z
Rel
ativ
e A
bund
ance
Rel
ativ
e A
bund
ance
Protein identification
Computational algorithms for searching MS/MS spectra against protein sequence databases, mRNA sequences, DNA sequences
• need cpu horsepower (parallel computing)

2. Peak Analysis: data formats
Format 1 Format 3Format 2
Output 1 Output 2 Output 3
• Lack of flexibility• Slow to evolve• Lack of incorporation of competing products, methods
? ?

2. Peak Analysis: need general, flexible, in-house solutions
Format 1 Format 3Format 2
General tools for analysis of multiple data formats
reverse engineering of data formats

2. Peak Analysis; reverse engineering data formats
http://sashimi.sourceforge.net/software_glossolalia.html

2. Peak analysis: quality control of protein matches
Unfiltered – 105+ matches (lots of noise and junk)
Filtered – thousands of “true” matches
filtering
• Statistical analysis of database results (tools are available)
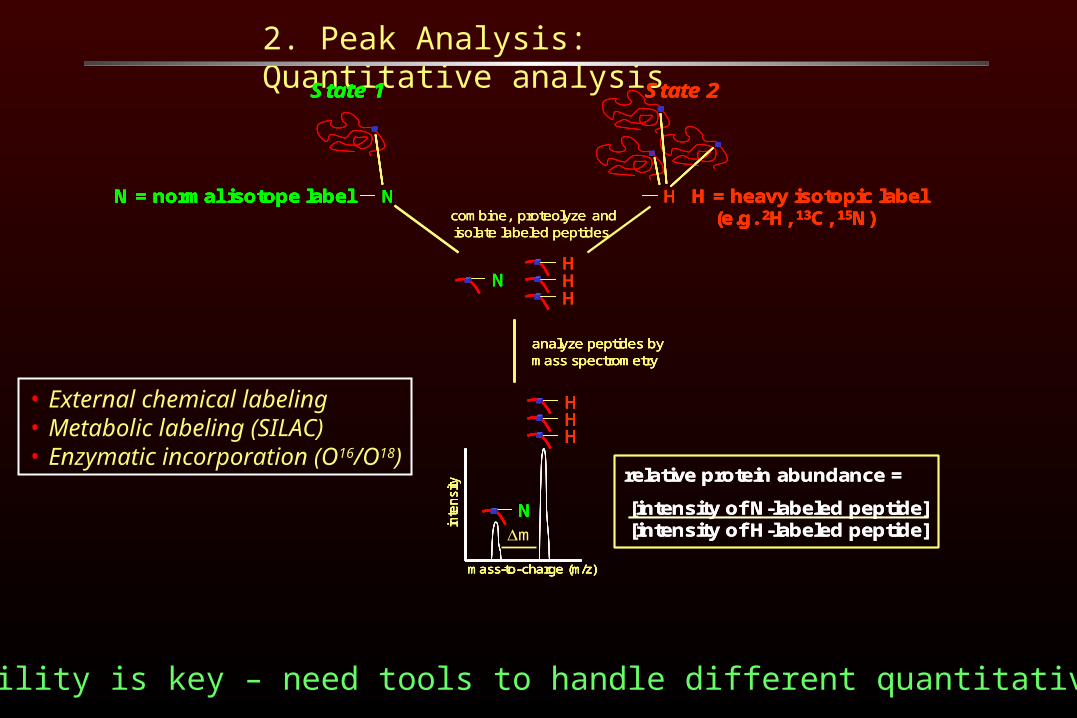
2. Peak Analysis: Quantitative analysis
combine, proteolyze and isolate labeled peptides
NHHH
combine, proteolyze and isolate labeled peptides
NHHH
NNHHHHHH
combine, proteolyze and isolate labeled peptides
State 1 State 2
N HN = normal isotope label H = heavy isotopic label(e.g. 2H, 13C, 15N)
State 1 State 2
N HN = normal isotope label H = heavy isotopic label(e.g. 2H, 13C, 15N)
State 1 State 2
N HN = normal isotope label H = heavy isotopic label(e.g. 2H, 13C, 15N)
N HN HN = normal isotope label H = heavy isotopic label(e.g. 2H, 13C, 15N)
inte
nsi
ty
mass-to-charge (m/z)
inte
nsi
ty
mass-to-charge (m/z)
analyze peptides by mass spectrometry
N
HHH
inte
nsi
ty
mass-to-charge (m/z)
analyze peptides by mass spectrometry
NN
HHHHHH
relative protein abundance =
[intensity of N-labeled peptide][intensity of H-labeled peptide] in
ten
sity
mass-to-charge (m/z)
analyze peptides by mass spectrometry
N
HHH
inte
nsi
ty
mass-to-charge (m/z)
analyze peptides by mass spectrometry
NN
HHHHHH
relative protein abundance =
[intensity of N-labeled peptide][intensity of H-labeled peptide] m
• Flexibility is key – need tools to handle different quantitative methods
• External chemical labeling• Metabolic labeling (SILAC)• Enzymatic incorporation (O16/O18)

2. Peak Analysis: Quantitative analysis
+TOF MS: 20 MCA scans from mm_sample.wiffa=3.56145059693694800e-004, t0=6.89652636903192620e+001
Max. 274.0 counts.
1914 1916 1918 1920 1922 1924 1926 1928 1930 1932 1934m/z, amu
0
20
40
60
80
100
120
140
160
180
200
220
240
260
274
In
te
ns
ity
, c
ou
nts
1926.0240
1927.0231
1928.0203
1917.9946 1929.03221916.9909
1918.99241930.01761920.0007
1924.98031931.00771921.0165
Sample 1
Sample 2
Relative intensity =
relative protein abundance

Evolving methodologies: iTRAQ
iTRAQ label: +114 +115 +116 +117
Multidimensional separation
114 116115 117m/z
Inte
nsi
ty
Digest to peptides
Digest to peptides
Digest to peptides
Digest to peptides
Diagnostic ions used for quantitative analysis
Peptide fragments used for sequence identification
MS/MS spectrum
Sample: 1 2 3 4
213
4
• 4-way multiplexing: simultaneous comparison of multiple states, replicates

+TOF MS: 20 MCA scans from mm_sample.wiffa=3.56145059693694800e-004, t0=6.89652636903192620e+001
Max. 274.0 counts.
1914 1916 1918 1920 1922 1924 1926 1928 1930 1932 1934m/z, amu
0
20
40
60
80
100
120
140
160
180
200
220
240
260
274
In
te
ns
ity
, c
ou
nts
1926.0240
1927.0231
1928.0203
1917.9946 1929.03221916.9909
1918.99241930.01761920.0007
1924.98031931.00771921.0165
Sample 1
Sample 2
Need for “changeable” tools
116.0972
115.0963117.1025
114.1005
Inte
nsity
1
2 4
3“old”
“new”
Automated analysis tools?

3. Knowledge annotation: making sense of lists of data

3. Knowledge annotation: mining proteomic/genomic databases

3. Knowledge annotation: needs
• Annotation: accession numbers and protein names• Functional assignments (functional degeneracy?)• Pathway assignments• Subcellular localization• Disease implications• Comparison of different proteomic datasets (i.e. expression profiles
compared to modification state profiles, other protein properties)
Automated and streamlined??
• Publication and deposit in databases• Visualization of complex phenomena, interpretation of
biological relevance• Modeling, integration with genomics data – computational
and systems biology