Prote-OMIC Data Analysis and Visualization
32
Dmitry Grapov, PhD Multivariate Analysis and Visualization of ProteOmic Data
-
Upload
dmitry-grapov -
Category
Science
-
view
1.256 -
download
3
description
Introductory lecture to multivariate analysis of proteomic data. Material from the UC Davis 2014 Proteomics Workshop. See more at: http://sourceforge.net/projects/teachingdemos/files/2014%20UC%20Davis%20Proteomics%20Workshop/
Transcript of Prote-OMIC Data Analysis and Visualization

Dmitry Grapov, PhD
Multivariate Analysis and Visualization of ProteOmic Data

State of the art facility producing massive amounts of biological data…
>20-30K samples/yr>200 studies
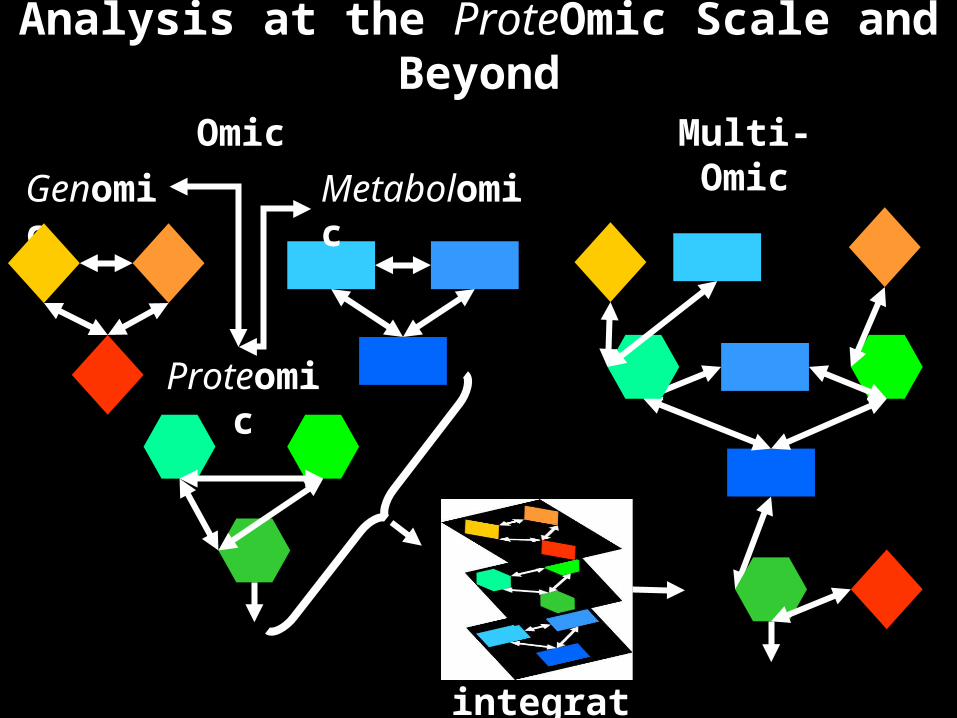
Analysis at the ProteOmic Scale and Beyond
Genomic
Proteomic
MetabolomicMulti-OmicOmic
integration

Sam
ple
Variable
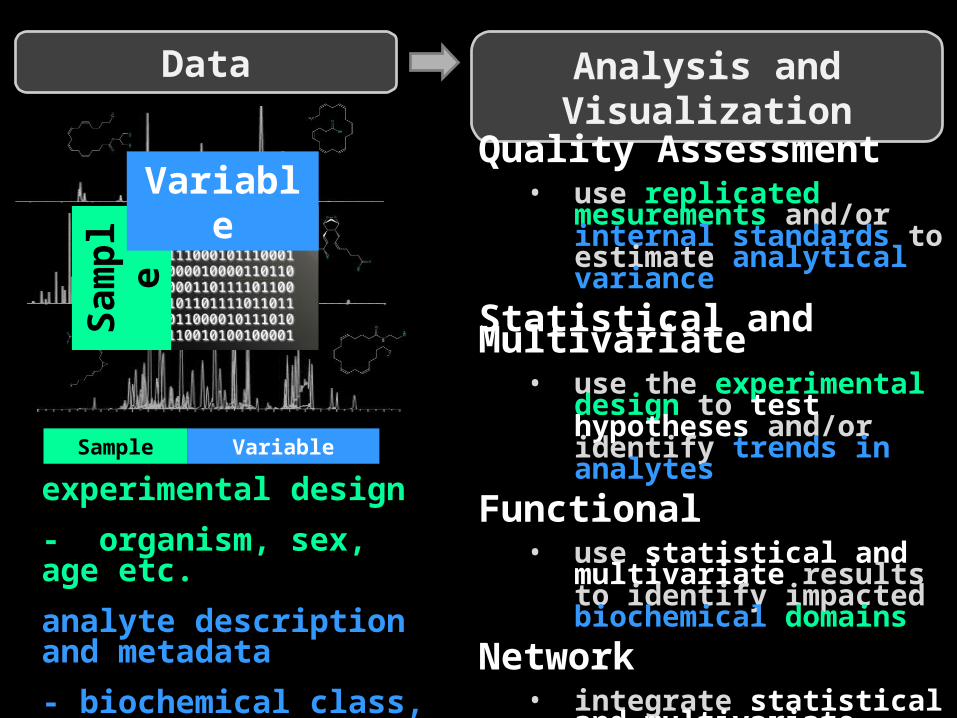
Data Analysis and Visualization
Quality Assessment• use replicated mesurements
and/or internal standards to estimate analytical variance
Statistical and Multivariate• use the experimental design
to test hypotheses and/or identify trends in analytes
Functional• use statistical and multivariate
results to identify impacted biochemical domains
Network• integrate statistical and
multivariate results with the experimental design and analyte metadata
experimental design
- organism, sex, age etc.
analyte description and metadata
- biochemical class, mass spectra, etc.
VariableSample
Sam
ple
Variable
Data Analysis and Visualization
Quality Assessment• use replicated mesurements
and/or internal standards to estimate analytical variance
Statistical and Multivariate• use the experimental design
to test hypotheses and/or identify trends in analytes
Functional• use statistical and multivariate
results to identify impacted biochemical domains
Network• integrate statistical and
multivariate results with the experimental design and analyte metadata
Network Mapping
experimental design
- organism, sex, age etc.
analyte description and metadata
- biochemical class, mass spectra, etc.
VariableSample

Data Quality AssessmentQuality metrics•Precision (replicated measurements)
•Accuracy (reference samples)
Common tasks•normalization •outlier detection •missing values imputation

Principal Component Analysis (PCA) of all analytes, showing QC sample scores
Batch EffectsDrift in >400 replicated measurements across >100 analytical batches for a single analyte
Acquisition batch
Abun
danc
e QCs embedded among >5,5000 samples (1:10) collected over 1.5 yrs
If the biological effect size is less than the analytical variance
then the experiment will incorrectly yield insignificant results

Analyte specific data quality overview
Sample specific normalization can be used to estimate and remove analytical variance
Raw Data Normalized Data
Normalizations need to be numerically and visually validated
log mean
low precision
%RS
D
high precision
SamplesQCs
Batch Effects

Outlier Detection
• 1 variable (univariate)
• 2 variables (bivariate)
• >2 variables (multivariate)

bivariate vs.
multivariate
mixed up samplesoutliers?
(scatter plot)
(PCA scores plot)
Outlier Detection

Network Mapping
Ranked statistically significant differences within a a biochemical
context
Statistics
Multivariate
Context
++=
Statistical and Multivariate AnalysesGroup 1
Group 2
What analytes are different between the
two groups of samples?
Statistical
significant differences lacking rank and
context
t-Test
Multivariate
ranked differences lacking significance
and context
O-PLS-DA

Network Mapping
Statistics
Multivariate
Context
++=
Statistical and Multivariate AnalysesGroup 1
Group 2
What analytes are different between the
two groups of samples?
Statistical
t-Test
Multivariate
O-PLS-DA
To see the big picture it is necessary too view the data from multiple different angles
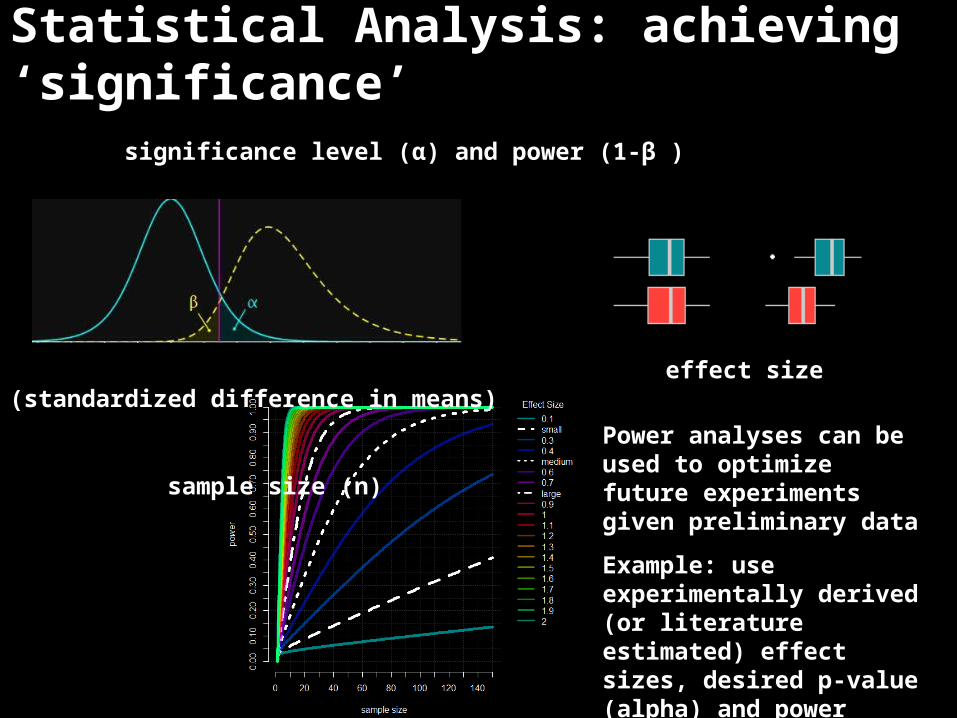
Statistical Analysis: achieving ‘significance’
significance level (α) and power (1-β )
effect size (standardized difference in means)
sample size (n) Power analyses can be used to optimize future experiments given preliminary data
Example: use experimentally derived (or literature estimated) effect sizes, desired p-value (alpha) and power (beta) to calculate the optimal number of samples per group

Statistical Tests
• Should be chosen based on the distribution (shape, type) of the (e.g. normal, negative binomial, Poisson)
• Can be optimized based on data pre-treatment (e.g. NSAF, Power Law Global Error Model, PLGEM)
Poisson normal

False Discovery Rate (FDR)
Type I Error: False Positives (α)
•Type II Error: False Negatives (β)
•Type I risk =
•1-(1-p.value)m
m = number of variables tested

False Discovery Rate AdjustmentFD
R ad
just
ed p
-val
ue
p-value
Benjamini & Hochberg (1995) (“BH”)•Accepted standard
Bonferroni•Very conservative•adjusted p-value = p-value x # of tests (e.g. 0.005 x 148 = 0.74 )

Functional Analysis
Nucl. Acids Res. (2008) 36 (suppl 2): W423-W426.doi: 10.1093/nar/gkn282
Identify changes or enrichment in biochemical domains
• decrease• increase

Functional Analysis: Enrichment
Biochemical Pathway Biochemical Ontology

Common Multivariate Methods
Clustering
Projection
Networks

Artist: Chuck Close
Cluster AnalysisUseful for
•pattern recognition
•complexity reduction
Common Methods
•Hierarchical
•Model based
•Other (k-means, k-NN, PAM, fuzzy)
Linkage k-means
Distribution Density

Hierarchical Clustering
Sim
ilarit
y
x
xx
x
Dendrogram
How does my metadata match my data structure?

Projection Methods
The algorithm defines the position of the light sourcePrincipal Components Analysis (PCA)
• unsupervised• maximize variance (X)
Partial Least Squares Projection to Latent Structures (PLS)
• supervised• maximize covariance (Y ~ X)
James X. Li, 2009, VisuMap Tech.
single analyte all analytes

Interpreting scores and loadings
variables with the highest loadings have the greatest contribution to sample scores
loadings represent how variables contribute to sample scores
loadings
Scores represent dis/similarities in samples
based on all variables
scores

Networks
Biochemical•interaction• enrichment•etc
Empirical (dependency)•correlation•partial-correlation•clustering
variable 2
variable 1
variable 3

Enrichment NetworkMapping of parents through children

Interaction Networks

Empirical Networks
• Correlation based networks (CN) (simple, tendency to hairball)
• GGM or partial correlation based networks (advanced, preference of direct over indirect relationships
• *Increase in robustness with sample size
10.1007/978-1-4614-1689-0_17

Proteomic Case Study: Diabetes Markers• Small sample size (control =12, GDM =6); covariates (time of sample collection)• >600 measured colostrum proteins; ~ 300 NSAF normalized proteins retained • Multivariate classification with O-PLS-DA used to identify variables to test using
PLGEM with correction for FDR• Partial-correlation protein-protein interaction network analysis

DeviumWebhttps://github.com/dgrapov/DeviumWeb
• visualization• statistics• clustering • PCA• O-PLS

DeviumWeb
• visualization• statistics• clustering • PCA• O-PLS
https://github.com/dgrapov/DeviumWeb

Software and Resources•DeviumWeb- Dynamic multivariate data analysis and visualization platformurl: https://github.com/dgrapov/DeviumWeb
•imDEV- Microsoft Excel add-in for multivariate analysisurl: http://sourceforge.net/projects/imdev/
•MetaMapR- Network analysis tools for metabolomicsurl: https://github.com/dgrapov/MetaMapR
•TeachingDemos- Tutorials and demonstrations•url: http://sourceforge.net/projects/teachingdemos/?source=directory•url: https://github.com/dgrapov/TeachingDemos
•Data analysis case studies and Examplesurl: http://imdevsoftware.wordpress.com/