Multi-omic approaches for biosynthetic pathway prediction ...
111
Transcript of Multi-omic approaches for biosynthetic pathway prediction ...

������������������������������� ������������� ��������������������
�������������

Propositions 1. Although guilt-by-association (the principle behind many gene function prediction
approaches) promotes “throwing data against the wall to see what sticks”, there is value in interpreting what did not “stick”. (this thesis)
2. To aid data interoperability and re-use, the design of new -omics experiments should
always consider the design of previous ones with similar objectives or parameters. (this thesis)
3. Skilled computational scientists make themselves irrelevant for routine tasks, and
indispensable for novel ones. 4. Within Academia excess attention is given to the name and prestige of journals,
laboratories and authors. 5. The basics of “programming” and “computer science” will soon be seen as analogous to
“literacy” and “numeracy”. 6. Children should be taught about life that most adults, if not all, are making it up as they
live. Propositions belonging to the thesis, entitled Multi-omics Approaches for Biosynthetic Pathway Prediction in Plants Hernando Suarez Wageningen, 8 February 2021

Multi-omics approaches forbiosynthetic pathway prediction in
plants
Hernando Suarez

2
Thesis committee
PromotorsProf. Dr. Ir. D. de RidderProfessor of BioinformaticsWageningen University & Research
Co-promotorDr. M.H. MedemaAssistant Professor of BioinformaticsWageningen University & Research
Other membersProf. Dr. C.S. Testerink, Wageningen University & ResearchDr. M.F. Seidl, Utrecht UniversityDr. S.E. O’Connor, Max Planck Institute of Chemical Ecology, Jena, GermanyDr. R. Cavill, Maastricht University
This research was conducted under the auspices of the Graduate SchoolExperimental Plant Sciences

3
Multi-omics approaches forbiosynthetic pathway prediction in
plants
Thesissubmitted in fulfilment of the requirements for the degree of doctor
at Wageningen Universityby the authority of the Rector Magnificus,
Prof. Dr A.P.J. Mol,in the presence of the
Thesis Committee appointed by the Academic Boardto be defended in public
on Monday 8 February 2021at 4 p.m. in the Aula.

4
Hernando SuarezMulti-omics approaches for biosynthetic pathway prediction in plants, 104 pages
PhD thesis, Wageningen University, Wageningen, the Netherlands (2021)With references, with summary in English
ISBN 978-94-6395-669-7DOI https://doi.org/10.18174/538330

5
Table of Contents
Chapter 1: Introduction 6
Chapter 2: plantiSMASH: automated identification, annotation andexpression analysis of plant biosynthetic gene clusters
Published in Nucleic Acids Research 45(W1):55-63, 2017
19
Chapter 3: Drivers of metabolic diversification: how dynamic genomicneighbourhoods generate new biosynthetic pathways in theBrassicaceae
Published in New Phytologist 227:1109-1123
35
Chapter 4: Comparative transcriptomics reveals a conserved core ofthe phosphate starvation response across monocots andeudicots
62
Chapter 5: MEANtools: An Integrative Multi-omics Approach forMetabolic Pathway Prediction
77
Chapter 6: General Discussion 96
Summary 107
Envoi 108

6
Chapter 1Introduction

7
1.1. The world’s finest chemistsIntrinsically tied to our history as omnivores, humans have consumed plants for
more than just nutrients since the dawn of our species, and likely even before.Although the oldest suspected instance of medicinal plant usage dates to 60,000BC, attributed to Neanderthals in the Shanidar Cave1, the practice of ingestingplants to self-medicate has been documented in many non-human animals, who usethem for diverse purposes such as regulating gut acidity, purging intestinal parasitesand infections, or even as prophylaxis to prevent those and many other conditions2.In fact, the discovery of many plants’ beneficial usages can be attributed toobserving animal behaviors2, tracing the origins of the plant natural product (NP)discovery field to pharmacognosy, zoo-pharmacognosy and even ethology.
One reason for this may be the ubiquity of plant life throughout the globe: withover 390,000 species3, it is estimated that ~80% of Earth’s biomass is composed ofplants4. Unaided by sessility, their effective proliferation and survival in the diversescenarios posed by Earth’s ecosystems can, at least in part, be attributed to plants’specialized metabolism (SM)5. This part of plant metabolism involves the productionof a diverse range of metabolites of various degrees of complexity, which help plantscombat abiotic stresses, and mediate interactions with other organisms, be itantagonistic (like herbivores) or mutualistic (like pollinators)6,7. As humans, we havelearned how to use these metabolites for our benefit, and have documentedapproximately ~10,000 plant species for medicinal use, a stark contrast to the~3,000 species that have been cultivated for food8.
Because of their abundance and diversity, it is no surprise that plant NPs havefound their way into multiple facets of human industry, from pharmaceuticalapplications to flavors and fragrances9. Morphine, a natural alkaloid of opium poppy,is perhaps the most famous of NPs with pharmaceutical application, but many othershave gained a foothold in medicine. One such example is artemisinin, asesquiterpene produced by sweet wormwood that is firmly established incombination therapy to treat malaria and is also currently being studied for othermedicinal applications10. Another plant terpenoid that has been interwoven intomodern civilization is rubber: from gloves to tires, rubber is essential to allmanufacturing sectors, and while the majority of the rubber in the market is synthetic,35% to 45% is natural rubber harvested almost exclusively from a single species11.One plant NP is key to a ~$814 billion industry: nicotine, the highly addictivestimulant behind the 5,300 billion cigarettes consumed yearly over the world12.
Taming the wildly diverse world of plant specialized metabolism has evidentlypushed humanity forward. As we continue to face new challenges, it is undeniablewe must also continue learning from the world’s finest chemists.
1.2. A short timeline of plant specialized metabolismresearch
The history of plant specialized metabolism research is best described by T.Hartmann in his 2007 review of the history of the field13:
“Within 50 years a bewildering array of waste products turned into a classifiedselection of chemical structures with indispensable ecological functions.”

8
The history of plant NP discovery, however, is certainly older than fifty years: asposited in 1.1., humans have likely been discovering and using beneficial plantmetabolites for most of the history of our species. The oldest documented evidenceof medicinal plants usage to prepare drugs is ~5,000 years old with 12 distinct plant-based drug recipes, and a few centuries later, evidence shows knowledge of 365recipes14. Arguably, these and the many other recipe preparations were informal orunknowing attempts of isolating and identifying the plants’ beneficial NPs: “plantsecondary metabolism research pre-history”, as Hartmann calls it. The mostacknowledged success of these informal attempts happened in 1806, when F.Sertürner isolated morphine from opium poppy, which sparked an era of new NPdiscovery and isolation from a plethora of plants, including ipecacuanha, strychnos,quinine and pomegranate14. To Hartmann, though, plant secondary metabolismresearch formally starts in the 1950s, when radioactively-labeled molecules allowedus to use biochemical evidence to trace back the biosynthetic pathways behind theproduction of many plant NPs13.
In the world of bacteria and fungi, NP discovery around the same period revolvedaround phenotypic screenings, bioassays in which antibacterial, antifungal or anti-cancer activity was detected visually by measuring growth inhibition induced byextracted metabolites. Between 1930 and 1970, thousands of new chemical entitieswere discovered with this methododology15. The following decades introducedgenetics to the field in a more prevalent manner: by the 1970s, recombinant DNAtechnology was developed for Escherichia coli (and later Streptomyces), whichallowed for the characterization of genes involved in important antibiotics likepenicillin and kanamycin15. Around a decade afterwards, by the mid-1980s, the firstenzyme-coding genes of plant secondary metabolism were cloned and functionallyexpressed; shortly after cDNA for phenylpropanoid, alkaloid and terpenebiosynthesis from plant sources had been successfully cloned13.
It was in the early 2000s when genomics took the forefront of the field.Improvements in sequencing technologies led to obtaining a 99% complete genomesequence for Streptomyces coelicolor in 2002, the largest bacterial genomesequence at the time. This study uncovered over 20 previously unidentified groups ofchromosomally clustered genes involved in the biosynthesis of specializedmetabolites16, and several biosynthetic gene clusters (BGCs) were subsequentlyassociated with distinct NPs. This quickly became a popular methodology to identifySM pathways and their associated NP in microorganisms: within 10 years, hundredsof gene clusters had been characterized, and this decade culminated in the releaseof antiSMASH in 2011, a computational tool to quickly identify and annotate SMgene clusters in bacteria and fungi with high confidence17. In the almost ten yearssince then, around ~2,000 BGCs from microorganisms have been characterizedexperimentally to link them to specific metabolic products18.
Although knowledge of chromosomally clustered SM genes in plants dates backto 1997, when five genes required for DIBOA biosynthesis in maize (Bx1 throughBx5) were found to be clustered on chromosome 419, it took several more years todiscover how widespread this phenomenon was in the plant kingdom. The next plantBGC was identified in oat in 2004: Qi et al. identified multiple genes required for thebiosynthesis of the antimicrobial triterpenoid avenacin that were physicallyclustered20. Similar to what was the case for bacteria and fungi, this discovery led to~10 years of BGC discovery in plants, but at a slower pace: by 2016, over twentyBGCs had been identified in plants21. The majority of plant NPs characterized during

9BGCs had been identified in plants21. The majority of plant NPs characterized duringthat time, however, were not synthesized by BGCs, instead by un-clustered orpartially clustered pathways and single-gene pathways; nevertheless, this effectivelydemonstrated that analyzing these genomic structures was a valid method for NPdiscovery in plants too, and the ongoing evolution of the NP discovery field broughthigh expectation of newer, more complex, methods to identify novel metabolicpathways by integrating multiple sources of data22.
Whereas the 2000s brought genomics to the forefront of the field, midwaythrough the 2010s one word had been added; now, computational genomics was thename of the game. By 2015, using computational tools to mine -omics data was notrestricted to BGC identification. Similar efforts were being made using transcriptomicdata: the biosynthetic pathways for podophyllotoxin in mayapple23 and 4-hydroxyindole-3-carbonyl nitrile (4-OH-ICN) in Arabidopsis thaliana24 wereelucidated by mining publicly available transcriptomic datasets, based on theprinciple that genes that encode enzymes belonging to the same pathway havecorrelated expression levels across samples. Indeed, large-scale analysis oftranscripts from several plants demonstrated that levels of coexpression amonggenes involved in SM are larger than among other genes25, supporting this guilt-by-association principle. Moreover, both studies combined transcriptomic withmetabolomic analyses to some extent: by analyzing the transcriptomes, theyidentified genes likely involved in targeted pathways of interest; their hypotheseswere later reinforced through observed changes in the metabolome of mutants, or intobacco after heterologous combinatorial expression of the targeted enzymes. Asimilar approach had been used to identify the final step in the biosynthesis ofnoscapine a year before: analyses of the transcriptomes of multiple opium poppychemotypes were used to identify the noscapine synthase (NOS) before validatingtheir results with LC-MS/MS26. These informed sequential sets of multiple -omicsanalyses illuminated the advantages that a fully integrated multi-omic analysis couldeventually bring to the table: gene expression and metabolite abundance are twoentry points to study the same metabolic pathways; measuring them simultaneouslyand integrating these data could provide a more holistic view of it.
Concurrently, more computational tools geared towards SM pathway and NPdiscovery were being developed: CoExpNetViz, a computational tool to comparegene coexpression networks of different plant species through homology, wasreleased at the beginning of 201627. Their approach requires targeting genes ofinterest, “baits”, in the transcriptome of two plant species. The algorithm thenidentifies genes coexpressed with the bait genes, and then uses gene families fromPLAZA28 to group them according to cross-species orthology. The results arevisualized as networks depicting the groups of orthologous genes that are allcoexpressed with the bait genes across the two species. This tool was based onprevious work that led to the elucidation of the biosynthetic pathways for α-chaconine/solanine in potato by comparing its coexpression network with that oftomato29. This research in particular was also aided by the close phylogeneticrelatedness of tomato and potato, and the fact that the pathway genes werephysically clustered, demonstrating that comparative transcriptomics, phylogenomicsand BGC identification can also be seamlessly integrated through computationalsolutions.
As more genomes continued to become available, it was undeniable that plantspecialized metabolism research was on the verge of a computational revolution.

10
1.3. A new era in natural products discoveryThe increasing availability of plant genomes and transcriptomes before the start
of this PhD project presented a challenge and an opportunity within the field: newapproaches needed to be developed to effectively and efficiently mine the large setsof data generated by high throughput -omics.
1.3.1. Biosynthetic Gene ClustersAs discussed in 1.2., before the start of this PhD, around 2016, just over twenty
BGCs had been identified in plants through a variety of methods21. The firstcomputational study identifying the potential of finding chromosomally colocatedgenes as a strategy to discover novel SM pathways in plants had been published acouple of years earlier; in 2014 Chae et al. examined the A. thaliana, Sorghumbicolor, soybean, and rice genomes and identified groups of genes that werechromosomally clustered; they found that between 22% and 31% of the plants’metabolic genes were located in these clusters, more than expected by chance30.Moreover, they queried the A. thaliana gene clusters within a large-scale microarraydataset and concluded that gene clusters with genes involved in SM were more likelyto be coexpressed than the clusters without SM genes30. This, and the increasingnumber of characterized BGCs in plant genomes introduced a unique opportunity forthe NP discovery and SM research fields: rapid computational discovery of SMBGCs took the neighboring bacteria and fungi kingdoms into a “gene clusterrevolution”31, and the revolution could cross the border.
Concurrently to our development of plantiSMASH to tackle this opportunity (seechapter 2), other tools were being developed to mine plant genomes and predictBGCs that could be associated with SM pathways. Schläpfer et al. developedPlantClusterFinder, an algorithm to detect metabolic gene clusters in plants32. Theirmethod consisted of identifying SM genes in a genome, and then using a slidingwindow to search for chromosomal regions with clustered SM genes. With thisstrategy, they identified clusters in 21 plant species, and over 1,700 of the clusters(15%) had SM genes. Interestingly, they found that SM pathways were more thantwice as likely to contain genes that are physically clustered than non-SM pathways.Lastly, of the thirteen characterized pathways known in the species they used in theirstudy, Schläpfer et al. identified twelve with the help of PlantClusterFinder. Shortlyafter, Töpfer et al. released the PhytoClust Tool for the metabolic gene clusterdiscovery in plant genomes33, and used it to mine 31 plant genomes, identifyingthousands of clusters. Despite using a distinct computational approach and havingstudied different species, their findings were in line with those of Schläpfer et al., andboth studies in turn effectively supported the previous work of Chae et al.30: therelation between plant specialized metabolism and gene clusters is ripe forexploitation and can easily guide plant NP discovery.
Studying plant BGCs has been shown to be beneficial not only to NP discovery,but also to better understand the evolution of SM pathways in plants. Along withidentifying the gene cluster involved in the biosynthesis of the triterpenoid avenacinin oat, Qi et al. also found the cluster was located in a region of the genome notconserved in other cereals, suggesting this BGC had not been assembled in a

11conserved in other cereals, suggesting this BGC had not been assembled in a
common ancestor20. Similar conclusions were reached with the characterization ofthe BGC responsible for the biosynthesis of the triterpenoid thalianol in A. thaliana:this cluster is unlikely to have a common origin with avenacin, indicating bothtriterpenoid clusters were assembled recently, and independently34. Thecharacterization of the BGC for marneral, another triterpenoid produced by A.thaliana, provided another piece of the puzzle: Field et al. found that while themarneral and thalianol clusters likely shared a common ancestor, the marneralcluster was not found in Arabidopsis lyrata despite its close phylogenetic relatednessto A. thaliana35; this suggested the marneral cluster had been recently lost in A.lyrata. Taken together, these findings indicate the assembly and disassembly of plantBGCs is very dynamic; thus, understanding the processes responsible for BGCevolution can help us unlock the secrets behind the diverse range of metabolites thatplants can produce.
Altogether, the research of BGCs in plants has the capacity to deeply contributeto many aspects of plant biology research, particularly regarding specializedmetabolism. The development and improvement of algorithms aimed at identifyingand predicting BGCs is thus crucial for the growth of the field.
1.3.2. Coexpression NetworksIdentifying coexpressed genes has been a very successful approach to mine
transcriptome datasets. Analyzing coexpression allows us to identify gene functionsand characterize SM pathways. The level of coexpression among any two genes canbe measured using a variety of metrics, such as the Pearson correlation coefficient(PCC) or Spearman’s rank. This strategy has resulted in many discoveries within thefield23,24,36,37, but it demands a priori knowledge of the function of some genes topropagate their annotations to those whose function is unknown. Acquiring such priorknowledge manually, however, may not be straightforward in plant genomes, many ofwhich have over 40,000 genes38, with a large number of them being functionallyuncharacterized.
One approach to overcome this obstacle is using coexpression networks; theyare one of the multiple types of gene networks that can be generated from geneexpression data39,40, and represent genes as nodes connected by edges/links if thegenes show coexpression correlation above a predetermined threshold. In A.thaliana, coexpression networks have been shown to capture the functionalcategorization of genes by grouping them in clusters or modules of tightlycoexpressed genes, which have similar function or regulation41. Moreover, evidencesuggest that the function and members of some gene modules are conservedthrough speciation events42, allowing the propagation of annotations betweenspecies with more confidence. When handling large datasets, however,coexpression networks can become too complex to readily interpret22,39,43, in partdue to unobserved factors that affect gene expression and may cause correlationamong genes44, which in turn may lead to an increase in type I errors wheninterpreting the significance of correlated genes in a network or module. In summary,better gene prioritization methods need to be developed to improve the confidence ofpredictions from the analysis of coexpression networks.
To address this, many strategies are being developed. For example, a morerobust statistical backdrop has been introduced45, and many network moduledetection algorithms have been developed or adapted for transcriptomic research.

12detection algorithms have been developed or adapted for transcriptomic research.Some of these methods have been determined to be particularly good at identifyingsets of genes associated with a specific function46, or were even specificallydesigned to predict plant SM pathways47. Another approach to remedy theemergence of type I errors is to compare the coexpression networks of differentspecies. As mentioned in 1.2., this strategy has already led to the identification ofNPs in plants29, and more recently it has been proposed as a method to study theevolution of SM pathways in plants48. While the previously discussed CoExpNetViz27
was designed to compare coexpression networks with the purpose of SM pathwaydiscovery, it still requires a priori knowledge in the form of bait genes, making it lessuseful for genomes with lower-quality annotations, or those that are phylogenomicallydistant from well-annotated genomes (which makes it difficult to propagateannotations through homology). Other algorithms, though, have successfullyanalyzed the transcriptome of more evolutionarily distant species: for example,Netotea et al. developed ComPlEx, which they used to compare the coexpressionnetwork of A. thaliana, Populus trichocarpa and Oryza sativa, revealing commonnetwork motifs enriched with the same GO terms in all three species49. CoMPlEx,however, only uses these three genomes (and more recently, CoMPlEx 2 comparesA. thaliana, P. trichocarpa and Picea abies50); this is in contrast to CoExpNetViz,which allows comparative analyses of transcriptomes input by the user, and severelylimits its usage.
While the power of comparatively analyzing gene coexpression to guide plant SMpathway discovery is clear, no comprehensive computational strategy has beendeveloped that can simultaneously tackle all the challenges it presents. A uniqueopportunity stands here, as comparative analyses can provide biological insights inmultiple species. Thus, the development of computational tools that can providehigh-confidence SM pathway predictions through comparative transcriptomics haspotential to significantly extend our knowledge of plant biology.
1.3.3. Multi-omics IntegrationAnother way to improve the mining of -omics datasets is through integrated multi-
omics analyses. Above, we briefly discussed how sequential transcriptomic andmetabolomic analyses led to the discovery of several SM pathways and theirassociated metabolites23,24,26: the observations made in gene expression profilesallowed the authors of these studies to prepare metabolomic experiments to validatetheir hypotheses. This sequence of analyses differs from an integrated multi-omicsanalysis; the latter is performed as a single simultaneous comprehensive analysis.This strategy is particularly advantageous in complex biological systems, where amulti-omics analysis can provide a holistic view by combining advantages of differentomics technologies. For example, in clinical research, many multi-omics integrationtools are used for cancer prognosis prediction, which helps physicians decidetreatments and improve patient survival51. Similarly, this strategy has a lot ofpotential to guide plant SM pathway discovery52.
The popularity and success of transcriptomic and metabolomic analyses for SMpathway discovery present them as prime candidates for multi-omic integration, andmultiple methods have been developed to integrate their datasets. For example, theexperiments can be designed to send one set of replicates to RNA-Seq, and anotherset to mass spectrometry (MS) analysis; alternatively, each sample can be split,

13set to mass spectrometry (MS) analysis; alternatively, each sample can be split,
sending one half to each -omics analysis. Later, integrating the datasets can be donein different manners too. For example, Urbanczyk-Wochniak et al. performed acorrelation analysis between transcripts and metabolite profiles in potato tubers andidentified more than double the number of significantly correlated pairs than would beexpected by chance53. They also mapped their transcriptome and metabolome ontoknown reactions, as well as the enzymes, substrates and products involved; theirresults indicated that the correlation between substrate and enzyme was higher thanthat of product and enzyme53. Similar results were later found in an integratedanalysis of the transcriptome and metabolome of Catharanthus roseus: genes andmetabolites involved in terpenoid indole alkaloid biosynthesis showed a high degreeof correlation54.
These and other strategies for transcriptomic and metabolomic integration havebeen reviewed in detail before55, with each presenting unique advantages andlimitations; however, a common thread among them is the high noise levels thatoften hide metabolite-gene associations. Indeed, gene and metabolites known to beclosely related in pathways often do not show correlation. For example, ter Kuile andWesterhoff found that metabolic fluxes in parasitic protists did not correlateproportionally with the concentration of the corresponding enzymes56. Similarly,Moxley et al. showed that mRNA expression of enzyme-coding genes did notcorrelate well with metabolic flux changes in yeast57. While these two studiesevaluated the integration of metabolomic and transcriptomic data in other organisms,plants have a vastly more complex metabolic system than yeast and protists, makingit very likely that straightforward simple correlation of gene expression andmetabolite abundance will not lead to high confidence predictions. It is thereforeclear that, similar to what is the case for coexpression network analysis, multi-omicsintegration requires more advanced gene/metabolite association prioritizationmethods to improve their performance and power in plant SM research and NPdiscovery.
1.4. Contributions of this thesisThis PhD thesis aims at tackling some of the unique opportunities that
computational genomics has brought to the plant SM pathway discovery field. In 1.2and 1.3., we discussed many of these opportunities and obstacles, but the focusduring my PhD research was directed at multi-omics solutions; namely, thedevelopment of computational methods to analyze data from multiple -omics sourcesfor the purpose of SM pathway discovery in plants.
In chapter 2, we introduce plantiSMASH, a computational tool for the automatedidentification, annotation and expression analysis of plant biosynthetic gene clusters.This project aims at facilitating the study of plant BGCs, which, as discussed in1.3.1., can guide NP discovery and SM pathway evolution research. To do this, webase our pipeline on antiSMASH58, following a similar workflow, user inputs andGUI, but customizing it specifically for the particularities of plant genomes andadding a coexpression analysis module. We use plantiSMASH to mine publicly-available chromosome-level plant genome assemblies and identify hundreds ofcandidate BGCs, including all experimentally characterized BGCs in the genomeswe mine.
In chapter 3, we continue the research of plant BGCs, this time with the purpose

14In chapter 3, we continue the research of plant BGCs, this time with the purpose
of understanding the manner in which they assemble during evolution andreconstructing the evolutionary relationships between closely related BGCs andBGC-like genomic structures. For this, we focus on a family of triterpene clusters inBrassicaceae, including the thalianol34 and marneral35 clusters discussed in 1.3.1..Centering our analysis on the scaffold-generating enzyme responsible for thetriterpene scaffold of both pathways, an oxidosqualene cyclase (OSC), we query thegenome of thirteen Brassicaceae species to identify the genes flanking each OSC, aregion we name their “genomic neighborhood” (GN). We then compare the evolutionof the SM genes in the GNs with the known species phylogeny of Brassicaceae,which leads us to uncover the most likely historical scenarios for the assembly andmetabolic diversification of the Brassicaceae triterpene BGCs.
In chapter 4, we explore using comparative analysis of transcriptomic networksto guide SM pathway discovery. For this we develop CADE-HEroN, a computationalworkflow designed to tackle limitations the analysis of coexpression networksdiscussed in 1.3.2.. CADE-HEroN allows users to input their own transcriptomes,genome assemblies and homolog relationships to identify conserved geneexpression patterns among different species. Our algorithm allows users to eitherinput bait genes and target specific metabolic processes of interest, or to generate acomparative time-series analysis that facilitates untargeted analysis. We use ourworkflow to study the phosphate starvation response in A. thaliana, tomato and rice,and identify a number of genes that have a conserved behavior across the threespecies and are likely to be coregulated. Some of the genes our analysis highlightsare already known to be involved in phosphate starvation, proving this workflow canrecover functionally related genes, while others were not yet functionally annotated,providing a source of candidate genes that may be prioritized for experimentalcharacterization.
In chapter 5, we present MEANtools, an integrative multi-omics approach formetabolic pathway prediction. Our objective is to tackle some of the limitations oftranscriptomic and metabolomic integration discussed in 1.3.3., and increase theconfidence in SM pathway predictions generated from the correlation of geneexpression and metabolite abundance datasets. We integrate the datasets not onlythrough correlation, but through an enzymatic reaction database that links therelationships between known metabolites, reactions and enzymes. In this manner,MEANtools can predict potential metabolic pathways. Predicted pathways, and thegenes, metabolites and reactions involved, are presented to the user in a graphicmanner for easy interpretation. In addition, the user can use the algorithm in avariety of modes according to their needs and the data they have available. Lastly,we use MEANtools to generate pathway predictions based on a pairedtranscriptomic-metabolomic dataset in tomato that was previously used for thecharacterization of the falcarindiol pathway59; this shows that our algorithm was ableto correctly predict multiple steps within this pathway. With this, we present acomputational tool that can, in a rapid and automated manner, help scientistsgenerate testable hypotheses about biosynthetic pathways, and the genes, reactionsand metabolites involved in them.
Finally, in chapter 6 we discuss the main findings, conclusions and perspectivesgathered along the development of all research projects and the writing of this thesis.

15
References
1. Lietava, J. Medicinal plants in a Middle Paleolithic grave Shanidar IV? J.Ethnopharmacol. 35, 263–266 (1992).
2. Huffman, M. A. Animal self-medication and ethno-medicine: exploration andexploitation of the medicinal properties of plants. Proc. Nutr. Soc. 62, 371–381(2003).
3. Willis, K. J. State of the world’s plants report-2017. (Royal Botanic Gardens,2017). doi:978-1-84246-628-5
4. Bar-On, Y. M., Phillips, R. & Milo, R. The biomass distribution on Earth. Proc.Natl. Acad. Sci. 115, 6506–6511 (2018).
5. Weng, J. K. The evolutionary paths towards complexity: A metabolic perspective.New Phytol. 201, 1141–1149 (2014).
6. Kessler, A. & Kalske, A. Plant Secondary Metabolite Diversity and SpeciesInteractions. Annu. Rev. Ecol. Evol. Syst. 49, 115–138 (2018).
7. Fang, C., Fernie, A. R. & Luo, J. Exploring the Diversity of Plant Metabolism.Trends Plant Sci. 24, 83–98 (2019).
8. McChesney, J. D., Venkataraman, S. K. & Henri, J. T. Plant natural products:Back to the future or into extinction? Phytochemistry 68, 2015–2022 (2007).
9. Kabera, J. N., Semana, E., Mussa, A. R. & He, X. Plant Secondary Metabolites:Biosynthesis, Classification, Function and Pharmacological Properties. J. Pharm.Pharmacol. 2, 377–392 (2014).
10. Krishna, S., Bustamante, L., Haynes, R. K. & Staines, H. M. Artemisinins: theirgrowing importance in medicine. Trends Pharmacol. Sci. 29, 520–7 (2008).
11. Cornish, K. Alternative Natural Rubber Crops: Why Should We Care? Technol.Innov. 18, 244–255 (2017).
12. British American Tobacco - The global market. Available at:https://www.bat.com/group/sites/UK__9D9KCY.nsf/vwPagesWebLive/DO9DCKFM. (Accessed: 26th July 2020)
13. Hartmann, T. From waste products to ecochemicals: Fifty years research of plantsecondary metabolism. Phytochemistry 68, 2831–2846 (2007).
14. Petrovska, B. Historical review of medicinal plants′ usage. Pharmacogn. Rev. 6,1 (2012).
15. Katz, L. & Baltz, R. H. Natural product discovery: past, present, and future. J.Ind. Microbiol. Biotechnol. 43, 155–176 (2016).
16. Bentley, S. D. et al. Complete genome sequence of the model actinomyceteStreptomyces coelicolor A3(2). Nature 417, 141–147 (2002).
17. Medema, M. H. et al. antiSMASH: Rapid identification, annotation and analysisof secondary metabolite biosynthesis gene clusters in bacterial and fungalgenome sequences. Nucleic Acids Res. 39, 339–346 (2011).
18. Kautsar, S. A. et al. MIBiG 2.0: a repository for biosynthetic gene clusters ofknown function. Nucleic Acids Res. 48, (2019).

16
19. Frey, M. et al. Analysis of a chemical plant defense mechanism in grasses.Science (80-. ). 277, 696–699 (1997).
20. Qi, X. et al. A gene cluster for secondary metabolism in oat: implications for theevolution of metabolic diversity in plants. Proc. Natl. Acad. Sci. U. S. A. 101,8233–8 (2004).
21. Nützmann, H.-W., Huang, A. & Osbourn, A. Plant metabolic clusters - fromgenetics to genomics. New Phytol. 211, 771–89 (2016).
22. Medema, M. H. & Osbourn, A. Computational genomic identification andfunctional reconstitution of plant natural product biosynthetic pathways. Nat.Prod. Rep. 33, 951–62 (2016).
23. Lau, W. & Sattely, E. S. Six enzymes from mayapple that complete thebiosynthetic pathway to the etoposide aglycone. Science 349, 1224–8 (2015).
24. Rajniak, J., Barco, B., Clay, N. K. & Sattely, E. S. A new cyanogenic metabolitein Arabidopsis required for inducible pathogen defence. Nature 525, 376–379(2015).
25. Omranian, N. et al. Differential metabolic and coexpression networks of plantmetabolism. Trends Plant Sci. 20, 266–8 (2015).
26. Chen, X. & Facchini, P. J. Short-chain dehydrogenase/reductase catalyzing thefinal step of noscapine biosynthesis is localized to laticifers in opium poppy. PlantJ. 77, 173–184 (2014).
27. Tzfadia, O. et al. CoExpNetViz: Comparative Co-Expression NetworksConstruction and Visualization Tool. Front. Plant Sci. 6, 1194 (2016).
28. Proost, S. et al. PLAZA 3.0: an access point for plant comparative genomics.Nucleic Acids Res. 43, D974–D981 (2015).
29. Itkin, M. et al. Biosynthesis of antinutritional alkaloids in solanaceous crops ismediated by clustered genes. Science 341, 175–9 (2013).
30. Chae, L., Kim, T., Nilo-Poyanco, R. & Rhee, S. Y. Genomic signatures ofspecialized metabolism in plants. Science 344, 510–3 (2014).
31. Jensen, P. R. Natural Products and the Gene Cluster Revolution. Trends inMicrobiology 24, 968–977 (2016).
32. Schläpfer, P. et al. Genome-Wide Prediction of Metabolic Enzymes, Pathways,and Gene Clusters in Plants. Plant Physiol. 173, 2041–2059 (2017).
33. Töpfer, N., Fuchs, L. & Aharoni, A. The PhytoClust tool for metabolic geneclusters discovery in plant genomes. Nucleic Acids Res. 45, 7049–7063 (2017).
34. Field, B. & Osbourn, A. E. Metabolic Diversification--Independent Assembly ofOperon-Like Gene Clusters in Different Plants. Science (80-. ). 320, 543–547(2008).
35. Field, B. et al. Formation of plant metabolic gene clusters within dynamicchromosomal regions. Proc. Natl. Acad. Sci. U. S. A. 108, 16116–21 (2011).
36. Horan, K. et al. Annotating genes of known and unknown function by large-scalecoexpression analysis. Plant Physiol. 147, 41–57 (2008).
37. Sohrabi, R. et al. In Planta Variation of Volatile Biosynthesis: An AlternativeBiosynthetic Route to the Formation of the Pathogen-Induced Volatile

1737.
Biosynthetic Route to the Formation of the Pathogen-Induced VolatileHomoterpene DMNT via Triterpene Degradation in Arabidopsis Roots. Plant Cell27, 874–890 (2015).
38. Sterck, L., Rombauts, S., Vandepoele, K., Rouze, P. & Van de Peer, Y. Howmany genes are there in plants (… and why are they there)? Curr. Opin. PlantBiol. 10, 199–203 (2007).
39. Hoang, T., Hong, S., Company, H. M. & Shin, D. Extending Biological Pathwaysby Utilizing Conditional Mutual Information Extracted from RNA-SEQ GeneExpression Data. 27, (2010).
40. Li, Y., Pearl, S. A. & Jackson, S. A. Gene Networks in Plant Biology: Approachesin Reconstruction and Analysis. Trends Plant Sci. 20, 664–675 (2015).
41. Mao, L., Van Hemert, J. L., Dash, S. & Dickerson, J. A. Arabidopsis gene co-expression network and its functional modules. BMC Bioinformatics 10, 346(2009).
42. Ficklin, S. P. & Feltus, F. A. Gene Coexpression Network Alignment andConservation of Gene Modules between Two Grass Species: Maize and Rice.Plant Physiol. 156, 1244–1256 (2011).
43. Serin, E. A. R., Nijveen, H., Hilhorst, H. W. M. & Ligterink, W. Learning from Co-expression Networks: Possibilities and Challenges. Front. Plant Sci. 7, 444(2016).
44. Furlotte, N. A., Kang, H. M., Ye, C. & Eskin, E. Mixed-model coexpression:Calculating gene coexpression while accounting for expression heterogeneity.Bioinformatics 27, i288–i294 (2011).
45. Gobbi, A. & Jurman, G. A null model for pearson coexpression networks. PLoSOne 10, (2015).
46. Saelens, W., Cannoodt, R. & Saeys, Y. A comprehensive evaluation of moduledetection methods for gene expression data. Nat. Commun. 9, 1090 (2018).
47. Wisecaver, J. H. et al. A Global Coexpression Network Approach for ConnectingGenes to Specialized Metabolic Pathways in Plants. Plant Cell 29, 944–959(2017).
48. Ruprecht, C. et al. Beyond Genomics: Studying Evolution with GeneCoexpression Networks. Trends Plant Sci. 0, 64–69 (2017).
49. Netotea, S., Sundell, D., Street, N. R. & Hvidsten, T. R. ComPlEx: Conservationand divergence of co-expression networks in A. thaliana, Populus and O. sativa.BMC Genomics 15, 1–17 (2014).
50. ComPlEx. Available at: http://complex.plantgenie.org/. (Accessed: 26th July2020)
51. Huang, S., Chaudhary, K. & Garmire, L. X. More is better: Recent progress inmulti-omics data integration methods. Frontiers in Genetics 8, (2017).
52. Rai, A., Saito, K. & Yamazaki, M. Integrated omics analysis of specializedmetabolism in medicinal plants. Plant J. 90, 764–787 (2017).
53. Urbanczyk‐Wochniak, E. et al. Parallel analysis of transcript and metabolicprofiles: a new approach in systems biology. EMBO Rep. 4, 989–993 (2003).
54. Rischer, H. et al. Gene-to-metabolite networks for terpenoid indole alkaloid

1854. Rischer, H. et al. Gene-to-metabolite networks for terpenoid indole alkaloid
biosynthesis in Catharanthus roseus cells. Proc. Natl. Acad. Sci. 103, 5614–5619(2006).
55. Cavill, R., Jennen, D., Kleinjans, J. & Briedé, J. J. Transcriptomic andmetabolomic data integration. Brief. Bioinform. bbv090- (2015).doi:10.1093/bib/bbv090
56. ter Kuile, B. H. & Westerhoff, H. V. Transcriptome meets metabolome:hierarchical and metabolic regulation of the glycolytic pathway. FEBS Lett. 500,169–171 (2001).
57. Moxley, J. F. et al. Linking high-resolution metabolic flux phenotypes andtranscriptional regulation in yeast modulated by the global regulator Gcn4p. Proc.Natl. Acad. Sci. U. S. A. 106, 6477–82 (2009).
58. Weber, T. et al. antiSMASH 3.0--a comprehensive resource for the genomemining of biosynthetic gene clusters. Nucleic Acids Res. 43, 1–7 (2015).
59. Jeon, J. E. et al. A Pathogen-Responsive Gene Cluster for Highly Modified FattyAcids in Tomato. Cell 180, 176-187.e19 (2020).
19
Chapter 2plantiSMASH: automated
identification, annotation andexpression analysis of plantbiosynthetic gene clusters
Satria A. Kautsar1,2,†, Hernando G. Suarez Duran1,†, Kai Blin3, Anne Osbourn4 andMarnix H. Medema1
1 Bioinformatics Group, Wageningen University, 6708 PB Wageningen, TheNetherlands2 Teknik Informatika, Universitas Lampung, Jln. Sumantri Brojonegoro No. 01,Lampung 35141, Indonesia3 The Novo Nordisk Foundation Center for Biosustainability, Technical University ofDenmark, 2800 Kgs. Lyngby, Denmark4 Department of Metabolic Biology, John Innes Centre, Norwich Research Park,Norwich NR4 7UH, UK
† These authors contributed equally to the paper as first authors.
Published in Nucleic Acids Research 45(W1):55-63, 2017

20
2.1. AbstractPlant specialized metabolites are chemically highly diverse, play key roles in
host–microbe interactions, have important nutritional value in crops and arefrequently applied as medicines. It has recently become clear that plant biosyntheticpathway-encoding genes are sometimes densely clustered in specific genomic loci:biosynthetic gene clusters (BGCs). Here, we introduce plantiSMASH, a versatileonline analysis platform that automates the identification of candidate plant BGCs.Moreover, it allows integration of transcriptomic data to prioritize candidate BGCsbased on the coexpression patterns of predicted biosynthetic enzyme-coding genes,and facilitates comparative genomic analysis to study the evolutionary conservationof each cluster. Applied on 48 high-quality plant genomes, plantiSMASH identifies arich diversity of candidate plant BGCs. These results will guide further experimentalexploration of the nature and dynamics of gene clustering in plant metabolism.Moreover, spurred by the continuing decrease in costs of plant genome sequencing,they will allow genome mining technologies to be applied to plant natural productdiscovery. The plantiSMASH web server, precalculated results and source code arefreely available from http://plantismash.secondarymetabolites.org.
2.2. IntroductionAcross Planet Earth, bacteria, fungi and plants produce an immense diversity of
specialized metabolites, each with their own specific ecological roles in the manifoldinterorganismal interactions in which they engage. This diverse specializedmetabolism is a rich source of natural products that are used widely in medicine,agriculture and manufacturing. In bacteria and fungi, where genes for mostspecialized metabolic pathways are physically clustered in socalled biosyntheticgene clusters (BGCs), the rapid accumulation of genome sequences hasrevolutionized the process of natural product discovery: indeed, genome mining hasnow become a dominant method for the discovery of novel molecules (1–4). In thisgenome mining process, BGCs are computationally identified in genome sequencesand then linked to molecules through functional analysis (e.g. using metabolomicdata, chemical structure predictions, mutant libraries and/or heterologousexpression). Many sequence based aspects of this genome mining procedure arefacilitated by the antiSMASH framework, which was launched in 2010 (5) and hasseen continuous development since then (6,7). The genome mining procedure hastwo main purposes: (i) finding biosynthetic genes for important known compounds toallow heterologous production through fermentation in industrial strains, and (ii)identifying novel natural product chemistry guided by biosynthetic gene clusterdiversity. Altogether, this development has appropriately been termed the ‘genecluster revolution’ (1).
In recent years, it has become clear that not only microbial, but also plantbiosynthetic pathways are frequently chromosomally clustered: after the initialdiscoveries of the cyclic hydroxamic acid 2,4-dihydroxy-1,4-benzoxazin3-one(DIBOA) and avenacin gene clusters (8,9), around thirty plant BGCs have beendiscovered (10,11). Together, they encode the production of a wide range of differentcompounds, including cyclic hydroxamic acids, di- and triterpenes, steroidal andbenzylisoquinoline alkaloids, cyanogenic glucosides and polyketides. In the genomeof the model plant species Arabidopsis thaliana alone, four BGCs have been linked

21of the model plant species Arabidopsis thaliana alone, four BGCs have been linked
to specific metabolites and recent analyses based on epigenomic profiling indicatethe presence of various additional uncharacterized ones (12).
Various technological developments in eukaryote genome sequencing (13) arefinally making complete plant genome sequencing feasible at larger scales: high-quality plant genome sequences for almost 100 species are already publiclyavailable, and more or less complete genomes can be sequenced for as little as 10–50k US dollars each. Hence, genome mining may become an importantmethodology in the study of plant natural products as well, and a realistic opportunitythus presents itself for the plant natural product research community to have a ‘genecluster revolution’ of its own. Naturally, a key technology required to realize this is acomputational framework specifically designed for the identification and analysis ofplant BGCs. Importantly, tools available for bacterial and fungal genome mining donot suffice for plants (14), as (i) plant biosynthetic pathways involve unique enzymefamilies not found in bacteria and fungi; (ii) not all plant biosynthetic pathways areclustered (e.g. anthocyanins (15)), so identification of a biosynthetic gene does notequal identification of a BGC; (iii) intergenic distances in plant genomes are largerand much more variable (16–19); (iv) plant genomes contain clustered groups ofgenes (e.g. tandem arrays) whose products do not constitute a pathway; (v) severalplant pathways are split across more than one BGC (20,21).
Here, we introduce antiSMASH for plants (or ‘plantiSMASH’ in short), which hasbeen designed to tackle each of these challenges. Through a comprehensive libraryof profile Hidden Markov Models (pHMMs) for enzyme families known to be involvedin plant biosynthetic pathways, combined with CD-HIT clustering of predicted proteinsequences belonging to the same family, it allows the efficient identification ofgenomic loci encoding multiple different (sub)families of specialized metabolicenzymes. Moreover, comparative genomic analysis as well as analysis of geneexpression patterns within these candidate BGCs allow assessment of each locusfor its likelihood to encode genes working together in one pathway. Finally,coexpression analysis between candidate BGCs and with other genes across thegenome allows identification of biosynthetic pathways that are encoded on multipleloci. To exploit this new framework, we offer an initial analysis of BGC diversityacross the plant kingdom, which showcases the presence of many complexbiosynthetic loci in diverse species.
2.3. Methods and Implementation
2.3.1. A procedure for the identification of candidate plantbiosynthetic gene clusters
The microbial version of antiSMASH (5) predicts BGCs by using HMMer (22) toidentify specific (combinations of) signature protein domains that belong to scaffoldgenerating enzymes specific for a class of biosynthetic pathways. Subsequently, hitgenes are used as anchors from which gene clusters are extended upstream anddownstream by a specified extension distance.
Although very effective for detecting biosynthetic clusters in bacteria and fungi,

22Although very effective for detecting biosynthetic clusters in bacteria and fungi,
this procedure is unfit to detect biosynthetic gene clusters in plants, for the reasonsdescribed above. To address this, a novel detection strategy was chosen (Figure 1):instead of identifying BGCs through the identification of core scaffold-generatinggenes alone, plantiSMASH identifies them by looking for all genes predicted toencode biosynthetic enzymes, including those required for tailoring of the scaffold.
Figure 1. General strategy followed by plantiSMASH for the identification of plant BGCs. First,plantiSMASH identifies biosynthetic genes (having a hit on one of the 62 pHMMs) that are located inclose proximity to each other. Subsequently, it will look for the co-occurrence of at least threebiosynthetic enzyme-coding genes, comprising at least two different enzyme types. (Based on theresults of the CD-HIT clustering of encoded protein sequences, closely related duplicate genes willonly be counted once). Afterward, identified clusters are extended to incorporate any flanking genes.Finally, each cluster is classified based on the presence of core enzymes (see Supplementary TableS1). In this example, the detected cluster is assigned to the ‘Terpene’ class due to the presence of aterpene synthase-encoding gene.
To determine what constitutes a high-potential candidate BGC, we make use ofthe recently proposed definition for plant BGCs as ‘genomic loci encoding genes fora minimum of three different types of biosynthetic reactions (i.e. genes encodingfunctionally different (sub)classes of enzymes)’ (14). (Albeit arbitrary, this definitioncorrectly describes all known plant BGCs at the moment and is open to improvementas more are discovered.) Accordingly, with default settings plantiSMASH definesclusters as loci where at least three different enzyme subclasses belonging to atleast two different enzyme classes are co-located on the same locus. Enzymeclasses are identified using pHMMs specific for each class (Supplementary TableS1); to count the number of subclasses of each enzyme class at a certain locus, theCD-HIT algorithm (23) is employed for sequence-based clustering to identify groupsof sequences within an enzyme class with (by default)>50% mutual amino acidsequence identity. This successfully distinguishes potentially real BGCs from tandemrepeat regions that are also frequently found in genomes (Supplementary Table S2).
In order to identify all classes of biosynthetic enzymes known to be involved inplant specialized metabolic pathways, we performed a comprehensive literaturesearch of previously characterized plant biosynthetic pathways, which resulted in alist of 62 protein domains that have been associated with specialized metabolicpathways in plants (see Supplementary Table S1). Fifty-seven of these proteindomains are represented by pHMMs from the Pfam database (24), and custompHMMs were generated for five enzyme families not (fully) covered by Pfam

23pHMMs were generated for five enzyme families not (fully) covered by Pfamdomains. We consciously refrained from attempting to construct custom pHMMs forall enzyme families known to be involved in plant biosynthetic pathways, as thelimited amount of training data available would lead to an overly strict predictionsystem that would no longer be able to detect biosynthetic novelty; instead, weassume that the broad enzyme families covered by Pfam domains are likely to bebiosynthetically involved if multiple enzymes from these different families areencoded together in the same locus. As in the microbial version of antiSMASH, thepresence of genes predicted to encode signature enzymes (defined as enzymes thatdetermine the chemical class of the end compound, such as terpene synthases) in acandidate BGC are used to assign a cluster to a biosynthetic class (seeSupplementary Table S3 for cluster rules). However, compared to the microbialversion, the biosynthetic classes in ‘plantiSMASH’ are more of an approximation,since not all signature enzyme families used can be unequivocally used to predictthe compound type; e.g. while strictosidine synthase (25) and norcoclaurinesynthase (26) are well-characterized members of the Bet v1 enzyme family, it is notclear what proportion of this family have similar Pictet-Spenglerase(-like) catalyticactivities.
Another particular challenge for BGC detection in plant genomes is the largevariation in gene density that occurs not only between but also within plant genomes(16–19). Replacing the static kilobase distance cut-off of microbial antiSMASH by afixed cut-off based on the maximum number of genes that lie between each pHMMhit also does not provide a solution, as BGCs would then be allowed to cross largerepeat regions or even centromeres. Therefore, we chose an alternative, moredynamic, cut-off that is a linear function of local gene density (defined as the genedensity of the ten genes nearest to a pHMM hit), and applies a multiplier to calculatethe cut-off in kb that is optimal for that specific genomic region (see SupplementaryTable S2 and Figures S1 and S2 for results illustrating calibration of the defaults).
2.3.2. Flexible and user-friendly input and outputTo obtain reliable BGC predictions, a high-quality annotation of gene features in a
genome is essential. While we do make available the option to run GlimmerHMM(27) on plant genome sequences, performing de novo gene finding on a raw FASTAfile is not desirable, given the relatively low accuracy of such a procedure. Because,additionally, the GenBank and EMBL input formats previously accepted forantiSMASH are not available for many plant genomes, we now allow users to supplyinput also in FASTA+GFF3 format, currently the most widely used format fordescribing plant genome annotations. For this, we implemented a new module basedon Biopython’s GFF parsing package (http://biopython.org/wiki/GFF_Parsing)capable of combining the CDS features from the input sequence, if any, with those ofa file compliant to the Generic Feature Format Version 3 as defined by TheSequence Ontology in 2003 (https://github.com/The-Sequence-Ontology/Specifications/blob/master/gff3.md). To properly match GFF3 CDS features to theircorrect sequence, the module demands record names(chromosome/scaffold/contigs) to be identical in both inputs; the only exception beingif both inputs only contain one record, in which case the requirement is instead thatno feature has coordinates outside the sequence range. This new module allowsplantiSMASH to be used with genomes that are only annotated with GFF3 files,such as many of those present in the Joint Genome Institute’s Phytozome database

24such as many of those present in the Joint Genome Institute’s Phytozome database
(28).Based on the biosynthetic gene cluster predictions, a rich and interactive HTML
output is generated (Figure 2), which is largely reminiscent of the output of microbialantiSMASH jobs (5). Additionally, genes in the visualization page for each candidateBGC are colored based on the class of enzymes encoded, and a legend is providedthat details the color scheme. On mouse click, panels for each gene provideinformation on the pHMMs that have hits against it, as well as on the amino acididentity to homologous genes within the same locus as calculated by CD-HIT.
Figure 2. Outputs generated by the plantiSMASH pipeline. The figure illustrates severalvisualized outputs generated by plantiSMASH, as they appear for various biosynthetic gene clustersof known natural products. (A) Visual overview generated for each gene cluster; in this case, thetirucalladienol cluster from Arabidopsis thaliana (47) is shown. Gene annotations and pHMM hitdetails appear on mouse click. Also, ClusterBlast output showing alignment of homologous genomicloci across other genomes of related species is provided. (B) Example of a gene expression heatmap, showing coexpression among the core genes of the marneral BGC from A. Thaliana (48) (andnot with the flanking genes). (C) Hive plot on the overview page, which highlights pairs of candidateBGCs which show many coexpression correlations between their genes; in this example view, thecoexpression links between the two loci encoding α-tomatine biosynthesis in Solanum lycopersicum(20) are highlighted (clusters 31 and 44). (D) Example ego network that summarizes coexpressioncorrelations between members of the α-tomatine gene (cluster 44), as well as with genes in othergene clusters (including the other α-tomatine biosynthetic locus, cluster 31) and with geneselsewhere on the genome.
2.3.3. Coexpression analysis identifies pathways withinand between gene clusters
As plant scientists are just beginning to understand the phenomenon of metabolicgene clustering in plant genomes, it is currently unknown which proportion ofgenomic loci that encode multiple contiguous biosynthetic enzyme-encoding genesare bona fide BGCs in the sense that their constituent genes are involved in onespecific pathway. One powerful strategy to predict whether genes are involved in the

25specific pathway. One powerful strategy to predict whether genes are involved in thesame pathway is the use of coexpression analysis, in which their expression patternsare compared across a wide range of samples. This strategy has proven veryeffective in the de novo identification of gene sets involved in biosynthetic pathways,even if they are not physically clustered on the chromosome (29).
To allow detailed investigation of whether genes in a cluster show coexpression,we added a dedicated analysis module: CoExpress. This module readstranscriptomic datasets, either in SOFT format (from the NCBI Gene ExpressionOmnibus) or in comma-separated (CSV) format, and generates powerfulvisualizations of these data for each candidate BGC. Because combining manydatasets into one coexpression analysis may blot out coexpression signals that arevery specific to certain biological or chemical treatments (which often highlyspecifically incite expression of plant specialized metabolic pathways), we designedthe module in such a way that it visualizes one transcriptomic dataset at a time. Thishas the added value that the user can browse through multiple datasets and canindividually assess specific samples that are linked to a treatment of interest.
The visualizations of within-cluster coexpression patterns are 2-fold: first, ahierarchically clustered heatmap visualization, plotted using a modified version of theInCHlib (http://www.openscreen.cz/software/inchlib/home) JavaScript library, offers adirect view of patterns in and relationships between the supplied normalized geneexpression values. The dendrogram is generated using a coexpression distancemetric with a complete-linkage hierarchical clustering method. In this metric, thePearson Correlation Coefficient (PCC) is transformed directly into a distance valuescaled from 0 to 200 (0 for PCC = 1, or positively correlated, and 200 for PCC = -1or negatively correlated). In order to make correlations maximally visible, the colorscheme is normalized per gene (row) by default; however, the user can also selectfor the color scheme to be normalized by sample (column). Second, a gene cluster-specific coexpression network (30) (with a default distance based cutoff of <50,dynamically adjustable) summarizes the correlations and helps to identify specificgroups of genes in the locus that are highly coexpressed: these occur as connectedcomponents with high numbers of edges.
Coexpression analysis is not just useful for analysis of functional connectionswithin a candidate BGC, but also allows prediction of functional links with othergenomic loci. It is now well-understood that several plant BGCs do not act alone, butrather in concert with another BGC or with individual enzyme-coding geneselsewhere on the genome (11). Therefore, plantiSMASH leverages coexpressiondata to offer two analyses that identify these trans-genomic interactions: first, theBGC-specific coexpression network can be extended to display a first-order egonetwork that incorporates genes elsewhere on the genome that either (i) aremembers of another candidate BGC and show high gene expression correlation(>0.9 PCC) with at least one gene in the BGC, or (ii) contain a ‘biosynthetic’ domain(defined as being one of the domains in Supplementary Table S1) and show highgene expression correlation with at least two genes in the BGC, at least one of whichbeing a biosynthetic gene itself. Second, interactions between candidate BGCs aresummarized in a hive plot, in which pairs of clusters are connected by an edge if thegenes of both clusters create at least one subnetwork that satisfies the followingcriteria: (i) all nodes belong to the same Louvain community (31), as determined byanalyzing the full coexpression network of all candidate clusters’ genes; (ii) all nodeshave a transitivity greater than zero; (iii) the subnetwork contains at least two genesfrom each cluster; (iv) the subnetwork contains at least one gene per cluster that has

26from each cluster; (iv) the subnetwork contains at least one gene per cluster that hasa biosynthetic domain; and (v) The subnetwork contains at least three genes with abiosynthetic domain. This highlights arrangements of pairs of clusters that may belinked functionally via coexpression, and is reminiscent of the characterized -tomatine biosynthetic pathway in Solanum lycopersicum, which is encoded in twoseparate clusters that are highly coexpressed (20). All in all, the coexpressionanalysis of candidate BGCs allows effective prioritization for, e.g. heterologousexpression studies. Yet, it should still be kept in mind that loci that do not show highcoexpression might still encode genes that are jointly involved in a biosyntheticpathway, e.g. if the transcriptomic samples available do not include any treatmentsthat induce the expression of the pathway, or if expression of the pathway issequestered either spatially across tissues or in terms of timing.
2.3.4. Comparative genomic analysis shows conservationand diversification
Comparing a candidate BGC with homologous genomic loci in other plantgenomes can give important information on its evolutionary conservation ordiversification. Whereas strong conservation of clusteredness across larger periodsof evolutionary time may point to a selective advantage of clustering for these genes,diversification of BGCs by cooption of other enzyme-coding genes may give clues tofinding novel variants of natural products that have been generated throughdirectional pathway evolution. In order to facilitate such comparative analysis on acase-by-case basis, we constructed a plant-specific version of the antiSMASHClusterBlast module. To do so, we ran plantiSMASH on a collection of all publiclyavailable plant genomes, obtained from NCBI’s GenBank, JGI’s Phytozome andKazusa (32). In order to avoid cases where loci homologous to detected candidateBGCs would not be included in the database by not satisfying the identificationcriteria, the thresholds for this search were lowered to find all genomic loci with twoor more different enzymes, where the CD-HIT cut-off was also set to a generouslyinclusive level of 0.9. A total of 7978 genomic loci were thus included in the plantClusterBlast database. As in the microbial version of antiSMASH, the translatedprotein sequence of each predicted gene in a candidate BGC is searched againstthis database using the DIAMOND algorithm (33) and genomic loci are sorted basedon the number of hits, conserved synteny and cumulative bit score. To also facilitatedirect comparison with known plant BGCs, all plant BGCs with known products forwhich the sequence was available were added to the MIBiG repository (34), whichallows users to find similarities between newly identified and known clusters with theKnownClusterBlast module of antiSMASH.
2.3.5. Precomputed results allow fast access tocomprehensive plantiSMASH results
In order to allow users to directly access plantiSMASH results for publiclyavailable plant genomes, runs for 47 high quality plant genomes were precomputedand made available online at http://plantismash.secondarymetabolites.org/precalc.Importantly, publicly available gene expression datasets with sufficient numbers ofsamples to be suitable for coexpression analysis were loaded into these results. Intotal, 73 transcriptomic datasets were included for five species: A. thaliana, S.lycopersicum, Oryza sativa, Zea mays and Glycine max (Supplementary Tables S4–

27lycopersicum, Oryza sativa, Zea mays and Glycine max (Supplementary Tables S4–7). As an indication for web server users: the computations took about 24 min pergenome on average, on a 2 GHz CPU, depending on the size of the genome andpre-selected additional analyses including the co-expression analysis (see furtherdetails in Supplementary Table S4).
Sequences that are not publicly available (as well as available sequences withcustom transcriptomic datasets) can be analyzed directly using the plantiSMASHweb server at http://plantismash.secondarymetabolites.org. In this way,plantiSMASH results for all kinds of genomes and transcriptomes are optimallyavailable to users.
2.4. Results and Discussion
2.4.1. PlantiSMASH successfully detects all experimentallycharacterized plant biosynthetic gene clusters
Even though only a relatively small set of plant BGCs has been discovered,these ∼30 BGCs still present the best objective test case for the BGC detectionalgorithm. Importantly, they range from complex BGCs with many different enzyme-coding genes, such as the noscapine and cucurbitacin BGCs (21,35), to relativelysimple ones that only encode a couple of enzymes, such as the dhurrin andlinamarin/lotaustralin BGCs (36). Of this set, only 19 BGCs have annotatedsequence information publicly available. When plantiSMASH was run on a multi-GenBank file containing accurately annotated versions of these 19 known BGCs, allclusters were successfully detected with default settings. When run on differentgenome annotation versions available from GenBank or Phytozome, BGCs of lowcomplexity (i.e. with a small number of enzyme-coding genes) were occasionallymissed when key genes were missing from the structural annotations or when manyfalse positive gene assignments were present in the region of interest (affecting thedynamic gene density-based cut-off of plantiSMASH): for example, the linamarinBGC from Lotus japonicus was not detected in assembly/annotation version 3.0,while it was detected in the older version 2.5. This highlights the importance of usinghigh-quality genome annotations supported by transcriptomic data when usingplantiSMASH to search for BGCs of interest. Alternatively, the stand-alone versionof plantiSMASH provides additional cut-off methods (e.g. raw distance-based orgene-count-based) that can be attempted as well to mitigate such issues.
2.4.2. Plant genomes contain large numbers of complexbiosynthetic gene clusters
When run on the 47 plant genomes for which chromosomelevel assemblies arecurrently available on either NCBI or Phytozome, plantiSMASH found a wide varietyof candidate BGC numbers across plant taxonomy (Figure 3). In general, thenumbers of candidate BGCs were relatively even between monocots and dicots(while very low in the only moss genome included), while the largest numbers ofBGCs were found in dicot genomes. These outliers all corresponded to recent

28BGCs were found in dicot genomes. These outliers all corresponded to recent
(partial) genome amplification events, such as in the case of Camelina sativa (37)with 88 candidate BGCs, Brassica napus (38) with 68 candidate BGCs and G. max(39) with 76 candidate BGCs.
Figure 3. Numbers of candidate BGCs identified across the Plant Kingdom. (A) PlantiSMASHBGC predictions plotted onto a phylogenetic tree of plant species for which chromosome-levelgenome assemblies are available. The blue bars indicate the number of candidate BGCs pergenome, the red bars indicate the most complex candidate BGC identified in each species (in termsof the number of unique enzymes encoded, as defined by CD-HIT groups). (B) Number of candidateBGCs plotted versus the total number of genes; as expected, more BGCs are found in largergenomes. Outliers represent genomes that have recently undergone whole-genome duplication, andthe moss Physcomitrella patens, in the genome of which only a very low number of candidate BGCsis found. (C) Number of candidate BGCs plotted versus the number of genes with pHMM hits tobiosynthetic domains. (D) Number of genes with biosynthetic domains plotted against the totalnumber of genes; a linear correspondence is largely observed.
In many plant genomes, candidate BGCs of high complexity were identified, withas many as seven or eight different enzymatic classes encoded in the same tightgenomic region. These constitutions are clearly non-random and make it promisingto study candidate BGCs even in the absence of coexpression data. Dozens of suchcomplex BGCs were found, which cover all known as well as putative pathwayclasses; examples are provided in Figure 4.

29
Figure 4. Example candidate BGCs identified by plantiSMASH. Five example candidate BGCsare shown, which cover a diverse range of enzymatic classes. Dozens of candidate BGCs ofcomparable complexity can be found across the precomputed plantiSMASH results that are availableonline.
2.4.3. Coexpression patterns can guide BGC prioritizationWe subjected the candidate BGCs identified in the genome of A. thaliana to a
more detailed statistical analysis using within-cluster coexpression in a mergedtranscriptomic dataset. For this, we compiled two sets of gene expression datasets,one containing transcriptomic experiments of biological treatments (defense;Supplementary Table S5) and one containing experiments of hormone treatmentsand non-biological stress inductions (Supplementary Table S6). Together, thesedatasets comprise transcriptomic measurements of 1047 samples. The Mann–Whitney U one-sided test was selected to test which of the A. thaliana BGCs have astatistically greater within-cluster coexpression distribution than the genome’sbackground coexpression distribution. Given a BGC consisting of x genes, thebackground distribution for the statistical test of this cluster contains all PCCsbetween pairs of genes that are x-1, x-2, ..., 0 genes away from each other acrossthe entire genome (except predicted BGCs). Only genes observed in alltranscriptomic experiments were allowed in the test, and only PCCs between genesthat each have a Median Absolute Deviation >0 are added to the distributions. Lastly,the CD-HIT algorithm was run on the entire A. thaliana proteome at 0.5 identitycutoff (same as plantiSMASH’s default) to cluster all similar enzymes. The samestatistical tests were repeated afterward, but this time discarding PCCs betweengenes that code for enzymes within the same CD-HIT cluster, ensuring bothdistributions only include coexpression of genes that produce enzymes of differentclasses, which more accurately resembles the type of interactions desired in a bonafide BGC. The results of these analyses (Supplementary Table S8 and Figure S3)show that at a significance level of 0.05, 11 predicted BGCs showed statisticallyhigher within cluster coexpression than their respective background distribution evenwhen discarding coexpression between genes in the same CD-HIT cluster. This listincludes the four known A. thaliana BGCs, encoding the biosynthetic pathways forarabidiol/baruol (P = 2.92e-40), thalianol (P = 1.94e-17), marneral (P = 7.03e-10)and tirucalla-7,24-dien3-ol (P = 1.10e-4), which corroborates that coexpression is a

30and tirucalla-7,24-dien3-ol (P = 1.10e-4), which corroborates that coexpression is avalid criterion to prioritize functional BGCs.
There are several explanations for the fact that strong coexpression is observedfor some candidate BGCs but not others. A first explanation is that their coordinatedexpression is induced by conditions not included in these transcriptomicexperiments; in other words, absence of evidence of coexpression is not evidence ofabsence of coexpression. A second explanation is that a number of candidate BGCsprobably do not encode entire consistently coexpressed biosynthetic pathways bythemselves; evidence for this comes from an analysis of characterized enzyme-coding genes inside these candidate BGCs (Supplementary Table S9); e.g.AT1G24100 and AT5G57220, which occur in two different candidate BGCs, areknown to each be involved in a different branch of glucosinolate biosynthesis (40,41),a complex multifurcated pathway that shows only partial and fragmented genomicclustering. Contrary to what might be expected, however, there was no strongcorrelation (R = 0.004, and P = 0.64 when fitting linear regression) of coexpressionwith cluster size, which suggests that the default plantiSMASH BGC prediction cut-offs are not set too inclusively.
All in all, coexpression analysis provides a powerful tool to prioritize the candidateBGCs detected by plantiSMASH that are most likely to encode functional pathways.
2.5. ConclusionsThe highly automated discovery of candidate BGCs by plantiSMASH and the
powerful visualizations of coexpression data that allow their prioritization present akey technological step in the route toward high-throughput genome mining of plantnatural products. As plant genome sequencing and assembly technologies continueto improve at a rapid pace, it is likely that high-quality plant genomes for thousandsof species will soon be available; hence, ‘clustered’ biosynthetic pathways presentlow-hanging fruits for the discovery of novel molecules. Empowered by syntheticbiology tools and powerful heterologous expression systems in yeast and tobacco(42–46), this will likely make it possible to scale up plant natural product discoverytremendously.
Continued development of the antiSMASH/plantiSMAS H framework in thefuture is needed to further accelerate this process: e.g. the development of(machine-learning) algorithms that predict substrate specificities of key enzymes liketerpene synthases, and the systematic construction of pHMMs for automatedsubclassification of complex enzyme families such as cytochrome P450s andglycosyltransferases, will allow more powerful predictions of the natural productstructural diversity encoded in diverse BGCs. Additionally, detailed evolutionarygenomic analysis of the phenomenon of gene clustering, including BGC birth, deathand change processes, will further our understanding of how BGCs facilitate naturalproduct diversification during evolution. As more plant BGCs are experimentallycharacterized, the algorithms will co-evolve with the knowledge gained, and moredetailed class-specific cluster detection rules could be designed; moreover, it willbecome clearer what does and what does not constitute a bona fide BGC. Finally,when scientists further unravel the complexities of tissue-specific and differentiallytimed gene expression of plant biosynthetic pathways, we will learn more on howbest to leverage coexpression data for biosynthetic pathway prediction.
Thus, a more comprehensive understanding of the remarkable successes of

31Thus, a more comprehensive understanding of the remarkable successes of
evolution to generate an immense diversity of powerful bioactive molecules willhopefully make it possible for biological engineers to mimic nature’s strategies anddeliver many useful new molecules for use in agricultural, cosmetic, dietary andclinical applications.
2.6. Supplementary InformationSupplementary figures and tables are available to download from:
https://doi.org/10.1093/nar/gkx305
References
1. Jensen,P.R. (2016) Natural products and the gene cluster revolution. TrendsMicrobiol., 24, 968–977.
2. Medema,M.H. and Fischbach,M.A. (2015) Computational approaches to naturalproduct discovery. Nat. Chem. Biol., 11, 639–648.
3. Rutledge,P.J. and Challis,G.L. (2015) Discovery of microbial natural products byactivation of silent biosynthetic gene clusters. Nat. Rev. Microbiol., 13, 509–523.
4. Ziemert,N., Alanjary,M. and Weber,T. (2016) The evolution of genome mining inmicrobes - a review. Nat. Prod. Rep., 33, 988–1005
5. Medema,M.H., Blin,K., Cimermancic,P., de Jager,V., Zakrzewski,P.,Fischbach,M.A., Weber,T., Takano,E. and Breitling,R. (2011) antiSMASH: rapididentification, annotation and analysis of secondary metabolite biosynthesis geneclusters in bacterial and fungal genome sequences . Nucleic Acids Res., 39,W339–W346.
6. Blin,K., Medema,M.H., Kazempour,D., Fischbach,M.A., Breitling,R., Takano,E.and Weber,T. (2013) antiSMASH 2.0––a versatile platform for genome mining ofsecondary metabolite producers. Nucleic Acids Res., 41, W204–W212.
7. Weber,T., Blin,K., Duddela,S., Krug,D., Kim,H.U., Bruccoleri,R., Lee,S.Y.,Fischbach,M.A., Muller,R., Wohlleben,W. et al. (2015) antiSMASH 3.0–acomprehensive resource for the genome mining of biosynthetic gene clusters.Nucleic Acids Res., 43, W237–W243.
8. Frey,M., Chomet,P., Glawischnig,E., Stettner,C., Grun,S., Winklmair,A.,Eisenreich,W., Bacher,A., Meeley,R.B., Briggs,S.P. et al. (1997) Analysis of achemical plant defense mechanism in grasses. Science, 277, 696–699.
9. Qi,X., Bakht,S., Leggett,M., Maxwell,C., Melton,R. and Osbourn,A. (2004) Agene cluster for secondary metabolism in oat: implications for the evolution ofmetabolic diversity in plants. Proc. Natl. Acad. Sci. U.S.A., 101, 8233–8238.
10. Nutzmann,H.-W. and Osbourn,A. (2014) Gene clustering in plant specializedmetabolism. Curr. Opin. Biotechnol., 26, 91–99.
11. Nutzmann,H.W., Huang,A. and Osbourn,A. (2016) Plant metabolic geneclusters––from genetics to genomics. New Phytol., 211, 771–789.

32
12. Yu,N., Nutzmann,H.-W., MacDonald,J.T., Moore,B., Field,B., Berriri,S., Trick,M.,Rosser,S.J., Kumar,S.V., Freemont,P.S. et al. (2016) Delineation of metabolicgene clusters in plant genomes by chromatin signatures. Nucleic Acids Res., 44,2255–2265.
13. VanBuren,R., Bryant,D., Edger,P.P., Tang,H., Burgess,D., Challabathula,D.,Spittle,K., Hall,R., Gu,J., Lyons,E. et al. (2015) Single-molecule sequencing ofthe desiccation-tolerant grass Oropetium thomaeum. Nature, 527, 508–511.
14. Medema,M.H. and Osbourn,A. (2016) Computational genomic identification andfunctional reconstitution of plant natural product biosynthetic pathways. Nat.Prod. Rep., 33, 951–962.
15. Shi,M.-Z. and Xie,D.-Y. (2014) Biosynthesis and metabolic engineering ofanthocyanins in Arabidopsis thaliana. Recent Pat. Biotechnol., 8, 47–60.
16. Ibarra-Laclette,E., Lyons,E., Hernandez-Guzman,G., Perez-Torres,C.A.,Carretero-Paulet,L., Chang,T.-H., Lan,T., Welch,A.J., Juarez,M.J.A., Simpson,J.et al. (2013) Architecture and evolution of a minute plant genome. Nature, 498,94–98.
17. Keller,B. and Feuillet,C. (2000) Colinearity and gene density in grass genomes.Trends Plant Sci., 5, 246–251.
18. Kellogg,E.A. and Bennetzen,J.L. (2004) The evolution of nuclear genomestructure in seed plants. Am. J. Bot., 91, 1709–1725.
19. Sandhu,D. and Gill,K.S. (2002) Gene-containing regions of wheat and the othergrass genomes. Plant Physiol., 128, 803–811.
20. Itkin,M., Heinig,U., Tzfadia,O., Bhide,A.J., Shinde,B., Cardenas,P.D.,Bocobza,S.E., Unger,T., Malitsky,S., Finkers,R. et al. (2013) Biosynthesis ofantinutritional alkaloids in solanaceous crops is mediated by clustered genes.Science, 341, 175–179.
21. Shang,Y., Ma,Y., Zhou,Y., Zhang,H., Duan,L., Chen,H., Zeng,J., Zhou,Q.,Wang,S., Gu,W. et al. (2014) Biosynthesis, regulation, and domestication ofbitterness in cucumber. Science, 346, 1084–1088.
22. Eddy,S.R. (2011) Accelerated profile HMM searches. PLoS Comput. Biol., 7,e1002195.
23. Fu,L., Niu,B., Zhu,Z., Wu,S. and Li,W. (2012) CD-HIT: accelerated for clusteringthe next-generation sequencing data. Bioinformatics, 28, 3150–3152.
24. Finn,R.D., Bateman,A., Clements,J., Coggill,P., Eberhardt,R.Y., Eddy,S.R.,Heger,A., Hetherington,K., Holm,L., Mistry,J. et al. (2014) Pfam: the proteinfamilies database. Nucleic Acids Res., 42, D222–D230.
25. Wu,F., Zhu,H., Sun,L., Rajendran,C., Wang,M., Ren,X., Panjikar,S.,Cherkasov,A., Zou,H. and Stockigt,J. (2012) Scaffold tailoring by a newlydetected Pictet-Spenglerase activity of strictosidine synthase: from the commontryptoline skeleton to the rare piperazino-indole framework. J. Am. Chem. Soc.,134, 1498–1500.
26. Lee,E.-J. and Facchini,P. (2010) Norcoclaurine synthase is a member of thepathogenesis-related 10/Bet v1 protein family. Plant Cell, 22, 3489–3503
27. Majoros,W.H., Pertea,M. and Salzberg,S.L. (2004) TigrScan and GlimmerHMM:

3327. Majoros,W.H., Pertea,M. and Salzberg,S.L. (2004) TigrScan and GlimmerHMM:
two open source ab initio eukaryotic gene-finders. Bioinformatics, 20, 2878–2879.28. Goodstein,D.M., Shu,S., Howson,R., Neupane,R., Hayes,R.D., Fazo,J.,
Mitros,T., Dirks,W., Hellsten,U., Putnam,N. et al. (2012) Phytozome: acomparative platform for green plant genomics. Nucleic Acids Res., 40, D1178–D1186.
29. Rajniak,J., Barco,B., Clay,N.K. and Sattely,E.S. (2015) A new cyanogenicmetabolite in Arabidopsis required for inducible pathogen defence. Nature, 525,376–379.
30. Serin,E.A.R., Nijveen,H., Hilhorst,H.W.M. and Ligterink,W. (2016) Learning fromco-expression networks: possibilities and challenges. Front. Plant Sci., 7, 444.
31. Blondel,V., Guillaume,J., Lambiotte,R. and Lefebvre,E. (2008) Fast unfolding ofcommunities in large networks. J. Stat. Mech., 10, P10008.
32. Sato,S., Nakamura,Y., Kaneko,T., Asamizu,E., Kato,T., Nakao,M., Sasamoto,S.,Watanabe,A., Ono,A., Kawashima,K. et al. (2008) Genome structure of thelegume, Lotus japonicus. DNA Res., 15, 227–239.
33. Buchfink,B., Xie,C. and Huson,D.H. (2014) Fast and sensitive protein alignmentusing DIAMOND. Nat. Methods, 12, 59–60.
34. Medema,M.H., Kottmann,R., Yilmaz,P., Cummings,M., Biggins,J.B., Blin,K., deBruijn,I., Chooi,Y.H., Claesen,J., Coates,R.C. et al. (2015) Minimum informationabout a biosynthetic gene cluster. Nat. Chem. Biol., 11, 625–631.
35. Winzer,T., Gazda,V., He,Z., Kaminski,F., Kern,M., Larson,T.R., Li,Y., Meade,F.,Teodor,R., Vaistij,F.E. et al. (2012) A Papaver somniferum 10-gene cluster forsynthesis of the anticancer alkaloid noscapine. Science, 336, 1704–1708.
36. Takos,A.M., Knudsen,C., Lai,D., Kannangara,R., Mikkelsen,L., Motawia,M.S.,Olsen,C.E., Sato,S., Tabata,S., Jørgensen,K. et al. (2011) Genomic clustering ofcyanogenic glucoside biosynthetic genes aids their identification in Lotusjaponicus and suggests the repeated evolution of this chemical defence pathway.Plant J., 68, 273–286.
37. Kagale,S., Koh,C., Nixon,J., Bollina,V., Clarke,W.E., Tuteja,R., Spillane,C.,Robinson,S.J., Links,M.G., Clarke,C. et al. (2014) The emerging biofuel cropCamelina sativa retains a highly undifferentiated hexaploid genome structure.Nat. Commun., 5, 3706.
38. Chalhoub,B., Denoeud,F., Liu,S., Parkin,I.A.P., Tang,H., Wang,X., Chiquet,J.,Belcram,H., Tong,C., Samans,B. et al. (2014) Early allopolyploid evolution in thepost-Neolithic Brassica napus oilseed genome. Science, 345, 950–953.
39. Schmutz,J., Cannon,S.B., Schlueter,J., Ma,J., Mitros,T., Nelson,W., Hyten,D.L.,Song,Q., Thelen,J.J., Cheng,J. et al. (2010) Genome sequence of thepalaeopolyploid soybean. Nature, 463, 178–183.
40. Grubb,C.D., Zipp,B.J., Ludwig-M ¨uller,J., Masuno,M.N., Molinski,T.F. andAbel,S. (2004) Arabidopsis glucosyltransferase UGT74B1 functions inglucosinolate biosynthesis and auxin homeostasis. Plant J., 40, 893–908.
41. Pfalz,M., Vogel,H. and Kroymann,J. (2009) The gene controlling the indoleglucosinolate modifier1 quantitative trait locus alters indole glucosinolatestructures and aphid resistance in Arabidopsis. Plant Cell, 21, 985–999.

34
42. Casini,A., Storch,M., Baldwin,G.S. and Ellis,T. (2015) Bricks and blueprints:methods and standards for DNA assembly. Nat. Rev. Mol. Cell Biol., 16, 568–576.
43. Liu,W., Yuan,J.S. and Stewart,C.N. (2013) Advanced genetic tools for plantbiotechnology. Nat. Rev. Genet., 14, 781–793.
44. Patron,N.J. (2014) DNA assembly for plant biology: techniques and tools. Curr.Opin. Plant Biol., 19, 14–19.
45. Patron,N.J., Orzaez,D., Marillonnet,S., Warzecha,H., Matthewman,C.,Youles,M., Raitskin,O., Leveau,A., Farre,G., Rogers,C. et al. (2015) Standardsfor plant synthetic biology: a common syntax for exchange of DNA parts. NewPhytol., 208, 13–19.
46. Thimmappa,R., Geisler,K., Louveau,T., O’Maille,P. and Osbourn,A. (2014)Triterpene biosynthesis in plants. Annu. Rev. Plant Biol., 65, 225–257.
47. Boutanaev,A.M., Moses,T., Zi,J., Nelson,D.R., Mugford,S.T., Peters,R.J. andOsbourn,A. (2014) Investigation of terpene diversification across multiplesequenced plant genomes. Proc. Natl. Acad. Sci. U.S.A., 112, E81–E88.
48. Field,B. and Osbourn,A.E. (2008) Metabolic diversification–independentassembly of operon-like gene clusters in different plants. Science, 320, 543–547.

35
Chapter 3Drivers of metabolic diversification:
how dynamic genomicneighbourhoods generate newbiosynthetic pathways in the
BrassicaceaeZhenhua Liu1* , Hernando G. Suarez Duran2* , Yosapol Harnvanichvech2 , MichaelJ. Stephenson1 , M. Eric Schranz3 , David Nelson4, Marnix H. Medema2 and AnneOsbourn1
1 Department of Metabolic Biology, John Innes Centre, Norwich Research Park,Colney Lane, Norwich, NR4 7UH, UK2 Bioinformatics Group, Wageningen University, Droevendaalsesteeg 1 6708PB,Wageningen, the Netherlands3 Biosystematics Group, Wageningen University, Droevendaalsesteeg 1 6708PB,Wageningen, the Netherlands4 Department of Microbiology, Immunology and Biochemistry, University ofTennessee, 858 Madison Avenue, Suite G01, Memphis, TN 38163, USA
* These authors contributed equally to the paper as first authors.
Published in New Phytologist 227:1109-1123

36
3.1. IntroductionPlants are chemical engineers par excellence, and are collectively estimated to
make over a million different specialized metabolites (Afendi et al., 2012). Thesecompounds have important ecological functions, providing protection against attackby pests and pathogens, inhibiting the growth of competing plants, shaping the plantmicrobiome, and serving as attractants for seed dispersal agents and pollinators(Weng et al., 2012a; Huang et al., 2019). Plant natural products also are a richsource of bioactives for medicinal, agricultural and industrial applications (Böttger etal., 2018). Despite their tremendous chemical diversity, the mechanismsunderpinning the evolution of new metabolic pathways are poorly understood.Although individual enzymes are known to be recruited primarily through geneduplication, often involving sub‐ or neo‐functionalization, little is known about howpathways consisting of multiple biosynthetic steps originate (Weng, 2014). It hasrecently become apparent that the genes for the biosynthesis of various naturalproducts, such as the plant defence compound avenacin A‐1 from oat (antimicrobialtriterpene) (Qi et al., 2004), noscapine from opium poppy (anticancer alkaloid)(Winzer et al., 2012; Guo et al., 2018), and dhurrin from sorghum (an insect repellentcyanogenic glycoside) (Takos et al., 2011) are clustered in plant genomes. Theseplant biosynthetic gene clusters (BGCs) consist of at least three different classes ofenzyme‐encoding genes (Medema & Osbourn, 2016) and bring unique perspectivestowards metabolic innovation and diversification. First, plant BGCs have notoriginated from microbes via horizontal gene transfer. Instead, they appear to havearisen from plant genes by as yet unknown mechanisms, presumably honed byrounds of natural selection (Field & Osbourn, 2008). Those BGCs that make thesame/very similar types of compounds are usually restricted to a narrow taxonomicwindow of closely related lineages (Nutzmann et al., 2016), suggesting that theseBGCs must have assembled relatively recently in evolutionary time. Second, plantBGCs usually contain a gene encoding an enzyme that makes the natural productscaffold, along with a combination of genes encoding other types of enzymes thatmodify this scaffold (tailoring enzymes) (Medema & Osbourn, 2016). The ‘rules’ thatgovern the evolutionary interplay between genes encoding different scaffold‐generating enzymes and tailoring enzymes are not understood. Therefore,understanding the evolution and diversification of plant BGCs is expected to offernew insights into how plants have acquired the ability to synthesize such aremarkable diversity and complexity of specialized metabolites.
The terpenoids are the major class of plant natural products, comprising ~40% ofthe plant natural products discovered thus far (Chassagne et al., 2019); of these, thetriterpenes are the largest and most structurally complex (> 20 000 reported so far)(Christianson, 2017). We have previously shown that the genes for the biosynthesisof structurally diverse triterpenes are organized in BGCs in the genome of the modelplant Arabidopsis thaliana (Field & Osbourn, 2008). Arabidopsis thaliana is amember of the mustard family, Brassicaceae (Cruciferae), which includeseconomically important crop plants such as turnip, cabbage and oilseed rape. Whenwe started this project, 13 high‐quality sequenced Brassicaceae genomes coveringlineages I‐II (Beilstein et al., 2010) and early diverging species were available(Supporting Information Table S1). The evolutionary relationships among most of

37(Supporting Information Table S1). The evolutionary relationships among most ofthese genomes are well‐defined by phylogenomic analysis (Beilstein et al., 2010).Furthermore, several explicit examples of gene duplication‐promoted metabolicinnovation have been reported in the Brassicaceae (Weng et al., 2012b; Edger et al.,2015; Liu et al., 2016), demonstrating that Brassicaceae genomes are excellentworking materials for exploring the genomic basis underpinning metabolicdiversification. Herein we take advantage of the extensive resource of available high‐quality genome sequences to systematically investigate the genomic mechanismsunderlying triterpene diversification in the wider Brassicaceae.
3.2. Materials and Methods
3.2.1. Genome miningGenomes were retrieved from NCBI (https://www.ncbi.nlm.nih.gov/), CoGE
(https://www.genomevolution.org/coge/) and Phytozome v.12.0(https://phytozome.jgi.doe.gov/) in GenBank format. To thoroughly identifyoxidosqualene cyclase (OSC) loci, both Hmmer3 (Finn et al., 2011) and Blastp(Altschul et al., 1990) were used to identify OSC homologues. The Hmmer profiles(pHMMs) were downloaded from the PFAM library (Finn et al., 2016). PF13243(targeting OSC N‐terminal) and PF13249 (targeting OSC C‐terminal) were used tosearch for OSC homologues with hmmsearch. The cut_tc (trusted cut‐off) optionwas used. For Blastp, protein identity ≥ 40 and bit score ≥ 100 were used as cut‐offs,and AtCAS1 (At2g07050) was used as query sequence. Blastp identified the sameOSCs present in the Hmmer analysis, but Hmmer showed slightly more candidates.The Hmmer output was aligned with outgroup protein PGGT1B_sp(geranylgeranyltransferase type I) by using Muscle (Edgar, 2004), generating amultiple sequence alignment (MSA). The MSA then was trimmed manually to keeponly the conserved domains and used to build a phylogenetic tree with FastTree 2.1using standard parameters (Price et al., 2010). Support for tree nodes was assessedusing fast global bootstrap iterations (Tamatakis et al., 2008; Price et al., 2010).Bootstrap values (1000 iterations) > 0.7 are shown in Fig. S1. Proteins grouped withoutgroup PGGT1B_sp were discarded (nine proteins). To fully annotate the tree, wepropagated subfamily annotations present in A. thaliana, resulting in three distinctgroups: clade I, clade II and the sterol clade (Field and Osbourn, 2008). Anotherphylogeny of OSCs was reconstructed using the RAxML method (Kozlov et al.,2019), which generated a tree with 134 of 164 partitions identical to the treegenerated by FastTree, differing mainly in some deep ancestral splits that aredifficult to resolve (Fig. S2). Pfam domains PF00067 and PF02458 were used toidentify members of the cytochrome P450 (CYP) gene/protein family and theacyltransferase (ACT) gene/protein family, respectively. The identified CYP and ACTgenes were pooled separately, and we used the hmmalign – trim option to trimnonconserved domains. Hmmalign‐based MSAs were taken as input to inferphylogenetic trees with FastTree. Well‐annotated A. thaliana CYPs (Nelson, 2009)and ACTs (Tuominen et al., 2011) were used as markers to annotate protein families

38and ACTs (Tuominen et al., 2011) were used as markers to annotate protein families
and subfamilies in the phylogenetic tree (Figs S3, S4). The CYPs that werefunctionally characterized in this study were formally assigned to subfamilies andnamed as CYP708A9, CYP708A10, CYP705A38, CYP708A11 and CYP705A37v2according to procedures of the Cytochrome P450 homepage (Nelson, 2009).
3.2.2. Genomic Neighbourhoods (GN) association analysisWe developed a simple tool to identify and isolate the GNs of a given list of target
genes based on a user‐specified number of flanking genes. In this study, we defined‘GNs’ as the OSC flanking regions extending five genes either side of an OSC gene.This resulted in most GNs consisting of 11 genes with two exceptions: OSCs locatedin a scaffold with < 11 genes result in smaller GNs, and OSCs in close proximity toeach other result in overlapping GNs, which are merged into one large GNcontaining more than 11 genes. After identifying all OSC GNs across theBrassicaceae genomes, Pfam protein domain content was predicted using Hmmer.
Because of the differences in domain content among the GNs of the three OSCclades (Field & Osbourn, 2008), we explored the enrichment of protein domains inthe OSC GNs separately for each OSC clade by comparing them to the rest of thegenomes with a hypergeometric test (one‐tailed exact Fisher's test) and theBonferroni correction for multiple comparisons. The close phylogenetic relationshipsbetween the species in our study potentially presents a problem for standardstatistical procedures, because various studies have shown that the commonevolutionary history of related species results in an abundance of type I errors(Martins & Garland 1991; Martins et al., 2002), in part due to the nonindependenceof the samples. To address the possibility of an inflation of degrees of freedom withinthe enrichment test, we used the OSC phylogenetic tree that we had generatedpreviously and grouped together all monophyletic groups of leaves that share thetrait targeted by the test. We used the conservative assumption that each clade ofOSCs for which all GNs contain a particular protein domain represents a group ofvertically inherited orthologues. Based on this, we then selected only the leaf with thehighest target protein domain count for the enrichment test, instead of each leafindividually, effectively increasing the independence of the samples and resulting in areduction of successful counts (k in the hypergeometric test). Because of the highabundance of CYP and Transferase domains in the OSC GNs, we also tested theenrichment of CYP and Transferase subfamilies separately.
Multiple methods that incorporate phylogenetic information into statisticalprocedures have been developed, with no method being objectively better than allothers in all cases. All of them have the disadvantage, compared to the Fisher'sexact test, that they do not take into account the frequency at which a given domainoccurs in the rest of the genome. To further reduce the problems that arise fromphylogenetic relatedness, in our study, we selected two of these phylogeneticmethods to complement our initial exploration of enriched domains: phylogeneticlogistic regression (PLR), and phylogenetic generalized linear mixed models(PGLMM) (Ives & Garland, 2010), both of which have been shown to be robust andadequate for studying the evolution of binary traits (Garamszegi, 2014). The maindifference between the models is how the phylogenetic component is applied to theregression models: in PLR models, the dependent variable (the trait of interest)

39regression models: in PLR models, the dependent variable (the trait of interest)evolves to 0 or 1 through a lineage according to a switching rate, whereas PGLMMincludes an additional hidden trait that evolves through the phylogenetic tree anddetermines the probability of the dependent variable evolving to 0 or 1 at the tip.When using regression methods such as PLR and PGLMM, the strength ofassociation between the dependent and independent variables is not symmetrical,making their selection an important step for correct interpretation. We selected theabsence and presence of OSC subfamilies in the GNs as the independent variables(i.e. the GN‐centric OSC belonging either to clade I, clade II or the sterol clade), andthe absence and presence of each of the other protein domains as dependentvariables; this approach allows us to interpret significant associations in theregression models that indicate whether the absence/presence of a given OSCsubfamily (as opposed to others) in a GN is a strong predictor of theabsence/presence of specific protein domains in their GNs.
We performed the phylogenetic regressions in R/ape v.5.0 using the‘binaryPGLMM’ function found in the package (Paradis et al., 2004) for PGLMM,and R/phylolm v.2.6 (Ho & Ané 2014) for PLR. Because we were interpreting theresults of the two regression models in conjunction with other statistical tests andphylogenomic analysis, we set the significance threshold at P < 0.1 and did not applymultiple testing correction.
3.2.3. All‐vs‐all comparison of OSC GNsIn order to assess the similarity amongst the identified OSC GNs, we first
measured the average amino acid identity between protein domains that appear incompared GNs. In the case of GNs with multiple copies of any domain, thesequence identity of all possible domain pairs is identified and the Hungarianalgorithm (Kuhn, 1955) is used to select the pairs resulting in the highest average.When a GN has extra copies of a protein domain, the highest identity scores areselected, and the additional domains are removed until both GNs have the samenumber of copies, after which the Hungarian algorithm is used. We next used twoother tools from BiG‐Scape (Navarro‐Muñoz et al., 2018)(https://git.wageningenur.nl/medema-group/BiG-SCAPE) to compare GNs. BiG‐Scape compares loci with multiple genes based on three criteria, two of which are ofinterest to us: domain composition similarity, measured here with the Jaccard indexof identified protein domains, and domain sequence similarity (DSS), measured byaveraging the sequence similarity of shared domains, with a score penalization whena GN has extra copies of a protein domain that are not present in the other. Toensure a fair comparison, only OSC GNs with ≥ 11 genes were selected as input forthe tool.
3.2.4. Mapping GNs to their whole‐genome duplication(WGD)‐derived syntenic blocks
The WGD‐derived syntenic regions in A. thaliana are defined by ‘anchor genes’which retain sequence similarity with its paralogue in its sister region, and the full listof anchor genes and syntenic regions is publicly available (Freeling et al., 2007). We

40of anchor genes and syntenic regions is publicly available (Freeling et al., 2007). Weidentified the anchor genes upstream and downstream of each OSC GN and usedthem to define their corresponding sister regions. To compare each GN with its sisterregion, we generated a MSA with Muscle (Edgar, 2004) and a sequence similaritymatrix with R/seqinr v.3.4 (Charif & Lobry, 2007).
3.2.5. Ancestral states reconstructionWe pruned and isolated clade II OSCs from the phylogenetic tree and then
removed the 11 leaves corresponding to GNs with < 11 genes. Given that GNs withmultiple OSCs appear as multiple leaves in the phylogenetic tree, only one leaf wasselected as being representative of the neighborhood based on maximizing the DSS(domain sequence similarity) index with the surrounding leaves in the tree; thenonrepresentative OSC leaves were removed.
In order to explore the evolutionary history of the selected GNs, we assignedbinary traits to each leaf according to the presence (=1) or absence (=0) of the mostabundant tailoring enzymes within the clade II OSC GNs (CYP702A, CYP705A,CYP708A and ACT IIIa) and reconstructed their ancestral states through the tree viamaximum parsimony by using the Mesquite software (Maddison & Maddison, 2008).We selected the maximum parsimony criterion because it does not require theassumption of an underlying model of evolution for the assembly of plant biosyntheticgene clusters (BGCs), a process that is still poorly understood.
We used the CYP and ACT phylogenetic trees to validate the ancestral statereconstruction of CYP705A and ACT IIIa in the OSC tree. For this, we pruned bothtrees to remove all genes in a scaffold with < 11 genes (32 CYP705As, 59 ACTIIIas) and isolated the CYP705A and ACT IIIa subtrees. Furthermore, as additionalvalidation, we also reconstructed the ancestral states on an OSC phylogenygenerated by RAxML. Although the resulting tree had some differences in the deepancestral splits (Fig. S2), ancestral state reconstruction on this tree would lead to thesame conclusions regarding multiple parallel origins of complex triterpenebiosynthetic loci.
3.2.6. Evolutionary testsThe OSC protein‐coding DNA sequences were aligned with TranslatorX
(Abascal et al., 2010). Genes with sequence length < 2200 nucleotides and poorlyaligned genes were both filtered. The final alignment and the input tree used for thevarious evolutionary tests can be found on Zenodo (doi: 10.5281/zenodo.3531676).This alignment was subjected to evolutionary tests in the HyPHy package (Pond etal., 2005). BUSTED analysis was used to infer whether a gene has experiencedpositive selection at at least one site on at least one branch (Murrell et al., 2015).MEME analysis was used to detect individual sites evolving under positive selectionin a proportion of branches (Murrell et al., 2012). For both analyses, ‘universalgenetic code’ was selected and P < 0.05 was set for significance.
3.2.7. Plant material and growth conditionsCapsella rubella (Monte Gargano) and Brassica rapa (r‐o‐18) seeds were
obtained from Lars Østergaard and Arabidopsis lyrata seeds (accession VLP6) from

41obtained from Lars Østergaard and Arabidopsis lyrata seeds (accession VLP6) from
Levi Yant (John Innes Centre). Plants were grown from these seeds in a controlledgrowth chamber at 22°C under long‐day light conditions (16 h : 8 h, light : dark).Nicotiana benthamiana plants were grown in a glasshouse, under the same long‐daylight conditions.
3.2.8. RNA isolation and RT‐qPCR analysisTotal RNA for A. thaliana, A. lyrata and C. rubella were isolated from post‐
flowering plants using TRIzol reagent (ThermoFisher, Carlsbad, CA, USA). Rootswere dug out from soil and then washed thoroughly with water. Leaves werecollected from rosettes and stems were collected from the basal second internodes.Plant material was frozen in liquid N2 immediately after harvesting. Reversetranscription reactions were performed using ≤ 2 μg of total RNA, random primersand a reverse transcription kit (Agilent, Santa Clara, CA, USA). The cDNAs wereused as templates for quantitative (q)PCR analysis which was carried out using aCFX Real‐time PCR system (Bio‐Rad). PCR reactions (15 μl) consisted of: 7.5 μlSYBR Green I master mix solution (Roche), 1 μl gene specific primers, 5× dilutedcDNAs and water. The amplification protocol involved denaturation at 95°C for 2min, followed by 39 cycles of 95°C for 10 s and 62°C for 20 s. Amplicon dissociationcurves (i.e. melting curves) were recorded after cycle 39 by heating from 65 to 95°Cin 0.5°C increments. The specificity of the amplification products was verified bymelting curve analysis. ACTIN or PP2A was used as a reference. Normalized geneexpression levels were calculated using the 2−ΔΔCt method (Livak & Schmittgen,2001). The qPCR experiments were conducted using three independent biologicalreplicates, each consisting of three technical replicates. Primers are listed in TableS2.
3.2.9. Isolation of mutants of C. rubellaIsolation of TILLING (Targeting Induced Local Lesions IN Genomes)
mutantsCapsella rubella TILLING mutants were ordered from RevGenUK
(https://jicbio.nbi.ac.uk/revgen.html) at the John Innes Centre. Pre‐screening wascarried out with DNA pools from M2 progeny by sequencing of PCR productsamplified using specific primer pairs (Table S2). Ten M3 seeds from each positiveline were sown. Thirteen independent lines bearing a mutation in CYP708A9 and tenwith a mutation in CYP705A38 gene were obtained. No CYP708A10 TILLINGmutant lines were identified (Fig. S5a,b). Mutations were confirmed by sequencing.Only line Mcr705‐8 showed accumulation of tirucalla‐8,24‐dien‐3β,23‐diol (Ti2) incomparison to wild‐type (WT). This line was then crossed with the WT line. The F2population derived from these crosses was used for metabolite analysis andmorphological phenotyping analysis.
Constructs for CRISPR‐Cas9 vector and mutant isolationGolden Gate (GG) assembly of a CRISPR‐Cas9 vector for genome editing using

42Golden Gate (GG) assembly of a CRISPR‐Cas9 vector for genome editing using
the seed FAST‐RFP as screen marker (Shimada et al., 2010) was carried out asdescribed recently (Castel et al., 2019). Two gene‐specific guide RNA (gRNA)‐targeting sequences before a protospacer adjacent motif (PAM, NGG) site wereselected (Fig. S5c). Briefly, the gRNA targeting sequences were synthesized withinforward primers. Together with a universal reverse primer, a c. 200‐bp fragmentincluding CRISPR‐Cas9 targeting fragment and gRNA backbone was amplified byPCR. The level 1 GG reaction contained: 20 ng pICSL90002 plasmid, 2.5 ng gRNAfused fragment, 61 ng pICH47751 (for gRNA1) or pICH47761 plasmid (for gRNA2),1 μl Bsa I HF New England Biolabs (NEB, Ipswich, MA, USA), 1.5 μl 10× Bovineserum albumin (BSA), 1.5 μl T4 ligase buffer (10×), 1 μl T4 ligase and water (finalvolume 15 μl). The GG assembly protocol was as follows: (37°C for 4 min, 16°C for3 min) × 25 cycles, then 65°C for 10 min. The gRNA targeting sequence region afterGG assembly was verified by sequencing. The level 2 GG reaction contained: 160ng pICSL4723 plasmid, 83 ng pICSL11015 plasmid, 135 ng BCJJ358 plasmid, 59ng pICH47751 assembled gRNA1 level 1 product, 59 ng pICH47761 assembledgRNA2 level 1 product, 41 ng pICH41780, 0.5 μl Bpi I, 1.5 μl 10× BSA, 1.5 μl T4ligase buffer (10×), 0.5 μl T4 ligase and water (final volume 15 μl). The GG assemblyprotocol was set up as: (37°C for 3 min, 16°C for 4 min) × 25 cycles, 65°C for 10min. HindIII digestion was used to verify the level 2 GG assembled product.Agrobacterium tumefaciens strain LBA4404 carrying the CRISPR‐Cas9 constructwas used for transformation of C. rubella plants. The floral dipping method used forA. thaliana (Clough & Bent, 1998) was adopted. The concentration of Silwet‐70 wasreduced to 0.15%. Thirty flowering plants were used for floral dipping. T0 fluorescentseeds were screened with a Leica M205FA stereo microscope with a 530 nm‐redfluorescent protein (RFP) LED light source. Twelve fluorescent seeds were obtained.Two T1 lines that had undergone genome editing were identified. One of these (T1‐#20) had a 100‐bp deletion within the CYP708A10 gene in a T1 leaf sample and wastherefore used for next‐generation screening. Twenty‐four nonfluorescent (to avoidCRISPR/Cas9 construct on genome) T1‐#20 seeds were sown to generate T2 lines.Twelve independent T2 lines showed genome editing on the CYP708A10 gene andwere then sown to generate T3 lines. Two independent homozygous lines in the T3generation were used for metabolic analyses.
3.2.10. Transient expression in N. benthamianaConstruct generationThe cDNAs for the A. lyrata AL8G20190, AL8G20160, AL8G20150 and
AL8G20140 genes were amplified from root cDNA, and those of the C. rubellagenes Carubv10016727m, Carubv10017128m, Carubv10017289m,Carubv10017243m and Carubv10017044m were amplified from cDNA from flowerbuds. The cDNAs were cloned into the GATEWAY entry vector pDONR207(Invitrogen) and the constructs were verified by sequencing. The correspondinggenes also were amplified from genomic DNA and cloned and sequenced.AL8G20140 and Carubv10017243m were misannotated in the Phytozome v.12database. The revised sequences and single nucleotide variants are listed in TableS3. The B. rapa genes could not be cloned from available cDNA libraries (root,leaves, stems, flowers and siliques). Genomic DNA was therefore used as template

43leaves, stems, flowers and siliques). Genomic DNA was therefore used as template
to clone the Brara.I04560, Brara.I04561, Brara.I04562 and Brara.I04563 genes. Thesequences of these genes (if different from those represented in the Phytozome v.12database) are listed in Table S3. The cloned genes were then inserted into thepEAQ‐Dest‐1 expression vector (Sainsbury et al., 2009). Constructs were verified bysequencing and introduced into A. tumefaciens strain LBA4404.
Agro‐infiltration of N. benthamiana leavesThe strains harbouring expression constructs were freshly grown on Lysogeny
Broth (LB) plates with antibiotic selection (50 μg ml–1 kanamycin, 50 μg ml–1rifamycin, 100 μg ml–1 streptomycin). For small‐scale analysis, multiple clones werepicked and inoculated into 10 ml LB broth. Cultures were then incubated in a shaker(28°C and 220 rpm) for about 16 h until the OD600 reached c. 2.0. For large‐scaleanalysis, the 10 ml culture was further inoculated to make 1 L culture. LBA4404 cellswere pelleted by centrifuging at 4500 g for 20 min and supernatants were discarded.The pellets were then resuspended in freshly made MMA buffer (10 mM MgCl2, 10mM MES/KOH pH5.6, 150 μM acetosyringone) and diluted to OD600 0.2. Forcombinatorial assay, strains harbouring different constructs were mixed andinfiltrated by a syringe without a needle for small‐scale analysis. For triterpenepurification and NMR analysis, around 75 to 100 plants were infiltrated batch‐wise bya previously described customized vacuum infiltration system (Reed et al., 2017).Leaves were harvested 6 d post‐infiltration and lyophilized.
3.2.11. Metabolite extraction and analysisMetabolite extractionThree dry N. benthamiana leaf disks (9 cm diameter) were ground and saponified
by mixture of ethanol/H2O/KOH pellets in 9 : 1 : 1 (v/v/w) (1 ml) at 70°C for 1 h. Theethanol was removed by evaporation (1 h, 70°C), and the samples were extractedwith 1 ml ethyl acetate/H2O in 1 : 1 (v/v). The suspensions were centrifuged at 16000 g for 1 min and the supernatants collected. The supernatants were dried underN2 and resuspended in 50 μl derivatizing reagent, 1‐(Trimethylsilyl)imidazole‐Pyridine mixture (Sigma‐Aldrich). The samples were incubated at 70°C for 30 minbefore analysis by GC‐MS analysis. For C. rubella metabolites extraction, c. 30 mgof fresh tissues (leaves or flowers) were ground. Samples were extracted andprepared for GC‐MS as described above. Ground samples used for LC‐MS analysiswere extracted with 1 ml ethyl acetate (shaken overnight). The samples were thenextracted with 500 μl of water. The supernatants were dried under N2 andresuspended in 100 μl methanol. The samples were all cleaned via 0.22‐μm nylonfilter tube (Spin‐x centrifuge tube; Costar, Cole‐Pamer, St Neots, UK) prior to LC‐MS analysis.
GC‐MS and LC‐MS‐IT‐TOF analysisGC was performed on an Agilent 7890B fitted with a Zebron ZB5‐HT Inferno
capillary column (Phenomenex, Torrance, CA, USA). A 1‐μl aliquot of each sample

44capillary column (Phenomenex, Torrance, CA, USA). A 1‐μl aliquot of each sample
was injected by a splitless pulse method (2.07 bar pulse pressure) with a GC inlettemperature of 250°C. The oven temperature program began from 170°C (held for 2min) to 290°C (held for 4 min) at a speed of 6°C min–1 and switched to 340°C (held1 min) at a rate of 20°C min–1. Helium was used as carrier gas and the flow ratewas set as 1 ml min–1.
LC‐MS analysis was carried out on a Prominence/Nexera UHPLC systemattached to an Ion‐trap time‐of‐flight (ToF) mass spectrometer (Shimadzu, Kyoto,Japan). Separation was performed on a 100 × 2.1 mm 2.6 μm Kinetex EVO reversephase column (Phenomenemex), using the following gradient of methanol (solventB) vs 0.1% formic acid in water (solvent A): 0 min, 70% B; 10 min, 95% B; 11 min,95% B; 11.1 min, 70% B; 14.5 min, 70% B. The flow rate was 0.5 ml min–1 and therun temperature was set at 40°C. Detection was collected by positive electrosprayMS. Spectra were collected from m/z 200–2000 with automatic sensitivity control setto a target of 70% optimal base peak intensity. Spray chamber conditions were:250°C for curved desorbation line, 300°C for heat block, 1.3 l min−1 for nebulizergas, and drying gas is ‘on’. The instrument was calibrated immediately beforeanalysis, using sodium trifluoroacetate cluster ions according to the manufacturer'sinstructions.
3.2.12. Triterpene purification and NMR analysisFreeze‐dried N. benthamiana leaves were thoroughly extracted using a
SpeedExtractor (E‐914). The extraction method was set as: solvent: ethyl acetate;pressure: 130 bar; three cycles, Hold time Cycle 1: 0 min; Hold time Cycle 2: 5 min;Hold time Cycle 3: 5 min. The extracts were dried by rotatory evaporation. The crudeextracts were dissolved in ethanol and saponified by strong basic anion exchangeresin amberSEP 900 hydroxide beads (Sigma‐Aldrich) for about 30 min (the solventturned to yellow) (Stephenson et al., 2018). The solvent was filtered by a mixturelayers of Celite 545 (Sigma‐Aldrich) and fat‐free quartz sand (Buchi 037689). Theeluted solvent was dried, loaded to an IsoleraOne system silica gel column(BioTage® SNAP Vitra K‐Sil 100g, Uppsala, Sweden) and separated with a gradientof 0–100% ethyl acetate. Fractions (164 ml) were collected in 200 ml Duran bottlesand aliquots (5 μl) monitored on thin layer chromatography (TLC) plate (70644‐50EA, Sigma‐Aldrich). Triterpenes were visualized by spraying of fresh‐madevanillin‐sulfuric acid reagent (1 g vanillin dissolved in 100 ml of 50% sulfuric acid.)Depending on the purity, additional separation of selected fractions was carried outusing a smaller volume column (BioTage® SNAP Vitra KP‐Sil 10g) with 5% ethylacetate in dichloromethane (DCM) as eluent solvent. Fractions from each step wereassessed both by TLC and GC‐MS analysis. Around 2–5 mg purified compoundswere collected and subjected to NMR analysis.
Purified compounds were analysed by NMR spectroscopy. DEPT‐135, DEPT‐edited‐HSQC, COSY, and HMBC experiments were used to fully assign 1H and13C spectra, or spectra were compared to the literature if reported previously. NMRspectra were recorded in Fourier transform mode at a nominal frequency of 400 MHzfor 1H NMR, and 100 MHz for 13C NMR, using the specified deuterated solvent.Chemical shifts were recorded in ppm and referenced to the residual solvent peak or

45Chemical shifts were recorded in ppm and referenced to the residual solvent peak or
to an internal tetramethylsilane (TMS) standard. Multiplicities are described as: s,singlet; d, doublet; dd, doublet of doublets; dt, doublet of triplets; t, triplet; q, quartet;m, multiplet; br, broad; appt, apparent; coupling constants are reported in Hz asobserved and not corrected for second order effects (Table S4).
3.3. Results
3.3.1. Investigation of the genome neighborhoods aroundtriterpene synthase genes
The first committed step in triterpene biosynthesis is catalyzed by triterpenesynthases – also known as OSCs. Our systematic analysis of 13 sequencedBrassicaceae genomes identified a total of 163 predicted OSC genes (Table S1).These OSCs grouped into three major clades: the sterol clade, containing OSCsimplicated in primary sterol biosynthesis, and two other clades (I and II), a topologyconsistent with our earlier investigations of OSCs in A. thaliana (Field & Osbourn,2008; Field et al., 2011). The OSCs located in the previously reported A. thalianaBGCs all belong to clade II (Figs 1a, S1a).

46
Fig. 1. Associations between clade II oxidosqualene cyclases (OSCs) and cytochrome P450(CYP) and acyltransferase (ACT) subfamilies in the Brassicaceae, in rapidly evolving genomicregions. (a) Maximum‐likelihood tree of clade II OSC protein sequences, including representativesterol and clade I OSCs (see Supporting Information Fig. S1 for the full 163 Brassicaceae OSCs).Characterized OSCs for Arabidopsis thaliana biosynthetic gene clusters (BGCs) are indicated inbold; *, OSCs characterized in this study. The ancestral states of CYPs and ACTs in the clade IIOSC gene neighbourhoods (GNs) were reconstructed with maximum parsimony and inferredchanges in state (gene gains and losses) are shown. (b) OSC GNs. The genes encoding the OSC ineach tree leaf in a are positioned in the middle. Arrows denote the strand directionality of genes.CYP and ACT subfamilies are denoted by colours (see key). (c) Heat map showing the CYP andACT domains in the OSC GNs. The colour scale bar shows copy number values.
We then examined the immediate GNs around all 163 OSC genes, extendingfive genes on either side (Fig. 1b; Table S5; all GNs are publicly available inGenBank format at doi: 10.5281/zenodo.3531676) and tested which Pfam domainswere over‐represented in the OSC GNs relative to genome‐wide distribution. Toreduce potential phylogenetic bias due to genes likely derived from commonancestors, domains that appeared consistently in the GNs of monophyletic branchesof OSCs were binned and only the leaf with the largest number of domainappearances was counted (‘conservative’ hypergeometric test, P < 0.01; seeMethods). The results indicate that the sterol, clade I and clade II OSC genes havedistinct GN associations (Tables 1, S6). In general, the Pfam domains associated

47distinct GN associations (Tables 1, S6). In general, the Pfam domains associated
with sterol OSC genes do not have any anticipated roles in specialized metabolism.Although significant associations between clade I OSC genes and ACT Pfamdomains were detected (Tables 1, S6), there currently is no evidence that clade IOSCs and ACTs form functional BGCs. The clade II OSC genes, however, weresignificantly associated with both CYP and ACT genes, both of which encodepotential triterpene scaffold‐modifying enzymes (Tables 1, S6). Such associationswere further supported by phylogenetic regression analyses (Table S6; Notes S1)and ‘nonconservative’ hypergeometric analysis (Table S7; Notes S1). Altogether, ouranalyses suggest that the evolutionary histories of clade I, clade II and sterol OSCGNs are distinct (Fig. 1a,b; Table 1), and importantly, that clade II OSC genesassociated with CYP and ACT genes may reside in potential BGCs (Medema &Osbourn, 2016).
Table 1. Domains significantly associated with the Brassicaceae oxidosqualene cyclases (OSCs)from the three phylogenetic clades. Association outcome (P < 0.01) of conservative Fisher's exacttest (with Bonferroni correction) is listed. The full list can be found in Supporting Information TableS6. Enzymatic domains are indicated by *
In order to further elucidate the relationship between clade II OSCs, CYPs andACTs (in total, 58, 76 and 15 in the clade II OSC GNs, respectively), we identified allCYP and ACT genes in the 13 Brassicaceae and four outgroup genomes andannotated all of the CYP and ACT subfamilies by propagating the annotations ofcharacterized genes from A. thaliana. Our analysis revealed that all ACT genespresent in clade II OSC GNs belong to the ACT IIIa subfamily, whereas those inclade I OSC GNs belong to a distinct ACT subfamily, ACT IIIb (Fig. S3). The CYP

48clade I OSC GNs belong to a distinct ACT subfamily, ACT IIIb (Fig. S3). The CYP
genes associated with clade II OSC genes belong to a total of eight families, ofwhich 86% are in the CYP708, CYP702 and CYP705 families (Figs 1c, S4).
3.3.2. All‐vs‐all comparison of clade II OSC genomeneighborhoods
Because of the abundance of genes encoding potential triterpene scaffold‐modifying enzymes in clade II OSC GNs, 72% (36 of 50) of which fulfil our definitionof BGCs (Medema & Osbourn, 2016), we focused on this clade to explore theirevolutionary relationships. After pruning the clade to ensure that all GNs had at leastfive genes flanking each OSC, we performed an all‐vs‐all comparison of these GNsusing three distinct methods: to measure architectural similarity (enzyme familycontent), we used the Jaccard index of Pfam domains, and as proxies for specificenzymatic function similarity or divergence, we measured the average amino acididentity of shared protein domains and the DSS index, which further considers thediffering number of appearances of each domain in each GN (see Methods) (Fig. 2;Table S8). To avoid bias due to flanking genes not involved in specializedmetabolism, we took into account only those domains known to be involved inspecialized metabolic pathways in plants (Kautsar et al., 2017). Intriguingly, on theone hand, the domain content of clade II OSC GNs is very dynamic (439 of 741 GNpairs having no shared domains), suggesting rapid gene turnover in the OSCflanking regions. On the other, around 24% (73 of 302) of the GN pairs that havedomains in common have highly similar domain compositions (Jaccard index ≥ 0.5),consistent with nonrandom associations of CYPs and ACTs with the OSCs from thisclade. Surprisingly, in 58% of the GN pairs, the average amino acid identity betweenshared domains (177 of 302) falls below 50%, and 84% of GN pairs (257 of 302)have a DSS index ≤ 0.3. This suggests that OSC‐centric neighbourhoods withsimilar enzyme family compositions are either undergoing rapid evolution or haveevolved multiple times independently. In line with the latter, ancestral statereconstruction, based on maximum parsimony and supported by detailed analysis inthe phylogeny of the tailoring enzymes (Notes S1), indicates multiple parallel genegain and loss events of the major CYPs and ACTs in the OSC‐centricneighbourhoods (Figs 1a, S6). Interestingly, three of the six clade II OSC GNs(including the previously characterized thalianol and marneral BGCs) in A. thalianaare located in dynamic chromosomal regions that do not show synteny with regionsoriginating from the ancient WGD in Brassicaceae (Freeling et al., 2007). This againindicates that the loci around clade II OSCs are highly dynamic. Thus, theevolutionary dynamics of the OSC genomic neighbourhoods indicates a generalpattern of independent and parallel evolution of the enzyme family compositions ofthese loci.

49
Fig. 2. Independently evolved triterpene biosynthetic gene clusters (BGCs) frequently convergetowards similar enzyme family content, yet with low mutual sequence identity. Enzymatic domainsfrom each genome neighbourhood (GN) are compared in an all‐vs‐all fashion. The Jaccard Indexwas used to measure the architectural similarity (enzyme family content) across the GNs, and thedomain sequence similarity (DSS) index to quantify the similarity of the underlying proteinsequences. The colour scale bar shows similarity score values. The clade II oxidosqualene cyclase(OSC) tree was used to shape the structure of the heat map. Characterized OSCs for Arabidopsisthaliana BGCs are indicated in bold. *, OSCs characterized in this study. The diagonal line separatesthe Jaccard Index (left) and the DSS Index (right) comparisons. The numbers indicate: Jaccard (1)and DSS (2) index comparisons of the A. thaliana thalianol BGC GN with a putative BGC inArabidopsis lyrata; Jaccard (3) and DSS (4) index comparisons of the A. thaliana thalianol BGC GNwith a putative BGC in Capsella rubella; Jaccard (5) and DSS (6) index comparisons of the C.rubella BGC GN with a putative BGC in Brassica rapa.
3.3.3. Functional analysis of selected representative BGCsIn some cases, ancestral state reconstruction indicates that similar enzyme
composition can be traced back to a recent common ancestry. For example, theCYP705A and ACT IIIa domains were present in some reconstructed ancestralOSC GNs (Fig. S6) at the base of certain monophyletic branches, including the onecontaining the previously characterized thalianol BGC from A. thaliana (Fig. 3a). Thethalianol BGC consists of genes encoding an OSC, two CYPs (a CYP708A and a

50thalianol BGC consists of genes encoding an OSC, two CYPs (a CYP708A and aCYP705A), and one ACT (Field & Osbourn, 2008; Huang et al., 2019). Our previouswork and the current analysis indicate that a closely related (as yet uncharacterized)BGC is present in the sister species (Field et al., 2011) (Fig. 3a). The genes withinthese two BGCs (labelled 1 and 2, respectively in Fig. 2) share high nucleotidesequence identity and occur in the same genomic order. These clusters both haveroot‐specific expression profiles (Fig. 3b) and are located in syntenic genomic blocks(Field et al., 2011) (Table S9). They are therefore likely to share a commonevolutionary origin. To evaluate the function of the predicted A. lyrata BGC, wecloned the genes and expressed them in N. benthamiana using transient agro‐infiltration (Sainsbury et al., 2009; Reed et al., 2017). These experiments confirmedthat the A. lyrata OSC, CYP708A, CYP705A and ACT enzymes are functionallyequivalent to their counterparts in A. thaliana, and when co‐expressed togetherproduce (‐)‐3β,7β‐dihydroxy‐16‐keto‐thalian‐15‐yl acetate (Th3) (Huang et al., 2019)(Fig. 3c). The presence of thalianol pathway BGCs in A. thaliana and A. lyrata thusrepresents an example of conserved BGCs in closely related species.

51
Fig 3. Conservation and diversification of similar triterpene biosynthetic gene clusters (BGCs).(a) Schematic of three triterpene BGCs from Arabidopsis thaliana, Arabidopsis lyrata and Capsellarubella. (b) Expression profiles of the BGC and BGC‐flanking genes for the three BGCs shown in(a). The numerical values for the blue‐to‐red gradient bar represent normalized expression levelsrelative to roots from reverse transcription quantitative (RT‐q)PCR analysis (2−∆∆Ct). (c) Transientexpression of A. thaliana thalianol BGC genes and the putative A. lyrata BGC genes in Nicotianabenthamiana. GC‐MS total ion chromatograms (TICs) and extracted ion chromatograms (EICs) fortwo characteristic ions (261 and 317) of Th3 are shown. (d) TIC of extracts from: N. benthamianaleaves transiently co‐expressing different combinations of the C. rubella BGC genes (upper panel);flower extracts from wild‐type and mutant C. rubella lines (lower panel). The data are representativeof at least two separate experiments. (e) The thalianol pathway in A. lyrata and the C. rubellatirucallol pathway. Enzymes are colour‐coded according to the key in (a).

52
By contrast, many other pairs of putative BGCs identified in our large‐scaleanalysis of Brassicaceae genomes appeared to have similar domain composition,but very limited sequence similarity (Fig. 2). Moreover, the ancestral statereconstruction suggested that CYPs and ACTs had been recruited to these GNsindependently. An example of this is a predicted BGC in pink shepherd's purse (C.rubella). Just like the A. thaliana and A. lyrata thalianol clusters, this BGC containsdomains for OSC, CYP708, CYP705 and ACT enzymes. However, the gene order isdifferent, the sequence identity with the A. thaliana thalianol cluster is low (labelled 3and 4, respectively in Fig. 2; average domain amino acid identity = 45% and DSS =0.3) and there is an additional CYP708A gene (Fig. 3a). Unlike the thalianol BGC,the C. rubella gene cluster is expressed preferentially in the buds (Fig. 3b). TheOSC from this cluster yielded a product (Ti1) when expressed in N. benthamiana,which we subsequently showed by NMR to be the triterpene tirucallol (Fig. 3d,e;Table S4A). Through combinatorial expression we then showed that the enzymesencoded by the neighbouring CYP and ACT genes were able to successively modifytirucallol. Specifically, co‐expression of the OSC with CYP708A9 yielded (Ti2);further inclusion of CYP705A38 gave conversion of (Ti2) to (Ti3); compound (Ti3)was further modified by CYP708A10 to give (Ti4) (Fig. 3d). The ACT was able tofurther modify (Ti4) to give (Ti5) with very low conversion (Fig. S7). The structures ofcompounds Ti1, Ti2, Ti3 and Ti4 were determined by NMR (Table S4B–D). That ofTi5 was inferred by LC‐MS (Fig. S7). The pathway is shown in Fig. 3e. Metaboliteanalysis of C. rubella TILLING/CRISPR‐Cas9 mutants for CYP705A38 andCYP708A10 (Figs 3d, S5) provided further support for the pathway shown in Fig. 3e.Phylogenetic analysis indicates that CYPs and ACTs associated with the A. thalianathalianol and C. rubella tirucallol BGCs are scattered across their respective enzymefamily trees, rather than forming a subclade (Figs S3, S4). Furthermore, the A.thaliana thalianol BGC and C. rubella tirucallol BGC can be traced back to differentancestral crucifer karyotype blocks (Lysak et al., 2016) (W and K‐L, respectively;Table S9). Collectively, our results indicate that although the C. rubella BGC hassuperficial similarities with the A. thaliana and A. lyrata thalianol pathway BGCs interms of domain composition, it is functionally distinct and has evolvedindependently.
We also investigated the function of a candidate BGC from Brassica rapa, whichbelongs to Brassicaceae lineage II. This group separated from common ancestors ofBrassicaceae lineage I species (which include A. thaliana and C. rubella) around 20Myr ago (Hohmann et al., 2015). This candidate BGC contains genes predicted toencode an OSC, two CYPs (a CYP708A and a CYP705A), and an ACT. Expressionof these genes in N. benthamiana revealed that the OSC produces the triterpeneeuphol, and that the associated CYP705A and ACT are able to metabolize thistriterpene (Fig. S8). Activity was not, however, detected for the CYP708A.Interestingly, euphol is an epimer of tirucallol. Given the complex genomic history ofthe Brassicaceae, common ancestry cannot be fully excluded for these loci. Yet, thefact that the tirucallol and euphol OSCs are located in different ACK blocks (L and I,respectively; Table S9), the paraphyly of these two OSCs in the OSC phylogeny, andthe observation that the ACTs within these loci are not monophyletic, indicate thatparallel events are likely to have taken place in the evolutionary history of these twoloci (labelled 5 and 6 in Fig. 2), in this case with likely a parallel metabolic outcome.
We next applied Branch‐Site Unrestricted Statistical Test for Episodic

53We next applied Branch‐Site Unrestricted Statistical Test for Episodic
Diversification (BUSTED) analysis across the three OSC clades, and we foundevidence for gene‐wide positive selection on clade II (Fig. 4a). In line with this,Mixed Effects Model of Evolution (MEME) analysis identified five sites in the clade IIOSC alignment under positive selection (Fig. 4b). The episodic selection, however,is restricted to a limited number of branches, indicating clade II OSCs are evolvingindependently. Consistently, tailoring genes (CYP and ACT) contributing to clade IIOSC/CYP or clade II OSC/CYP/ACT associations are scattered on their respectivephylogenetic trees (Fig. 4c,d). Together with the ancestral state reconstruction, wepropose that dynamic ancestral OSC GNs independently shuffle a core palette ofdecorating domains, forming divergent BGCs throughout the radiation ofBrassicaceae species (Fig. 4e).

54
Fig 4. Independent evolution of clade II oxidosqualene cyclase (OSC) related biosynthetic geneclusters. (a) BUSTED (Branch‐Site Unrestricted Statistical Test for Episodic Diversification) analysison the three clades of Brassicaceae OSCs. Evidence for gene‐wide positive selection was found forclade II OSC. (b) Mixed Effects Model of Evolution (MEME) analysis on clade II OSCs. Five sitesfrom limited branches were found to be under positive selections (P < 0.05). (c, d) Clade IIOSC/CYP and clade II OSC/CYP/ACT associations are marked on cytochrome P450 (CYP) (c) andacyltransferase (ACT) (d) phylogenetic trees. The genes of Arabidopsis thaliana thalianol BGC andCapsella rubella tirucallol BGC are indicated. (e) Proposed model for the evolution of the A. thalianaand A. lyrata thalianol BGCs and the C. rubella tirucallol BGC. The plausible ancestral states ofcluster assembly were drawn based on ancestral states reconstructions. The recruited domains canbe traced on the phylogeny in (c) and (d).

55
3.4. DiscussionHow individual enzymes have evolved to achieve metabolic diversity is relatively
well‐understood (Benderoth et al., 2006; Weng et al., 2012a; Hofberger et al., 2013;Hamberger & Bak, 2013; Moghe & Last, 2015; Barco & Clay, 2019), whereas themechanisms of evolution of multi‐step pathways are more elusive. In comparison tononclustered pathways, biosynthetic gene clusters (BGCs) provide unique materialwith which to systematically study the evolutionary processes underpinning the birthof plant metabolic pathways. Here, our systematic genomic neighbourhood (GN)analysis of oxidosqualene cyclases (OSCs) across multiple Brassicaceae genomeshas revealed that clade II OSC genes are predisposed to clustering with genes forpotential triterpene scaffold‐modifying enzymes. The number of genomes that weused in this study is small in relation to the >3000 species in the Brassicaceae.Ancestral state reconstruction with a larger dataset – once other genome sequencesbecome available – may therefore produce a different outcome. However, ourdataset is representative of the two major Brassicaceae lineages (I and II) and alsoincludes the early diverging species Aethionema arabicum. The overall picturedelineating parallel recruitment events in these dynamic genomic neighborhoods ishighly supported and is corroborated by the evidence from cytochrome P450 (CYP)and acyltransferase (ACT) phylogenies as well as ancestral karyotypereconstruction.
Compared to previous analyses of plant BGCs (Kautsar et al., 2017; Töpfer etal., 2017; Schläpfer et al., 2017), our phylogenomic analysis of OSCs acrossmultiple Brassicaceae genomes provides, for the first time, a comprehensive pictureof their genomic evolution across all relevant loci, whether they constitute geneclusters or not. Our phylogenetic analyses of the key gene families, along with theircontextualization in whole‐genome duplication (WGD)‐derived subgenomes (Fig.S9), provide clear evidence for recurrent independent assembly of BGCs containingOSC, CYP and ACT genes across the Brassicaceae, leading to divergent or parallelmetabolic outcomes (Fig. 4e).
Because of the importance of triterpenes in mediating interactions with herbivoresand microbiota (Hostettmann & Marston, 1995; Papadopoulou et al., 1999; Nielsenet al., 2010; Sohrabi et al., 2015; Zhou et al., 2016; Huang et al., 2019), wespeculate that, similar to the case of resistance gene clusters in plant genomes(Michelmore & Meyers, 1998), triterpene GNs undergo rapid and dynamic evolution,forming ‘evolutionary playgrounds’ that enable rapid adaption to ever‐changingenvironmental stresses (Field et al., 2011). Triterpenoid scaffold diversification isachieved using a specific palette of CYPs (primarily CYP705A, CYP708A,CYP702A) and ACTs (ACT IIIa) (Fig. 5). The CYP716A family, which has beensuggested as a major contributor to the diversification of triterpenoids in eudicotplants (Miettinen et al., 2017), appeared only rarely among the CYPs inBrassicaceae in clade II OSC GNs. The molecular mechanisms by which BGCsform is not yet known, although miniature inverted‐repeat transposable elements(MITEs) have been implicated in cluster assembly and/or regulation (Boutanaev &Osbourn, 2018).

56
Fig. 5. Drivers of triterpene diversification in the Brassicaceae. The biosynthesis of diversetriterpenes in the Brassicaceae is achieved by ‘mixing, matching and diverging’ a core palette ofclade II oxidosqualene cyclases (OSCs), cytochrome P450s (CYPs) belonging primarily to theCYP705A, CYP708A, and CYP702A subfamilies, and acyltransferases (ACTs) belonging to the ACTIIIa subfamily. Examples of characterized biosynthetic gene clusters (BGCs) and their products areshown. Arrows denote the strand directionality of genes.
Our investigations reveal a novel genomic basis for metabolic diversification inplants through mixing, matching and diverging natural combinations of enzymefamilies. They further open up opportunities to mimic and expand on plant metabolicdiversity by using synthetic biology approaches to engineer diverse bioactivemolecules through combinatorial biosynthesis (Fig. 5), for which efficientheterologous expression platforms are now available in yeast (Scheler et al., 2016;Arendt et al., 2017; Bathe et al., 2019) as well as tobacco (Reed et al., 2017). Thus,our increased understanding of pathway formation paves the path to further exploreand exploit the biological activities of triterpenes and other plant natural productstoward applications in medicine and agriculture.
3.5. Supplementary InformationSupplementary figures and tables are available to download from:
https://doi.org/10.1111/nph.16338
ReferencesAbascal F, Zardoya R, Telford MJ. 2010. TranslatorX: multiple alignment of
nucleotide sequences guided by amino acid translations. Nucleic Acids

57nucleotide sequences guided by amino acid translations. Nucleic AcidsResearch 38: 7– 13.
Afendi FM, Okada T, Yamazaki M, Hirai‐Morita A, Nakamura Y, Nakamura K, IkedaS, Takahashi H, Altaf‐Ul‐Amin M, Darusman LK et al. 2012. KNApSAcKfamily databases: integrated metabolite‐plant species databases formultifaceted plant research. Plant and Cell Physiology 53: 1– 12.
Altschul SF, Gish W, Miller W, Myers EW, Lipman DJ. 1990. Basic local alignmentsearch tool. Journal of Molecular Biology 215: 403– 410.
Arendt P, Miettinen K, Pollier J, De Rycke R, Callewaert N, Goossens A. 2017. Anendoplasmic reticulum‐engineered yeast platform for overproduction oftriterpenoids. Metabolic Engineering 40: 165– 175.
Barco B, Clay NK. 2019. Evolution of glucosinolate diversity via whole‐genomeduplications, gene rearrangements, and substrate promiscuity. AnnualReview of Plant Biology 70: 585– 604.
Bathe U, Frolov A, Porzel A, Tissier A. 2019. CYP76 oxidation network of abietanediterpenes in Lamiaceae reconstituted in yeast. Journal of Agricultural andFood Chemistry 49: 13437– 13450.
Beilstein MA, Nagalingum NS, Clements MD, Manchester SR, Mathews S. 2010.Dated molecular phylogenies indicate a Miocene origin for Arabidopsisthaliana. Proceedings of the National Academy of Sciences, USA 107:18724– 18728
Benderoth M, Textor S, Windsor AJ, Mitchell‐Olds T, Gershenzon J, Kroymann J.2006. Positive selection driving diversification in plant secondary metabolism.Proceedings of the National Academy of Sciences, USA 103: 9118– 9123.
Böttger A, Vothknecht U, Bolle C, Wolf A. 2018. Plant secondary metabolites andtheir general function in plants. In: Böttger A, Vothknecht U, Bolle C, Wolf A,eds. Lessons on caffeine, cannabis & co, Cham, Switzerland: SpringerInternational, 3– 17.
Boutanaev AM, Osbourn AE. 2018. Multigenome analysis implicates miniatureinverted‐repeat transposable elements (MITEs) in metabolic diversification ineudicots. Proceedings of the National Academy of Sciences, USA 28:E6650– E6658.
Castel B, Tomlinson L, Locci F, Yang Y, Jones JDG. 2019. Optimization of T‐DNAarchitecture for Cas9‐mediated mutagenesis in Arabidopsis. PLoS ONE 14:e0204778.
Charif D, Lobry JR. 2007. SeqinR 1.0‐2: a contributed package to the R project forstatistical computing devoted to biological sequences retrieval and analysis.In: U Bastolla, M Porto, HE Roman, M Vendruscolo, eds. Structuralapproaches to sequence evolution: molecules, networks, populations.Berlin/Heidelberg, Germany: Springer, 207– 232.
Chassagne F, Cabanac G, Hubert G, David B, Marti G. 2019. The landscape ofnatural product diversity and their pharmacological relevance from a focus onthe Dictionary of Natural Products. Phytochemistry Reviews 18: 601– 622.
Christianson DW. 2017. Structural and chemical biology of terpenoid cyclases.

58Christianson DW. 2017. Structural and chemical biology of terpenoid cyclases.
Chemical Reviews 117: 11570– 11648.Clough SJ, Bent AF. 1998. Floral dip: a simplified method for Agrobacterium‐
mediated transformation of Arabidopsis thaliana. The Plant Journal 16: 735–743.
Edgar RC. 2004. MUSCLE: multiple sequence alignment with high accuracy andhigh throughput. Nucleic Acids Research 32: 1792– 1797.
Edger PP, Heidel‐Fischer HM, Bekaert M, Rota J, Glöckner G, Platts AE, HeckelDG, Der JP, Wafula EK, Tang M et al. 2015. The butterfly plant arms‐raceescalated by gene and genome duplications. Proceedings of the NationalAcademy of Sciences, USA 112: 8362– 8366.
Field B, Fiston‐Lavier A‐S, Kemen A, Geisler K, Quesneville H, Osbourn AE. 2011.Formation of plant metabolic gene clusters within dynamic chromosomalregions. Proceedings of the National Academy of Sciences, USA 108: 16116–16121.
Field B, Osbourn AE. 2008. Metabolic diversification—independent assembly ofoperon‐like gene clusters in different plants. Science 320: 543– 547.
Finn RD, Clements J, Eddy SR. 2011. HMMER web server: interactive sequencesimilarity searching. Nucleic Acids Research 39: W29– W37.
Finn RD, Coggill P, Eberhardt RY, Eddy SR, Mistry J, Mitchell AL, Potter SC, PuntaM, Qureshi M, Sangrador‐Vegas A et al. 2016. The Pfam protein familiesdatabase: towards a more sustainable future. Nucleic Acids Research 44:D279– D285.
Freeling M, Rapaka L, Lyons E, Pedersen B, Thomas BC. 2007. G‐boxes, bigfootgenes, and environmental response: characterization of intragenomicconserved noncoding sequences in Arabidopsis. Plant Cell 19: 1441– 1457.
Garamszegi LZ, ed. 2014. Modern phylogenetic comparative methods and theirapplication in evolutionary biology: concepts and practice. Heidelberg,Germany: Springer.
Guo L, Winzer T, Yang X, Li Y, Ning Z, He Z, Teodor R, Lu Y, Bowser TA, GrahamIA et al. 2018. The opium poppy genome and morphinan production. Science362: 343– 347.
Hamberger B, Bak S. 2013. Plant P450s as versatile drivers for evolution of species‐specific chemical diversity. Philosophical transactions of the Royal Society ofLondon. Series B: Biological Sciences 368: 20120426.
Ho L, Ané C. 2014. A linear‐time algorithm for Gaussian and non‐Gaussian traitevolution models. Systematic Biology 63: 397– 408.
Hofberger JA, Lyons E, Edger PP, Chris Pires J, Eric Schranz M. 2013. Wholegenome and tandem duplicate retention facilitated glucosinolate pathwaydiversification in the mustard family. Genome Biology and Evolution 5: 2155–2173.
Hohmann N, Wolf EM, Lysak MA, Koch MA. 2015. A time‐calibrated road map ofBrassicaceae species radiation and evolutionary history. The Plant Cell 27,2770– 2784.

59
Hostettmann K, Marston A. 1995. Saponins. Cambridge, UK: Cambridge UniversityPress.
Huang AC, Jiang T, Liu Y‐X, Bai Y‐C, Reed J, Qu B, Goossens A, Nützmann H‐W,Bai Y, Osbourn A. 2019. A specialized metabolic network selectivelymodulates Arabidopsis root microbiota. Science 364: eaau6389.
Ives AR, Garland T. 2010. Phylogenetic logistic regression for binary dependentvariables. Systematic Biology 59: 9– 26.
Kautsar SA, Suarez Duran HG, Blin K, Osbourn A, Medema MH. 2017.PlantiSMASH: automated identification, annotation and expression analysisof plant biosynthetic gene clusters. Nucleic Acids Research 45: W55– W63.
Kozlov AM, Darriba D, Flouri T, Morel B, Stamatakis A. 2019. RAxML‐NG: a fast,scalable and user‐friendly tool for maximum likelihood phylogenetic inference.Bioinformatics 35: 4453– 4455.
Kuhn HW. 1955. The Hungarian method for the assignment problem. NavalResearch Logistics Quarterly 2: 83– 97.
Liu Z, Tavares R, Forsythe ES, André F, Lugan R, Jonasson G, Boutet‐Mercey S,Tohge T, Beilstein MA, Werck‐Reichhart D et al. 2016. Evolutionary interplaybetween sister cytochrome P450 genes shapes plasticity in plant metabolism.Nature Communications 7: 13026.
Livak KJ, Schmittgen TD. 2001. Analysis of relative gene expression data using real‐time quantitative PCR and the 2−ΔΔCT method. Methods 25: 402– 408.
Lysak MA, Mandáková T, Schranz ME. 2016. Comparative paleogenomics ofcrucifers: ancestral genomic blocks revisited. Current Opinion in Plant Biology30: 108– 115.
Martins EP, Diniz‐Filho JAF, Housworth EA. 2002. Adaptive constraints and thephylogenetic comparative method: a computer simulation test. Evolution 56:1– 13.
Martins EP, Garland T. 1991. Phylogenetic analyses of the correlated evolution ofcontinuous characters: a simulation study. Evolution 45: 534.
Maddison WP, Maddison DR. 2008. Mesquite: A modular system for evolutionaryanalysis. Evolution 62: 1103– 1118.
Medema MH, Osbourn A. 2016. Computational genomic identification and functionalreconstitution of plant natural product biosynthetic pathways. Natural ProductReports 33: 951– 962.
Michelmore RW, Meyers BC. 1998. Clusters of resistance genes in plants evolve bydivergent selection and a birth‐and‐death process. Genome Research 8:1113– 1130.
Miettinen K, Pollier J, Buyst D, Arendt P, Csuk R, Sommerwerk S, Moses T,Mertens J, Sonawane PD, Pauwels L et al. 2017. The ancient CYP716 familyis a major contributor to the diversification of eudicot triterpenoid biosynthesis.Nature Communications 8: 14153.
Moghe GD, Last RL. 2015. Something old, something new: conserved enzymes andthe evolution of novelty in plant specialized metabolism. Plant Physiology 169:

60the evolution of novelty in plant specialized metabolism. Plant Physiology 169:
1512– 1523.Murrell B, Weaver S, Smith MD, Wertheim JO, Murrell S, Aylward A, Eren K,
Pollner T, Martin DP, Smith DM et al. 2015. Gene‐wide identification ofepisodic selection. Molecular Biology and Evolution 32: 1365– 1371.
Murrell B, Wertheim JO, Moola S, Weighill T, Scheffler K, Pond SLK. 2012.Detecting individual sites subject to episodic diversifying selection. PLoSGenetics 8: e1002764.
Navarro‐Muñoz J, Selem‐Mojica N, Mullowney M, Kautsar S, Tryon J, Parkinson E,De Los Santos E, Yeong M, Cruz‐Morales P, Abubucker S et al. 2018. Acomputational framework for systematic exploration of biosynthetic diversityfrom large‐scale genomic data. bioRxiv: 445270.
Nelson DR. 2009. The cytochrome p450 homepage. Human Genomics 4: 59– 65.Nielsen JK, Nagao T, Okabe H, Shinoda T. 2010. Resistance in the plant, Barbarea
vulgaris, and counter‐adaptations in flea beetles mediated by saponins.Journal of Chemical Ecology 36: 277– 285.
Nutzmann HW, Huang A, Osbourn A. 2016. Plant metabolic clusters – from geneticsto genomics. New Phytologist 211: 771– 789.
Papadopoulou K, Melton RE, Leggett M, Daniels MJ, Osbourn AE. 1999.Compromised disease resistance in saponin‐deficient plants. Proceedings ofthe National Academy of Sciences, USA 96: 12923– 12928.
Paradis E, Claude J, Strimmer K. 2004. APE: analyses of phylogenetics andevolution in R language. Bioinformatics 20: 289– 290.
Pond SLK, Frost SDW, Muse SV. 2005. HyPhy: hypothesis testing usingphylogenies. Bioinformatics 21: 676– 679.
Price MN, Dehal PS, Arkin AP. 2010. FastTree 2–approximately maximum‐likelihoodtrees for large alignments. PLoS ONE 5: e9490.
Qi X, Bakht S, Leggett M, Maxwell C, Melton R, Osbourn A. 2004. A gene cluster forsecondary metabolism in oat: implications for the evolution of metabolicdiversity in plants. Proceedings of the National Academy of Sciences, USA101: 8233– 8238.
Reed J, Stephenson MJ, Miettinen K, Brouwer B, Leveau A, Brett P, Goss RJM,Goossens A, O'Connell MA, Osbourn A. 2017. A translational syntheticbiology platform for rapid access to gram‐scale quantities of novel drug‐likemolecules. Metabolic Engineering 42: 185– 193.
Sainsbury F, Thuenemann EC, Lomonossoff GP. 2009. PEAQ: Versatile expressionvectors for easy and quick transient expression of heterologous proteins inplants. Plant Biotechnology Journal 7: 682– 693.
Scheler U, Brandt W, Porzel A, Rothe K, Manzano D, Božić D, Papaefthimiou D,Balcke GU, Henning A, Lohse S et al. 2016. Elucidation of the biosynthesis ofcarnosic acid and its reconstitution in yeast. Nature Communications 7:12942.
Schläpfer P, Zhang P, Wang C, Kim T, Banf M, Chae L, Dreher K, Chavali AK, Nilo‐Poyanco R, Bernard T et al. 2017. Genome‐wide prediction of metabolic

61Poyanco R, Bernard T et al. 2017. Genome‐wide prediction of metabolicenzymes, pathways, and gene clusters in plants. Plant Physiology 173: 2041–2059.
Shimada TL, Shimada T, Hara‐nishimura I. 2010. A rapid and non‐destructivescreenable marker, FAST, for identifying transformed seeds of Arabidopsisthaliana. The Plant Journal 61: 519– 528.
Sohrabi R, Huh J‐H, Badieyan S, Rakotondraibe LH, Kliebenstein DJ, Sobrado P,Tholl D. 2015. In planta variation of volatile biosynthesis: an alternativebiosynthetic route to the formation of the pathogen‐induced volatilehomoterpene DMNT via triterpene degradation in Arabidopsis roots. PlantCell 27: 874– 890.
Stephenson MJ, Reed J, Brouwer B, Osbourn A. 2018. Transient expression inNicotiana benthamiana leaves for triterpene production at a preparative scale.JoVE 138: e58169.
Takos AM, Knudsen C, Lai D, Kannangara R, Mikkelsen L, Motawia MS, Olsen CE,Sato S, Tabata S, Jørgensen K et al. 2011. Genomic clustering of cyanogenicglucoside biosynthetic genes aids their identification in Lotus japonicus andsuggests the repeated evolution of this chemical defence pathway. The PlantJournal 68: 273– 286.
Tamatakis A, Hoover P, Rougemont J. 2008. A rapid bootstrap algorithm for theRAxML web servers. Systematic Biology 57: 758– 771.
Töpfer N, Fuchs LM, Aharoni A. 2017. The PhytoClust tool for metabolic geneclusters discovery in plant genomes. Nucleic Acids Research 45: 7049– 7063.
Tuominen LK, Johnson VE, Tsai C‐J. 2011. Differential phylogenetic expansions inBAHD acyltransferases across five angiosperm taxa and evidence ofdivergent expression among Populus paralogues. BMC Genomics 12: 236.
Weng JK. 2014. The evolutionary paths towards complexity: a metabolicperspective. New Phytologist 201: 1141– 1149.
Weng J‐K, Li Y, Mo H, Chapple C. 2012b. Assembly of an evolutionarily newpathway for α‐pyrone biosynthesis in Arabidopsis. Science 337: 960– 964.
Weng J‐K, Philippe RN, Noel JP. 2012a. The rise of chemodiversity in plants.Science 336: 1667– 1670.
Winzer T, Gazda V, He Z, Kaminski F, Kern M, Larson TR, Li Y, Meade F, Teodor R,Vaistij FE et al. 2012. A Papaver somniferum 10‐gene cluster for synthesis ofthe anticancer alkaloid noscapine. Science 336: 1704– 1708.
Zhou Y, Ma Y, Zeng J, Duan L, Xue X, Wang H, Lin T, Liu Z, Zeng K, Zhong Y et al.2016. Convergence and divergence of bitterness biosynthesis and regulationin Cucurbitaceae. Nature Plants 2: 1– 8.

62
Chapter 4Comparative transcriptomics reveals a
conserved core of the phosphatestarvation response across monocots
and eudicots
Hernando G. Suarez Duran1, Yanting Wang2, Yunmeng Zhang3, HarroBouwmeester2, Marnix H. Medema1
1 Bioinformatics Group, Wageningen University, 6708 PB Wageningen, TheNetherlands2 Swammerdam Institute for Life Sciences, University of Amsterdam, 1000 BEAmsterdam, The Netherlands3 Plant Physiology Group, Wageningen University, 6708 PB Wageningen, TheNetherlands
Manuscript in preparation.
63
4.1. AbstractPhosphorus (P) is an indispensable nutrient for most plant functions, and
inorganic phosphate, from which Pi fertilizer is made, is a finite resource. Because ofthis, there is a large interest in understanding the mechanisms of Pi metabolism inplants, the adaption of plants to low-phosphate conditions and the regulatorymechanisms that underlie this adaptation. Due to the ubiquitous importance of P inplant metabolism, we hypothesised cellular systems related to Pi metabolism to belargely conserved across monocots and eudicots. Comparative transcriptomics is auseful framework for identifying such conserved responses: it allows de novopredictions in more than one species with higher confidence than when analysingtranscriptomes independently, because spurious associations are unlikely to beobserved repeatedly. To study the phosphate starvation response using comparativetranscriptomics, we developed CADE-HEroN, a computational workflow thatcombines targeted and untargeted approaches to study the transcriptomes ofmultiple plants comparatively through coexpression and differential expressionanalyses across time-series data. We applied our approach to data obtained fromphosphate starvation experiments in rice, tomato and Arabidopsis, which yieldedseveral candidate genes for functional characterization that are hypothesised to beinvolved in the biosynthesis of strigolactones and related metabolites. Furthermore,integrating differential and coexpression analyses across species led to theidentification of important metabolic pathways associated with Pi starvationresponses, related to gibberellin, lipid and carotenoid biosynthesis. This associationthus appears to be conserved throughout eudicots and monocots. Our analysesprovide concrete guidance for genetic dissection of the phosphate starvationresponse across species, and may serve as a model for the utilization ofcomparative transcriptomics to characterize and visualize conserved metabolicprocesses.
4.2. IntroductionPhosphorus (P) is an indispensable nutrient for most plant functions and is
mostly assimilated by plants from the soil as inorganic phosphate (Pi). This processhas low efficiency: only ~30% of Pi added to the soil as fertilizer is captured byplants, while the rest is unavailable due to fixation in the soil and microbial activity1.Because rock phosphate, from which Pi fertilizer is made, is a finite resource, thereis a large interest in understanding the mechanisms of Pi metabolism in plants, andmore importantly, the adaption of plants to low-phosphate conditions and theregulatory mechanisms that underlie this adaptation2. One such mechanism involvesthe biosynthesis of strigolactones, a class of plant hormones that not only regulatethe plant response to low Pi
3,4, but also increase Pi acquisition and reduce Piutilization5. Recently, we used transcriptome analysis to better understand thephosphate starvation response and strigolactones biosynthesis in tomato (Wang etal., manuscript in preparation) and rice (Zhang et al., manuscript in preparation),which confirmed that the genes involved in strigolactones biosynthesis areupregulated under Pi starvation and showed that strigolactones have an integral rolein the full P starvation transcriptional response of these two species. However, thestrigolactones biosynthetic pathway and its regulation in response to low phosphateare still largely a black box. Due to the ubiquitous importance of P in plantprocesses, we expect processes surrounding Pi metabolism to be largely conserved

64processes, we expect processes surrounding Pi metabolism to be largely conservedacross monocots and eudicots. Indeed, the functions of certain Pi transporters andnon-coding RNAs involved in Pi deficiency responses have already been shown tobe conserved between Arabidopsis thaliana and Oryza sativa6. It is not known,however, how widespread this apparent conservation is, and which specificresponses are conserved.
To deepen our understanding of differences and commonalities in Pi metabolismacross the plant Kingdom, we can use comparative transcriptomics. This frameworkhas the advantage of enabling one to better understand conserved metabolicprocesses, transfer knowledge from model to non-model species, and make de novopredictions in more than one species with higher confidence than when analysingtranscriptomes independently, because false associations are unlikely to beobserved repeatedly7,8. In recent studies, this methodology has been successfullyapplied for plant natural product discovery. The expression profiles of genes withknown orthology relationships in closely related Cucurbitaceae were analysed andcompared, leading to the characterization of genes involved in the biosynthesis ofcucurbitacins and regulators of bitterness in melon, watermelon and cucumber9. Inanother study, the -solanin/-chaconine pathways in tomato and potato werecharacterized by analysing the expression and coexpression of genes involved inglycoalkaloid metabolism in solanaceous plants10. The latter analysis was aided bythe CoExpNetViz tool, which allows users to analyse their own transcriptome,orthology relationships and specific target genes, and then displays networksshowing which genes are coexpressed with the targets in more than one species11.
While these previous approaches are useful to research the conservation of agiven subset of genes, such as those involved in the strigolactones biosyntheticpathway, they do not allow global comparisons of transcriptomic responses, such asfor the phosphate starvation response. This requires an untargeted analysis thatallows to concurrently study the expression of all genes across all timepoints,something especially critical when considering evolutionarily distant species, in whichthe rate of the metabolic response may differ. Some algorithms for untargetedcomparative transcriptomics have been previously developed12,13, such asIsoRankN14, which was used to compare the coexpression networks of rice andmaize, where common network motifs with the same GO term enrichment wereidentified in both networks, indicating functional conservation of orthologous genes15.However, more effective methods to analyse transcriptomic responses across timeseries data are desirable, as are tools that allow users to concurrently analyse andintegrate targeted and untargeted approaches on different species for comparativetranscriptome analysis.
To study the effects of phosphate starvation in the transcriptome of multiple plantspecies, we selected this comparative transcriptomic framework and studied thegene expression time series data sets of the phosphate starvation response in A.thaliana, O. sativa and S. lycopersicum. For this, we developed a computationalworkflow, CADE-HEroN (Comparative Analysis of Differential Expression, HomologsExpression, Coexpression Networks) that combines targeted and untargetedapproaches to study the transcriptome of multiple plants comparatively by leveragingcoexpression, differential expression, and user-set orthology relationships. We usedthis workflow to perform a targeted analysis of genes involved in strigolactonesbiosynthesis in all three species and examine common properties of their globalcoexpression networks in an unsupervised way to identify conserved responsesrelated to gibberellin, xanthophylls and tocopherol biosynthesis and lipid metabolic

65related to gibberellin, xanthophylls and tocopherol biosynthesis and lipid metabolicprocesses.
4.3. Material and MethodsRNA-Seq datasets. Gene expression datasets from Zhang et al. and Wang et
al. (unpublished data) were used in combination with a dataset comprising similarexperimental conditions in A. thaliana (AT), which were retrieved from NCBI’s GEO,with identifier GSE7485616. The experimental setup from Zhang et al. is as follows:wildtype and D mutant rice plants were grown for a week on normal conditions, afterwhich some were moved to a low phosphate environment. Root and shoot sampleswere taken from days 7, 8, 10, 14, 14.6 and 15 from the start of the experiment. Thephosphate replenishment treatment was performed from day 14 onwards. Theexperimental setup from Wang et al. is as follows: wildtype and CCD8 mutant tomatoplants were grown for a week on normal conditions. After this, some were subjectedto phosphate starvation. Root samples were taken from days 9, 10, 11, 12 and 14after the start of the experiment. Phosphate replenishment was performed on day12. The experimental setup for GSE7485616 is as follows: Arabidopsis thalianaecotype Columbia plants were grown for 10 days. On this day, some plants weremoved to a phosphate-deficient medium. Root samples were taken on days 10, 11and 13 from the start of the experiment.
RNA-Seq analysis. Expression analysis was performed in R 3.6.117 with theedgeR package 3.26.818. Genes with less than 1 count per million reads mapped(CPM) in at least two samples were removed from the analysis. Reads werenormalized by library and exon size (reads per kilobase per million mapped reads,RPKM). Differential gene expression (DGE) test P-values were corrected with theBonferroni method, and the significance threshold was set at P<0.1 and logFC>1.
Coexpression analysis. Coexpression was defined for each plant species andtissue type independently using Pearson’s Correlation Coefficient (PCC). Gene-pairswith PCC<0.7 were removed from further analysis. The results of this analysis wereused to create an independent transcriptomic network per plant species, with genesrepresented as nodes, and edges representing coexpressed gene pairs. Thenetworks were then integrated with edges linking genes with known orthologousrelationships, as retrieved from EnsemblPlants (release 39)19 through the BioMartdata mining tool20.
Target genes. The integrated transcriptomic network was used to extractsubnetworks based on target genes known to be involved in strigolactonesbiosynthesis and phosphate starvation responses3: CCD7 (AT2G44990,Solyc01g090660, OS04G0550600), CCD8 (AT4G32810, Solyc08g066650,OS01G0746400), MAX1 (AT2G26170, Solyc08g062950, OS04G0550600), andD27 (AT1G03055, Solyc09g065750; we could not identify the D27 ortholog in therice transcriptome).
Orthologous Communities (OCs). The OC of a target gene is a cross-speciescoexpression network defined by the group of genes that are coexpressed with thetarget in more than one species, as identified through orthologous relationships. OCsare generated by: (1) isolating the coexpression network neighbourhood of a targetgene, (2) identifying the target’s ortholog in another species and isolating thecorresponding neighbourhood, (3) removing genes which have orthologs notcoexpressed with the target gene.

66
Orthologous Communities of Differentially Expressed Genes (OC-DEGs).To identify common differential transcriptomic responses, results from our DGEanalysis were used to generate networks which include experimental conditions as anew node type. In this network, edges do not have a weight and only link genes toexperimental conditions in which they were found to be differentially expressed. Byusing the same methodology to identify OCs on this DGE network, OC-DEGs areidentified.
Untargeted analysis. To identify genes that were coexpressed in a similarmanner across O. sativa (OS) and S. lycopersicum (SL), a coexpression networkwas generated in which each node represents a “gene family” instead of a gene.These “gene families” are defined by the orthology relationship of the genes: mostnodes represent one SL gene and its OS ortholog, while some nodes may represente.g. two SL genes and one OS gene if the orthology relationship is one-to-many. Inthis network, edges link a gene family composed of genes that are all coexpressedwith the genes of the same species in the gene family at the opposite end of theedge (Suppl. Fig. 1).
4.4. Results and Discussion
4.4.1. AbbreviationsAT = Arabidopsis thalianaOS = Oryza sativaSL = Solanum lycopersicumOC = Orthologous Community
4.4.2. Conserved coexpression across rice and tomatoindicates an ancient relationship between gibberellin,strigolactones and xanthophyllsbiosynthesis
Strigolactones biosynthesis has been shown to be strongly affected by phosphatestarvation3,4 and our own research (Wang et al., Zhang et al., manuscripts inpreparation) indicates strigolactones are also needed for the phosphate starvationresponse. In order to identify genes coexpressed with the core strigolactonesbiosynthetic genes (CCD7, CCD8, MAX1 and MAX2), we performed a targetedanalysis to identify orthologous groups that are coexpressed with these bait genes inmore than one species, so-called Orthologous Communities (OCs). We identifiedeight OCs around the four bait genes, which together describe the commontranscriptomic response to phosphate starvation of the genes involved instrigolactones biosynthesis in three evolutionary distant species. A summary of thisanalysis can be seen in Table 1 (the full list of genes in each OC is provided inSuppl. Table 1).

67
Table 1. Summary of the OC analysis in rice, tomato and A. thaliana, with the number of genesidentified in each OC.
Four of the identified OCs among the three plant species were centred aroundCCD8, which includes the largest OC: 151 genes are coexpressed with CCD8 in OSand SL. The second largest OC, around CCD7 in OS and SL, only has 76 genes, allof which are part of the CCD8 OC as well. We performed a GO term enrichmentanalysis on these genes and found the CCD7/8 OC to be enriched in genes involvedin lipid metabolism, terpenoid and gibberellin biosynthesis (Suppl. Table 2 for theOS genes, and Suppl. Table 3 for SL). The expression pattern of the genesannotated with these GO terms can be seen in Fig. 1A) for OS, and Fig. 1B) for SL.The genes annotated with terpenoid biosynthesis encode three enzymes within thexanthophylls biosynthetic pathway: a ζ-carotene desaturase (ZDS)(Solyc01g097810/OS07G0204900), a prolycopene isomerase CRTISO(Solyc10g081650/OS11G0572700), and a carotenoid β-hydroxylase CYP97A29(Solyc04g051190/OS02G0817900). The coexpression of ZDS and CRTISO withCCD7/8 is perhaps not surprising, as they both acti a few enzymatic steps upstreamof it: as seen in Fig. 1C), ZDS acts directly upstream of CRTISO, and the reactioncatalysed by CRTISO results in all-trans-lycopene, which if modified by the enzymeLCY-β, results in β-carotene. This is the substrate CCD7 acts on to enter thestrigolactones biosynthetic pathway. However, the coexpression of CYP97A29 isunexpected; this enzyme acts downstream of LCY-ε, which competes for all-trans-lycopene with LCY-β, to produce zeinoxanthin21, the key precursor for xanthophyllspathways. A possible relationship between the strigolactones and xantophyllspathway in a phosphate starvation context is intriguing: Pi deficiency has beenshown to cause chlorophyll loss, which may lead to photo-oxidative stress if notcounter-acted by non-photochemical quenching mechanisms such as the multiplexanthophylls cycles22. Interestingly, the taxonomically ubiquitous violaxanthin cycle(V-cycle) occurs parallel to the strigolactones pathway, downstream of β-carotene,whereas the taxonomically restricted lutein epoxide cycle (Lx-cycle) starts with lutein,two enzymatic steps downstream of ɑ-carotene, after the transformation of ɑ-carotene into zeinoxanthin by CYP97A2923. While the presence of an Lx-cycle hasnot been reported in any of the species analysed in this study24, we speculate thatbecause the V-cycle and CCD7 would compete for the same substrate (β-carotene),an unknown mechanism could be promoting the Lx-cycle, or a similar undiscoveredxanthophyll cycle in rice and tomato, to counter-act Pi deficiency-induced photo-oxidative stress.

68
Fig. 1. Expression pattern of CCD7/8 and the genes in A) rice and B) tomato coexpressed withthese and annotated with gibberellin and carotenoid biosynthesis. The experimental conditions havebeen ordered for ease of comparison. C) The gibberellin, strigolactones and xanthophyllsbiosynthetic pathways.
The genes annotated as involved in gibberellin biosynthesis in the CCD7/8 OCencode the enzymes ent-copalyl diphosphate synthase (CDS)(Solyc06g084240/OS02G0278700) and ent-kaurene oxidase(Solyc04g083160/OS06G0570100), two of the first three enzymes in the gibberellinbiosynthesis pathway25. This pathway also has a close relationship with thecarotenoid pathway by sharing the same precursor, all-trans-geranyl-geranyldiphosphate, on which CDS directly acts, as seen in Fig. 1C). Furthermore, just likestrigolactones have a well-established involvement in Pi deficiency responses in AT,OS and SL26,27, some studies have previously identified gibberellin as having aregulatory function in some Pi deficiency responses in A. thaliana28.
A caveat in these analyses is that sequence-based orthology prediction does notguarantee functional equivalence at the biochemical level. However, similarexpression patterns across similar experimental conditions of predicted orthologuesstrongly suggest a conserved function. Altogether, we speculate that identifying

69strongly suggest a conserved function. Altogether, we speculate that identifying
xanthophylls and gibberellin biosynthesis genes closely coexpressed with CCD7/8 intomato and rice suggests that they may have interlinked functions in the phosphatestarvation response, that a similar regulation mechanism may exist across monocotsand eudicots, and that much of the genetic machinery and functions behind thesemetabolic processes, such as the regulatory role of gibberellin, might have beenconserved from before the divergence of monocots and eudicots.
4.4.3. A conserved transcriptomic response across threeplant species uncovers new candidate enzymes forstrigolactones biosynthesis
As our knowledge of the strigolactones biosynthesis pathway is still incomplete29,we next investigated whether cross-species coexpression analysis could generatenew hypotheses regarding additional enzymes that might be involved in this pathway.The full CCD8 OC can be generated by identifying the CCD8 OC for each pair ofspecies (43 genes in AT+OS, 151 genes in OS+SL, and 56 genes in AT+SL) inaddition to the CCD8 OC among all three species, as seen in Fig. 2. Weconcatenated this list and removed duplicate genes and target genes from the list(CCD7, CCD8, MAX1 and MAX2); this results in a full CCD8 OC of 233 genes.Interestingly, some genes may appear in multiple of these OCs but not in the three-species OC, which is a consequence of incomplete orthology relationships in theinput annotations (for example, the input data may show orthology between geneSL1 and OS1 and between SL1 and AT1, but not between AT1 and OS1, causingthem to not appear in the three-species OC). The genes that appear in the OC ofmultiple bait genes are prime candidates for functional characterization andexperimental validation, as these show conserved and strong coexpression with allknown core strigolactones biosynthetic genes. Much is still unknown regarding thesegenes; for example, we queried the 233 genes from the CCD8 OC in UniProt30 andretrieved annotations for 226 of them (Suppl. Table 4). Among the 91 SL genespresent in this table, we found that 35 of them contain the words “uncharacterizedprotein”. Further research on these genes could lead to the annotation of enzymes,transporters or regulators associated with Pi deficiency and/or strigolactonesbiosynthesis across three distinct plant species.

70
Fig. 2. The CCD8 OCs. Nodes represent genes, coloured by species: A. thaliana genes aregreen, S. lycopersicum genes are red, and O. sativa genes are teal. The big nodes are the targetgenes (CCD8). Gray edges link genes that are coexpressed (PCC>0.7), blue edges link orthologousgenes.
Only two orthology groups are coexpressed with CCD8 in all three species,making up seven genes: two from AT, two from SL and three from OS. We analysedthis group of genes in more detail. The two orthologous groups of genes in the AT-OS-SL CCD8 OC correspond to a gene family encoding U-box proteins(AT5G51270, OS06G0140800 and Solyc05g051610), and a gene family encodingcytochrome P450 enzymes that has been duplicated in OS (AT4G22690,Solyc08g079300, OS01G0700500 and OS08G0547900 [64.3% protein sequenceidentity]). These genes are specifically interesting, as the U-Box domain has beenfound to be involved in several abiotic stress responses in plants, including having aregulatory role in strigolactones and gibberellin signalling31, while cytochrome P450shave already been shown to be involved in the strigolactones biosynthetic pathwayvia MAX1, an enzyme that acts downstream of CCD7/832,33.
4.4.4. Communities of differentially expressed genes areconserved across eudicots and monocots
To study orthologous groups of genes that are specifically induced or inhibited bythe phosphate starvation response, we then evaluated the common transcriptomicdifferential responses between OS and SL by identifying OC-DEGs. We did notinclude the AT dataset in this and the next part of the study because only thenormalized gene expression (in RPKM) was publicly available, and DEG analysisrequires the raw counts for accurate results. Due to the design of the experiments,only one sample is directly comparable among the two experiments: day 2 after thestart of phosphate starvation (day 10 from the start of experiments). We identified anOC-DEG targeting this experimental condition consisting of 46 differentiallyexpressed genes, corresponding to 20 gene families. Interestingly, the majority of

71expressed genes, corresponding to 20 gene families. Interestingly, the majority ofthese genes consist of upregulated genes (Suppl. Table 5) with only two exceptions:OS04G0665600 and its ortholog Solyc10g080460.1, with a logFC of -1.21 and -1.28respectively when compared to the control sample.
Because we did not expect the phosphate starvation response of these twodistantly related plant species that were, moreover, grown under different conditions,to occur at the same rate, we repeated the OC-DEG search across all experimentalcondition comparison groups (phosphate starvation and replenishment vs controlsamples at the same timepoints) in both species, but only considered gene familieswith genes that are upregulated or downregulated in both species (Tables 2-3).While we previously showed that, at day 2 of phosphate starvation (day 10 of theexperiment), 20 gene families were differentially expressed in OS and SL (19upregulated and 1 downregulated), there is high overlap of upregulated genesfamilies in both species between days 10-12 in SL and days 14-15 in OS: 37 genesin average throughout these comparisons, with the highest overlap occurring at day14.6 of the OS starvation experiment, and day 11 for SL, where a total of 42 genefamilies are upregulated in both species. In contrast, very few genes are commonlyupregulated in both species during the Pi replenishment process, wheredownregulation plays a more important and conserved role: 31 gene families inaverage are downregulated in both species in response to Pi replenishment. Theseresults show that conserved transcriptomic responses during Pi deficiency acrossmonocots and eudicots are not constrained to coexpression across time points, butalso to differential gene expression at individual time points, and specifically stronginduction of significant sets of genes. This is important because previous evidenceshows that the function and members of coexpressed gene modules can beconserved through speciation events15, making comparative transcriptomics apowerful methodology to prioritize new candidate genes for functionalcharacterization in conserved processes.
Table 2. Summary of the OC-DEG analysis in rice and tomato, showing the number of genefamilies that are upregulated in both species for any two comparison groups.

72
Table 3. Summary of the OC-DEG analysis in rice and tomato, showing the number of genesfamilies that are downregulated in both species for any two comparison groups.
4.4.5. An untargeted comparative time-series geneexpression analysis reveals a conserved phosphatestarvation response core gene set
While the results above show that a targeted approach can successfully generateinteresting hypotheses about specific pathways, such an analysis is always biasedby the specific target genes that are used. Hence, in order to compare thephosphate starvation response time series data sets in a more unbiased andcomprehensive manner, we developed an untargeted mode for our analysis tools(see Methods) that reconstructs a global coexpression network of orthologous genesacross species, and applied this on the OS and SL datasets. This analysis resultedin a complex coexpression network of 713 gene families and 2201 coexpressionlinks among them, as seen in Fig. 3. This reveals that a total of 791 OS genes forma coexpression network under phosphate starvation with a similar topology as their811 ortholog genes in SL.
Fig. 3. Timelapse view of the expression fold changes of gene families that are coexpressedduring Pi starvation in S. lycopersicum (SL) and O. sativa (OS). Nodes represent gene families (e.g.one gene of each species if one-to-one orthology relationship). Edges link coexpressed gene

73one gene of each species if one-to-one orthology relationship). Edges link coexpressed genefamilies. Nodes are coloured according to the highest absolute logFC value within that node,separately for each timepoint and each species (see color key). A) logFC values at day 8 in OS, B)day 10 in OS, C) day 14 in OS, and D) day 15 in OS. E) logFC values at day 9 in SL, F) day 10 inSL, G) day 11 in SL, and H) day 12 in SL.
To distinguish which groups of gene families are likely to be directly involved in Pistarvation or replenishment, we integrated this coexpression network analysis withDGE analysis and generated eight distinct graphical representations of the samenetwork: one for either plant species in each of the four days of the Pi starvationexperiment. For the OS graphs, we coloured each node according to the logFCvalue of the OS gene within the gene family, and in case the node represented twoor more OS genes (in the case of one-to-many or many-to-many orthologrelationships), we selected as representative the gene with the highest absolutelogFC value. We then repeated the procedure for the SL set of graphs. Thiseffectively resulted in a “timelapse view” of the expression fold changes of genefamilies that are coexpressed during Pi starvation in both plants, as seen in Fig. 3.We can observe the expression changes in OS genes during Pi starvation on days8, 10, 14 and 15 in Fig. 3A)-D), and the expression changes in SL genes duringdays 9, 10, 11 and 12 in Fig. 3E)-H).
In both species, the main cluster at the center of the network, highlighted as“cluster I” in the figure, mostly starts being upregulated in the second timepoint (day10, Fig. 3B,F), and in SL a number of genes remain upregulated on day 11 (Fig.3G), but the expression of most return to normal on day 12 (Fig. 3H) or day 14 inOS (Fig. 3C). Of note, this cluster has upregulated genes involved in tocopherolbiosynthesis, which, like xanthophylls, have been linked to protection against photo-oxidative stress and low phosphate availability34,35. The most striking commonalitybetween the species is a cluster of gene families on the top left of the network,highlighted as “cluster II”, which show consistent upregulation by Pi starvation at alltimepoints, with most gene families being upregulated already at the secondtimepoint (Fig. 3B,F). Interestingly the upregulation in cluster II is more pronouncedin OS, and by the last timepoint (Fig. 3D), only 4 gene families in this cluster are notstrongly upregulated in this species. There are 53 gene families in this cluster,representing 76 OS genes and their 54 orthologous genes in SL, as seen in Suppl.Table 6. A GO term analysis revealed cluster II is enriched in OS genes annotatedwith organophosphate catabolism, and lipid metabolic processes, in particularglycero- and phospholipids: OS04G0394100, OS02G0514500 and OS08G0535700,paralogs that belong to the same orthology group with Solyc02g094400. Indeed,under Pi starvation plants undergo multiple lipid metabolic processes to replacephospholipids across different types of membranes at the cell level and conservephosphate36–38. In the future, further analysis of yet uncharacterized gene families inthis cluster may lead to additional insights regarding the phosphate starvationresponse, and annotation of functionally conserved genes across multiple plantspecies: 16 out of 54 SL genes in this cluster are annotated as uncharacterized inUniProt.
Altogether, this analysis suggests that the conserved core of the phosphatestarvation response across monocots and eudicots involves coregulated lipidmetabolic processes, and coregulated metabolic pathways that lead to thebiosynthesis of gibberellin, strigolactones, xanthophylls and tocopherols, amongothers.

74
4.5. ConclusionsFocusing the analysis around the genes known to be involved in strigolactones
biosynthesis yielded several candidate genes for functional characterization in regardto their involvement within the strigolactones pathway. Furthermore, the differentialexpression and untargeted analyses retrieved important metabolic pathways knownto be associated with Pi starvation responses that thus appear to be conservedthroughout eudicots and monocots. These associated responses constituted a smallportion of the global common networks, and further research within the other networkmodules may yield multiple other conserved processes associated to Pi starvation inplants. In the future, our framework for comparative analysis of differential andcoexpression networks may be used as a powerful methodology to characterizeconserved pathways and transcriptomic responses in other biological systems andconditions as well.
4.6. Tool availabilityWe have made CADE-HEroN, our computational workflow to identify OCs and
OC-DEGs, fully available at https://git.wageningenur.nl/medema-group/cade-heron/
4.7. Supplementary InformationSupplementary figures and tables are available to download from:
https://doi.org/10.5281/zenodo.4056494
References
1. López-Arredondo, D. L., Leyva-González, M. A., González-Morales, S. I., López-Bucio, J. & Herrera-Estrella, L. Phosphate Nutrition: Improving Low-PhosphateTolerance in Crops. Annu. Rev. Plant Biol. 65, 95–123 (2014).
2. Veneklaas, E. J. et al. Opportunities for improving phosphorus-use efficiency incrop plants. New Phytol. 195, 306–320 (2012).
3. Mayzlish-Gati, E. et al. Strigolactones Are Involved in Root Response to LowPhosphate Conditions in Arabidopsis. Plant Physiol. 160, 1329–1341 (2012).
4. Ruyter-Spira, C. et al. Physiological Effects of the Synthetic Strigolactone AnalogGR24 on Root System Architecture in Arabidopsis: Another Belowground Rolefor Strigolactones? Plant Physiol. 155, 721–734 (2011).
5. Czarnecki, O., Yang, J., Weston, D. J., Tuskan, G. A. & Chen, J.-G. A dual roleof strigolactones in phosphate acquisition and utilization in plants. Int. J. Mol. Sci.14, 7681–701 (2013).
6. Wang, F., Deng, M., Xu, J., Zhu, X. & Mao, C. Molecular mechanisms ofphosphate transport and signaling in higher plants. Semin. Cell Dev. Biol. 74,114–122 (2018).

75
7. Movahedi, S., Van Bel, M., Heyndrickx, K. S. & Vandepoele, K. Comparative co-expression analysis in plant biology. Plant, Cell Environ. 35, 1787–1798 (2012).
8. Janowski, M., Musialak-Lange, M., Hansen, B. O., Vaid, N. & Mutwil, M.Elucidating gene function and function evolution through comparison of co-expression networks of plants. Front. Plant Sci. 5, 1–9 (2014).
9. Zhou, Y. et al. Convergence and divergence of bitterness biosynthesis andregulation in Cucurbitaceae. Nat. Plants 2, 1–8 (2016).
10. Itkin, M. et al. Biosynthesis of antinutritional alkaloids in solanaceous crops ismediated by clustered genes. Science 341, 175–9 (2013).
11. Tzfadia, O. et al. CoExpNetViz: Comparative Co-Expression NetworksConstruction and Visualization Tool. Front. Plant Sci. 6, 1194 (2016).
12. Netotea, S., Sundell, D., Street, N. R. & Hvidsten, T. R. ComPlEx: Conservationand divergence of co-expression networks in A. thaliana, Populus and O. sativa.BMC Genomics 15, 1–17 (2014).
13. Movahedi, S., Van de Peer, Y. & Vandepoele, K. Comparative Network AnalysisReveals That Tissue Specificity and Gene Function Are Important FactorsInfluencing the Mode of Expression Evolution in Arabidopsis and Rice. PlantPhysiol. 156, 1316–1330 (2011).
14. Liao, C. S., Lu, K., Baym, M., Singh, R. & Berger, B. IsoRankN: Spectralmethods for global alignment of multiple protein networks. Bioinformatics 25,253–258 (2009).
15. Ficklin, S. P. & Feltus, F. A. Gene Coexpression Network Alignment andConservation of Gene Modules between Two Grass Species: Maize and Rice.Plant Physiol. 156, 1244–1256 (2011).
16. Liu, T.-Y. et al. Identification of plant vacuolar transporters mediating phosphatestorage. Nat. Commun. 7, 11095 (2016).
17. R Core Team. R: A language and environment for statistical computing. RFoundation for Statistical Computing (2017).
18. Robinson, M. D., McCarthy, D. J. & Smyth, G. K. edgeR: A Bioconductorpackage for differential expression analysis of digital gene expression data.Bioinformatics 26, 139–140 (2009).
19. Zerbino, D. R. et al. Ensembl 2018. Nucleic Acids Res. 46, D754–D761 (2018).20. Smedley, D. et al. BioMart - Biological queries made easy. BMC Genomics 10,
1–12 (2009).21. Isaacson, T., Ronen, G., Zamir, D. & Hirschberg, J. Cloning of tangerine from
Tomato Reveals a Carotenoid Isomerase Essential for the Production of β-Carotene and Xanthophylls in Plants. Plant Cell 14, 333–342 (2002).
22. Hernández, I. & Munné-Bosch, S. Linking phosphorus availability with photo-oxidative stress in plants. J. Exp. Bot. 66, 2889–2900 (2015).
23. Stigliani, A. L., Giorio, G. & D’Ambrosio, C. Characterization of P450 Carotenoidβ- and ε-Hydroxylases of Tomato and Transcriptional Regulation of XanthophyllBiosynthesis in Root, Leaf, Petal and Fruit. Plant Cell Physiol. 52, 851–865(2011).

76
24. García-Plazaola, J. I., Matsubara, S. & Osmond, C. B. The lutein epoxide cyclein higher plants: its relationships to other xanthophyll cycles and possiblefunctions. Funct. Plant Biol. 34, 759 (2007).
25. Hedden, P. & Thomas, S. G. Gibberellin biosynthesis and its regulation.Biochem. J. 444, 11–25 (2012).
26. Gomez-Roldan, V. et al. Strigolactone inhibition of shoot branching. Nature 455,189–194 (2008).
27. Umehara, M. et al. Inhibition of shoot branching by new terpenoid planthormones. Nature 455, 195–200 (2008).
28. Jiang, C., Gao, X., Liao, L., Harberd, N. P. & Fu, X. Phosphate Starvation RootArchitecture and Anthocyanin Accumulation Responses Are Modulated by theGibberellin-DELLA Signaling Pathway in Arabidopsis. Plant Physiol. 145, 1460–1470 (2007).
29. Wang, Y. & Bouwmeester, H. J. Structural diversity in the strigolactones. J. Exp.Bot. 69, 2219–2230 (2018).
30. The UniProt Consortium. UniProt: a worldwide hub of protein knowledge. NucleicAcids Res. 47, D506–D515 (2019).
31. Shu, K. & Yang, W. E3 Ubiquitin Ligases: Ubiquitous Actors in PlantDevelopment and Abiotic Stress Responses. Plant Cell Physiol. 58, 1461–1476(2017).
32. Zhang, Y. et al. The tomato MAX1 homolog, SlMAX1 , is involved in thebiosynthesis of tomato strigolactones from carlactone. New Phytol. 219, 297–309(2018).
33. Abe, S. et al. Carlactone is converted to carlactonoic acid by MAX1 inArabidopsis and its methyl ester can directly interact with AtD14 in vitro. Proc.Natl. Acad. Sci. 111, 18084–18089 (2014).
34. Hernández, I. & Munné-Bosch, S. Linking phosphorus availability with photo-oxidative stress in plants. J. Exp. Bot. 66, 2889–2900 (2015).
35. Demmig-Adams, B. et al. Emerging trade-offs - impact of photoprotectants(PsbS, xanthophylls, and vitamin E) on oxylipins as regulators of developmentand defense. New Phytol. 197, 720–729 (2013).
36. Hartel, H., Dormann, P. & Benning, C. DGD1-independent biosynthesis ofextraplastidic galactolipids after phosphate deprivation in Arabidopsis. Proc. Natl.Acad. Sci. 97, 10649–10654 (2000).
37. Andersson, M. X., Stridh, M. H., Larsson, K. E., Liljenberg, C. & Sandelius, A. S.Phosphate-deficient oat replaces a major portion of the plasma membranephospholipids with the galactolipid digalactosyldiacylglycerol. FEBS Lett. 537,128–132 (2003).
38. Jouhet, J. et al. Phosphate deprivation induces transfer of DGDG galactolipidfrom chloroplast to mitochondria. J. Cell Biol. 167, 863–874 (2004).

77
Chapter 5MEANtools: An Integrative Multi-omics
Approach for Metabolic PathwayPrediction
Hernando G. Suarez Duran1, Olga Zafra Delgado1, Justin J. J. van der Hooft1,Elizabeth S. Sattely2, Marnix H. Medema1
1 Bioinformatics Group, Wageningen University, 6708 PB Wageningen, TheNetherlands2 Department of Chemical Engineering, 94305 Stanford University, Stanford, CA,USA
Manuscript in preparation.

78
5.1. AbstractPlants harbour a highly diverse and complex specialized metabolism, with key
functions in pollination, stress response, microbiome modulation and defenceagainst herbivores and pathogens. Contemporary omics-based approaches toidentify the underlying enzymatic pathways have so far largely been dominated bygenomic and transcriptomic methods that use known metabolites or enzymes as astarting point. Multi-omics integration has the potential to solve this limitation byallowing the prediction of metabolic pathway to be made through simultaneousobservations in multiple -omic sources that are used to generate a single hypothesis.However, no systematic, unsupervised multi-omics method has been developed thatintegrates transcriptomic, metabolomic and genomic data for untargeted specializedmetabolic pathway discovery. Here, we present MEANtools, a multi-omics analysisworkflow that integrates genomic, transcriptomic and metabolomic data withenzymatic reaction databases to predict metabolic pathways, by identifying massdifferences between metabolites that are co-abundant with transcripts whoseenzymatic products are capable of catalyzing reactions that can explain these.MEANtools has a flexible and user-friendly input and output, and allows users totune the enzymatic reactions that are retrieved from the database to generatemetabolic pathway predictions; for example, by retrieving only experimentallyvalidated reactions, or by selecting a taxa of origin. We illustrate MEANtools’ usagewith a paired transcriptomic-metabolomic experiment and show that it is able topredict multiple steps in the recently characterized falcarindiol biosynthetic pathwayin tomato. This demonstrates its potential to generate testable hypotheses onmetabolites, enzymes and reactions in metabolic pathways.
5.2. IntroductionPlants produce a wide array of natural products (NPs) with abundant chemical
diversity and complexity1. Specialized metabolites have a wide range of uses in avariety of industries, ranging from pharmacological, to flavors and fragrances2. Thishas fueled an interest in new methodologies to predict and identify specializedmetabolites and the metabolic pathways different species use to produce them3.Indeed, the field studying specialized metabolism has come a long way since thediscovery of penicillin in fungi ~90 years ago: from mostly phenotypic screeningmethods in the 1940s, to the bioinformatics- and genomics-based methodsdeveloped in recent years to study both microorganisms and plants4,5. In recentyears, the high level of success and many advances in bioinformatics and –omicsanalysis have resulted in an ever-increasing number of high-quality genomeassemblies, as well as transcriptome, metabolome, and enzymatic reaction datasets,Moreover, advances in synthetic biology allow the results of in silico analyses to bemore easily validated in vivo, increasing the rate at which novel NPs and theirproducing enzymes can be characterized. For instance, transient expression of plantenzymes in tobacco allows enzyme and metabolic pathway characterization within amatter of weeks6. Taken together, the plant functional genomics field has entered anew era7.
This computational era of plant NP functional genomics has so far largely beendefined by genomic and transcriptomic strategies5. Examples of the former includecomputational tools such as plantiSMASH8 and PhytoClust9, which identify

79computational tools such as plantiSMASH8 and PhytoClust9, which identify
chromosomally co-localized clusters of genes that may encode specialized metabolicpathways. Transcriptomic strategies rely on the guilt-by-association principle10 toidentify enzyme-coding genes with concerted expression that are therefore likely tofunction within the same metabolic pathway; however, these methods require priorknowledge about expected enzyme functions to link the enzyme-coding genes tospecific metabolites: for example, by targeting known metabolites or enzymes, theirstructural or functional annotations can be used to generate hypotheses about themetabolic pathways they are associated with11,12. More recently, tools likeCoExpNetViz13 and CADE-HEroN (Suarez et. al, manuscript in preparation)leverage sequence homology for this purpose by using transcriptomes from multiplespecies, however many plant enzymatic functions are known to be species-specific14, and therefore unlikely to be predicted by these methods.
A promising solution to this limitation may be found in the integration of data frommultiple –omic sources. Plant specialized metabolism is a complex interaction ofmultiple biological systems working synergistically, and multi-omics techniques offera holistic view of the process. They allow researchers to acquire a more accurateunderstanding of metabolism and reduce type I and type II errors in the predictedassociations among genes, metabolites and enzymatic reactions by integratingobservations from various data sources to predict metabolic pathways15. Multi-omicsintegration strategies can be broadly separated into four categories: conceptual,statistical, model and pathway-based. Each strategy presents distinct challenges andall have been reviewed in detail before, with multiple examples of successfulusage15,16. Despite this no systematic, unsupervised multi-omics method has beendeveloped that integrates transcriptomic, metabolomic and genomic data foruntargeted specialized metabolic pathway discovery.
In this paper, we present MEANtools, a multi-omics analysis workflow thatcombines correlation-based and pathway-based integration techniques along withthe guilt-by-association principle to predict metabolic pathways, and the enzyme-coding genes and metabolites associated with each prediction, presentingresearchers with hypotheses that can be prioritized for experimental validation. (Fig.1). MEANtools predicts metabolic pathways by correlating the expression ofenzyme-coding genes with co-abundant metabolites in paired transcriptomic-metabolomic experiments. Although this methodology has aided the characterizationof diverse metabolic processes in plants17,18 by reducing the dimensionality of theproblem and thus generating a small set of testable hypotheses19, it is known toresult in a high number of false positive metabolite-transcript associations20.Therefore, we leverage RetroRules21, a retrosynthesis-oriented database ofenzymatic reactions annotated with known and predicted protein domains andenzymes linked to each reaction, to assess whether observed chemical changes ofmetabolites (identified as mass shifts) can be explained by positing subsequentcatalytic steps that are known to be catalyzed by protein families encoded incoexpressed gene modules. MEANtools generates a metabolic network based onenzymatic reaction databases, a workflow used by many computational tools forretrosynthetic metabolic pathway design or reconstruction22; however, MEANtoolsuses metabolome, transcriptome and metabolome data as well in this process,allowing users to explore the biosynthetic potential of any molecular structure andgenerate concrete hypotheses about possible pathways leading up to (or from) agiven metabolite, which can be tested in the laboratory. Results are displayed in avariety of formats for users to interact with, describing predicted metabolic pathways

80variety of formats for users to interact with, describing predicted metabolic pathways
along with the metabolites, enzymes and reactions that are potentially involved inthem. Altogether, MEANtools serves as strong basis for the development ofmethodologies to explore ways in which paired genomic, transcriptomic andmetabolomic data can be used to analyze biosynthetic diversity.
5.3. Methods and Implementation
5.3.1. MEANtools workflowMEANtools generates metabolic pathway predictions by integrating metabolomic,
transcriptomic and genomic data with enzymatic reaction databases, as seen in Fig.1. For this purpose, the user can annotate a (sub)set of mass signatures (mass-to-charge ratios of measured ions) in the metabolomic dataset with metabolitestructures, and/or MEANtools can assign structure predictions by identifying adductsin the metabolome and querying NPDB (Natural Product Database), acomprehensive database of natural product structures which has been compiled bycombining a range of public databases (Stokman et al., in preparation; http://…).Possible links between metabolites and transcripts are first identified by calculatingcorrelations across samples, and the correlated pairs are then queried in RetroRulesto identify transcript-metabolite pairs in which the transcript encodes an enzyme witha protein domain capable of catalyzing an enzymatic reaction that has the correlatedmetabolite as possible substrate or product. MEANtools then maps the products ofeach successful reaction to other mass signatures in the metabolome, or tounmeasured “ghost” mass signatures (explained further down below). Thisprocedure is then repeated iteratively according to the user’s specifications to predictfurther reactions from the new products and generate a reaction network. Finally,MEANtools analyzes the resulting network to provide the user with possiblemetabolic pathway predictions that can then be browsed in Cytoscape23, or displayedas figures indicating each metabolite, reaction, and possible enzymes that mayexplain the transformations required.

81
Fig. 1. MEANtools predicts metabolic pathways by integrating transcriptomic, metabolomic andgenomic data. A) First, correlations are computed between expression levels of transcripts andabundances of metabolites. B) Mass signatures in the metabolome are queried against RetroRulesto identify pairs with mass differences associated with known enzymatic reactions. C) The proteinfamilies/domains encoded by the genes in the correlated transcript-metabolite pairs are used toquery RetroRules and identify which enzymatic reactions may be associated with each transcript. D)MEANtools then integrates the results of previous steps to identify cases in which metabolite pairsare correlated to a transcript that encodes an enzyme capable of catalyzing a reaction that explainstheir mutual mass difference. E) Finally, MEANtools maps the product of these reactions to othermass signatures in the metabolome, and repeats the procedure to generate pathway predictions.
5.3.2. Correlation-based integration generates testableassociations
In stage A, MEANtools processes transcriptome and metabolome data frompaired datasets. The transcriptome must be input in a CSV table of normalized geneexpression data (RPKM/FPKM), and the metabolome as a CSV table of metaboliteabundance, with mass signatures as rows and samples as columns. Both inputs areconverted into DataFrames with the Pandas Python package (v0.24.2)24, leveragingits merge function for each data integration and annotation step. MEANtools usesSciPy (v1.2.1)25 to calculate Spearman’s rank correlations and identify pairs oftranscripts and mass signatures with positively or negatively correlated expression(0.7) and abundance throughout the input, according to user-set correlationthresholds. Additionally, MEANtools also provides the user the option to usePearson’s correlation coefficient instead, and/or select a custom correlation cutoff toincrease the number of resulting associations at the expense of reliability.
Global reconstruction of co-expression modules in gene expression data hasbeen shown to be a powerful method to identify groups of genes involved in thesame metabolic pathway when querying for modules with genes that encode

82same metabolic pathway when querying for modules with genes that encode
biosynthetic enzymes26. Because of this, selecting as input for MEANtools onlygenes present in this type of coexpression modules has the potential to result inincreased confidence of the predictions as they will have a higher chance of beingassociated with the same metabolic pathway than otherwise. To facilitate thisprocess, MEANtools includes our own implementation of the approach to identifygene coexpression clusters described by Wisecaver et al.26 as an optional pre-processing step. Furthermore, MEANtools allows users to visualize the expressionof each cluster in heatmaps with genes sorted in three categories according to theprotein domains they encode, following the same categorization used byplantiSMASH8: scaffold-generating enzymes, tailoring enzymes, and the remaininggenes.
5.3.3. Mass-shifts associated to reactions serve astemplates for pathway prediction
In stage B, MEANtools scans the metabolome to identify mass signatures thatcould represent metabolites in same metabolic pathway. For this purpose,MEANtools queries all enzymatic reactions in RetroRules and cross-referencesthem with MetaNetX27, a repository of metabolic networks that MEANtools uses toidentify the mass differences between the main products and substrates of allreactions. MEANtools then annotates all reactions with an associated mass shift.This only needs to be performed once, upon retrieving or updating the RetroRulesdatabase.
MEANtools uses the generated associations between reactions and mass shiftsto scan the input metabolome and identify pairs of mass signatures with a differencein mass-charge ratio that can be explained by a known reaction, annotating onemass signature as possible substrate and the other as possible product. Moreover,because a mass shift may be explained by more than one reaction, and manyreactions are reversible, any pair of mass signatures can be annotated with multiplereactions in both directions. Furthermore, because it cannot be assumed that allmetabolites in a metabolic pathway will be present at sufficient levels to be detectedin the metabolome, MEANtools generates “ghost mass signatures” which serve asan intermediate unmeasured metabolite between any two metabolites with measuredmass signatures, a concept that was recently applied by Metwork to generatemetabolic networks based on MS/MS spectra28. Based on the combination ofreaction-mass-shift associations and bridging ghost mass signatures, MEANtoolsgenerates a reaction network composed of mass signatures linked by annotatedreactions that serves as the basis for the prediction of metabolic pathways.
5.3.4. Curated Pfam-reaction annotations constrainmetabolite-enzyme associations
Stage C occurs concurrently: MEANtools integrates the metabolomic-transcriptomic correlation data from the first stage as a constraint to identifyreactions in the generated reaction network that can be explained by one of theenzymes encoded by genes that are correlated to the mass signatures linked by thereaction. To this end, we adapted the RetroRules database, which is populated with~17,000 reactions annotated with enzymes that are predicted to be associated with

83~17,000 reactions annotated with enzymes that are predicted to be associated with
them21. The majority of these annotated enzyme-reaction associations, however, arethe result of propagating the annotation of characterized reactions to other reactionswith the same or similar enzyme commission (EC) number, and are therefore likelyto contain too many errors to function as an effective constraint for our applications.In order to increase confidence in the enzymatic annotations we cross-referencedeach reaction in RetroRules to the manually curated reaction databases Rhea29 andKEGG30, identified reaction-enzyme associations supported by experimentalevidence and then propagated these annotations through KEGG Orthology groups.This resulted in a curated set of 5,168 reactions and 2,706,626 respective high-confidence reaction-enzyme associations (Suppl. Table 1). To increase the numberof enzymatic transformations available for metabolic pathway predictions, wegenerated a second, less strict, set of associations. For this, we usedECDomainMiner31, a tool designed to infer reaction associations between ECnumbers and Pfam32 domains for automatic annotation. Using the first set of curatedrules as a starting point, we identified a set of associations thus inferred with at least0.95 confidence. We then selected all other reactions from RetroRules with an ECnumber and Pfam annotations identical to this high-confidence set, and includedthem in a second set of associations, resulting in 7,070 reactions and 3,135,908reaction-enzyme associations. We generated a third set of 10,650 reactions and3,203,412 reaction-enzyme associations by identifying RetroRules reactionsannotated with fewer than 7 Pfams, an arbitrary cut off that serves as a tradeoffbetween enzymatic annotation specificity and the number of preserved reactions.MEANtools includes these three different reaction-enzyme associations datasets assettings (strict, medium and loose, respectively) to allow the user to constrain thepredictions for specific purposes and find the right balance between sensitivity andspecificity, considering the tradeoff between enzymatic annotation confidence anddiversity of the resulting set of enzymatic reactions.
By cross-checking these reaction-enzyme association data sets with sets ofcorrelated enzyme-coding genes and metabolites, MEANtools effectively filters theset of possible mass shift-reaction associations based on -omics evidence. Thus,MEANtools generates a reaction network where each node is a mass signaturewithin the metabolome, or an unmeasured ghost mass signature. In this network,nodes are linked by directed edges representing enzymatic reactions that can becatalyzed by at least one of the enzyme families encoded by the genes correlated toone of the two mass signatures the reaction links.
5.3.5. MEANtools predicts metabolic pathways supportedby multi-omics input and enzymatic reaction databases
In stage D, MEANtools uses the reaction network to generate pathwaypredictions. To this end, it first predicts possible metabolites and their correspondingmolecular structures for each mass signature by identifying possible adducts andquerying NPDB (Stokman et al., in preparation), or a user-defined metabolitedatabase that can be supplied in CSV format. MEANtools then uses the rdkit Pythonpackage(v 2019.03.2.0)33 to generate in silico molecules resulting from each reactionassociated substrate(s). Because of the large number of reactions in RetroRules,generating all product molecules for the metabolite structures predicted in ametabolome by querying all reactions can become time-consuming andcomputationally taxing. Every successful reaction will result in new metabolites that
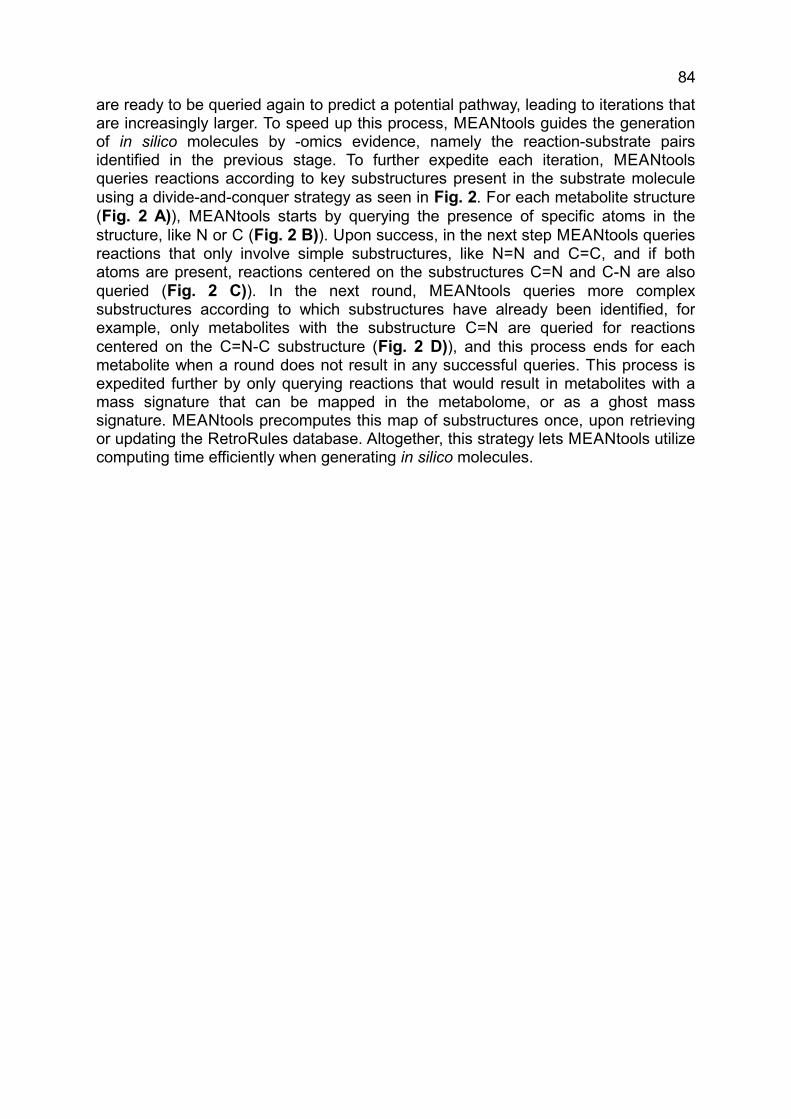
84computationally taxing. Every successful reaction will result in new metabolites thatare ready to be queried again to predict a potential pathway, leading to iterations thatare increasingly larger. To speed up this process, MEANtools guides the generationof in silico molecules by -omics evidence, namely the reaction-substrate pairsidentified in the previous stage. To further expedite each iteration, MEANtoolsqueries reactions according to key substructures present in the substrate moleculeusing a divide-and-conquer strategy as seen in Fig. 2. For each metabolite structure(Fig. 2 A)), MEANtools starts by querying the presence of specific atoms in thestructure, like N or C (Fig. 2 B)). Upon success, in the next step MEANtools queriesreactions that only involve simple substructures, like N=N and C=C, and if bothatoms are present, reactions centered on the substructures C=N and C-N are alsoqueried (Fig. 2 C)). In the next round, MEANtools queries more complexsubstructures according to which substructures have already been identified, forexample, only metabolites with the substructure C=N are queried for reactionscentered on the C=N-C substructure (Fig. 2 D)), and this process ends for eachmetabolite when a round does not result in any successful queries. This process isexpedited further by only querying reactions that would result in metabolites with amass signature that can be mapped in the metabolome, or as a ghost masssignature. MEANtools precomputes this map of substructures once, upon retrievingor updating the RetroRules database. Altogether, this strategy lets MEANtools utilizecomputing time efficiently when generating in silico molecules.

85
Fig. 2. MEANtools identifies possible reactions for a molecular structure according to a divide-and-conquer strategy. For each metabolite, MEANtools first queries the presence of key atoms, andthen continues to query, in rounds, increasingly complex reactant substructures according to whichsubstructures have already been identified. For example, A) a set of metabolites is initially queriedfor the presence of B) nitrogen and carbon atoms. C) Metabolites that pass these criteria are then bequeried for more complex substructures like C-N or C=C. D) In the following round, MEANtoolsqueries substructures with more complexity according to which substructures have already beenidentified: in this manner, only metabolites with the N=C substructure are queried for the N=C-Nsubstructure.
As a result of this stage, MEANtools generates series of ensuing reactions withpredicted products for all mass signature-pairs, associated correlated enzyme-coding genes, and references to the characterized reactions and enzymes thatserved as rules to predict this reaction. An example of this can be seen in Fig. 3,where a characterized dehydrogenation serves as template to predict adehydrogenation of octadecene diynoic acid. This last stage can be iterated multipletimes (as desired by the user), to generate pathway predictions that extend beyondone enzymatic reaction away from the initial query molecule.

86
Fig. 3. MEANtools uses reaction rules from known enzymatic reactions to identify predictstructures in metabolic pathways. For example, the dehydrogenation of 1-Octanol into 1-Octanal(KEGG reaction: R02878) is used as template to predict the dehydrogenation of octadecene diynoicacid.
5.3.6. Easy-to-browse untargeted and targeted metabolicpathway predictions
In stage E, MEANtools analyses the resulting reaction network generated inprevious stages to predict candidate metabolic pathways of interest to the user. Forthis purpose, MEANtools uses the NetworkX Python package (v2.4)34 to generateone subnetwork for each of the initial metabolites input by the user. MEANtoolsconverts each subnetwork into a directed acyclic graph (DAG) by identifying allcycles within the network that represent predicted reversible reactions, only retaininglinks that are able to move the reaction forward and away from the initial metabolite.In the case of cycles between metabolites at the same reaction distance from theinitial metabolite, the edge with the weakest enzyme-metabolite correlation isremoved. This method effectively generates various DAGs rooted at the initialmetabolites, for which candidate metabolic pathways can be predicted by identifyingthe longest reaction path in each subnetwork that starts from the initial metabolite.The method is repeated to generate a DAG with each initial metabolite at the end ofthe reaction, resulting in two pathway predictions for each input structure.MEANtools then outputs the full reaction network and all DAGs as CSV tables thatare easy to import and browse in Cytoscape23. Lastly, pathway predictions are outputas SVG image files, detailing the metabolites, reactions and genes involved, andtheir respective correlations.
To aid users in exploring the predictions, MEANtools provides an option togenerate SVG files for each of the molecular structures predicted in previous stages,which allows users to identify and prioritize structures or reactions of interest. Uponidentification, MEANtools can generate DAGs and pathway predictions rooted at anymolecule selected by the user. Finally, the user can also select specific metabolitesand, if available, MEANtools will generate a pathway prediction containing allmetabolites specified by the user.

87
5.3.7. Flexible and user-friendly input and outputAlthough MEANtools is focused on the analysis of paired transcriptomic-
metabolomic datasets, it can also be used with only metabolome data, or to analysethe biosynthetic potential of a specific metabolite structure. In total, MEANtoolsprovides five tool modes according to which data the user inputs, as seen in Table 1.Tool modes 1 and 2 were described above and generate pathway predictionssupported by the metabolome and transcriptome, with their only difference being theorigin of the metabolite structure prediction: database prediction or targeted userinput. Tool modes 3 and 4 generate pathway predictions only using the metabolome,and thus will not use enzyme expression-metabolite abundance correlation evidenceas a restriction. However, by adding the genome annotation as input, MEANtools willadd to each pathway prediction all genes that encode enzymes capable of eachreaction step and restrict the output to Pfam domains encoded in the genomesequence. Finally, tool mode 5 allows the user to generate the unrestricted networkof biosynthetic potential starting from a specific metabolite structure according toknown enzymatic reactions.
Table 1. MEANtools can be used in five tool modes, according to the data used as input. Toolmodes 1 and 2 generate pathway predictions supported by the metabolome and transcriptome. Toolmodes 3 and 4 generate pathway predictions only using only the metabolome. Tool mode 5 allowsthe user to generate the biosynthetic potential starting of specific metabolite structures according toknown enzymatic reactions.
5.4. Results and Discussion
5.4.1. Identification of multi-omics correlation clusters helpprioritize datapoints in the transcriptome and metabolome
To demonstrate MEANtools as a metabolic pathway predictions workflow, weused the paired transcriptomic-metabolomic dataset generated and described byJeon et al.35. This dataset is the result of seven fungal and bacterial elicitationsapplied to tomato leaves, sampled over two days in triplicates, resulting in 87samples for which gene expression data were collected and for which abundances of11,266 mass signatures were measured.
Because of the high number of mass signatures, using MEANtools in an

88Because of the high number of mass signatures, using MEANtools in anunsupervised manner (tool modes 2 and 4) can be time-consuming andcomputationally taxing, as it will produce numerous structure predictions. To reducethe number of datapoints, we used MEANtools to identify clusters of coexpressedgenes that encode enzymes with known biosynthetic potential, along with the masssignatures correlated to them (see Methods). The results of this analysis module arevisualized in Fig. 4 A) with an automatically generated heatmap describing theexpression changes in the genes within the clusters identified, and Fig. 4 B), whichdetails the correlation of the coexpressed genes with mass signatures. By browsingthese heatmaps and this network, users can easily prioritize genes and masssignatures of interest. An example of a gene coexpression of this process can beseen in Fig. 4: we identified a cluster (circled in Fig. 4A)) with enzyme members withpotentially interesting biosynthetic potential (detailed in Fig. 4B)), such as terpenesynthases and protein domains known to modify terpene scaffolds, such asacyltransferases and P450s36. As seen in Fig 4. A), many of these genes (bluenodes) correlate with many mass signatures (red nodes), making it a group of 75genes and 70 mass signatures that could be used as a basis for unsupervisedpathway prediction using any of the tool modes of MEANtools, in order to guidefurther experimental analysis and characterization.

89

90Fig. 4. MEANtools identifies gene expression clusters with genes that encode biosynthetic
protein domains. A) Transcript-metabolite correlation network of genes within a biosyntheticcoexpression cluster. Nodes represent genes (blue), metabolites (red) and clusters (green). B)MEANtools generates a gene expression heatmap for each identified biosynthetic coexpressioncluster. Expression is normalized by samples (columns) and genes are sorted in three categoriesaccording to encoded protein domains: scaffold-generating enzymes at the top, followed by tailoringenzymes, and lastly the remaining genes.
5.4.2. MEANtools predicts parts of the proposedfalcarindiol biosynthesis pathway
Jeon et al.’s research led to a proposed metabolic pathway for the biosynthesis offalcarindiol, the candidate enzyme classes for each reaction step, and theidentification of some genes (potentially) involved in the pathway. To validateMEANtools’ predictions, we identified all mass signatures that can be predicted forthe eight structures in the falcarindiol pathway. Because Jeon et al. focused mainlyon M+Na and M+H adducts, we selected only mass signature predictionscorresponding to these adducts with a tolerance of 60ppm. This resulted in a total of45 mass signatures mapped to 8 structures (Suppl. Table 2), which were used asthe metabolite structure input for a MEANtools analysis in mode 1.
By using only experimentally validated enzyme-reaction associations (“strict”settings), and a minimum absolute Spearman correlation coefficient of 0.5,MEANtools predicts the second step of the falcarindiol biosynthesis pathwayproposed by Jeon et al. (crepenynic acid -> dehydrocrepenynic acid), seen in Fig. 5A). Among the genes that MEANtools predicts may be involved in this reaction isSolyc12g100250, which Jeon et al. identified as a major desaturase in thefalcarindiol pathway that was linked to this reaction using transient expression.MEANtools also predicts steps five and six of the pathway proposed by Jeon et al.(octadecadiene diyonic acid -> metabolite_6 -> metabolite_7), seen in Fig. 5 B), andprovides candidate genes encoding enzymes with a protein domain that has beencharacterized as able to perform each reaction. Lastly, by using only the structurepredictions, metabolome data and genome annotations (tool mode 3), MEANtoolsanticipates the second step of the pathway (crepenynic acid -> dehydrocrepenynicacid) and steps four, five and six (octadecene diynoic acid -> octadecadiene diynoicacid -> metabolite_6 -> metabolite_7), pictured in Fig. 5 C) as a metabolite network.Interestingly, in this tool mode, MEANtools anticipates a step of the pathway it doesnot with strict settings. To further explore the predictive power of MEANtools, werepeated the analysis with “medium” and “loose” settings, and a distribution of thecorrelation coefficients of all predicted gene-metabolite associations for thefalcarindiol pathway at each setting can be seen in Suppl. Fig. 1. Here, we can seeMEANtools predicts 7 genes with ADH_N and NAD_binding_10 Pfam domains thatare, with lower confidence than the other predictions, predicted to potentially performthe dehydrogenation of octadecene diynoic acid. A table with all of the predictionscan be found in Suppl. Table 3.

91
Fig. 5. MEANtools predicts parts of the falcarindiol pathway as proposed by Jeon et al.35, andthe genes responsible for each enzymatic step. A “^” or “v” sign next to each gene indicates whetherit is correlated to the abundance of the substrate or the product of each step: green indicates positivecorrelation, red indicates negative correlation, and blue indicates the gene is correlated to multiple

92correlation, red indicates negative correlation, and blue indicates the gene is correlated to multiplemass signatures, with some positively, and some negatively. A) MEANtools predicts 55 possiblegenes for the second step of falcarindiol biosynthesis (crepenynic acid -> dehydrocrepenynic acid),including 4 genes with the FA_desaturase Pfam domain, and Solyc12g100250, the gene Jeon et al.identified as the desaturase that catalyses this step in the pathway. MEANtools also anticipates thepossible production of another metabolite outside the falcarindiol pathway (VM_4535953) andprovides a set of candidate genes that could be involved. B) MEANtools predicts steps five and sixof falcarindiol biosynthesis (octadecadiene diyonic acid -> metabolite_6 -> metabolite_7). Among thegenes predicted for the fifth step are six genes with p450 or FA_desaturase protein domains. Whilethe cytochrome p450 enzymes are the most likely candidates for this hydroxylation reaction, the factthat MEANtools also indicates FA_desaturase enzymes as candidates for the reaction is explainedby the evidence that AlkB1 (not pictured), a known Pseudomonas FA_desaturase, is capable ofhydroxilation37. MEANtools also anticipates the possible production of another metabolite outside thefalcarindiol pathway (here designated VM_4602317) and identifies a redox enzyme that couldpotentially be involved. C) An overview of the biosynthetic potential of the metabolites in thefalcarindiol biosynthetic pathway generated using MEANtools based on genome information only,without filtering them with expression correlation data. Each node represents a unique metabolite,and arrows link metabolites that can be transformed into one another through a known enzymaticreaction. Black nodes indicate the metabolites in the falcarindiol biosynthetic pathway. MEANtoolsanticipates the second step of the pathway (crepenynic acid -> dehydrocrepenynic acid) and stepsfour, five and six (octadecene diynoic acid -> octadecadiene diynoic acid -> metabolite_6 ->metabolite_7).
5.5. ConclusionsMEANtools can generate testable hypotheses on metabolic pathways rapidly,
with little to no prior knowledge, by integrating multi-omics data. This methodeffectively automates the identification of key Pfam domains required for a specificreaction and allows users to tune the reaction-Pfam domain associations accordingto their level of confidence, or based on the taxa of origin. For this purpose,MEANtools queries RetroRules, a retrosynthesis-oriented enzymatic reactionsdatabase, showing that tools and methods within the retrosynthetic biology andsynthetic pathway design fields have considerable application potential for metabolicpathway prediction and potentially NP discovery. While we present MEANtools as ametabolic pathway prediction approach, its different modes allow for diverse usage,such as for retrosynthetic pathway design by targeting specific metabolite structureswithout metabolome or transcriptome data (tool mode 5). To disentangle reactionnetworks into useful predictions, MEANtools converts them into DAGs, which allowthe quick identification of linear metabolic pathways, which are presented to the useralong with the metabolites, enzymes and reactions involved in them.
5.6. Future perspectivesBecause of MEANtools’ flexible and modular design, there is room for
improvement in many of its individual processing steps. Annotating mass signatureswith predicted structures can be improved by using MS/MS data to increaseaccuracy and allow validation, in a similar way as done by Metwork28. Convertingpredicted reaction networks into DAGs was the only method we used to study andpresent unsupervised predictions, but more complex manipulations of the networkmay allow for predictions better tailored for the user, such as prioritizing specificreactions or molecular substructures. Further curating the reaction-Pfam domainassociations, or allowing the user better control over them, could improve themethod as well: some enzyme domains may be linked to large numbers of reactions,likely to lead to false positives when the objective is to predict pathways, but could be

93likely to lead to false positives when the objective is to predict pathways, but could be
useful when exploring the biosynthetic potential of a structure when designing asynthetic pathway. Altogether, we present a novel computational method to predictmetabolic pathways and is guided by multi-omic evidence, allowing researchers toquickly generate testable and easy-to-browse hypotheses. Furthermore, weanticipate that our work provides the basis for future work to expand the numbers ofways in which paired genomic, transcriptomic and metabolomic data can be used toanalyze biosynthetic diversity.
5.7. Tool availabilityMEANtools is fully available at https://git.wageningenur.nl/medema-
group/meantools/
5.8. Supplementary InformationSupplementary figures and tables are available to download from:
https://doi.org/10.5281/zenodo.4056591
References
1. Fang, C., Fernie, A. R. & Luo, J. Exploring the Diversity of Plant Metabolism.Trends Plant Sci. 24, 83–98 (2019).
2. Kabera, J. N., Semana, E., Mussa, A. R. & He, X. Plant Secondary Metabolites:Biosynthesis, Classification, Function and Pharmacological Properties. J. Pharm.Pharmacol. 2, 377–392 (2014).
3. Owen, C., Patron, N. J., Huang, A. & Osbourn, A. Harnessing plant metabolicdiversity. Curr. Opin. Chem. Biol. 40, 24–30 (2017).
4. Katz, L. & Baltz, R. H. Natural product discovery: past, present, and future. J.Ind. Microbiol. Biotechnol. 43, 155–176 (2016).
5. Medema, M. H. & Osbourn, A. Computational genomic identification andfunctional reconstitution of plant natural product biosynthetic pathways. Nat.Prod. Rep. 33, 951–62 (2016).
6. Reed, J. & Osbourn, A. Engineering terpenoid production through transientexpression in Nicotiana benthamiana. Plant Cell Rep. 37, 1431–1441 (2018).
7. Rai, A., Yamazaki, M. & Saito, K. A new era in plant functional genomics. Curr.Opin. Syst. Biol. 15, 58–67 (2019).
8. Kautsar, S. A., Suarez Duran, H. G., Blin, K., Osbourn, A. & Medema, M. H.plantiSMASH: automated identification, annotation and expression analysis ofplant biosynthetic gene clusters. Nucleic Acids Res. 45, W55–W63 (2017).
9. Töpfer, N., Fuchs, L. & Aharoni, A. The PhytoClust tool for metabolic geneclusters discovery in plant genomes. Nucleic Acids Res. 45, 7049–7063 (2017).
10. Tohge, T. & Fernie, A. R. Co-expression and co-responses: within and beyondtranscription. Front. Plant Sci. 3, 248 (2012).

94
11. Klein, A. P. & Sattely, E. S. Two cytochromes P450 catalyze S-heterocyclizationsin cabbage phytoalexin biosynthesis. Nat. Chem. Biol. 11, 837–839 (2015).
12. Klein, A. P. & Sattely, E. S. Biosynthesis of cabbage phytoalexins from indoleglucosinolate. Proc. Natl. Acad. Sci. 114, 1910–1915 (2017).
13. Tzfadia, O. et al. CoExpNetViz: Comparative Co-Expression NetworksConstruction and Visualization Tool. Front. Plant Sci. 6, 1194 (2016).
14. Ghosh, S. Triterpene structural diversification by plant cytochrome P450enzymes. Front. Plant Sci. 8, 1886 (2017).
15. Rai, A., Saito, K. & Yamazaki, M. Integrated omics analysis of specializedmetabolism in medicinal plants. Plant J. 90, 764–787 (2017).
16. Cavill, R., Jennen, D., Kleinjans, J. & Briedé, J. J. Transcriptomic andmetabolomic data integration. Brief. Bioinform. bbv090- (2015).doi:10.1093/bib/bbv090
17. Wedow, J. M. et al. Metabolite and transcript profiling of Guinea grass (Panicummaximum Jacq) response to elevated [CO2] and temperature. Metabolomics 15,51 (2019).
18. Perez de Souza, L. et al. Multi‐tissue integration of transcriptomic andspecialized metabolite profiling provides tools for assessing the common bean(Phaseolus vulgaris) metabolome. Plant J. 97, 1132–1153 (2019).
19. Urbanczyk‐Wochniak, E. et al. Parallel analysis of transcript and metabolicprofiles: a new approach in systems biology. EMBO Rep. 4, 989–993 (2003).
20. Redestig, H. & Costa, I. G. Detection and interpretation of metabolite–transcriptcoresponses using combined profiling data. Bioinformatics 27, i357–i365 (2011).
21. Duigou, T., Du Lac, M., Carbonell, P. & Faulon, J. L. Retrorules: A database ofreaction rules for engineering biology. Nucleic Acids Res. 47, D1229–D1235(2019).
22. Wang, L., Dash, S., Ng, C. Y. & Maranas, C. D. A review of computational toolsfor design and reconstruction of metabolic pathways. Synth. Syst. Biotechnol. 2,243–252 (2017).
23. Shannon, P. et al. Cytoscape: a software environment for integrated models ofbiomolecular interaction networks. Genome Res. 13, 2498–2504 (2005).
24. McKinney, W. Data Structures for Statistical Computing in Python. Proc. 9thPython Sci. Conf. 1697900, 51–56 (2010).
25. Virtanen, P. et al. SciPy 1.0--Fundamental Algorithms for Scientific Computing inPython. (2019).
26. Wisecaver, J. H. et al. A Global Coexpression Network Approach for ConnectingGenes to Specialized Metabolic Pathways in Plants. Plant Cell 29, 944–959(2017).
27. Moretti, S. et al. MetaNetX/MNXref – reconciliation of metabolites andbiochemical reactions to bring together genome-scale metabolic networks.Nucleic Acids Res. 44, D523–D526 (2016).
28. Beauxis, Y. & Genta-Jouve, G. Metwork: a web server for natural productsanticipation. Bioinformatics 1–2 (2018). doi:10.1093/bioinformatics/bty864

95
29. Alcántara, R. et al. Rhea—a manually curated resource of biochemical reactions.Nucleic Acids Res. 40, D754–D760 (2012).
30. Kanehisa, M. & Goto, S. KEGG: kyoto encyclopedia of genes and genomes.Nucleic Acids Res. 28, 27–30 (2000).
31. Alborzi, S. Z., Devignes, M.-D. & Ritchie, D. W. ECDomainMiner: discoveringhidden associations between enzyme commission numbers and Pfam domains.BMC Bioinformatics 18, 107 (2017).
32. Finn, R. D. et al. The Pfam protein families database: towards a moresustainable future. Nucleic Acids Res. 44, D279–D285 (2016).
33. Landrum, G. RDKit: Open-source cheminformatics. (2006). Available at:http://www.rdkit.org.
34. Hagberg hagberg, A. A., -Los, lanlgov, Schult, D. A. & Swart swart, P. J.Exploring Network Structure, Dynamics, and Function using NetworkX. (2008).
35. Jeon, J. E. et al. A Pathogen-Responsive Gene Cluster for Highly Modified FattyAcids in Tomato. Cell 180, 176-187.e19 (2020).
36. Thimmappa, R., Geisler, K., Louveau, T., O’Maille, P. & Osbourn, A. TriterpeneBiosynthesis in Plants. Annu. Rev. Plant Biol. 65, 225–257 (2014).
37. Smits, T. H. M., Witholt, B. & van Beilen, J. B. Functional characterization ofgenes involved in alkane oxidation by Pseudomonas aeruginosa. Antonie VanLeeuwenhoek 84, 193–200 (2003).

96
Chapter 6General Discussion
97
6.1. General remarksAs discussed in the introduction to this thesis, before the start of this PhD, by
early 2016, plant specialized metabolism research was on the verge of acomputational revolution. This brought multiple opportunities and challenges to thefield, and multiple contributions to maximize the power of novel computationalmethods to discover, characterize or predict specialized metabolic pathways andtheir associated natural products in plants were reviewed. The common threadamong the strategies discussed is the aim to increase confidence in associationsand predictions, by extracting more knowledge or information from -omics datasources. During my PhD research, I developed several strategies towards achievingthis aim.
In summary, we can classify all strategies under two main categories: single-omicand multi-omics strategies. Besides their eponymous characteristics (the usage ofone or more -omics), their main difference is that of direction: single-omic methodsreveal insight by looking inwards into the dataset to reveal new information, whilemulti-omics methods do so by looking outwards, and comparing what is learned withwhat can be learned from other data sources.
Chapter 2 provides a good example of an inward-looking strategy withplantiSMASH, mainly focusing on the analysis of genomics data. The tool, however,does provide a form of multi-omics analysis through a coexpression analysis on theinput transcriptome, as it pertains to the biosynthetic gene clusters (BGC) predictedin the input genome; and in the background, through the library of plant SM proteindomains that we curated based on many known SM pathways in literature, that inturn undoubtedly used many other -omics sources during characterization.Nevertheless, this “external knowledge” is used differently than in multi-omicsanalyses: it is used to annotate the genome and generate a set of assumptionsbased on which a prediction can be proposed. In the case of plantiSMASH,annotations of protein domains and SM biosynthesis functions constitute theassumptions made, and the predicted BGCs are the proposition. In multi-omicsanalyses, the external knowledge from another -omic source is a main part of theprediction itself, such as the association between mass signatures abundances andtranscripts expression made by MEANtools discussed in chapter 5.
plantiSMASH itself, and its framework, has the potential to be used as a toolwithin larger workflows. For example, we previously mentioned the characterizationof avenacin1, thalianol2, marneral3 and α-chaconine/solanine4 BGCs, and howcomparative genomics provided insight about their evolutionary trajectories: theauthors compared the specific BGC with the matching genomic region in otherspecies, which allowed them to gain evolutionary insights into the BGC itself. Weexploited this strategy in chapter 3 with some differences. Rather than setting aspecific BGC as our object of study like in previous research, we focused ourcomparative analyses around a more general type of genomic elements: genomicneighborhoods (GN) containing genes encoding oxidosqualene cyclases (OSC),cytochrome P450 (CYP) and acyltransferases (ACT), constrained only by theBrassicaceae genomes available at the time. This allowed us to generate insightsinto all GNs at the same time, rather than about one or two specific BGC as hadbeen done in previous research.
As we discussed before, the need for better prioritization is a common limitation

98As we discussed before, the need for better prioritization is a common limitation
across the plant SM research field. We tackled this limitation in chapter 4, where wedeveloped CADE-HEroN, a workflow to prioritize groups of genes based on acomparative transcriptomic analysis. We continued to explore gene prioritizationsolutions in chapter 5 with the integration of transcriptomic and metabolomicanalyses using an enzymatic reaction library. Both projects also benefitted frommodules aimed at facilitating untargeted analysis: CADE-HEroN through acomparative time-series gene expression analysis, and MEANtools through thepredicted reaction networks that can be browsed in multiple formats.
The idea of a future integration of these two tools is tantalizing: predictedmetabolic pathways involving genes with expression patterns conserved acrossspecies would be great candidates for experimental validation. Moreover, all of thecomputational tools and pipelines we developed throughout this thesis couldpotentially be integrated within one single workflow; in this way, we could maximallyuse the guilt-by-association principle and provide SM pathway predictions based onobservations that come from the genomes, transcriptomes, metabolomes andphylogenetic relationships of multiple species. While this would be a seemingly largeendeavor to undertake for the discovery of one or two pathways, a genericcomputational tool could eventually be developed for a comprehensive automatedanalysis across many plant species at the same time.
6.2. Where plants meet microorganismsWe have previously discussed how plant SM research and NP discovery has
learned from the neighboring bacteria and fungi kingdoms: BGC discovery andcharacterization was the dominant guide in NP discovery in microorganisms before itgained popularity within the plant kingdom. In chapter 2 we introducedplantiSMASH, a computational tool for BGC discovery in plants, based onantiSMASH which has successfully aided in the characterization of thousands ofBGCs in microorganisms to date5,6. Throughout this thesis, we have discussed howusing BGCs and BGC-like structures has resulted in several NP discoveries andcontributed immensely to understanding plant specialized metabolism. Whether theso-called “gene cluster revolution”7 crosses the border to neighboring kingdoms ornot, it is safe to conclude that studying BGCs will be a mainstay of plant SMresearch and NP discovery going forward.
This, however, begs one logical question, what else can plant researchers learnfrom those working on microorganisms?
The BiG-SCAPE/CORASON framework8 is a good example: after identifyingBGCs through antiSMASH, BiG-SCAPE generates a similarity network amongpredicted BGCs and those in a database of BGCs. This similarity network is used togroup BGCs into gene cluster families (GCFs), which are then queried byCORASON with a multi-locus phylogenetic analysis to reveal their evolutionaryrelationships. The authors demonstrated the usefulness of this strategy to guide NPdiscovery by mining 3,080 actinobacterial genomes, which led to the discovery ofseven new detoxins8.
A tool like plantiSMASH could in the future be integrated with a phylogeneticanalysis similar to the one we developed in chapter 3 and with the BiG-SCAPE/CORASON framework that has demonstrably successful results with

99SCAPE/CORASON framework that has demonstrably successful results with
microbial BGCs. This would result in a larger comprehensive multi-omics pipeline.For example, a user could input a few closely related genomes of their choice, alongwith a tree describing their phylogenetic relatedness; the tool would predict BGCsand GNs in all genomes, and then perform a multiple sequence analysis of thescaffold-generating enzymes identified in all clusters and an automated analysis withthe BiG-SCAPE/CORASON framework. Our previous analysis suggests that, unlikein microorganisms, the subsequent GCFs would tend to group BGCs and GNs thatmay have evolved independently, which requires the inclusion of phylogeneticanalyses per gene family, customized for plants. The framework we developed inchapter 3 would be key for this: the new computational tool would need todifferentiate well between protein subfamilies, generate ancestral statereconstructions of the GCFs and integrate the phylogenetic tree of the genomes intothe analysis. The user would then receive information on the predicted BGCs andGNs, accompanied by their predicted evolutionary relationships. This would in turnallow the user to make better decisions regarding experimental validation.
Another advance in microbial NP discovery that has yet to be adapted to plants isthe capacity to predict chemical structures directly from genome sequences. Thesubstrate specificity of NRPS adenylation domains and PKS acyltransferasedomains can be analyzed by a range of tools and algorithms, such as antiSMASH,to predict the chemical structures of the metabolites associated with a set ofmetabolic genes9. No similar strategy has been developed yet for plant genomes,and some obstacles as to why are readily apparent: even when focusing on aspecific family of metabolites, like triterpenes, some tailoring enzymes likecytochrome P450s have a diverse range of catalytic activities and regioselectivities,some of them being species-specific10. While more research focused oncharacterizing and categorizing the functions of plant enzymes will be key to developa similar predictive strategy in plants, a good start would lie in computationally miningthe vast amount of existing literature on the subject. Some of the work we presentedin chapter 5 provides a foundation for this: MEANtools mines the RetroRulesdatabase to associate enzymatic domains to specific molecular substructures.MEANtools cannot provide a metabolic structure prediction de novo (and uses thetranscriptome and metabolome in addition to the genome), but very often theprecursors of SM pathways are metabolites from primary metabolism11; therefore,targeting a library of known metabolites in the primary metabolism of the speciesbeing queried with MEANtools could provide good set of predicted NPs. Moreover,the continuing development of databases annotating and associating metabolicenzymes, and reactions, like RetroRules12, and tools using these databases, willhave a great positive impact. Altogether, chemical structure prediction based onplant SM pathway discovery is not entirely out of reach.
6.3. Pathway prediction and retrosynthetic analysis: twosides of the same coin
In chapter 5 we introduced RetroRules, a database of enzymatic reactions formetabolic engineering and retrosynthesis workflows12. This database was primarilydesigned to aid in retrosynthetic analysis, a kind of analysis that is more closelyassociated with the synthetic route design and drug discovery fields than plant SMresearch. This strategy aims at identifying the reaction mechanisms towards a target

100research. This strategy aims at identifying the reaction mechanisms towards a target
molecule, which in essence is the same as metabolic pathway discovery, but with adifferent set of constraints due to their in vivo or in vitro nature. The main difference,however, lies in the direction in which the information is processed: retrosyntheticanalysis is a top-down approach where pathway prediction is bottom-up.
We can picture a reaction pathway as a pyramid. At the top of the pyramid reststhe final metabolite of the reaction: a NP of interest or a synthetic drug for which weintend to discover the reaction mechanisms towards their production. The bricks inthe pyramid constitute the myriad of mechanisms that permit the synthesis of thefinal metabolite, including the main reactions in the pathway, the production ofnecessary cofactors and catalysts, and the conditions leading to them.
Retrosynthetic analysis explores this pyramid from the top down: it aims atidentifying the reaction mechanism of a target molecule by converting the chemicalstructure into simpler structures, and then further simplifying those and repeating theprocess until molecules that can be made by known reaction mechanisms arereached. Researchers start from the top of the pyramid (the final metabolite of thepathway) and lay bricks below it until they design an architecture that they arecomfortable with. This is distinct from most strategies in SM and NP discovery, whichmore generally follow a bottom-up approach: individual analyses and observationsare integrated piece by piece until a prediction about the system can be confidentlyreached, such as generating insights about the SM system or the prediction of apathway; by laying bricks one a time, they may be laid on top of each other too, inthe same manner as new analyses rely on the knowledge from previous ones toreach an adequate interpretation. This strategy is well exemplified in the previouslydiscussed studies that led to the characterization of the biosynthetic pathways forpodophyllotoxin in mayapple13, 4-hydroxyindole-3-carbonyl nitrile (4-OH-ICN) inArabidopsis thaliana14 and noscapine in opium poppy15 in which observations fromtranscriptomic experiments were used to appropriately design metabolomicexperiments that the authors could use to “map the pyramid” of the metabolicpathways.
In reality, researchers often have a final or intermediate metabolite, class ofmetabolites, or a genomic feature of interest in hand when designing and interpretingtheir -omics experiments and analyses. This makes the de facto strategies more akinto a middle-out approach: exploring the pyramid with a mix of bottom-up and top-down approaches.
This is an advantageous aspect in SM research: knowledge of at least themetabolite class of a NP can give important information regarding its structuralcharacteristics, which in turn provides information about certain enzymes required fortheir biosynthesis, a “guide” to explore the pyramid. A common example of this isquerying for scaffold-generating enzymes when targeting a specific class ofmetabolites, but some information about tailoring enzymes involved in a pathway canalso be deduced: Jeon et al. used characteristics of the fatty acid backbone offalcarindiol to guide the identification of the fatty acid desaturases involved in thepathway16. Another genomic feature that can serve as the pyramid’s guide areBGCs: the characterization of the α-chaconine/solanine BGC in potato was guidedby the characteristics of the α-tomatine BGC in tomato4.
In chapter 5 we presented MEANtools, which leveraged the RetroRulesdatabase for retrosynthetic analysis to generate testable hypotheses aboutbiosynthetic pathways and facilitating plant SM research and NP discovery. We

101biosynthetic pathways and facilitating plant SM research and NP discovery. We
developed a cheminformatic framework based on the generic reaction databasesthat RetroRules consolidates to predict the reactions involved in plant metabolicpathways. The integration of this database is based on the assumption thatknowledge and tools from the synthetic route design/drug discovery fields can betransferred successfully to the field of plant biology (and vice versa), which has thepotential of benefitting both. MEANtools shows us how this integration can benefitplant biology by using reaction rules derived from characterized enzymes across thetree of life to predict possible metabolic pathways in plants, and as researchersdiscover and characterize new metabolic pathways, retrosynthetic databases likeRetroRules can grow, in turn benefiting the synthetic route design/drug discoveryfields.
Another example of a set of retrosynthetic analysis tools with potential to guideplant metabolic pathway discovery are molecular similarity algorithms. Thesealgorithms are used to query novel molecules in large small-molecule databases toidentify similar bioactive molecules with properties that may be shared by themolecule of interest. This method is called virtual screening, and has been usedsuccessfully for a long time in drug discovery17. There exists an overlap between thismethod and metabolic pathway discovery. The metabolites within a metabolicpathway often constitute a group of metabolites with high degree of molecularsimilarity; a method able to identify similar molecules could potentially identifymetabolites within the same pathway. This idea has been explored in the past: KCF-S is a method to describe and compare molecules, which has been designed withthe specific purpose of identifying pairs of metabolites that can possibly be convertedinto each other through an enzymatic reaction18. The authors demonstrated thisstrategy by querying a database of molecules, and their algorithm groupedmolecules that were less structurally diverse than clusters generated by other tools,with many metabolite pairs being one enzymatic reaction away from each other18;recently, they released their method as a Python package19. Above, we discussedhow in silico prediction of de novo metabolic structures awaits in the future of plantSM research, and molecular similarity algorithms could be key to link de novostructure predictions with known precursors from a metabolite database. Integratingthese methods with a cheminformatic framework capable of predicting reactionpathways and associated substrates based on molecular substructures (such as theone we developed for MEANtools in chapter 5) will effectively create a fully top-down pathway discovery strategy within the plant SM and NP discovery fields.
6.4. A cornucopia of data, methods, and tools: Sophie’schoice?
Chief among the contributions of computational genomics to plants NP discoveryand SM research is the myriad of distinct tools and methods that researchers cantake advantage of for any -omics dataset. In this thesis we discussed a few of thesemethods to guide metabolic pathway discovery: genome sequences can be queriedfor BGCs20,21 and/or compared with other sequences and BGCs2–4; transcriptomescan be used to identify coexpressed genes13,14,22,23, or to generate coexpressionnetworks and identify coexpressed modules24–26, all of which can be compared withother transcriptomes4,27,28; also, metabolomes can be analyzed along with thepreviously mentioned workflows either sequentially13–15 or in an integrated manner29–

102previously mentioned workflows either sequentially13–15 or in an integrated manner29–
31 to generate and validate hypotheses.Moreover, computational genomics has facilitated the usage of previously
acquired knowledge: the continuously growing databases of genomes,transcriptomes, metabolomes, characterized pathways, enzymatic reactions andBGCs that can be used to reinforce observations in -omics analyses performed innewer data. While new “wet lab” -omics experiments are always needed to acquirenew knowledge, uncovering how it is related to previously acquired knowledge inliterature is a powerful strategy to produce discoveries with higher confidence thanotherwise. This is evidenced in the main chapters of this thesis: a connecting threadof this research has been the development of methods that integrate publiclyavailable resources for the analyses.
When using any particular -omics dataset to elucidate a metabolic pathway or toidentify a natural product, it is undeniably cheaper to run many computationalanalyses, or compare the dataset to literature, than it is to run more “wet lab”experiments. This generates interest in running as many computational analyses aspossible, but in a world where time and other extra-scientific limitations are at play,the large number of tools, methods, datasets and databases in literature can be aproblem for researchers: it can be taxing to select the appropriate set of analysesand tools for a specific research project. While many authors will say their tool,method or workflow is the best available for what they do, as supported by a varietyof qualifications or metrics, the truth may lie in the opposite end: instead of selectingthe best set of analyses and tools for the job, a researcher could default to runningall analyses that are possible and that can contribute to elucidating a targetedobjective.
First, this would demand a unified repository of tools and methods with propercategorization and documentation. Something similar exists in Galaxy, a web-basedscientific biomedical analysis platform for genomic, proteomic and metabolomicanalyses, bringing together >5,500 tools32. A similar platform for NP discovery couldhost or package the computational tools mentioned in this thesis and more, alongwith a user-friendly GUI and documentation to allow easier access to bioinformatictools to plant biologists. Developing this platform would certainly be a largeundertaking, but extensive literature already covers the advantages, disadvantages,and best way of using many of these methods and tools26,31,33,34. Furthermore, themajority of plant NP discovery computational tools have similar or interchangeablefile formats; for example, the majority of transcriptomic analyses discussed in thisthesis start with counts or F/RPKM values as input, and all methods we discussedinvolving protein prediction do so through the PFAM library35 or EC numbers, twoannotation types (sequence/structure and function) that were recently shown to behighly associated36.
It may be possible that some analyses and tools will not contribute towards theobjective a researcher has set, or the data they have available. For example, a BGCprediction analysis may not have much to offer when using a low-quality genomeassembly with short contigs, or when targeting an un-clustered pathway, anddifferential expression analyses are not well suited to identify meaningful patterns inpairs of transcriptome samples that have the majority of genes differentiallyexpressed. In other words, a simple database or repository of tools would not entirelysolve the problem of how to select the appropriate set of analyses and tools,although it would make it easier. To properly solve this problem, a big characteristic

103although it would make it easier. To properly solve this problem, a big characteristic
of any prospective unified repository of plants NP discovery tools would require agood degree of automation; the database could effectively make this selectionprocess happen in silico instead.
Many automated tools discussed, and developed, through this thesisdemonstrate a part of how such platform could be automated: plantiSMASH andMEANtools integrate different automated analyses according to the input (and theirformats) and allow advanced users to further customize parameters of specific stepsor how the output is formatted. A unified repository of tools could work similarly,starting with a preliminary format and quality control analysis of the inputs todetermine the best set of tools according to predetermined rulesets or recipes.Moreover, as more users use the database, they could save and make public theirrecipes/rulesets for other researchers to use. For the less advanced users, this couldbe presented to the user as suggestions or pre-checked defaults. Altogether, thiscould result in a platform in which biologists input their raw multi-omics data, select aset of analyses and their specified parameters and/or targets, click run, and receivewithin a day a large number of high-confidence predictions ready for humaninterpretation.
An example of a platform that aims to provide such a unified repositoryframework can be found in KBase, a knowledgebase that consolidates a number oftools to analyze -omics data and predict biological functions 37. This knowledgebasenot only solves the problem of discoverability, accessibility and utilization of manytools, but also integrates data from genome, metabolite and reaction databases,facilitating their selection process too. Moreover, KBase bolsters a user-friendly GUI,making the process more straightforward for biologists with less expertise inbioinformatic analyses. This could be a good foundation whence a plant NPdiscovery equivalent could be constructed; although KBase focuses mainly onmicrobial genome analysis, it does include plant genomes in its knowledgebase too.Furthermore, many of the tools developed through this PhD, and discussed aspossible follow-ups within this thesis, provide a good initial set of tools to be addedand integrated into recipes and rulesets uniquely aimed at plant genomes.
The development of this platform would be a large undertaking, but it would bringunmeasurable benefits to the field: it would make the plethora of existingbioinformatic tools, methods and databases more easily discoverable and accessibleto researchers, especially if framed within a user-friendly interface. As we havediscussed above, the computational aspect of the plants NP discovery and SMresearch fields is still rather young, making this a good moment to start thedevelopment of this kind of unified platform. As the impact of computationalgenomics in the field continues to grow, the number of tools, methods and databaseswill multiply: not only will this make the development of such platform harder, but bythen a one-stop-platform for all NP discovery needs might become a necessity ratherthan a boon.
6.5. Closing remarksIt is undeniable that computational genomics has provided a cornucopia of
opportunities for SM plant research in the shape of computational tools andmethods, each of them with their own set of challenges and limitations. Moreimportantly, each new method and tool has brought new promises too, of the myriadof new ideas and integrated methods that could be implemented in the future; each
104of new ideas and integrated methods that could be implemented in the future; eachgeneration increasing the speed at which advancements are made. With this thesis Icontributed to this process. The plant SM research field is richer today than it wasfour years ago, and it will likely be exponentially richer four years from now.
References
1. Qi, X. et al. A gene cluster for secondary metabolism in oat: implications for theevolution of metabolic diversity in plants. Proc. Natl. Acad. Sci. U. S. A. 101,8233–8 (2004).
2. Field, B. & Osbourn, A. E. Metabolic Diversification--Independent Assembly ofOperon-Like Gene Clusters in Different Plants. Science (80-. ). 320, 543–547(2008).
3. Field, B. et al. Formation of plant metabolic gene clusters within dynamicchromosomal regions. Proc. Natl. Acad. Sci. U. S. A. 108, 16116–21 (2011).
4. Itkin, M. et al. Biosynthesis of antinutritional alkaloids in solanaceous crops ismediated by clustered genes. Science 341, 175–9 (2013).
5. Blin, K. et al. antiSMASH 5.0: updates to the secondary metabolite genomemining pipeline. Nucleic Acids Res. 47, W81–W87 (2019).
6. Kautsar, S. A. et al. MIBiG 2.0: a repository for biosynthetic gene clusters ofknown function. Nucleic Acids Res. 48, (2019).
7. Jensen, P. R. Natural Products and the Gene Cluster Revolution. Trends inMicrobiology 24, 968–977 (2016).
8. Navarro-Muñoz, J. C. et al. A computational framework to explore large-scalebiosynthetic diversity. Nat. Chem. Biol. 16, 60–68 (2020).
9. Medema, M. H. & Fischbach, M. A. Computational approaches to natural productdiscovery. Nat. Chem. Biol. 11, 639–648 (2015).
10. Ghosh, S. Triterpene structural diversification by plant cytochrome P450enzymes. Front. Plant Sci. 8, 1886 (2017).
11. Hartmann, T. From waste products to ecochemicals: Fifty years research of plantsecondary metabolism. Phytochemistry 68, 2831–2846 (2007).
12. Duigou, T., Du Lac, M., Carbonell, P. & Faulon, J. L. Retrorules: A database ofreaction rules for engineering biology. Nucleic Acids Res. 47, D1229–D1235(2019).
13. Lau, W. & Sattely, E. S. Six enzymes from mayapple that complete thebiosynthetic pathway to the etoposide aglycone. Science 349, 1224–8 (2015).
14. Rajniak, J., Barco, B., Clay, N. K. & Sattely, E. S. A new cyanogenic metabolitein Arabidopsis required for inducible pathogen defence. Nature 525, 376–379(2015).
15. Chen, X. & Facchini, P. J. Short-chain dehydrogenase/reductase catalyzing thefinal step of noscapine biosynthesis is localized to laticifers in opium poppy. PlantJ. 77, 173–184 (2014).

105
16. Jeon, J. E. et al. A Pathogen-Responsive Gene Cluster for Highly Modified FattyAcids in Tomato. Cell 180, 176-187.e19 (2020).
17. Cereto-Massagué, A. et al. Molecular fingerprint similarity search in virtualscreening. Methods 71, 58–63 (2015).
18. Kotera, M. et al. KCF-S: KEGG Chemical Function and Substructure forimproved interpretability and prediction in chemical bioinformatics. BMC Syst.Biol. 7 Suppl 6, S2 (2013).
19. Sato, M., Suetake, H., Kotera, M. & Sato, M. KCF-Convoy: efficient Pythonpackage to convert KEGG Chemical Function and Substructure fingerprints.bioRxiv (2018). doi:10.1101/452383
20. Schläpfer, P. et al. Genome-Wide Prediction of Metabolic Enzymes, Pathways,and Gene Clusters in Plants. Plant Physiol. 173, 2041–2059 (2017).
21. Töpfer, N., Fuchs, L. & Aharoni, A. The PhytoClust tool for metabolic geneclusters discovery in plant genomes. Nucleic Acids Res. 45, 7049–7063 (2017).
22. Horan, K. et al. Annotating genes of known and unknown function by large-scalecoexpression analysis. Plant Physiol. 147, 41–57 (2008).
23. Sohrabi, R. et al. In Planta Variation of Volatile Biosynthesis: An AlternativeBiosynthetic Route to the Formation of the Pathogen-Induced VolatileHomoterpene DMNT via Triterpene Degradation in Arabidopsis Roots. Plant Cell27, 874–890 (2015).
24. Mao, L., Van Hemert, J. L., Dash, S. & Dickerson, J. A. Arabidopsis gene co-expression network and its functional modules. BMC Bioinformatics 10, 346(2009).
25. Wisecaver, J. H. et al. A Global Coexpression Network Approach for ConnectingGenes to Specialized Metabolic Pathways in Plants. Plant Cell 29, 944–959(2017).
26. Saelens, W., Cannoodt, R. & Saeys, Y. A comprehensive evaluation of moduledetection methods for gene expression data. Nat. Commun. 9, 1090 (2018).
27. Tzfadia, O. et al. CoExpNetViz: Comparative Co-Expression NetworksConstruction and Visualization Tool. Front. Plant Sci. 6, 1194 (2016).
28. Netotea, S., Sundell, D., Street, N. R. & Hvidsten, T. R. ComPlEx: Conservationand divergence of co-expression networks in A. thaliana, Populus and O. sativa.BMC Genomics 15, 1–17 (2014).
29. Urbanczyk‐Wochniak, E. et al. Parallel analysis of transcript and metabolicprofiles: a new approach in systems biology. EMBO Rep. 4, 989–993 (2003).
30. Rischer, H. et al. Gene-to-metabolite networks for terpenoid indole alkaloidbiosynthesis in Catharanthus roseus cells. Proc. Natl. Acad. Sci. 103, 5614–5619(2006).
31. Cavill, R., Jennen, D., Kleinjans, J. & Briedé, J. J. Transcriptomic andmetabolomic data integration. Brief. Bioinform. bbv090- (2015).doi:10.1093/bib/bbv090
32. Afgan, E. et al. The Galaxy platform for accessible, reproducible andcollaborative biomedical analyses: 2018 update. Nucleic Acids Res. 46, W537–W544 (2018).

10633. Serin, E. A. R., Nijveen, H., Hilhorst, H. W. M. & Ligterink, W. Learning from Co-
expression Networks: Possibilities and Challenges. Front. Plant Sci. 7, 444(2016).
34. Li, Y., Pearl, S. A. & Jackson, S. A. Gene Networks in Plant Biology: Approachesin Reconstruction and Analysis. Trends Plant Sci. 20, 664–675 (2015).
35. Finn, R. D. et al. The Pfam protein families database: towards a moresustainable future. Nucleic Acids Res. 44, D279–D285 (2016).
36. Alborzi, S. Z., Devignes, M.-D. & Ritchie, D. W. ECDomainMiner: discoveringhidden associations between enzyme commission numbers and Pfam domains.BMC Bioinformatics 18, 107 (2017).
37. Arkin, A. P. et al. KBase: The United States Department of Energy SystemsBiology Knowledgebase. Nat. Biotechnol. 36, 566–569 (2018).

107
SummaryThe field of plant natural product (NP) discovery has changed substantially since
the isolation of morphine from opium poppy in 1806. The largest of these changescame in the last decade with the integration of computational genomics into the field,which resulted in the development of a plethora of computational methods that aid inthe discovery of new plant NPs and the biosynthetic pathways, metabolites andenzymes associated with them. As more computational methods continue to bedeveloped, and more plant genomes are sequenced, the NP discovery field is ripewith obstacles and opportunities uniquely suited to multi-omics solutions.
In chapter 1, we explore the history of the plant NP discovery field and highlightsome of the strategies used throughout. We also discuss the state of the field andsome of the obstacles and opportunities that computational genomics introduced,mainly regarding the identification of plant biosynthetic gene clusters (BGCs),analysis of coexpression networks and multi-omics integration.
In chapter 2, we present a computational tool for the automated identification,annotation and expression analysis of plant BGCs: plantiSMASH. Here, we showhow BGC identification can guide plant NP discovery by mining all publicly availablechromosome-level plant genome assemblies and recovering all BGCsexperimentally characterized at the time, along with a wide range of putative novelones. Furthermore, we develop a coexpression analysis module, which facilitates theintegration of a transcriptomic analysis to any predicted BGC. In chapter 3, weleverage BGCs and BGC-like genomic structures to study the evolution of triterpenebiosynthetic pathways in plants. Here, we queried 13 Brassicaceae plant genomes toidentify all oxidosqualene cyclases (OSC), and the genomic regions flanking them.We use these regions to perform a series of phylogenetic analyses to compare theevolution of biosynthetic genes with that of the associated Brassicaceae species anduncover the most likely evolutionary events that led to the assembly anddiversification of Brassicaceae triterpene BGCs. In chapter 4, we introduce CADE-HEroN: a workflow for comparative analysis of the coexpression networks of multiplespecies to guide the discovery of plant specialized metabolic (SM) pathways. Weuse this workflow to study the SM pathways associated with the phosphatestarvation response in Arabidopsis thaliana, tomato and rice. This resulted in theidentification of many genes of known and unknown function that have a conservedbehavior under phosphate starvation across the three species. In chapter 5, wedescribe the development of an integrative multi-omics approach for plant SMpathway prediction: MEANtools. This computational tool integrates data from pairedtranscriptomic-metabolomic datasets to predict potential metabolic pathways, andthe reactions, metabolites and genes involved in them. In this manner, MEANtoolscan help scientists generate testable hypotheses about biosynthetic pathways, whichwe showcase by using our pipeline with a recently published paired transcriptomic-metabolomic dataset.
We conclude this thesis in chapter 6, discussing how the plant NP discovery andSM research fields have benefitted from cross-pollination with adjacent fields, andhow to better take advantage of this and the many other opportunities discussedthroughout the thesis.

108
EnvoiFirstly, thank you for reading these words; it is not always a delight to write, but it
is always to be read.The work of this thesis is only the result of a collaboration of many people, and
many are cited throughout this text, but some are deserving of furtheracknowledgments. None of this could have been possible without Marnix Medemaand Dick de Ridder who gave me the opportunity to take on this journey, for which Icannot thank you enough. Later as supervisors, your guidance was crucial and yoursupport abundant; all successes I could claim from this research, are thanks to youboth.
Thanks to everyone in the WUR Bioinformatics lab too, you are all too many tolist, but you were all very helpful and enjoyable to be around.
I would like to thank too Harro Bouwmeester and Eric Schranz, with whom I hadvery enjoyable collaborative research experiences in Wageningen, and AnneOsbourn and Elizabeth Sattely, who provided me with very memorable researchopportunities away from Wageningen.
Lastly, thanks to my friends and family, without whom sanity would have run outlong ago.
Hunt dragons, slay beasts, sleep when you are dead.-H

109
The research described in this thesis was financially supported by NWO.
Cover design by Hernando SuarezPrinted by Proefschriften, Ede.