PROPID User Manual
85
PROPID User Manual Version 5.3.1 Aerodynamic Design Software for Horizontal Axis Wind Turbines Michael S. Selig, et al. UIUC Applied Aerodynamics Group Department of Aerospace Engineering University of Illinois at Urbana-Champaign, Urbana, IL 61801 Last updated January 6, 2012 Copyright c 1993–2011, Michael S. Selig All rights reserved 1
Transcript of PROPID User Manual

PROPID User ManualVersion 5.3.1
Aerodynamic Design Software for Horizontal Axis Wind Turbines
Michael S. Selig, et al.
UIUC Applied Aerodynamics GroupDepartment of Aerospace Engineering
University of Illinois at Urbana-Champaign, Urbana, IL 61801
Last updated January 6, 2012
Copyright c©1993–2011, Michael S. Selig
All rights reserved
1

Contents
1 Overview 4
2 Reading this User Manual 5
3 Required Data for Design and Analysis Modes 63.1 Basic Setup Parameters . . . . . . . . . . . . . . . . . . . . . . . . . . . . . 63.2 Blade Geometry . . . . . . . . . . . . . . . . . . . . . . . . . . . . . . . . . . 73.3 Blade Airfoil Data . . . . . . . . . . . . . . . . . . . . . . . . . . . . . . . . 8
4 Design Points for Design and Analysis Modes 12
5 Analysis Mode 12
6 Input File 14
7 Output Files 177.1 2D SWEEP . . . . . . . . . . . . . . . . . . . . . . . . . . . . . . . . . . . . 18
7.1.1 Available Output . . . . . . . . . . . . . . . . . . . . . . . . . . . . . 187.1.2 File Format . . . . . . . . . . . . . . . . . . . . . . . . . . . . . . . . 18
7.2 1D SWEEP . . . . . . . . . . . . . . . . . . . . . . . . . . . . . . . . . . . . 207.2.1 Available Output . . . . . . . . . . . . . . . . . . . . . . . . . . . . . 207.2.2 File Format . . . . . . . . . . . . . . . . . . . . . . . . . . . . . . . . 21
7.3 Reporting Lines . . . . . . . . . . . . . . . . . . . . . . . . . . . . . . . . . . 227.4 Additional Output Files . . . . . . . . . . . . . . . . . . . . . . . . . . . . . 27
7.4.1 Airfoil blending values . . . . . . . . . . . . . . . . . . . . . . . . . . 277.4.2 ftn011.dat . . . . . . . . . . . . . . . . . . . . . . . . . . . . . . . . 277.4.3 ftn021.dat/ftn022.dat . . . . . . . . . . . . . . . . . . . . . . . . . 277.4.4 GAEP data . . . . . . . . . . . . . . . . . . . . . . . . . . . . . . . . 277.4.5 Cl, Cd, and α data out of the code . . . . . . . . . . . . . . . . . . . 28
8 Design Mode 288.1 NEWT1 Lines . . . . . . . . . . . . . . . . . . . . . . . . . . . . . . . . . . . 288.2 NEWT2 Lines . . . . . . . . . . . . . . . . . . . . . . . . . . . . . . . . . . . 348.3 General Tips . . . . . . . . . . . . . . . . . . . . . . . . . . . . . . . . . . . 41
9 Additional Input Lines 42ATOL Line . . . . . . . . . . . . . . . . . . . . . . . . . . . . . . . . . . . . . . . 42BE DATA Line . . . . . . . . . . . . . . . . . . . . . . . . . . . . . . . . . . . . . 43BEEP Line . . . . . . . . . . . . . . . . . . . . . . . . . . . . . . . . . . . . . . . 43BUMPCL, BUMPCD, and BUMPALPHA Lines . . . . . . . . . . . . . . . . . . . 43CDFAC Line . . . . . . . . . . . . . . . . . . . . . . . . . . . . . . . . . . . . . . 44CHORD BASE Line . . . . . . . . . . . . . . . . . . . . . . . . . . . . . . . . . . 44CLLOSS Line . . . . . . . . . . . . . . . . . . . . . . . . . . . . . . . . . . . . . . 44DRY Line . . . . . . . . . . . . . . . . . . . . . . . . . . . . . . . . . . . . . . . . 45
2

ECHO INPUT Line . . . . . . . . . . . . . . . . . . . . . . . . . . . . . . . . . . 45FIXPD Line . . . . . . . . . . . . . . . . . . . . . . . . . . . . . . . . . . . . . . . 45GAEP Line . . . . . . . . . . . . . . . . . . . . . . . . . . . . . . . . . . . . . . . 46HURRICANE Lines . . . . . . . . . . . . . . . . . . . . . . . . . . . . . . . . . . 46ITERMAX Line . . . . . . . . . . . . . . . . . . . . . . . . . . . . . . . . . . . . . 47ITERPROP Line . . . . . . . . . . . . . . . . . . . . . . . . . . . . . . . . . . . . 47LCOL45 Line . . . . . . . . . . . . . . . . . . . . . . . . . . . . . . . . . . . . . . 47PAUSE Line . . . . . . . . . . . . . . . . . . . . . . . . . . . . . . . . . . . . . . . 47PRINT INPUT Line . . . . . . . . . . . . . . . . . . . . . . . . . . . . . . . . . . 48RKR GAMMA Line . . . . . . . . . . . . . . . . . . . . . . . . . . . . . . . . . . 48RNEWT Line . . . . . . . . . . . . . . . . . . . . . . . . . . . . . . . . . . . . . . 48RPRINT Line . . . . . . . . . . . . . . . . . . . . . . . . . . . . . . . . . . . . . . 49SKIP UNKNOWN WORDS Line . . . . . . . . . . . . . . . . . . . . . . . . . . . 49SUMMARY INFO Line . . . . . . . . . . . . . . . . . . . . . . . . . . . . . . . . 49TIPSPEED Line . . . . . . . . . . . . . . . . . . . . . . . . . . . . . . . . . . . . 49VS MODE Line . . . . . . . . . . . . . . . . . . . . . . . . . . . . . . . . . . . . . 49WT NAME Line . . . . . . . . . . . . . . . . . . . . . . . . . . . . . . . . . . . . 50ZERO TWIST Line . . . . . . . . . . . . . . . . . . . . . . . . . . . . . . . . . . 50
10 Annotated Examples 5010.1 Stall Regulated . . . . . . . . . . . . . . . . . . . . . . . . . . . . . . . . . . 5110.2 Variable Speed . . . . . . . . . . . . . . . . . . . . . . . . . . . . . . . . . . 58
References 72
NO WARRANTY 73
Appendix A: Stall Angle, Stall Delay Angle, and Related Angles 73
Appendix B: Warnings and Errors 77
Index 83
3

1 Overview
PROPID is a computer program for the design and analysis of horizontal axis wind tur-bines [1]. The unique strength of the current design method is its inverse design capability.For instance, the current method allows the designer to specify directly the peak powerfor a stall-regulated rotor. The iterative inverse solver is then used to adjust one of theuser selected inputs so that the desired peak rotor power is achieved. More generally, themethod permits the designer to specify several performance characteristics as long as anequal number of input parameters are allowed to be automatically adjusted by the iterativeinverse method. The approach is based on similar inverse design methodology for airfoilsand cascades [2, 3].
PROPID not only allows for the specification of single variables, like peak power, butalso distributions, like the blade lift distribution and/or axial interference factor distribution.Such distributions are achievable as long as another distribution is left to be determined,that being specifically the blade twist and/or chord distributions.
The method also has multipoint design capabilities. For example, the blade lift coefficientdistribution can be prescribed for one condition while simultaneously the axial inductionfactor distribution can be prescribed for a different condition. In addition, the designer cansimultaneously specify the peak rotor power constraint, which may correspond to yet anothercondition.
The PROPSH blade-element/momentum code [4], which itself is a modified versionof the PROP code [5], is used for analysis in the current version of PROPID. Desirablefeatures of the code are that it allows for rapid analysis, accommodates different airfoildata for each blade element, and includes a 3-D post-stall airfoil performance synthesizationmethod for better peak power prediction at high wind speed.
In what follows, Chapter 2 discusses typographical conventions used in this manual andalso the input file structure. The input file is read automatically upon program executionand is assigned in the file propid.in, which is included in the runs directory of the archive.Chapter 3 presents several parameters required for a PROPID design or analysis run. Inputfor the wind turbine operating conditions is presented in Chapter 4. Once the operatingconditions are specified as well as the various input parameters (some of which may changethrough iteration), an analysis of the rotor can be performed as discussed in Chapter 5.Several example input files are included in the runs directory of the archive. This manualdiscusses an example input file loosely modeled on the AOC 15/50 stall-regulated windturbine. It is presented in Chapter 6. Chapter 7 discusses how output files (e.g., power curve,blade chord distribution, etc.) are generated. The design mode is discussed in Chapter 8 andmany additional input lines are briefly discussed in Chapter 9. In Chapter 10 an annotatedinput file is presented.
All attempts are made to ensure that old PROPID files will run with newer versions ofthe code. More on PROPID can be found on the UIUC Applied Aerodynamics Group webpage (http://www.ae.illinois.edu/m-selig/).
4

2 Reading this User Manual
PROPID is a keyword-based code. The input file (see Chapter 6) is a script-type file thatcontains a journal of commands for either batch mode execution or interactive use. Threebasic data-line types are used in the input file as follows.
Example lines:
MODE 1
! This line is commented out and will be ignored.
# This line is also commented out.
*
The line MODE 1 is a line type that prompts action, either that of storing data for futurecalculations or initiating either design or analysis calculations. Lines that do not start inthe first column are ignored. If a keyword is not recognized, then the line will be echoed tothe screen, and user will be given the option of proceeding or stopping. Note that the valuesfollowing the line are read in unformatted mode; however, values beyond column 82 will notbe read.
The ! or # character in the first column denotes that the line is to be ignored. Mostdata lines can have trailing comments like this example below.
Example:
LTIP 1 # use Prandtl tip loss model
Lines that cannot have trailing comments are those with optional data on the line as discussedlater.
The * character in the last line is the stop line, which denotes the end of the input andstops execution. Anything following the stop line is ignored.
In the following descriptions of the lines, this format will be used:
MODE [MODE]
The string [MODE] denotes that the value following the line name will be set to the programvariable MODE. For instance, a 1 for [MODE] indicates that MODE = 1. In some cases, all ofthe values on a line will not be used in which case 999 will be used as a dummy value. Dots“...” indicate that there are one or several intervening lines. A | character that separates astring of input parameters (e.g., [P1] [P2] | [P3]) means that the values past the | neednot be entered if the defaults are acceptable. The actual input file does not contain the |
character. As previously mentioned, lines with optional data cannot have trailing comments.Arrays and elements of arrays are denoted, for example, by CH(.) and CH(1) or CH(JSEG),respectively. JSEG is used to denote the jth element of the blade. ISEG is the total numberof blade elements. Finally, a - character in this user manual denotes the continuation of aninput line. The -, however, is not used in the actual input data file.
Some rules apply to the sequence of lines. First, required input data (Chapter 3) mustprecede lines that initiate design and analysis. These lines can be in any order. Second,some lines initiate the input of a sequence of data (e.g., the AIRFOIL MODE line, Section 3.3).Comments are sometimes used in this manual to indicate the beginning and ending of asequence of data.
5

3 Required Data for Design and Analysis Modes
The following lines are used to input data that is required for design and analysis. Onlybrief descriptions are given since further details can be found in Ref. [6], which is includedin the PROPID distribution archive.
3.1 Basic Setup Parameters
The following lines are used to set single parameters and options.
MODE [MODE]
INCV [INCV]
LTIP [LTIP]
LHUB [LHUB]
IBR [IBR]
SH [SH]
ISTL [ISTL]
USEAP [USEAP]
WEXP [WEXP]
RHO [RHO]
RD [RD]
HUB [HUB]
HH [HH]
CONE [CONE]
BN [BN]
NS_NSEC [NS] [NSEC]
IS1 [IS1]
IS2 [IS2]
where
MODE = 1 -> wind turbine mode
2 -> propeller mode (not supported in this documentation)
INCV = 0 -> wind turbine mode - tip speed ratio
1 -> propeller mode - advance ratio (not supported in this documentation)
LTIP = 0 -> ignore tip loss effects
1 -> use Prandtl tip loss model (Wilson approach, PROP code approach)
LHUB = 0 -> ignore hub loss effects
1 -> use Prandtl hub loss model (recommended)
IBR = 0 -> use classical brake state model
1 -> use advanced brake state model (recommended)
SH = 0 -> ignore shaft tilt effects (ignore crossflow effects)
1 -> include shaft tilt effects (include crossflow effects)
ISTL = 0 -> use flat plate post-stall model
1 -> use Viterna post-stall model (recommended)
6

USEAP = 0 -> ignore swirl effects
1 -> include swirl effects (recommended)
WEXP = wind boundary layer profile exponent (0.0 is recommended)
RHO = air density (lb sec^2/ft^4, slug/ft^3)
RD = rotor radius (ft)
HUB = normalized hub radius (i.e., the ratio of hub radius to rotor radius)
HH = normalized hub height (i.e., the ratio of hub height to rotor radius)
CONE = cone angle of the rotor (deg)
BN = number of blades
NS = number of blade segments (also ISEG)
NSEC = number of circumferential segments (must be > 4 when WEXP > 0)
IS1 = number of the first segment to be used in the analysis (usually 1)
IS2 = number of the last segment to be used in the analysis (usually ISEG)
In the design mode, it is required that WEXP = 0 and NSEC = 1.It is recommended that the tip loss models be used, and also that they be enforced for
all conditions using the single line
TIPON
This TIPON line can turned on (used) at any point before doing the first analysis.Another option replaces the original prop.f tip loss model with that defined originally
by Prandtl with the additional line:
TIPMODE 2
This TIPMODE 2 line can turned on (used) at any point before doing the first analysis.
3.2 Blade Geometry
The CH TW line is used to enter the chord and twist distributions from root to tip.
# begin chord and twist data
CH_TW
[CH(1)] [TW(1)] # root chord and twist
...
[CH(JSEG)] [TW(JSEG)]
...
[CH(ISEG)] [TW(ISEG)] # tip chord and twist
# end
where CH(.) is the normalized blade chord (i.e., the ratio of the blade chord to the rotorradius), and TW(.) is the blade twist angle (deg).
The chord and twist may also be defined relative to base values (e.g., by using theCHORD BASE group of lines), but this approach is not often used (see Ref. [6]).
The blade station for the first chord and twist given with CH TW is at
7

station(1) =1
ISEG2
The following blade stations are then at every 1
ISEG . For ten blade segments, the bladestations would then be 0.050, 0.150, 0.250, 0.350, and so on until 0.950.
3.3 Blade Airfoil Data
The AIRFOIL MODE line initiates the input of the airfoil α-Cl and α-Cd data for each bladesegment. There are three standard input mode types: 1, 3, and 4. The preferred modeis type 4. Nevertheless, all three are discussed here beginning with Mode 1, which is theoriginal method used in the PROP code.
# begin airfoil data
AIRFOIL_MODE [1]
[1] [MM(1)] [NN(1)] # first segment
[AL(1)] [CL(1)]
...
[AL(MM(1))] [CL(MM(1))]
[AD(1)] [CD(1)]
...
[AD(NN(1))] [CD(NN(1))]
...
[JSEG] [MM(JSEG)] [NN(JSEG)] # intermediate segment
[AL(JSEG)] [CL(JSEG)]
...
[AL(MM(JSEG))] [CL(MM(JSEG))]
[AD(JSEG)] [CD(JSEG)]
...
[AD(NN(JSEG))] [CD(NN(JSEG))]
...
[ISEG] [MM(ISEG)] [NN(ISEG)] # last segment
[AL(ISEG)] [CL(ISEG)]
...
[AL(MM(ISEG))] [CL(MM(ISEG))]
[AD(ISEG)] [CD(ISEG)]
...
[AD(NN(ISEG))] [CD(NN(ISEG))]
# end
AL(.) and AD(.) are the angles of attack (deg) corresponding to the lift and drag coefficientsCL(.) and CD(.), respectively. MM(JSEG) and NN(JSEG) are the number of α-Cl and α-Cd
pairs to follow for segment JSEG. No more than 20 α-Cl and α-Cd pairs can be used for agiven segment.
The most common airfoil input method is mode 4, which includes more options relatedto stall delay. The format of the data is as follows:
8

AIRFOIL_MODE 4 # airfoil data is in order of alfa, cl, cd
[IAF]
[AFFILE(1)]
[AFTHK(1)] [AFSTALL(1)] [STDELAY(1)] | -
[CLMAXN(1)] [ALINSERT(1)] | [DUSTART[1]] [DUEND[1]]
...
[AFFILE(JAF)]
[AFTHK(JAF)] [AFSTALL(JAF)] [STDELAY(JAF)]| -
[CLMAXN(JAF)] [ALINSERT(JAF)] | [DUSTART(JAF)] [DUEND(JAF)]
...
[AFFILE(IAF)]
[AFTHK(IAF)] [AFSTALL(IAF)] [STDELAY(IAF)]| -
[CLMAXN(IAF)] [ALINSERT(IAF)] | [DUSTART(IAF)] [DUEND(IAF)]
where
AFFILE(.) - airfoil file name *.pd
AFTHK(.) - airfoil thickness
AFSTALL(.) - airfoil stall angle of attack
STDELAY(.) - stall delay of the airfoil (i.e., where flat plate model starts)
CLMAXN(.) - the clmax of the *.pd file.
- optional and only required when the Corrigan stall model is used.
ALINSERT(.) - the angle of attack at which to shift the cl-alpha data to higher
values in the corrigan model
- optional and only required when the Corrigan stall model is used.
DUSTART(.) - the angle of attack at which the UIUC post stall model starts
DUEND(.) - the angle of attack at which the UIUC post stall model ends.
The airfoil data files should follow the examples given by the sample *.pd file in the runs
folder of the archive. However, a requirement for mode 4 is that the airfoil data mustbe ordered as: α, Cl, Cd. The Cl and Cd data must extend up to an angle of attack of27.5 deg in the data files. At least two Reynolds number cases should be included to allowfor interpolation in the analysis.
Details regarding the description of the stall parameters AFSTALL(.) and STDELAY(.)
can be found in Appendix 10.2. PROPID also implements the Corrigan stall delay model(Ref. [7]) and the UIUC post stall model, which are also explained in the Appendix.
If no stall delay model is being used, the Cl at stall AFSTALL(.) is held constant for thestall delay angle, which is read in as the third parameter STDELAY(.). If the Corrigan modelis being used, then the Clmax
CLMAXN(.) for the airfoil and the insert angle ALINSERT(.) forthe model are read. If only the UIUC model is used, the Corrigan CLMAXN and ALINSERT arestill needed as place holders.
Finally, if the Corrigan model is used, the line CORRIGAN EXPN is required and mustappear before the AIRFOIL MODE group of lines. The format is given by
CORRIGAN_EXPN [EXPN]
9

where the recommended value for the empirical constant EXPN is 1 (see Ref. [8]).The last mode is 3, and it differs from mode 4 in only one respect. The order of the
airfoil data in the *.pd files must be: Cl, Cd, α.When using AIRFOIL MODE 3 and 4, PROPID uses that information to read in airfoil
data tables. After this point, the distribution of airfoils to be used along the blade needs tobe defined using the AIRFOIL FAMILY lines.
AIRFOIL_FAMILY [KNODE(IAFMLY)]
[AFX(IAFMLY,1)] [IDXAF(IAFMLY,JNODE)] | [BLENDDST(IAFMLY,JNODE)]
...
[AFX(IAFMLY,JNODE)] [IDXAF(IAFMLY,JNODE)] | [BLENDDST(IAFMLY,JNODE)]
...
[AFX(IAFMLY,KNODE(IAFMLY))] [IDXAF(IAFMLY,KNODE(IAFMLY))] -
| [BLENDDST(IAFMLY,KNODE(JNODE))]
where
KNODE(.) - defines the number airfoils to be used in the airfoil family
AFX(..) - radial location of airfoil IDXAF
IDXAF - the index of the airfoil listed in the AIRFOIL_MODE line
BLENDDST(..) - the distribution function used to determine blending
The optional BLENDDST defines the blending distribution function used with determiningthe airfoil coefficients. The first BLENDDST must be 1, and the last value must be 0. Aspline is fit through the blend distribution values. A method to determine the blendingdistribution is as follows. First set the blend distribution in the AIRFOIL FAMILY lines. Thenplot the thickness distribution and the blend distribution to see if it makes sense, i.e. lookssmooth. These values are written to ftn014.dat (see Section 7.4.1). In general a smooththickness distribution will be obtained if the blend function is weighted according to theairfoil thickness distribution.
If no values are given for BLENDDST, PROPID assumes that the blend function is 1−AFX.This blending is the same as linearly interpolating between the airfoil locations. The lineardistribution is recommended for most cases.
The following examples show two blending distributions. The first is linear with respectto the blade radius station. This distribution is the same as the default distribution if noBLENDDST values are given in the AIRFOIL FAMILY lines. The second example shows a blenddistribution weighted by the airfoil thickness distribution. Both examples give the bladeradius station, the airfoil thickness ratio, and the blend distribution values (BLENDDST).
Example 1:
radius thickness BLENDDST
0.00 0.24 1.00
0.30 0.24 0.70
0.75 0.18 0.25
1.00 0.16 0.00
10

Example 2:
radius thickness BLENDDST
0.00 0.24 1.00
0.50 0.21 0.25
1.00 0.20 0.00
More than one airfoil family can be defined in one PROPID input file. They are num-bered sequentially as they are defined by each successive AIRFOIL FAMILY line. To definewhich airfoil family to used in the blade analysis, the
USE_AIRFOIL_FAMILY [KAFMLY]
where
KAFMLY - the index of the airfoil family to use
Example:
# define airfoils using mode 4 (alpha-cl-cd)
AIRFOIL_MODE 4
3
s818smoo_e.pd
0.24 12 0 1.65 0 0 0
s816smoo_e.pd
0.21 10 0 1.25 0 0 0
s817smoo_e.pd
0.16 8 0 1.10 0 0 0
# airfoil family 1 with 3 airfoils
# r/R-location and airfoil index
AIRFOIL_FAMILY 3
0.00 1
0.50 2
1.00 3
# use the first airfoil family (the one above)
USE_AIRFOIL_FAMILY 1
In the above example, three airfoils are used to determine the blade geometry and aero-dynamics. Since no airfoil blending distribution was defined in the AIRFOIL FAMILY lines,the airfoil data will be linearly interpolated between the airfoil locations.
It should be noted that airfoil data is linearly interpolated with respect to the angle ofattack and the Reynolds number.
11

4 Design Points for Design and Analysis Modes
For both design and analysis modes, the DP line can be used to enter the conditions for whichthe wind turbine is to be analyzed. These conditions are entered using:
DP [IDP] [RPMDP(IDP)] [FLDP(IDP)] [XJDP(IDP)] [IXDIMDP(IDP)]
where
IDP = design point number (must be unique)
RPMDP(IDP) = rotor speed (rpm)
FLDP(IDP) = blade pitch (deg) at 75% of radius
XJDP(IDP) = speed as indicated by the units parameter IXDIMDP(IDP)
IXDIMDP(IDP) = 0 -> XJDP(IDP) is wind speed (ft/sec)
1 -> XJDP(IDP) is wind speed (m/sec)
2 -> XJDP(IDP) is wind speed (mph)
3 -> XJDP(IDP) is tip speed ratio
In the input file, these conditions are later referred to by their design point number (IDPabove). An alternative to entering the rotor speed, blade pitch, and wind speed for use inanalysis is discussed in Chapter 5.
5 Analysis Mode
The analysis mode in the code is used to determine the rotor performance via the 2D SWEEP
line and blade aerodynamic characteristics via 1D SWEEP line, both of which must be precededby lines that set the conditions. The data generated by the 2D SWEEP and 1D SWEEP linesare stored in memory until the WRITE FILES line is issued to write out the data to an ASCIIfile (see Chapter 7).
The 2D SWEEP line is used to determine the rotor performance characteristics, such as,the power curve vs. wind speed, power coefficient vs. tip speed ratio, etc. Moreover, a familyof curves can be generated for different values of pitch, rotor speed, or tip speed ratio.
Prior to any analysis, initialization of various parameters is required by issuing the singleline:
IDES
Next, the blade pitch is set by using one of the following lines:
PITCH_FIXED [FL]
PITCH_DP [JDPFL]
PITCH_SWEEP [FLS] [FLF] [DFL]
12

The PITCH FIXED line sets the pitch to the value of FL (deg), or the PITCH DP line setsthe pitch to the value given by one of the DP lines, in particular, the design point assignedto number JDPFL. Instead of using a single pitch, the pitch can be swept over a range togenerate a family of curves through the PITCH SWEEP line. FLS is the initial (start) value forthe pitch, FLF is the final value, and DFL is the increment.
Likewise, the rotor speed is set by one of the lines:
RPM_FIXED [RPM]
RPM_DP [JDPRPM]
RPM_SWEEP [RPMS] [RPMF] [DRPM]
If the pitch is swept over a range by the line PITCH SWEEP then the rotor speed cannot beswept, and visa versa. That is, either PITCH SWEEP or RPM SWEEP can be used, but not both.
When working with a variable speed turbine (VS MODE — see Additional Input Lines inChapter 9), use tip speed ratio
TSR_SWEEP [TSRS] [TSRF] [DTSR]
instead of any RPM lines.Finally, the wind speed data is set, and the analysis is performed by the lines:
WIND_SWEEP [XJS] [XJF] [DXJ] [IXDIM]
2D_SWEEP
where XJS, XJF, and DXJ are the initial, final, and incremental values for the wind speed XJ
according to the parameter IXDIM defined in Chapter 4. When using TSR SWEEP, the windspeed must be in miles per hour (IXDIM = 2).
Examples:
DP 1 65 1.219 999 2
RPM_DP 1
PITCH_DP 1
WIND_SWEEP 7 50 1 2
2D_SWEEP
In this case, the rotor speed and pitch refer to the design point line and are thus set by thevalues given in the first DP line. The value of 999 in the DP line is not used in this example,and consequently it could be anything. The wind is swept over the range from 7 to 50 mphin 1 mph increments with the units being mph because (IXDIM = 2)..
DP 1 65 1.219 999 2
RPM_DP 1
PITCH_SWEEP -2 4 1
WIND_SWEEP 7 50 1 2
2D_SWEEP
13

In addition to a sweep over the wind speed, the pitch is now swept over the range from −2to 4 deg in 1 deg increments. The pitch value in the DP line is not used; however, the rotorspeed from the DP line is used.
The 1D SWEEP line is used to generate data along the blade span, such as the blade liftcoefficient distribution. Preceding the 1D SWEEP line must be lines to set the pitch, rotorspeed, and wind speed, to be respectively selected from among the lines:
PITCH_FIXED [FL]
PITCH_DP [JDPFL]
PITCH_SWEEP [FLS] [FLF] [DFL]
RPM_FIXED [RPM]
RPM_DP [JDPRPM]
RPM_SWEEP [RPMS] [RPMF] [DRPM]
WIND_FIXED [XJ] [IXDIM]
WIND_DP [JDPWND]
WIND_SWEEP [XJS] [XJF] [DXJ] [IXDIM]
From each set, only one line is used to set the pitch, rotor speed and wind speed. At mostonly one sweep line can be used. Following these three lines, the 1D SWEEP line generates theresults that can be written out as discussed in Chapter 7.
Example:
DP 1 65.0000 1.219 999.000 2
DP 2 999.0000 999.000 19.160 2
DP 3 999.0000 999.000 15.000 2
RPM_DP 1
PITCH_DP 1
WIND_DP 3
1D_SWEEP
This sequence sets the rotor speed to 65 rpm, the pitch to 1.219 deg, and the wind speed to15 mph for analysis. The second DP line is not used.
6 Input File
The input file is assigned in the propid.in which contains the following single line, e.g.
wt01a.in
When PROPID runs, it will read this file and run this case (wt01a.in). This input file isincluded the runs directory of the archive. Details about how to run PROPID are describedin the Shortcourse Notes (see “Course Materials” section and within that see Part II-b afterreviewing all preceding sections).
14

# File: wt01a.in
# Analysis case
# Stall Regulated Turbine modeled loosely after the AOC 15/50
# Basic input
MODE 1.0 # wind turbine
INCV 0.0 # wind turbine mode
LTIP 1.0 # use tip loss model
LHUB 1.0 # use hub loss model
IBR 1.0 # use brake state model
ISTL 1.0 # use viterna stall model
USEAP 1.0 # use swirl suppression
WEXP 0.0 # boundary layer wind exponent
NS_NSEC 10.0 1.0 # number of blade elements/number of sectors
IS1 1.0 # first segment used in analysis
IS2 10.0 # last segment used in analysis
BE_DATA 1 # printout blade element data
SH 0.0 # shaft tilt effects
RHO 0.0023769 # air density (slug/ft^3)
# Geometry
HUB 0.04 # normalized hub cutout
HH 3.333 # normalized hub height
BN 3 # blade number
CONE 6.0 # cone angle of rotor (deg)
RD 24.61 # radius (ft)
CH_TW # Normalized chord and twist distribution
0.15 6
0.13 6
0.12 6
0.11 6
0.10 4
0.09 2
0.08 1
0.07 0
0.06 -1
0.05 -2
# No stall models used
# CORRIGAN_EXPN 1
# Corrigan inputs are present but not used since stall model is off
AIRFOIL_MODE 4
4
s814.pd
.24 13. 3 1.600 6
15

s814.pd
.24 13. 3 1.600 6
s812.pd
.21 14.3 3 1.180 6
s813.pd
.16 9. 3 1.100 6
# airfoil family 1 with 4 airfoils
# r/R-location and airfoil index
AIRFOIL_FAMILY 4
0.0000 1
0.3000 2
0.7500 3
1.0000 4
# use the first airfoil family (the one above)
USE_AIRFOIL_FAMILY 1
# Enforce tip loss model to always be on
TIPON
# Use the Prandtl tip loss model,
# not the original modified model.
TIPMODE 2
# Design point: 64 rpm, 2 deg pitch, 15 mph
DP 1 64 2 15 2
# Initiate design (does some required preliminary work before analysis)
IDES
# Determine the rotor power, Cp, and thrust curves (2D_SWEEP)
#
# use pitch setting from design point (DP) 1
PITCH_DP 1
# use rpm from design point (DP) 1
RPM_DP 1
# sweep the wind from 5 to 50 mph in increments of 1 mph
WIND_SWEEP 5 50 1 2
# perform the sweep
2D_SWEEP
# write out data to files
# 40 - power curve (kW) vs wind speed (mph)
# 45 - cp vs TSR
# 51 - rotor thrust (lb) vs wind speed (mph)
WRITE_FILES 40 45 51
16

# Compute the gross annual energy production (kwh/yr)
# Output the data to file: gaep.dat
#
# Initial avg wind speed - 14 mph
# Final avg wind speed - 18 mph
# Step - 2 mph
# Cutout - 45 mph
#
# 100% efficiency
GAEP 14 18 2 45
#
# 15 mph only, 85% efficiency
# GAEP 15 15 1 45 0.85
# Obtain aero distributions along the blade (1D_SWEEP)
#
PITCH_DP 1
RPM_DP 1
WIND_SWEEP 5 30 5 2
1D_SWEEP
# write out
# 75 - blade l/d dist
# 76 - blade Re dist
# 80 - blade alfa dist
# 85 - blade cl dist
# 90 - blade a dist
WRITE_FILES 75 76 80 85 90
# Write out
# 95 - chord dist (ft-ft)
# 99 - alfa dist (ft-deg)
WRITE_FILES 95 99
# Write out the rotor design parameters to file ftn021.dat
DUMP_PROPID
*
The WRITE FILES line will be discussed in Chapter 7.
7 Output Files
Results generated by the 2D SWEEP and 1D SWEEP lines can be written to ASCII files by theline:
WRITE_FILES [IPRT(1)] [IPRT(2)] [IPRT(3)] ... | ... [IPRT(20)]
17
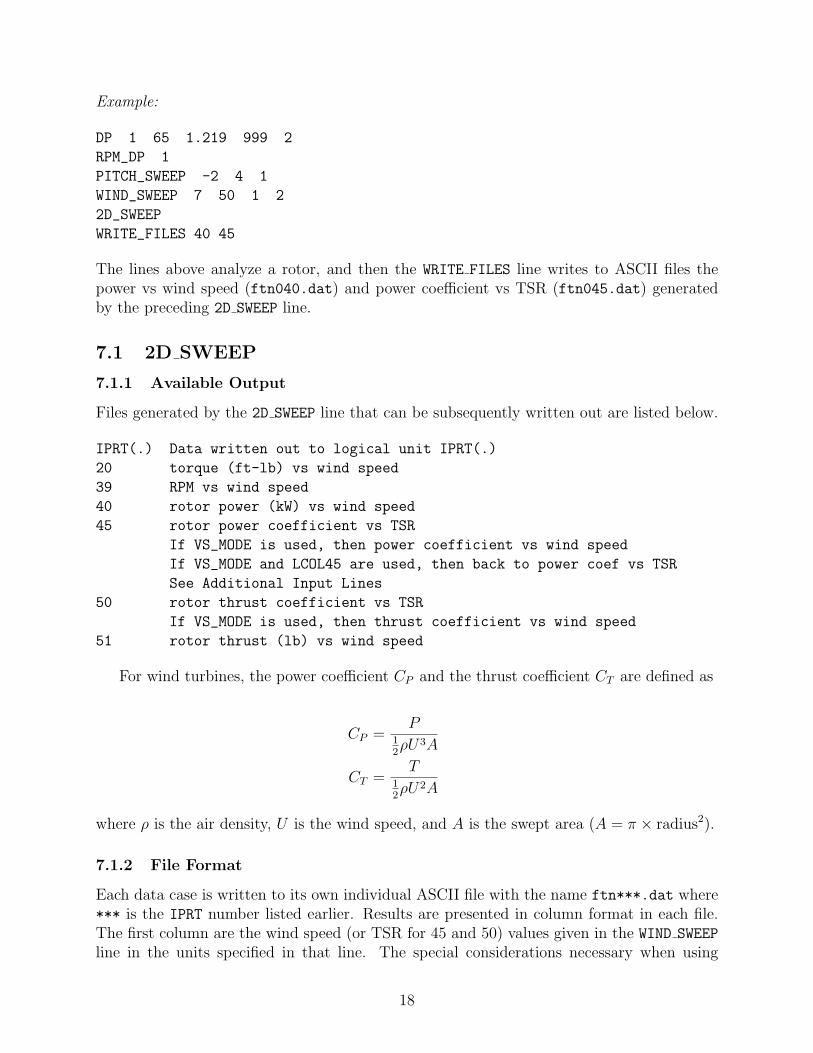
Example:
DP 1 65 1.219 999 2
RPM_DP 1
PITCH_SWEEP -2 4 1
WIND_SWEEP 7 50 1 2
2D_SWEEP
WRITE_FILES 40 45
The lines above analyze a rotor, and then the WRITE FILES line writes to ASCII files thepower vs wind speed (ftn040.dat) and power coefficient vs TSR (ftn045.dat) generatedby the preceding 2D SWEEP line.
7.1 2D SWEEP
7.1.1 Available Output
Files generated by the 2D SWEEP line that can be subsequently written out are listed below.
IPRT(.) Data written out to logical unit IPRT(.)
20 torque (ft-lb) vs wind speed
39 RPM vs wind speed
40 rotor power (kW) vs wind speed
45 rotor power coefficient vs TSR
If VS_MODE is used, then power coefficient vs wind speed
If VS_MODE and LCOL45 are used, then back to power coef vs TSR
See Additional Input Lines
50 rotor thrust coefficient vs TSR
If VS_MODE is used, then thrust coefficient vs wind speed
51 rotor thrust (lb) vs wind speed
For wind turbines, the power coefficient CP and the thrust coefficient CT are defined as
CP =P
1
2ρU3A
CT =T
1
2ρU2A
where ρ is the air density, U is the wind speed, and A is the swept area (A = π × radius2).
7.1.2 File Format
Each data case is written to its own individual ASCII file with the name ftn***.dat where*** is the IPRT number listed earlier. Results are presented in column format in each file.The first column are the wind speed (or TSR for 45 and 50) values given in the WIND SWEEP
line in the units specified in that line. The special considerations necessary when using
18

TSR SWEEP will be discussed later. The rest of the columns present the output with onecolumn for each value in the second sweep if it is used.
Example:
RPM_DP 1
PITCH_SWEEP 0 3 1
WIND_SWEEP 10 50 10 2
2D_SWEEP
WRITE_FILES 40 45
This example uses the blade and design point from the wt01a run case. In this example,the RPM is from the first design point, the pitch is swept from 0 to 3 deg in 1 deg increments,and the wind is swept from 10 to 50 mph in 10 mph increments. The rotor power and powercoefficient are written to their respective output files. Examples of the output files follow.
ftn040.dat
10.0000 0.7635 1.6874 2.4225 2.4086
20.0000 34.9396 36.0997 37.3726 37.6072
30.0000 66.4508 70.7967 73.7919 76.6791
40.0000 61.4906 70.9003 78.2722 85.8334
50.0000 47.1642 55.6055 64.5448 74.5089
ftn045.dat
11.1842 0.0785 0.1734 0.2490 0.2475
5.5921 0.4489 0.4638 0.4801 0.4831
3.7281 0.2529 0.2695 0.2809 0.2919
2.7960 0.0987 0.1139 0.1257 0.1378
2.2368 0.0388 0.0457 0.0531 0.0613
The first column is the wind speed or TSR, the second column is the output for the pitch of0 deg, the third column is the output for the pitch of 1 deg, and so on.
If a RPM sweep is used in the 2D sweep, then the TSR for a given wind speed will changefor each RPM value. However, the output for files 45 and 50 only provide one column ofTSR values. The numbers given in these files are the TSR values corresponding to the lastRPM in the RPM sweep.
Special considerations are required when using TSR SWEEP. When TSR SWEEP is used, thewind speed must be in mph (IXDIM = 2). The following example is for a variable speedturbine. It is based on the blade and design point from the wt09b run case. The pitch isfrom the first design point, the TSR is set to 6, and the wind speed is swept from 5 to 41 mphby 2.25 mph increments. The power is capped at 1 MW using the FIXPD line. Informationon the line FIXPD is found in Chapter 9. The output data files for 40 and 45 are shownbelow.
Example:
19

LCOL45
VS_MODE
FIXPD 1000 1
PITCH_DP 1
TSR_SWEEP 6 6 0
WIND_SWEEP 5 41 2.25 2
2D_SWEEP
WRITE_FILES 40 45
ftn040.dat
5.0000 4.6462
7.2500 14.2490
9.5000 32.1573
11.7500 60.5494
14.0000 101.9457
16.2500 159.2608
18.5000 234.5046
20.7500 330.8952
23.0000 450.6295
25.2500 596.2389
27.5000 770.2544
29.7500 975.2075
29.9840 1000.0000
32.0000 1000.0000
34.2500 1000.0000
36.5000 1000.0000
38.7500 1000.0000
41.0000 1000.0000
ftn045.dat
6.0000 0.3832
7.2 1D SWEEP
7.2.1 Available Output
Files generated by the 1D SWEEP line are:
IPRT(.) Data written out to logical unit IPRT(.)
19 blade tip loss function vs nondimensional blade station
60 blade power (kW) vs nondimensional blade station
61 blade dynamic pressure (lb/ft^2) vs nondimensional blade station
20

65 blade power coefficient vs nondimensional blade station
75 blade airfoil lift-to-drag ratio vs nondimensional blade station
76 blade Reynolds number vs blade station (ft)
80 blade angle of attack (deg) vs nondimensional blade station
84 blade drag coefficient vs nondimensional blade station
85 blade lift coefficient vs nondimensional blade station
86 blade Cl*c (lift coefficient * chord) (ft) vs nondimensional blade
station
87 blade normal force coefficient Cn vs nondimensional blade station
88 blade tangential force coefficient Ct vs nondimensional blade
station
90 blade axial induction factor vs nondimensional blade station
94 blade nondimensional chord (chord/radius) vs nondimensional blade
station
95 blade chord (ft) vs blade station (ft)
96 blade t/c distribution vs blade station (ft)
97 blade thickness (inch) vs blade station (ft)
99 blade twist (deg) vs blade station (ft)
100 blade twist (deg) vs nondimensional blade station
At anytime following the CH TW line, the blade chord and twist distributions can bewritten by using 94 and 95 for the chord and 99 and 100 for the twist.
The blade Reynolds number is calculated using the kinematic viscosity of air at standardsea level conditions (ν = 1.5723 × 10⁻⁴ ft2/sec). The air velocity used to calculate theReynolds number contains the components from the freestream, rotational, and inducedvelocities.
7.2.2 File Format
Each data case is written to its own individual ASCII file with the name ftn***.dat where*** is the IPRT number listed earlier. Results are presented in column format in each file.The first column is the blade span station usually nondimensionalized by blade radius (bladespan station for files for 76, 95, 96, 97, and 99 are in feet). The number of span stations isthe same as NS defined in the input file (see Chap 3). For the geometry output files (94,95, 96, 97, 99, and 100), the output has been extrapolated to include the geometry at theblade tip. The second column in each output file begins the results of the 1D sweep. Resultsfrom each case in the 1D sweep is presented in a separate column in the output file. Theexceptions are the output for the geometry (94, 95, 96, 97, 99, and 100) and the Reynoldsnumber (76). The output for the Reynolds number is only given for the last case in the 1Dsweep.
Example:
PITCH_DP 1
RPM_DP 1
WIND_SWEEP 5 30 3 2
21

1D_SWEEP
WRITE_FILES 85 95
The lines above analyze a rotor using the PITCH and RPM from the first design point. A1D sweep is performed from 5 to 30 mph in 5 mph increments, and the Cl and chord in feetare written to their respective files. The results for this example was taken from the wt01a
run case. The output written to each file follows.
ftn085.dat
0.050 0.4456 1.0842 1.5284 1.0512 0.9517 0.8822
0.150 0.2513 0.8460 1.4827 1.1229 1.0110 0.9339
0.250 0.1458 0.5703 1.1158 1.6000 1.2035 1.0952
0.350 0.0989 0.4223 0.8754 1.3826 1.5209 1.2329
0.450 0.0948 0.3805 0.7789 1.2306 1.4563 1.2951
0.550 0.1101 0.3782 0.7406 1.1560 1.3545 1.3120
0.650 0.1181 0.2465 0.7055 1.0902 1.2426 1.2685
0.750 0.1355 0.3771 0.6953 1.0465 1.1351 1.1762
0.850 0.1798 0.4175 0.7159 1.0168 1.1145 1.1315
0.950 0.2421 0.4730 0.7074 0.9402 1.1043 1.1057
ftn095.dat
1.2305 3.69150
3.6915 3.19930
6.1525 2.95320
8.6135 2.70710
11.0745 2.46100
13.5355 2.21490
15.9965 1.96880
18.4575 1.72270
20.9185 1.47660
23.3795 1.23050
24.6100 1.10745
7.3 Reporting Lines
Different parameters can be written to a report file and written to the screen. All of theREPORT lines listed in this section will write data to screen. If the data is to be also writtento an output file, the following two lines need to be included.
REPORT_START # open the file for reporting
REPORT_END # close the file for reporting
22

Any REPORT lines between the REPORT START and REPORT END lines will be written to the fileftn082.dat.
The output for each REPORT line is followed by a number as shown in the followingexample. This number is a counter that keeps track of the number of output lines from anyREPORT line. These numbers are provided for both the output to the screen and the optionaloutput file (ftn082.dat).
Example:
REPORT_START
REPORT_COMMENT This is a comment
REPORT_GEOMETRY 1
REPORT_SEPARATOR
REPORT_DP_LAST
REPORT_END
The output would look similar to following.
************** Reporting On ************** ( 1)
This is a comment
..............( 2)
blade radius (ft) = 24.610 ( 3)
------------------------------------------ ( 4)
last used design point ( 5)
blade rpm = 64.000 ( 6)
blade pitch (deg) = 2.000 ( 7)
blade xj = 30.000 ( 8)
blade tsr = 3.749 ( 9)
************** Reporting Off ************* ( 10)
As seen in the above example, a comment can be added to the output by using
REPORT_COMMENT
Only the first 50 characters after the REPORT COMMENT will be written. A line of dashes canbe added as a separator by using
REPORT_SEPARATOR
Also the blade geometry is written when the following line is used.
REPORT_GEOMETRY [IRGTP]
Where
IRGTP = 1 -> radius (ft)
= 2 -> area (per blade) (ft^2)
= 3 -> solidity
= 4 -> aspect ratio
23

The solidity is the total blade area divided by the disc area.
solidity =(area per blade) × (number of blades)
π × (radius)2
The aspect ratio is the radius squared divided by the area of one blade.
aspect ratio =(radius)2
area per blade
The example also provided information about the last design/analysis point used for calcu-lations by
REPORT_DP_LAST
This REPORT line provides the RPM, pitch, wind speed (xj), and the tip speed ratio.REPORT DP LAST assumes that the wind speed is in miles per hour. If the calculations werenot in mph, then the tip speed ratio will not be correct.
Specific design point information can be provided using
REPORT_DP [KRDPRPM] [KRDPFL] [KRDPXJ]
where
KRDPRPM = design point # for rpm
KRDPFL = design point # for blade pitch
KRDPXJ = design point # for wind speed
If a zero is used, that value is ignored.Some blade performance information can be reported when using one of the two following
REPORT_1IDP [IRFTP] [KRDPRPM] [KRDPFL] [KRDPXJ]
REPORT_IDP [IRFTP]
where
IRFTP = 200 Power (kW)
202 Thrust (lb)
203 Moment (lb-ft)
204 Omega (nondimensional power coef /2)
205 Power coef
206 Torque (ft-lbs)
207 Tip speed (ft/sec)
208 Tip speed ratio (omega*R/wind speed)
KRDPRPM = design point # for rpm
KRDPFL = design point # for blade pitch
KRDPXJ = design point # for wind speed
24

The 1IDP is modeled after the NEWT1IDP design line (see Section 8.1) and will run the propportion of the code again. The REPORT IDP line uses the values from the last analysis pointsimilar to the REPORT DP LAST.
Peak performance information can be reported using one of the two following
REPORT_1ISWP [IRFTP] [RXJSNT] [RXJFNT] [RDXJNT] [KRDPRPM] [KRDPFL] [KRDPXJ]
REPORT_ISWP [IRFTP]
where
IRFTP = 300 -> peak Power (kW)
301 -> speed at peak power (in mph)
302 -> peak Cp
304 -> max torque (ft-lbs)
RXJSNT = lowest value for wind speed (mph) in range
RXJFNT = highest value for wind speed (mph) in range
RDXJNT = increment in wind speed (mph)
KRDPRPM = design point # for rotor speed
KRDPFL = design point # for blade pitch
KRDPXJ = 999 (value is ignored)
The 1ISWP is modeled after the NEWT1ISWP design line and will run the prop portion of thecode again. The REPORT ISWP will report data based on the last analysis performed. Sowhatever is left in the arrays after the previous analysis will be used.
Similar to the ISWP lines above, the local blade characteristics are reported using thefollowing
REPORT_1LDP [IRFTP] [RJSEGIX] [KRDPRPM] [KRDPFL] [KRDPXJ]
REPORT_LDP [IRFTP] [RJSEGIX]
where
IRFTP = 500 -> local Cl of blade
= 501 -> local axial induction factor
= 502 -> local alpha (airfoil angle of attack)
= 504 -> local power coefficient
= 505 -> local power
= 506 -> local chord*cl (ft)
RJSEGIX = blade segment for specified parameter
KRDPRPM = design point # for rotor speed
KRDPFL = design point # for blade pitch
KRDPXJ = design point # for wind speed
The 1LDP is modeled after the NEWT1LDP design line and will run the prop portion of thecode again. The REPORT LDP uses the values left in memory.
A variety of data can be reported using the REPORT SPECIAL line. This report line hasthree flags, as seen below, that are explained in Table 1. The JPT value for IRSTP3 is with
25

report values that are created with a 1D SWEEP and is used to specify which sweep resultshould be reported. A value of 1 provides the radial position, a 2 provides the first sweepresult, a 3 provides the second sweep results, and so on.
REPORT_SPECIAL [IRSTP1] [IRSTP2] [IRSTP3]
Table 1: Flag Values for REPORT SPECIAL
IRSTP1 IRSTP2 IRSTP3 Description
1 1 999 FIXV - speed corresponding to that for which the poweris truncated via the FIXPD line
2 1,2,3...ISEG JPT blade section cl/cd at blade station IRSTP2
3 999 999 root bending moment (lb-ft) from last analysis4 1,2,3...ISEG JPT blade physical thickness (in) at blade station IRSTP2
5 1,2,3...ISEG JPT blade twist (deg) at blade station IRSPT2
6 999 999 air density (slugs/ft3)7 999 999 tip speed ratio based on last analysis run8 999 999 annual energy production and corresponding average
wind speed and generator efficiency9 999 999 write airfoil data file names used10 1,2,3...ISEG JPT blade chord (ft) at blade station IRSPT2
11 999 999 FIXPD
12 1,2,3...ISEG JPT blade section Re at blade station IRSPT2
13 1,2,3...ISEG JPT blade section axial induction factor at blade stationIRSPT2
14 1,2,3...ISEG JPT blade section lift coefficient at blade station IRSPT2
15 1,2,3...ISEG JPT blade section drag coefficient at blade station IRSPT2
The version number of PROPID can be reported using
REPORT_VERSION
Different blade element momentum theory (BEMT) information can be reported using
REPORT_BE_DATA [IBEMT] [RADLOC2]
where
IBEMT = 14 -> chord normal force
= 15 -> chord tangential force
= 16 -> dynamic pressure
RADLOC2 = radial position
26

The radial position (RADLOC2) can be any value between 0 (hub) and 1 (tip). The bendingmoment can also be reported not at the hub, but outboard by an offset by using
REPORT_MD_ROFFSET [roffset]
where ROFFSET is the normalized radial offset. The root bending moment is assumed to bedue to a single force at the 75% blade station. This force is used to calculate the momentat the offset location.
7.4 Additional Output Files
Besides the output files from the 2D and 1D sweeps, PROPID can produce some additionaloutput files.
7.4.1 Airfoil blending values
The airfoil blending values (see Section 3.3) are written to ftn014.dat when
WRITE_FILES 14
is used. The output file contains four columns of data where the first is the radius station,the second is the blending distribution values, the third is the airfoil weighting values, andthe fourth is the airfoil thickness ratio.
7.4.2 ftn011.dat
This output file can contain data from two sources. The first source is the blade-elementperformance data and is from the input line BE DATA. The second source is the input dataand is from the input line PRINT INPUT. More information on the input lines is found inChapter 9.
7.4.3 ftn021.dat/ftn022.dat
This output file contains the converged blade data. It is created from either DUMP PROPID orDUMP PROP93. See Section 8.1
7.4.4 GAEP data
The gaep.dat file contains the results of the gross annual energy production calculationsinitialized by the input line GAEP. See Chapter 9 for more information.
The generator/gearbox efficiency curve data is written to ftn015.dat when
WRITE_FILES 15
is used. This file contains the efficiency value from the GAEP input line versus the wind speed.The data in this file will only extend to the cutout wind speed used on the GAEP line. Theresults for this file will only be computed with the GAEP line so the WRITE FILES 15 must beafter the GAEP line. The WRITE FILES should also appear before any 1D SWEEP lines in orderto write out all the wind speeds in the ftn015.dat file.
27

7.4.5 Cl, Cd, and α data out of the code
It is possible to extract aerodynamic data at each radial station from the results of the code.Examples on how this is done can be found in the companion propid-doc.txt file and inthe wt02a, wt03a, and wt07a examples in the runs directory.
8 Design Mode
The design mode can be used to specify a desired output that is achieved by automaticallyadjusting one of the inputs. If a single value is specified (e.g., peak rotor power), then aNEWT1-type line is used. If a function is prescribed (e.g., lift coefficient distribution), then aNEWT2-type line is used. Any number of NEWT1- and NEWT2-type lines can be used as long asno two lines specify the same desired output or input for adjustment. If no solution is found,it usually indicates that either (1) the above rule is violated by mistake or (2) the desiredoutput is not physically possible.
8.1 NEWT1 Lines
The NEWT1ISWP can be used to specify a desired peak power (or some other variable that isdetermined by analyzing the rotor over a given wind speed range). The general form of theNEWT1ISWP line is given by
NEWT1ISWP [IFTP1(.)] [FNEWT1(.)] [XJSNT1(.)] [XJFNT1(.)] [DXJNT1(.)] -
[KDPRPM1(.)] [KDPFL1(.)] [KDPXJ1(.)] -
[ITP1(.)] [ITP2(.)] [ITP3(.)] | [CLAMP1(.)] [TOL1(.)]
where
IFTP1(.) = 300 -> peak rotor power (kW)
301 -> wind speed (mph) at peak power
302 -> peak power coefficient
304 -> maximum torque (ft-lb)
FNEWT1(.) = value for specified parameter
XJSNT1(.) = lowest value for wind speed (mph) for range
XJFNT1(.) = highest value for wind speed (mph) for range
DXJNT1(.) = increment in wind speed (mph)
KDPRPM1(.) = design point # for rotor speed
KDPFL1(.) = design point # for blade pitch
KDPXJ1(.) = 999 (value is ignored)
ITP1(.) = used to identify input variable for iteration (see Table)
ITP2(.) = used to identify input variable for iteration (see Table)
ITP3(.) = used to identify input variable for iteration (see Table)
CLAMP1(.) = positive step limit used during iteration (optional)
TOL1(.) = (optional if CLAMP1(.) is specified)
28

> 0 and specified -> convergence tolerance for auto iteration mode
unspecified -> interactive iteration mode in force
It should be noted that in specifying the design point line, the wind speed is ignored (999).Also, the sweep in wind speed specificied by this line must be in mph.
Input parameters options for iteration are specified according to Table 2.
Table 2: Input Variable Specification for NEWT1 Iteration
ITP1(.) ITP2(.) ITP3(.)
1 1 - Scale Rotor 9992 - Rotor Speed Design Point #3 - Pitch Design Point #4 - Wind Speed Design Point #5 - Cone Angle 9996 - Air Density 9997 - Rotor Radius 999
2 Blade Chord # 999999 100 - Offset Chord
3 Blade Twist # 999
The “#” in the ITP2 column in Table 2 is used to indicate which segment of the blade isused for iteration. “Offset Chord” means that the blade chord at each segment is increasedor decreased by an equal amount, which effectively changes the rotor solidity.
The CLAMP1(.) sets the step limit for each input variable used for the iteration. Some-times the predicted change in the input variable is too large and can cause the solution todiverge. In this situation, specifying a step limit can usually improve convergence. If no steplimit is desired, then the value for CLAMP1(.) can be left unspecified in the NEWT1 line. Inthis case, the value TOL1(.) must be unspecified as well.
The parameter TOL1(.) is used in the convergence test and is the desired differencebetween the current value and the specified value for the output parameter. If iteration is toproceed automatically until convergence without user input, then TOL1(.) must be specifiedfor use in the convergence test. In this case, all NEWT1 and NEWT2 lines must contain values forTOL1(.) and as later discussed TOL2(.) if a NEWT2 line is used. If TOL1(.) is not specified,then the iteration steps are performed interactively. Interactively monitoring convergence isuseful for “debugging” cases when convergence is not easily achieved.
After any number of NEWT1 and NEWT2 lines, the iteration is initiated by the IDES line.Anytime the IDES line is issued, the iteration scheme will attempt to achieve the desiredspecifications for all the NEWT1 and NEWT2 lines that preceded the current IDES line. Onceconvergence is achieved, more NEWT1 and NEWT2 lines can be used, and the IDES can be issuedagain to converge the solution to all the preceding specifications.
Example:
29

DP 1 64 2.00 15.000 2
NEWT1ISWP 300 95 25 50 1 1 1 999 1 3 1 1.5 0.1
IDES
For this example, the peak rotor power is specified to be 95 kW over the wind speedrange from 25 mph to 50 mph in increments of 1 mph. The corresponding rotor speed andpitch are 64 rpm and 2 deg, respectively. To achieve the desired peak power, the blade pitchis iterated and has a clamp of 1.5 deg. Iteration will be performed automatically until theactual peak power is within 0.1 kW of the desired peak power of 95 kW. For this example,the following output is echoed to the screen:
**********************************************
* Running input file: propid.in -> wt05b.in
**********************************************
Reading polar data file (pdata.f): s814.pd
Reading polar data file (pdata.f): s814.pd
Reading polar data file (pdata.f): s812.pd
Reading polar data file (pdata.f): s813.pd
newt1-line
1: prescribed peak power (kw) = 95. at design point rpm( 1) pitch( 1)
adjust pitch( 1) with step limit = 1.500 (deg)
initial wind turbine design for stage: 1
residues for newt1* equations:
fnt1_0( 1) = -15.59168 value1() = 79.40832
iteration 1
calculating sensitivities for newt1 design parameter: 1
residues for newt1* equations:
fnt1_1( 1) = -5.90454 value1() = 89.09546 deltas1() = 1.50000
clamp1() = 1.500
finished iteration = 1
iteration 2
calculating sensitivities for newt1 design parameter: 1
residues for newt1* equations:
fnt1_1( 1) = -0.43994 value1() = 94.56006 deltas1() = 0.77385
clamp1() = 1.500
finished iteration = 2
30

iteration 3
calculating sensitivities for newt1 design parameter: 1
residues for newt1* equations:
fnt1_1( 1) = 0.00362 value1() = 95.00362 deltas1() = 0.07284
clamp1() = 1.500
finished iteration = 3
converged solution for stage = 1
As the output indicates, when a NEWT1 (or NEWT2) line is given, the specifications areechoed to the screen for verification. The IDES line initiates the iteration, which in this casewill be performed automatically since TOL1(.) is specified. Stage 1 indicates that this isthe first time an iteration sequence has been initiated. If a second IDES line were to followlater, then that iteration sequence would be referred to as Stage 2, and so on. After theIDES line, PROPID determines the peak power (maximum power) over the specified windspeed range and determines the difference between the actual peak power and the specifiedpeak power – the residue, which in this case is approximately 16 kW. In other words, theactual peak power is nearly 80 kW rather than the specified 95 kW. Since the difference isnot less than 0.1 kW, iteration occurs. In the Newton iteration method, the sensitivity ofthe peak power to the pitch is determined, and the step size is set at 1.5 deg. Thus, in thisexample, the clamp is enforced for the first step in the iteration. The iteration is performedagain until convergence is achieved.
Example:
DP 1 64 2.00 15.000 2
NEWT1ISWP 300 95 25 50 1 1 1 999 1 3 1 1.5
IDES
This example, which is similar to the last, illustrates the interactive iteration mode. TheTOL1(.) parameter is left unspecified, but the 1.5 deg clamp is still used. The interactiveiteration mode is most useful when starting a new design problem, since convergence cansometimes be difficult in which case clues can be gleaned from the convergence history. Thefollowing output is echoed to the screen.
**********************************************
* Running input file: propid.in -> wt05c.in
**********************************************
Reading polar data file (pdata.f): s814.pd
Reading polar data file (pdata.f): s814.pd
Reading polar data file (pdata.f): s812.pd
Reading polar data file (pdata.f): s813.pd
newt1-line
31

1: prescribed peak power (kw) = 95. at design point rpm( 1) pitch( 1)
adjust pitch( 1) with step limit = 1.500 (deg)
initial wind turbine design for stage: 1
residues for newt1* equations:
fnt1_0( 1) = -15.59168 value1() = 79.40832
select option:
0 stop iteration for current stage
# number of consecutive iterations
999 to stop execution
99 more options
>> 2
in consecutive iteration mode...
iteration 1
calculating sensitivities for newt1 design parameter: 1
residues for newt1* equations:
fnt1_1( 1) = -5.90454 value1() = 89.09546 deltas1() = 1.50000
clamp1() = 1.500
iteration 2
calculating sensitivities for newt1 design parameter: 1
residues for newt1* equations:
fnt1_1( 1) = -0.43994 value1() = 94.56006 deltas1() = 0.77385
clamp1() = 1.500
select option:
0 stop iteration for current stage
# number of consecutive iterations
999 to stop execution
99 more options
>> 1
iteration 3
calculating sensitivities for newt1 design parameter: 1
32

residues for newt1* equations:
fnt1_1( 1) = 0.00362 value1() = 95.00362 deltas1() = 0.07284
clamp1() = 1.500
select option:
0 stop iteration for current stage
# number of consecutive iterations
999 to stop execution
99 more options
>> 0
In this case, from the “Select option:” prompt, “2” is entered so that 2 consecutiveiterations are performed. The >> notation is used to denote this user input. For the firstiteration, the clamp is reached, and the magnitude of the step is reduced to the clamp size.After the first two iterations, one more iteration is then performed to reduce the residuefurther. At anytime, 999 could have been entered to stop the program. 99 is used to enteranother options menu to interactively double or halve the clamp sizes in case convergence isslow (-> increase the clamp sizes) or in case the solution begins to diverge (-> decrease theclamp sizes).
Once a blade has converged, the converged input data can be written out to file ftn021.datwith the DUMP PROPID line given by
DUMP_PROPID
The contents of this new output file can then be substituted back into the original input fileas the design process continues. As an alternative, a PROP93/PROPSH data file can bewritten out to file ftn022.dat by using:
DUMP_PROP93 [JDP]
where JDP is the design point.Additional NEWT1 lines are listed as follows. The first allows for the specification of
integrated quantities (e.g., power) for a given design point (IDP).
NEWT1IDP [IFTP1(.)] [FNEWT1(.)] -
[KDPRPM1(.)] [KDPFL1(.)] [KDPXJ1(.)] -
[ITP1(.)] [ITP2(.)] [ITP3(.)] | [CLAMP1(.)] [TOL1(.)]
where
IFTP1(.) = 200 -> power (kW)
202 -> Thrust (lb)
203 -> Moment (lb-ft)
205 -> Power coef
33

206 -> Torque (ft-lb)
207 -> Tip Speed (ft/sec)
FNEWT1(.) = value for specified parameter
KDPRPM1(.) = design point # for rotor speed
KDPFL1(.) = design point # for blade pitch
KDPXJ1(.) = design point # for wind speed
The parameters ITP1(.), etc. are the same as previously described in Table 2.Local blade characteristics for a given design point (LDP) such as the lift coefficient can
be prescribed by the line:
NEWT1LDP [IFTP1(.)] [JSEGIX1(.)] [FNEWT1(.)] -
[KDPRPM1(.)] [KDPFL1(.)] [KDPXJ1(.)] -
[ITP1(.)] [ITP2(.)] [ITP3(.)] | [CLAMP1(.)] [TOL1(.)]
where
IFTP1(.) = 500 -> local lift coefficient
501 -> local axial induction factor
502 -> local airfoil angle of attack
504 -> local power coefficient
505 -> local power
506 -> local chord*cl (ft)
JSEGIX1(.) = blade segment for specified parameter
FNEWT1(.) = value for specified parameter
KDPRPM1(.) = design point # for rotor speed
KDPFL1(.) = design point # for blade pitch
KDPXJ1(.) = design point # for wind speed
Again, the parameters ITP1(.), etc. are the same as previously described in Table 2.
8.2 NEWT2 Lines
NEWT2 lines are used to specify, for example, the lift coefficient distribution relative to aspecified location. Such a distribution is referred to as the relative lift coefficient distributionor Cl. This new notation is best introduced through Fig. 1, which shows a convenientparameterization of the blade geometry.
The chord c is composed of the sum of a constant level at the blade root and a chorddistribution relative to this constant level, that is, c0 + c. Likewise, the blade pitch is thesum of the pitch at 75% radius (β75%) and the twist relative to this point (θ), both measuredpositive in the direction toward feather from the rotor plane. In general, the chord, twist,or lift coefficient distributions can be referenced relative to any location as specified by theNEWT2 line.
To illustrate the approach, a fairly sophisticated example is considered. A three-bladed,9.25 m radius rotor operates at a constant rotor speed of 50 rpm with a fixed pitch of 3 degat 75% of radius. The NREL S814 (root), S809 (primary) and S810 (tip) advanced wind
34

Figure 1: Parameterization of blade chord and twist distributions.
turbine airfoils are used along the blade span. (Airfoil data for the S814/809/810 series canbe obtained through the the National Renewable Energy Laboratory website.) The bladeis defined by 10 segments. The design goals are to achieve (1) a specified peak power of75 kW and (2) a desired lift coefficient distribution at a wind speed yet to be determined.As previously discussed, one means of achieving the desired peak power is to adjust thesolidity via the blade chord offset c0 (as shown in Fig. 2) by the lines
DP 1 50.0 2.5 999 2
DP 2 999 999 14.444 2
NEWT1ISWP 300 75 20 35 1. 1 1 1 2 999 100
IDES
Continuing with the current example, the desired lift coefficient distribution is shown inFig. 3.
As with the blade twist distribution, it is convenient to divide the desired Cl distributioninto two components: Cl75%
+ Cl. This Cl distribution corresponds roughly to the maximumL/D condition of the airfoils along the blade span. The speed corresponding to this Cl
distribution is defined in part by the peak power level for the following reason. As shownin Fig. 2, the peak rotor power is reached at a wind speed near 13.41 m/sec (30 mph). Atthis speed, the rotor Cl distribution is nearly centered about the Clmax
of the airfoils alongthe span. Likewise, near the cut-in speed of 4.47 m/sec (10 mph), the net Cl distributionis slightly above zero lift. Thus, it would be inconsistent to specify that the desired Cl
35

Figure 2: Adjustment of blade chord offset to achieve desired peak power.
distribution should occur at a wind speed near 13.41 m/sec (30 mph) or near the cut-inspeed. In fact, the speed corresponding to the desired Cl cannot be specified; rather, thisspeed must be determined since it is predefined somewhat by the cut-in and peak powerspeeds.
This wind speed shown in Fig. 4 (see point 2) is determined by the additional lines
NEWT1LDP 500 8 0.65 1 1 2 1 4 2 1
IDES
which in the input file follows the previous lines for the peak power prescription. As indicatedby this line, the Cl is specified to be 0.65 at segment 8 (75% of radius) for a rotor speed of50 rpm and blade pitch of 2.5 deg. The wind speed for the second design point is adjustedto achieve the desired lift coefficient on segment 8. The IDES line begins the second iterationstage for both the design point wind speed as well as the blade chord offset so that thedesired peak power and local lift coefficient are achieved. Thus, a two-dimensional iterationis performed.
In the next stage, the twist θ is adjusted to achieve the desired Cl as shown in Fig. 5 (seesolid line). In particular, the twist inboard of 75% radius is adjusted to achieve the desiredinboard Cl. Also, the outboard twist is iterated to achieve the desired outboard Cl.
In general, the NEWT2SDDP line is used to adjust either the relative chord or twist dis-tribution to achieve a desired relative output distribution. The NEWT2SDDP line is given
36

Figure 3: Desired Cl distribution corresponding to a wind speed yet to be determined.
by
NEWT2SDDP [IFTP2(.)] [JSEGIX2(.)] [JSEGIX3(.)] [JSEGREL(.)] [KADJSBS(.)]
[SSS(1)] [SSF(1)]
...
[SSS(KADJSBS(.))] [SSF(KADJSBS(.))]
[KDPRPM2(.)] [KDPFL2(.)] [KDPXJ2(.)] [ISDTP(.)] [ISCHED2(.)] -
| [CLAMP2(.)] [TOL2(.)]
where
IFTP1(.) = 100 -> relative lift coefficient distribution
101 -> relative axial induction factor distribution
102 -> relative airfoil angle of attack distribution
104 -> relative power coefficient distribution
105 -> relative power distribution
JSEGIX2(.) = inboard segment for relative distribution
JSEGIX3(.) = outboard segment for relative distribution
JSEGREL(.) = relative segment, i.e., where the relative distribution is 0
KADJSBS(.) = number of segments [JSEGIX3(.) - JSEGIX2(.)]
SSS(1) = first segment prescribed (always = 1)
SSF(1) = relative value for first segment
SSS(KADJSBS(.)) = last segment prescribed (always = JSEGREL(.))
SSF(KADJSBS(.)) = relative value for last segment
KDPRPM2(.) = design point # for rotor speed
KDPFL2(.) = design point # for blade pitch
KDPXJ2(.) = design point # for wind speed
ISDTP(.) = used to identify input variable for iteration (see Table)
37

Figure 4: Adjustment of wind speed to achieve desired Cl at 75% radius.
ISCHED2(.) = used to identify input variable for iteration (see Table)
CLAMP2(.) = positive step limit used during iteration (optional)
TOL2(.) (optional if CLAMP2(.) is specified)
> 0 and specified -> convergence tolerance for auto iteration mode
unspecified -> interactive iteration mode in force
The input parameter options for iteration are specified according to the Table 3.The blade twist adjustment shown in Fig. 5 is performed according to the example lines:
NEWT2SDDP 100 2 7 8 6
1 0.308
2 0.302
3 0.276
4 0.218
38

Figure 5: Adjustment of twist distribution to achieve desired Cl distribution.
5 0.118
6 0.042
1 1 2 2 100 2
NEWT2SDDP 100 9 10 8 2
1 -.030
2 -.053
1 1 2 2 100 2
IDES
The first NEWT2SDDP line prescribes the Cl from segments 2 through 7 relative to 8. Sixvalues for Cl then follow. At segment 2 the Cl is prescribed to be 0.308, 0.302 for segment 3,and so on. The specification corresponds to a rotor speed of 50 rpm and pitch of 2.5 deg. Thewind speed corresponds to that of the second design point (which is changing according tothe previous NEWT1LDP line). To achieve the desired Cl, the corresponding twist is adjustedfor segments 2 through 7. The second NEWT2SDDP line prescribes the Cl from segments 9through 10 relative to 8. Again, the twist is adjusted for the corresponding segments (9 and10). Note that for this example, the twist for segment 8 is left unchanged at 0 deg. Therefore,
39

Table 3: Input Variable Specification for NEWT2 Iteration
ISDTP(.) ISCHED2(.)
1 100 - Move Corresponding Chord Independently2 100 - Move Corresponding Twist Independently
the pitch of the blade is also unchanged by the present iteration schedule. It should be notedthat the combined NEWT1 and NEWT2 lines lead to an iteration on 10 variables (blade chordoffset, design point wind speed, and eight θ values) for 10 desired output values (peak power,Cl at 75% radius, and eight Cl values).
The current example can be extended to include iteration on the blade chord so thata desired relative axial induction factor distribution can be achieved. In particular, theexample lines
NEWT2SDDP 101 3 10 2 8
1 0.0
2 0.0
3 0.0
4 0.0
5 0.0
6 0.0
7 0.0
8 0.0
1 1 2 1 100 0.5
IDES
produce a constant axial induction factor from segments 2 through 10. The axial inductionfactor for a specific blade element can be prescribed with the NEWT1LDP line. Doing sotogether with the relative distribution prescribed (as above) would then fix the entire axialinduction factor distribution for the specified condition.
After a file is known to reliably converge for all prescriptions (all NEWT* lines), addingthese two lines before any iteration will cause the program to automatically converged with-out keyboard prompts:
TOLSP1 [TOLSP1]
TOLSP2 [TOLSP2]
where
TOLSP1 = auto-iteration mode convergence tolerance for all NEWT1 lines
TOLSP2 = auto-iteration mode convergence tolerance for all NEWT2 lines
40

8.3 General Tips
1. Selecting suitable input variables for iteration. When selecting input variables foriteration, convergence is most rapidly achieved when the specified output variabledepends strongly on the selected input variable. For instance, peak power is a strongfunction of solidity, blade pitch, and rotor speed, but peak power is a weak functionof cone angle for all practical purposes. Some specific suggestions are in order. If therelative lift is specified, then convergence is best achieved through iteration on theblade twist. If the axial induction factor is prescribed, convergence is best achievedthrough iteration on the blade chord.
2. Under-specification of variables for iteration. Care should be taken to ensure that aninput variable is not selected for iteration more than once. There are no special checksin the code should this happen by user error (i.e., inadvertently occur). Specifying thesame variable twice for iteration is equivalent to not specifying enough variables foriteration. While the program may run, it will not converge.
3. Specified lift coefficient distribution. If the lift coefficient is specified along the span,the lift coefficient should not (of course) exceed the local maximum lift coefficient ofthe airfoil (since such specification would not be physically possible, i.e. achievableduring iteration). Moreover, a problem can occur when the specified Cl distribution istoo close to Clmax
. For instance, if Clmaxis 1.2 and the specified local lift coefficient is
1.1, two different solutions exist - one before stall and one after. The user may assumethat the specified Cl will be achieved at an angle of attack below Clmax
; however, itcould also be achieved for an angle of attack above Clmax
. The wind turbine mustbe analyzed to determine which case exists after iteration. To avoid this potentialdifficulty, it is suggested that the specified Cl be at least 0.2 below Clmax
.
4. Hub radius/cut-out. No specifications should be applied to those segments that arewithin the hub radius (or cut-out) or those segments that are not included in theanalysis by the IS1 and IS2 lines.
5. Errors and Warnings. There are several checks in the code for errors and potentialerrors. For instance, if the peak power is specified for a rotor and iteration is performedon the blade chord offset, the local chord can become negative at which point an errorwill be issued to the user. It is easy to envision a case for which this could occur. Ifthe actually peak power is greater than the prescribed peak power, the chord will bereduced everywhere by an equal amount. The iteration process will be repeated as longas the actually peak power is greater than the prescribed peak power. At some point,the local chord could be reduce to a negative value (most likely at the tip). Since thedata is always checked between iterations, an error to this effect will be subsequentlyissued. Warnings can be innocuous, but usually they are hints of problems either withthe initial input or with the current solution.
6. Residues do not go to zero (solution does not converge). This is an indication thatwhat is specified is not physically possible through an adjustment in the selected input
41

parameters. It is suggested that the iteration be done in several stages in order to helpdeduce the source of the difficulty.
7. Physical interpretation of DELTAS(.) and suggested clamp sizes. There is no rule ofthumb for determining the appropriate clamp size; for some problems a clamp may noteven be required. Generally, if between successive iterations the residue is reduced anddoes not switch sign, then the clamp can most likely be increased for each variable.But if the residue grows for a particular output variable or if the magnitude remainsthe same but switches sign, then the clamp size should be reduced. DELTAS(.) is thestep size for a given variable for an iteration. The clamp is applied to this variable andhence it is necessary to know the physical interpretation of DELTAS(.). Table 4 lists(1) the physical interpretation of DELTAS(.) corresponding to the parameters listedTables 2 and 3 and (2) suggested clamp sizes as a starting point.
Table 4: DELTAS(.) and Suggested Clamp Sizes
Keyword DELTAS(.) Clamp SizeScale Rotor§ % Growth 0.20Rotor Speed§ ∆ Rotor Speed 5
Pitch§ ∆ Pitch 1Wind Speed§ ∆ Wind Speed/TSR 1/()*Cone Angle§ ∆ Cone Angle ()*Air Density§ ∆ Air Density ()*
Rotor Radius§ ∆ Rotor Radius 2Blade Chord§ ∆ Nondimensional Blade Chord 0.05Offset Chord§ ∆ Nondimensional Offset Chord 0.05Blade Twist§ ∆ Blade Twist 2All Chords§§ ∆ Chord 0.05All Twists§§ ∆ Twist 2
§ NEWT1 case§§ NEWT2 case* no suggested value (rarely used)
9 Additional Input Lines
ATOL Line
The convergence parameter for the PROP portion of the code can be set with
ATOL [ATOL]
This line is optional, and if it is not used, the default value is 0.000001.
42

BE DATA Line
Blade-element performance data like that of the PROPSH code can be written to ftn011.datwith the line
BE_DATA [IS]
where if IS is 1, data is saved to file (default = 0, no data saved). If data is printed inthe design mode, the file can become thousands of lines long. Also, during the design modethe data is not particularly useful since the blade geometry and other parameters may bechanging. The BE DATA line is most useful during the analysis performed after the designprocess. When this data is desired during the analysis mode, the BE DATA line should precedethe 2D SWEEP and 1D SWEEP lines.
BEEP Line
Beeps to the screen can be sent with the line
BEEP
This feature is not supported on all platforms.
BUMPCL, BUMPCD, and BUMPALPHA Lines
To explore “what if” effects, the lift coefficient of the airfoils can be incremented (bumpedup or down) using the line
BUMPCL [CLBUMP] | [JAF]
where
CLBUMP = cl increment to add
JAF = index of airfoil to bump, default is to apply increment to all airfoils
To increment the drag, use
BUMPCD [CDBUMP] | [JAF] | [JBPMODE] | [CDALFA1] [CDALFA2]
where
CDBUMP = cd increment or scale factor
JAF = index of airfoil to bump
default applies increment to all airfoils
JBPMODE = 1 -> bump becomes a scale factor (eg, 1.5 gives 50% more drag)
2 -> blend in the scale factor:
@ CDALFA1 scale factor is CDBUMP (CDSCALE) and goes
linearly to a value of 1 @ CDALFA2
CDALFA1,2 = used with JBPMODE is 2
43

In similar fashion the angle of attack of the airfoil data can be incremented using thisline
BUMPALPHA [ALPHABUMP]
where
ALPHABUMP = add the increment, but does not change the last point (27.5 deg)
In each case, if one or more of these lines are used, they must come before any analysis,and thereafter the increment or decrement remains.
CDFAC Line
Scale the drag by a factor with
CDFAC [CDFAC]
where
CDFAC = scale factor to apply to all Cd during analysis
CHORD BASE Line
This is an optional way to enter the chord and twist distributions. Enter the base chord,then relative chord and twist distributions. At least two points are required for the relativedistributions, as shown above. By way of example, this sets the nondimensional chord tobe constant at 0.0911 and zero blade twist. These values are relative to the root, and thecoordinate pair (0,0) assumed.
CHORD_BASE 0.0911
CHORD_RELATIVE 2
0.5 0
1.0 0
TWIST_RELATIVE 2
0.5 0
1.0 0
CLLOSS Line
To model the lift loss (or increase) due to roughness, the CLLOSS line can be used.
CLLOSS
[CLLOSS(1)]
...
[CLLOSS(ISEG)]
The values [CLLOSS(1)] through [CLOSS(ISEG)] (one for each blade segment) are theamount loss in Clmax
. For example, use a value of 0.14 for a 14% loss in Clmax. For an
increase, use a negative value.
44

DRY Line
Sometimes it is useful to have PROPID echo to the screen the desired NEWT1 and NEWT2
line prescriptions without performing the iteration usually prompted by the IDES lines. Toonly show the prescriptions as a check on the input file, use the line
DRY
to toggle on and off any following IDES lines. For example, if two DRY lines are used, thefirst will turn off all of the following IDES lines until the second DRY line is reached.
ECHO INPUT Line
To echo the input lines from the input file to the screen, use the following line.
ECHO_INPUT
FIXPD Line
For variable speed wind turbine operation, the power can be “cropped” at the rated powerof the wind turbine using
FIXPD | [FIXPD] | [ITEST]
where
FIXPD = rated power of the wind turbine in kW
ITEST = 1 -> fill in the corner of the power curve between normal
operation and the maximum power (cropped value).
Adds one point to the power curve and thus determines
the exact wind speed for rated power.
If no arguments are given, the previous FIXPD line is turned off.When using FIXPD, only one TSR or pitch can be used in the 2D SWEEP. Therefore only
the wind speed can be swept.
Example:
FIXPD 500 1
PITCH_DP 1
TSR_SWEEP 6 6 0
WIND_SWEEP 5 50 1 2
2D_SWEEP
# write out
# 40 - power curve (kW) vs wind speed (mph)
# 51 - rotor thrust curve
WRITE_FILES 40 51
45

GAEP Line
Gross annual energy production (GAEP) can be determine using
GAEP [GVMIN] [GVMAX] [GVINC] [GVCUT] | [GENEFF]
where
GVMIN = min average wind speed
GVMAX = max average wind speed
GVINC = wind speed increment
GVCUT = cutout wind speed
GENEFF = generator efficiency, default is 1
The GAEP line must appear after the 2D SWEEP line since the GAEP calculation uses the re-sults from the sweep. Units for the wind speeds are the same as those used in the WIND SWEEP
for the 2D SWEEP. So if the wind speeds in the WIND SWEEP were in ft/sec (IXDIM = 0), thenthe GAEP wind speeds must be in ft/sec. Reminder that when the TSR SWEEP is used, thewind speeds must be in mph (IXDIM = 2). The unit for GAEP is kW hr.
Example:
GAEP 16 16 1 45
Results are written to the file gaep.dat.
HURRICANE Lines
The hurricane specs are set using
HURRICANE_SPECS [VMAX_HURRI] [CDMAX_HURRI]
where
VMAX_HURRI = wind speed [ft/sec]
CDMAX_HURRI = drag coefficient
This is the load per segment per one blade. The loads are then calculated using the followingline.
CALC_LOADS [IMODE] | [IOUT]
where
IMODE = 1 -> Calculate the hurricane loads based on the HURRICANE_SPECS line
2 -> Set the load based on the last prop.f run
IOUT = 1 -> Write output to screen
46

ITERMAX Line
When tolerances are specified for the automatic convergence mode, the maximum numberof iterations can be specified with
ITERMAX [ITERMAX]
where [ITERMAX] is the maximum number of iterations. Iteration will then be performeduntil either convergence is reached or the number of iterations exceeds the maximum speci-fied.
ITERPROP Line
The maximum number of iterations used for BEMT convergence can be set by
ITERPROP [ITERPROP]
where [ITERPROP] is the maximum number of iterations. This is used in prop.f.
LCOL45 Line
When in VS MODE, to optionally have Cp-TSR output to file 45 (ftn045.dat), use the ‘toggle’line
LCOL45
Note that in the example that follows, the input file must also include the VS MODE line aheadof this point.
Example:
LCOL45
PITCH_DP 1
TSR_SWEEP 4 15 .5
WIND_SWEEP 16 16 1 2
2D_SWEEP
WRITE_FILES 45
Applying the line LCOL45 again will toggle the function off.
PAUSE Line
To pause program execution, the input file should contain the line
PAUSE
Program execution will then continue when a [return] is entered interactively.
47
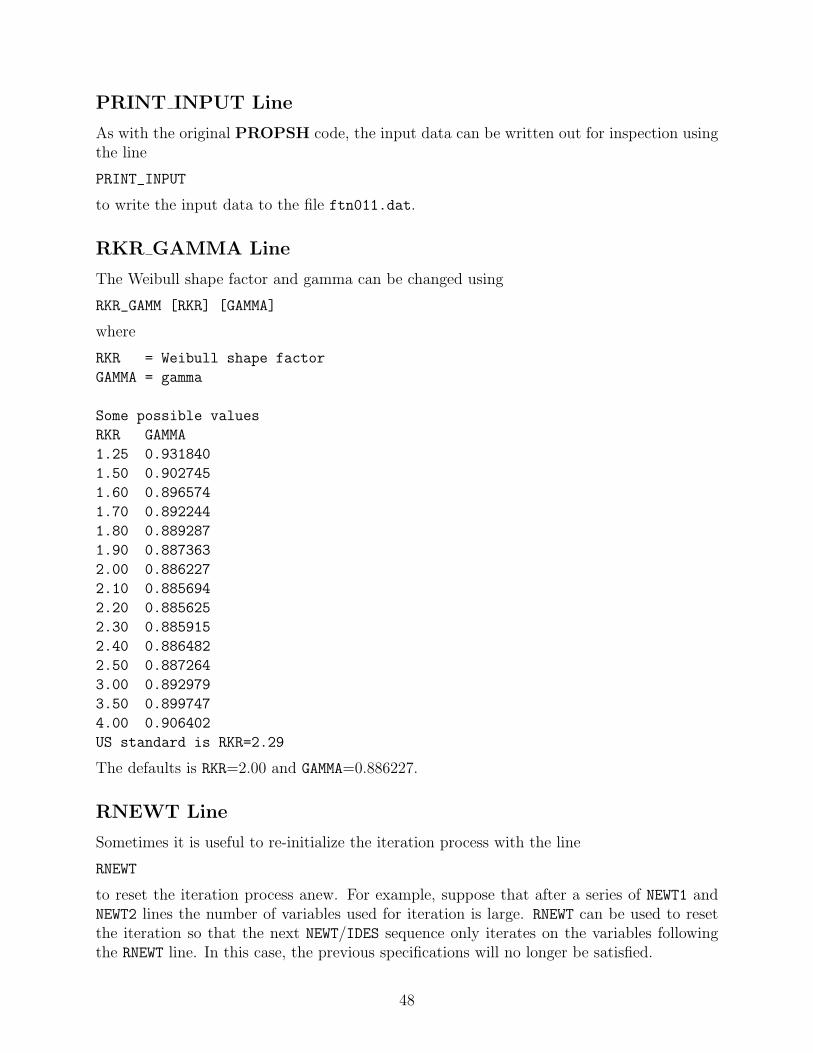
PRINT INPUT Line
As with the original PROPSH code, the input data can be written out for inspection usingthe line
PRINT_INPUT
to write the input data to the file ftn011.dat.
RKR GAMMA Line
The Weibull shape factor and gamma can be changed using
RKR_GAMM [RKR] [GAMMA]
where
RKR = Weibull shape factor
GAMMA = gamma
Some possible values
RKR GAMMA
1.25 0.931840
1.50 0.902745
1.60 0.896574
1.70 0.892244
1.80 0.889287
1.90 0.887363
2.00 0.886227
2.10 0.885694
2.20 0.885625
2.30 0.885915
2.40 0.886482
2.50 0.887264
3.00 0.892979
3.50 0.899747
4.00 0.906402
US standard is RKR=2.29
The defaults is RKR=2.00 and GAMMA=0.886227.
RNEWT Line
Sometimes it is useful to re-initialize the iteration process with the line
RNEWT
to reset the iteration process anew. For example, suppose that after a series of NEWT1 andNEWT2 lines the number of variables used for iteration is large. RNEWT can be used to resetthe iteration so that the next NEWT/IDES sequence only iterates on the variables followingthe RNEWT line. In this case, the previous specifications will no longer be satisfied.
48

RPRINT Line
The printing flags can be reset using
RPRINT
SKIP UNKNOWN WORDS Line
To have PROPID skip unknown lines, use the on/off toggle
SKIP_UNKNOWN_WORDS
SUMMARY INFO Line
To echo to screen the blade geometric data, use
SUMMARY_INFO
The program will report: blade radius (ft), area (ft2), solidity, aspect ratio, and pitch (lastused).
TIPSPEED Line
To determine the tipspeed for a given rpm, use
TIPSPEED [JDPRPM]
where
JDPRPM = design point # for the RPM to use
This tipspeed calculation does not include the wind speed component. It only includes ΩR.
VS MODE Line
For variable speed analysis with 2D SWEEP, the following line is required
VS_MODE
The line should be used one time and placed ahead of the first 2D SWEEP line. Two examplesare shown below.
Examples:
VS_MODE
PITCH_DP 1
WIND_SWEEP 5 50 1 2
TSR_SWEEP 9 9 0
2D_SWEEP
49

# Special lines required for variable speed turbines (File: wt08a.in)
LCOL45
VS_MODE
# Determine Cp curve
PITCH_DP 1
TSR_SWEEP .5 14 .25
WIND_SWEEP 16 16 1 2
2D_SWEEP
# 45 - Cp vs TSR
WRITE_FILES 45
WT NAME Line
Wind turbine design files can be given names in the input file by the line
WT_NAME [NAME]
where NAME is the name of the turbine.
ZERO TWIST Line
In some cases, it may be desirable to iterate on the twist along the entire blade span. Insuch instance, the twist at the 75% radial station will be adjusted from zero. Thus, the trueblade pitch is the specified blade pitch plus the twist at the 75% station. If the convergedinput data were written out with the DUMP PROPID line, the twist at the 75% station wouldnot be zero. Prior to the DUMP PROPID line, the ZERO TWIST line can be used to zero thetwist at the desired station by the line
ZERO_TWIST [RADLOC]
where RADLOC is the radius location for which the twist is to be zero. For example, to zerothe twist at the 75% station RADLOC should be set to 0.75. The ZERO TWIST line also properlyadjusts the pitch in the DP
indexdp@DP lines to reflect the true blade pitch with zero twist at the prescribed location.
10 Annotated Examples
Two examples are provided in this chapter: stall regulated turbine and variable speed tur-bine. Both examples have a design section and an analysis section. The input file for eachexample is given as well as the screen output from running PROPID. More examples canbe found in the runs directory.
50

10.1 Stall Regulated
The first example is of a stall regulated turbine. The example is based on the wt06a runcase. In this example, the peak power and tip speed have been specified. The rotor scale isiterated to achieve the peak power, and the rpm is iterated to achieve the tip speed.
# File: wt06a.in
# Stall Regulated Turbine
# Basic input
MODE 1.0 # wind turbine
INCV 0.0 # wind turbine mode
LTIP 1.0 # use tip loss model
LHUB 1.0 # use hub loss model
IBR 1.0 # use brake state model
ISTL 1.0 # use viterna stall model
USEAP 1.0 # use swirl suppression
WEXP 0.0 # boundary layer wind exponent
NS_NSEC 10.0 1.0 # number of blade elements/number of sectors
IS1 1.0 # first segment used in analysis
IS2 10.0 # last segment used in analysis
BE_DATA 1 # printout blade element data
SH 0.0 # shaft tilt effects
RHO 0.0023769 # air density (slug/ft^3)
# Geometry
HUB 0.04 # normalized hub cutout
HH 3.333 # normalized hub height
BN 3 # blade number
CONE 6.0 # cone angle of rotor (deg)
RD 24.61 # radius (ft)
CH_TW # Normalized chord and twist distribution
0.15 6
0.13 6
0.12 6
0.11 6
0.10 4
0.09 2
0.08 1
0.07 0
0.06 -1
0.05 -2
51

# No stall models used
#CORRIGAN_EXPN 1
# Corrigan inputs are present but not used since stall model is off
AIRFOIL_MODE 4
4
s814.pd
.24 13. 3 1.600 6
s814.pd
.24 13. 3 1.600 6
s812.pd
.21 14.3 3 1.180 6
s813.pd
.16 9. 3 1.100 6
# airfoil family 1 with 4 airfoils
# r/R-location and airfoil index
AIRFOIL_FAMILY 4
.0000 1
.3000 2
.7500 3
1.0000 4
# use the first airfoil family (the one above)
USE_AIRFOIL_FAMILY 1
# Enforce tip loss model to always be on
TIPON
# Use the Prandtl tip loss model,
# not the original modified model.
TIPMODE 2
# Design point: 64 rpm, 2 deg pitch, 15 mph
DP 1 64 2 15 2
# Specify the peak power (500 kW) and iterate on the rotor scale
NEWT1ISWP 300 500 25 50 1 1 1 999 1 1 999 .3
IDES
# Specify the tip speed (150 mph, 220 ft/sec) and
# iterate on the rpm at a given design point DP
NEWT1IDP 207 220 1 1 999 1 2 1
IDES
52

# Determine the rotor power, cp, and thrust curves (2D_SWEEP)
#
# use pitch setting from design point (DP) 1
PITCH_DP 1
# use rpm from design point (DP) 1
RPM_DP 1
# sweep the wind from 5 to 50 mph in increments of 1 mph
WIND_SWEEP 5 50 1 2
# perform the sweep
2D_SWEEP
# write out data to files
# 40 - power curve (kW) vs wind speed (mph)
# 45 - cp vs TSR
# 51 - rotor thrust curve
WRITE_FILES 40 45 51
# Obtain aero distributions along the blade (1D_SWEEP)
#
PITCH_DP 1
RPM_DP 1
WIND_SWEEP 5 30 5 2
1D_SWEEP
# write out
# 75 - blade l/d dist
# 76 - blade Re dist
# 80 - blade alfa dist
# 85 - blade cl dist
# 90 - blade a dist
# 95 - chord dist (ft-ft)
# 99 - alfa dist (ft-deg)
WRITE_FILES 75 76 80 85 90 95 99
# Annual energy production
GAEP 16 16 1 45
REPORT_START
# Report the last GAEP analysis case
REPORT_SPECIAL 8 999 999
REPORT_END
# Write out the rotor design parameters to file ftn021.dat
DUMP_PROPID
*
53
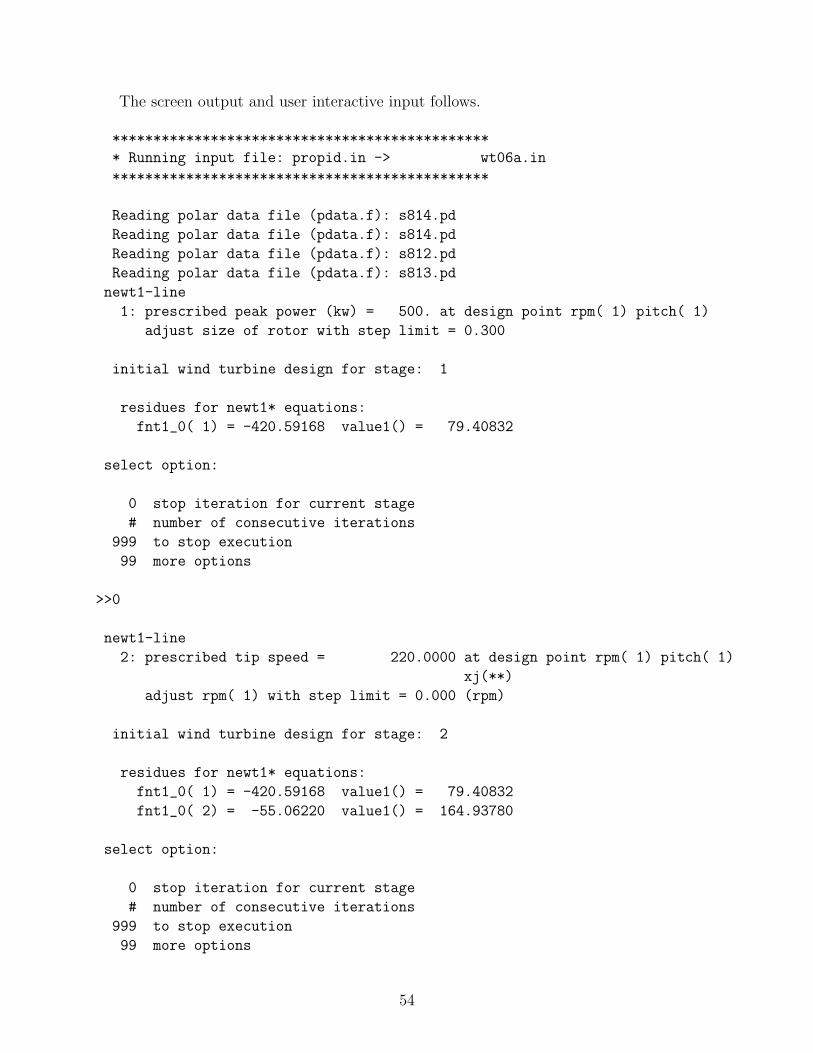
The screen output and user interactive input follows.
**********************************************
* Running input file: propid.in -> wt06a.in
**********************************************
Reading polar data file (pdata.f): s814.pd
Reading polar data file (pdata.f): s814.pd
Reading polar data file (pdata.f): s812.pd
Reading polar data file (pdata.f): s813.pd
newt1-line
1: prescribed peak power (kw) = 500. at design point rpm( 1) pitch( 1)
adjust size of rotor with step limit = 0.300
initial wind turbine design for stage: 1
residues for newt1* equations:
fnt1_0( 1) = -420.59168 value1() = 79.40832
select option:
0 stop iteration for current stage
# number of consecutive iterations
999 to stop execution
99 more options
>>0
newt1-line
2: prescribed tip speed = 220.0000 at design point rpm( 1) pitch( 1)
xj(**)
adjust rpm( 1) with step limit = 0.000 (rpm)
initial wind turbine design for stage: 2
residues for newt1* equations:
fnt1_0( 1) = -420.59168 value1() = 79.40832
fnt1_0( 2) = -55.06220 value1() = 164.93780
select option:
0 stop iteration for current stage
# number of consecutive iterations
999 to stop execution
99 more options
54

>>6
in consecutive iteration mode...
iteration 1
calculating sensitivities for newt1 design parameter: 1
calculating sensitivities for newt1 design parameter: 2
residues for newt1* equations:
fnt1_1( 1) = -329.09534 value1() = 170.90466 deltas1() = 0.30000
clamp1() = 0.300
fnt1_1( 2) = -41.20694 value1() = 178.79306 deltas1() = ********
iteration 2
calculating sensitivities for newt1 design parameter: 1
calculating sensitivities for newt1 design parameter: 2
residues for newt1* equations:
fnt1_1( 1) = -149.57228 value1() = 350.42772 deltas1() = 0.30000
clamp1() = 0.300
fnt1_1( 2) = -29.37127 value1() = 190.62873 deltas1() = -9.59874
iteration 3
calculating sensitivities for newt1 design parameter: 1
calculating sensitivities for newt1 design parameter: 2
residues for newt1* equations:
fnt1_1( 1) = -8.00111 value1() = 491.99889 deltas1() = -0.03103
clamp1() = 0.300
fnt1_1( 2) = -2.52905 value1() = 217.47095 deltas1() = 7.76284
iteration 4
calculating sensitivities for newt1 design parameter: 1
calculating sensitivities for newt1 design parameter: 2
residues for newt1* equations:
fnt1_1( 1) = -3.90724 value1() = 496.09276 deltas1() = -0.01068
clamp1() = 0.300
fnt1_1( 2) = -0.28724 value1() = 219.71276 deltas1() = 1.09330
iteration 5
calculating sensitivities for newt1 design parameter: 1
calculating sensitivities for newt1 design parameter: 2
55

residues for newt1* equations:
fnt1_1( 1) = 0.09755 value1() = 500.09755 deltas1() = 0.00191
clamp1() = 0.300
fnt1_1( 2) = 0.00614 value1() = 220.00614 deltas1() = -0.03003
iteration 6
calculating sensitivities for newt1 design parameter: 1
calculating sensitivities for newt1 design parameter: 2
residues for newt1* equations:
fnt1_1( 1) = -0.00094 value1() = 499.99906 deltas1() = -0.00005
clamp1() = 0.300
fnt1_1( 2) = -0.00002 value1() = 219.99998 deltas1() = 0.00134
select option:
0 stop iteration for current stage
# number of consecutive iterations
999 to stop execution
99 more options
>>1
iteration 7
calculating sensitivities for newt1 design parameter: 1
calculating sensitivities for newt1 design parameter: 2
residues for newt1* equations:
fnt1_1( 1) = -0.00002 value1() = 499.99998 deltas1() = 0.00000
clamp1() = 0.300
fnt1_1( 2) = 0.00000 value1() = 220.00000 deltas1() = -0.00004
select option:
0 stop iteration for current stage
# number of consecutive iterations
999 to stop execution
99 more options
>>0
Performing 2D sweep analysis.
-> Done performing 2D sweep analysis.
**********************************************
* Output
56

* --------------------------------------------
* rotor p vs v --> ftn040.dat
* rotor cp vs x --> ftn045.dat
* rotor thrust vs wind speed --> ftn051.dat
**********************************************
Performing 1D sweep analysis.
->Done performing 1D sweep analysis.
**********************************************
* Output
* --------------------------------------------
* blade l/d dist --> ftn075.dat
* blade Re dist --> ftn076.dat
* blade alfa dist --> ftn080.dat
* blade cl dist --> ftn085.dat
* blade a dist --> ftn090.dat
* blade chord (ft) --> ftn095.dat
* blade twist (ft) --> ftn099.dat
**********************************************
... determining annual energy
Defaults used
Weibull shape factor: 2.000
Gamma: 0.886227
Wind speed (mph) Annual energy (kwh/yr)
16.00 692334.72
************** Reporting On ************** ( 1)
average wind speed (mph) = 16.000 ( 2)
cutout wind speed (mph) = 45.000 ( 3)
aep (kWh/yr/turb) = 692334.725 ( 4)
geneff = 1.000 ( 5)
************** Reporting Off ************* ( 6)
*******************************************
* Writing propid dump file --> ftn021.dat *
*******************************************
Warning 450:
loobug = tt --> airfoil Re < Re of data somewhere
(endprog.f)
Warning 451:
57

looblg = tt --> airfoil Re > Re of data somewhere
(endprog.f)
**********************************************
* PROPID: Successful run.
* Closing input file: propid.in -> wt06a.in
**********************************************
The >> are user supplied input during the PROPID execution.
10.2 Variable Speed
This example is for a variable speed turbine. The input file is based on the wt09b run case.In this example, the rpm is iterated to achieve a tip speed ratio of 6. The rotor is scaled toachieve a rated power of 1 MW, and the pitch and twist are iterated to achieve a desired liftcoefficient distribution. Finally the chord is iterated to achieve an axial induction factor of0.333. Some report lines are also included in this case. The input file is essentially converged,but a few iterations will still be performed.
# File wt09b.in
# Variable Speed Turbine
#
# Debugging Feature:
# Echo the input lines ... to the screen.
# The error can be isolated to one line.
#ECHO_INPUT
# This file includes converged data from wt09a.in.
# Basic input
MODE 1.0 # wind turbine
INCV 0.0 # wind turbine mode
LTIP 1.0 # use tip loss model
LHUB 1.0 # use hub loss model
IBR 1.0 # use brake state model
ISTL 1.0 # use viterna stall model
USEAP 1.0 # use swirl suppression
WEXP 0.0 # boundary layer wind exponent
NS_NSEC 10.0 1.0 # number of blade elements/number of sectors
IS1 1.0 # first segment used in analysis
IS2 10.0 # last segment used in analysis
BE_DATA 0 # do not printout blade element data
SH 0.0 # shaft tilt effects
RHO 0.0023769 # air density (slug/ft^3)
58

# Geometry
HUB 0.04 # normalized hub cutout
HH 3.333 # normalized hub height
BN 3 # blade number
CONE 6.0 # cone angle of rotor (deg)
RD 77.705510
CH_TW
0.145723 6.0000
0.151691 6.4688
0.129292 -4.5342
0.107709 -11.2173
0.092047 -14.9966
0.080868 2.6548
0.072591 1.1105
0.065723 0.0000
0.057635 -0.3695
0.039502 -0.5392
# No stall models used
#CORRIGAN_EXPN 1
# Corrigan inputs are present but not used since stall model is off
AIRFOIL_MODE 4
4
s814.pd
.24 13. 3 1.600 6
s814.pd
.24 13. 3 1.600 6
s812.pd
.21 14.3 3 1.180 6
s813.pd
.16 9. 3 1.100 6
# airfoil family 1 with 4 airfoils
# r/R-location and airfoil index
AIRFOIL_FAMILY 4
.0000 1
.3000 2
.7500 3
1.0000 4
# use the first airfoil family (the one above)
USE_AIRFOIL_FAMILY 1
59

# Enforce tip loss model to always be on
TIPON
# Use the Prandtl tip loss model,
# not the original modified model.
TIPMODE 2
# Two design points with wind speeds (mph) that do not change.
# The RPM of both lines is iterated to achieve a fixed TSR of 6.
# The blade pitch of the first line is iterated for Cl(8).
# The blade pitch for the second DP is not used, hence 999.
DP 1 17.3030 1.689 16 2
DP 2 32.4432 999.000 30 2
DRY # All IDES lines will be ignored until DRY is encountered again below
# Desired Cl distribution @ DP 1 1 1
# Seg radial loc Cl
# 1 no spec for this segment
# 2 0.15 1.30
# 3 0.25 1.25
# 4 0.35 1.20
# 5 0.45 1.15
# 6 0.55 1.10
# 7 0.65 1.05
# 8 0.75 1.00
# 9 0.85 0.95
# 10 0.95 0.90
# Stage 1
# Iterate on the RPM(DP1) to get a tip speed of
# Specify a tip speed (TSR * wind speed)
# to be consistent with the design tip speed ratio of 6
# and the given wind speed (DP1). For the first design
# point with a wind speed of 16 mph,
# tip speed is
# 6 * (16*88/60) = 140.8
NEWT1IDP 207 140.8 1 999 1 1 2 1
IDES
# Stage 2
# Do the same thing for the second design point, iterating
# on its RPM to yield a TSR of 6.
60

# For DP2, the wind speed is 30 mph. Hence the tip speed is
# 6 * (30*88/60) = 264
NEWT1IDP 207 264 2 999 2 1 2 2
IDES
# Write out the results
REPORT_START
REPORT_DP 1 1 1
REPORT_1IDP 207 1 999 1
REPORT_1IDP 208 1 999 1
REPORT_SEPARATOR
REPORT_DP 2 2 2
REPORT_1IDP 207 2 999 2
REPORT_1IDP 208 1 999 1
# Stage 3
# Specify the rated power to be 1000 kW (1MW)
# at 30 mph (DP2).
# Remember to also update the FIXPD line below to
# crop the power curve at this set level (1 MW)
NEWT1IDP 200 1000 2 1 2 1 1 999
IDES
# Stage 4
# Iterate on pitch to get cl(r/R=.75) = 1.00
NEWT1LDP 500 8 1.00 1 1 1 1 3 1 .75
IDES
# Stage 5
# Iterate on twist to get cl 9-10
NEWT2SDDP 100 9 10 8 2
1 -.05
2 -.10
1 1 1 2 100 .75
IDES
# Stage 6
# Iterate on twist to get cl 2-7
NEWT2SDDP 100 2 7 8 6
1 .30
2 .25
61

3 .20
4 .15
5 .10
6 .05
1 1 1 2 100 .75
IDES
# Stage 7
# Iterate on chord uniformly to get axial inflow(r/R=.75) = .333
NEWT1LDP 501 8 .333 1 1 1 2 999 100 .02
IDES
# Stage 8
# Iterate on chord to get axial inflow 9-10
NEWT2SDDP 101 9 10 8 2
1 .0
2 .0
1 1 1 1 100 .02
IDES
# Stage 9
# Iterate on chord to get axial inflow 2-7
NEWT2SDDP 101 2 7 8 6
1 .0
2 .0
3 .0
4 .0
5 .0
6 .0
1 1 1 1 100 .02
DRY # turn off dry run so that the following IDES line will start the iteration
IDES
# Special lines required for variable speed turbines
LCOL45
VS_MODE
# Determine cp curve
PITCH_DP 1
TSR_SWEEP .5 14 .25
WIND_SWEEP 16 16 1 2
2D_SWEEP
# 45 - cp vs TSR
WRITE_FILES 45
62

# Determine the rotor power and thrust curves (2D_SWEEP)
FIXPD 1000 1
PITCH_DP 1
TSR_SWEEP 6 6 0
WIND_SWEEP 5 50 1 2
2D_SWEEP
# write out
# 40 - power curve (kW) vs wind speed (mph)
# 51 - rotor thrust curve
WRITE_FILES 40 51
# Obtain aero distributions along the blade (1D_SWEEP)
#
PITCH_DP 1
RPM_DP 1
WIND_DP 1
1D_SWEEP
# write out
# 75 - blade l/d dist
# 76 - blade Re dist
# 80 - blade alfa dist
# 85 - blade cl dist
# 90 - blade a dist
# 95 - chord dist (ft-ft)
# 99 - twist dist (ft-deg)
WRITE_FILES 75 76 80 85 90 95 99
# Annual energy production
GAEP 16 16 1 45
# Report the last GAEP analysis case
REPORT_SPECIAL 8 999 999
REPORT_END
# Write out the rotor design parameters to file ftn021.dat
DUMP_PROPID
*
The screen output and user interactive input follows.
**********************************************
* Running input file: propid.in -> wt09b-man.in
**********************************************
63
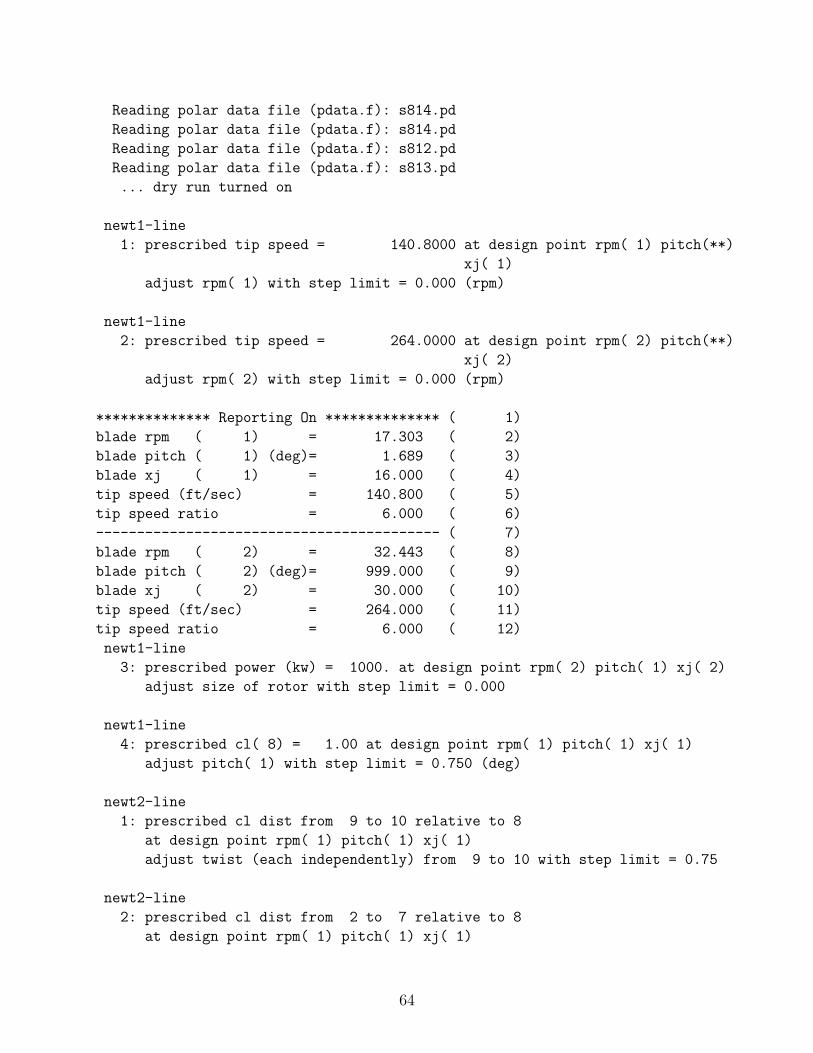
Reading polar data file (pdata.f): s814.pd
Reading polar data file (pdata.f): s814.pd
Reading polar data file (pdata.f): s812.pd
Reading polar data file (pdata.f): s813.pd
... dry run turned on
newt1-line
1: prescribed tip speed = 140.8000 at design point rpm( 1) pitch(**)
xj( 1)
adjust rpm( 1) with step limit = 0.000 (rpm)
newt1-line
2: prescribed tip speed = 264.0000 at design point rpm( 2) pitch(**)
xj( 2)
adjust rpm( 2) with step limit = 0.000 (rpm)
************** Reporting On ************** ( 1)
blade rpm ( 1) = 17.303 ( 2)
blade pitch ( 1) (deg)= 1.689 ( 3)
blade xj ( 1) = 16.000 ( 4)
tip speed (ft/sec) = 140.800 ( 5)
tip speed ratio = 6.000 ( 6)
------------------------------------------ ( 7)
blade rpm ( 2) = 32.443 ( 8)
blade pitch ( 2) (deg)= 999.000 ( 9)
blade xj ( 2) = 30.000 ( 10)
tip speed (ft/sec) = 264.000 ( 11)
tip speed ratio = 6.000 ( 12)
newt1-line
3: prescribed power (kw) = 1000. at design point rpm( 2) pitch( 1) xj( 2)
adjust size of rotor with step limit = 0.000
newt1-line
4: prescribed cl( 8) = 1.00 at design point rpm( 1) pitch( 1) xj( 1)
adjust pitch( 1) with step limit = 0.750 (deg)
newt2-line
1: prescribed cl dist from 9 to 10 relative to 8
at design point rpm( 1) pitch( 1) xj( 1)
adjust twist (each independently) from 9 to 10 with step limit = 0.75
newt2-line
2: prescribed cl dist from 2 to 7 relative to 8
at design point rpm( 1) pitch( 1) xj( 1)
64

adjust twist (each independently) from 2 to 7 with step limit = 0.75
newt1-line
5: prescribed a( 8) = 0.333 at design point rpm( 1) pitch( 1) xj( 1)
adjust chord uniformly with step limit = 0.020
newt2-line
3: prescribed a dist from 9 to 10 relative to 8
at design point rpm( 1) pitch( 1) xj( 1)
adjust chord (each independently) from 9 to 10 with step limit = 0.02
newt2-line
4: prescribed a dist from 2 to 7 relative to 8
at design point rpm( 1) pitch( 1) xj( 1)
adjust chord (each independently) from 2 to 7 with step limit = 0.02
... dry run turned off
initial wind turbine design for stage: 9
residues for newt1* equations:
fnt1_0( 1) = -0.00026 value1() = 140.79974
fnt1_0( 2) = 0.00012 value1() = 264.00012
fnt1_0( 3) = -0.02604 value1() = 999.97396
fnt1_0( 4) = 0.00002 value1() = 1.00002
fnt1_0( 5) = 0.00001 value1() = 0.33301
residues for newt2* equations:
fnt2_0( 1) = 0.00000 value2() = 0.95002
fnt2_0( 2) = 0.00000 value2() = 0.90003
fnt2_0( 3) = -0.00006 value2() = 1.29996
fnt2_0( 4) = -0.00004 value2() = 1.24998
fnt2_0( 5) = -0.00004 value2() = 1.19999
fnt2_0( 6) = -0.00003 value2() = 1.14999
fnt2_0( 7) = 0.00000 value2() = 1.10002
fnt2_0( 8) = 0.00000 value2() = 1.05002
fnt2_0( 9) = 0.00000 value2() = 0.33301
fnt2_0(10) = 0.00000 value2() = 0.33301
fnt2_0(11) = -0.00003 value2() = 0.33298
fnt2_0(12) = -0.00002 value2() = 0.33299
fnt2_0(13) = -0.00002 value2() = 0.33299
fnt2_0(14) = -0.00002 value2() = 0.33299
fnt2_0(15) = 0.00000 value2() = 0.33301
fnt2_0(16) = 0.00000 value2() = 0.33301
65

select option:
0 stop iteration for current stage
# number of consecutive iterations
999 to stop execution
99 more options
>>3
in consecutive iteration mode...
iteration 1
calculating sensitivities for newt1 design parameter: 1
calculating sensitivities for newt1 design parameter: 2
calculating sensitivities for newt1 design parameter: 3
calculating sensitivities for newt1 design parameter: 4
calculating sensitivities for newt1 design parameter: 5
calculating sensitivities for newt2 design parameter: 1
calculating sensitivities for newt2 design parameter: 2
calculating sensitivities for newt2 design parameter: 3
calculating sensitivities for newt2 design parameter: 4
calculating sensitivities for newt2 design parameter: 5
calculating sensitivities for newt2 design parameter: 6
calculating sensitivities for newt2 design parameter: 7
calculating sensitivities for newt2 design parameter: 8
calculating sensitivities for newt2 design parameter: 9
calculating sensitivities for newt2 design parameter: 10
calculating sensitivities for newt2 design parameter: 11
calculating sensitivities for newt2 design parameter: 12
calculating sensitivities for newt2 design parameter: 13
calculating sensitivities for newt2 design parameter: 14
calculating sensitivities for newt2 design parameter: 15
calculating sensitivities for newt2 design parameter: 16
residues for newt1* equations:
fnt1_1( 1) = -0.01466 value1() = 140.78534 deltas1() = 0.00004
fnt1_1( 2) = -0.02749 value1() = 263.97251 deltas1() = 0.00001
fnt1_1( 3) = -0.36556 value1() = 999.63444 deltas1() = 0.00000
fnt1_1( 4) = 0.00010 value1() = 1.00010 deltas1() = 0.00041
clamp1() = 0.750
fnt1_1( 5) = -0.00006 value1() = 0.33294 deltas1() = 0.00000
clamp1() = 0.020
residues for newt2* equations:
fnt2_1( 1) = -0.00001 value2() = 0.95009 deltas2() = -0.00004
66

clamp2() = 0.750
fnt2_1( 2) = 0.00000 value2() = 0.90010 deltas2() = -0.00003
clamp2() = 0.750
fnt2_1( 3) = -0.00049 value2() = 1.29961 deltas2() = -0.00005
clamp2() = 0.750
fnt2_1( 4) = -0.00029 value2() = 1.24981 deltas2() = 0.00006
clamp2() = 0.750
fnt2_1( 5) = -0.00022 value2() = 1.19989 deltas2() = 0.00003
clamp2() = 0.750
fnt2_1( 6) = -0.00018 value2() = 1.14993 deltas2() = 0.00007
clamp2() = 0.750
fnt2_1( 7) = 0.00004 value2() = 1.10015 deltas2() = 0.00001
clamp2() = 0.750
fnt2_1( 8) = 0.00002 value2() = 1.05013 deltas2() = -0.00004
clamp2() = 0.750
fnt2_1( 9) = 0.00001 value2() = 0.33295 deltas2() = 0.00000
clamp2() = 0.020
fnt2_1(10) = 0.00003 value2() = 0.33297 deltas2() = 0.00000
clamp2() = 0.020
fnt2_1(11) = -0.00023 value2() = 0.33272 deltas2() = 0.00000
clamp2() = 0.020
fnt2_1(12) = -0.00015 value2() = 0.33279 deltas2() = 0.00000
clamp2() = 0.020
fnt2_1(13) = -0.00013 value2() = 0.33282 deltas2() = 0.00000
clamp2() = 0.020
fnt2_1(14) = -0.00011 value2() = 0.33283 deltas2() = 0.00000
clamp2() = 0.020
fnt2_1(15) = 0.00002 value2() = 0.33296 deltas2() = 0.00000
clamp2() = 0.020
fnt2_1(16) = 0.00001 value2() = 0.33295 deltas2() = 0.00000
clamp2() = 0.020
iteration 2
calculating sensitivities for newt1 design parameter: 1
calculating sensitivities for newt1 design parameter: 2
calculating sensitivities for newt1 design parameter: 3
calculating sensitivities for newt1 design parameter: 4
calculating sensitivities for newt1 design parameter: 5
calculating sensitivities for newt2 design parameter: 1
calculating sensitivities for newt2 design parameter: 2
calculating sensitivities for newt2 design parameter: 3
calculating sensitivities for newt2 design parameter: 4
calculating sensitivities for newt2 design parameter: 5
calculating sensitivities for newt2 design parameter: 6
calculating sensitivities for newt2 design parameter: 7
67

calculating sensitivities for newt2 design parameter: 8
calculating sensitivities for newt2 design parameter: 9
calculating sensitivities for newt2 design parameter: 10
calculating sensitivities for newt2 design parameter: 11
calculating sensitivities for newt2 design parameter: 12
calculating sensitivities for newt2 design parameter: 13
calculating sensitivities for newt2 design parameter: 14
calculating sensitivities for newt2 design parameter: 15
calculating sensitivities for newt2 design parameter: 16
residues for newt1* equations:
fnt1_1( 1) = 0.00000 value1() = 140.80000 deltas1() = -0.00002
fnt1_1( 2) = 0.00000 value1() = 264.00000 deltas1() = -0.00005
fnt1_1( 3) = 0.00244 value1() = 1000.00244 deltas1() = 0.00011
fnt1_1( 4) = 0.00000 value1() = 1.00000 deltas1() = -0.00001
clamp1() = 0.750
fnt1_1( 5) = 0.00000 value1() = 0.33300 deltas1() = 0.00000
clamp1() = 0.020
residues for newt2* equations:
fnt2_1( 1) = 0.00000 value2() = 0.95000 deltas2() = 0.00001
clamp2() = 0.750
fnt2_1( 2) = 0.00000 value2() = 0.90000 deltas2() = 0.00002
clamp2() = 0.750
fnt2_1( 3) = 0.00001 value2() = 1.30001 deltas2() = 0.00003
clamp2() = 0.750
fnt2_1( 4) = 0.00000 value2() = 1.25000 deltas2() = -0.00001
clamp2() = 0.750
fnt2_1( 5) = 0.00000 value2() = 1.20000 deltas2() = 0.00002
clamp2() = 0.750
fnt2_1( 6) = 0.00000 value2() = 1.15000 deltas2() = 0.00000
clamp2() = 0.750
fnt2_1( 7) = 0.00000 value2() = 1.10000 deltas2() = -0.00001
clamp2() = 0.750
fnt2_1( 8) = 0.00000 value2() = 1.05000 deltas2() = -0.00001
clamp2() = 0.750
fnt2_1( 9) = 0.00000 value2() = 0.33300 deltas2() = 0.00000
clamp2() = 0.020
fnt2_1(10) = 0.00000 value2() = 0.33300 deltas2() = 0.00000
clamp2() = 0.020
fnt2_1(11) = 0.00001 value2() = 0.33301 deltas2() = 0.00000
clamp2() = 0.020
fnt2_1(12) = 0.00000 value2() = 0.33300 deltas2() = 0.00000
clamp2() = 0.020
fnt2_1(13) = 0.00000 value2() = 0.33300 deltas2() = 0.00000
68

clamp2() = 0.020
fnt2_1(14) = 0.00000 value2() = 0.33300 deltas2() = 0.00000
clamp2() = 0.020
fnt2_1(15) = 0.00000 value2() = 0.33300 deltas2() = 0.00000
clamp2() = 0.020
fnt2_1(16) = 0.00000 value2() = 0.33300 deltas2() = 0.00000
clamp2() = 0.020
iteration 3
calculating sensitivities for newt1 design parameter: 1
calculating sensitivities for newt1 design parameter: 2
calculating sensitivities for newt1 design parameter: 3
calculating sensitivities for newt1 design parameter: 4
calculating sensitivities for newt1 design parameter: 5
calculating sensitivities for newt2 design parameter: 1
calculating sensitivities for newt2 design parameter: 2
calculating sensitivities for newt2 design parameter: 3
calculating sensitivities for newt2 design parameter: 4
calculating sensitivities for newt2 design parameter: 5
calculating sensitivities for newt2 design parameter: 6
calculating sensitivities for newt2 design parameter: 7
calculating sensitivities for newt2 design parameter: 8
calculating sensitivities for newt2 design parameter: 9
calculating sensitivities for newt2 design parameter: 10
calculating sensitivities for newt2 design parameter: 11
calculating sensitivities for newt2 design parameter: 12
calculating sensitivities for newt2 design parameter: 13
calculating sensitivities for newt2 design parameter: 14
calculating sensitivities for newt2 design parameter: 15
calculating sensitivities for newt2 design parameter: 16
residues for newt1* equations:
fnt1_1( 1) = 0.00000 value1() = 140.80000 deltas1() = 0.00001
fnt1_1( 2) = 0.00000 value1() = 264.00000 deltas1() = 0.00003
fnt1_1( 3) = -0.00017 value1() = 999.99983 deltas1() = 0.00000
fnt1_1( 4) = 0.00000 value1() = 1.00000 deltas1() = 0.00001
clamp1() = 0.750
fnt1_1( 5) = 0.00000 value1() = 0.33300 deltas1() = 0.00000
clamp1() = 0.020
residues for newt2* equations:
fnt2_1( 1) = 0.00000 value2() = 0.95000 deltas2() = 0.00000
clamp2() = 0.750
fnt2_1( 2) = 0.00000 value2() = 0.90000 deltas2() = -0.00001
clamp2() = 0.750
69

fnt2_1( 3) = -0.00001 value2() = 1.29999 deltas2() = -0.00003
clamp2() = 0.750
fnt2_1( 4) = 0.00000 value2() = 1.25000 deltas2() = -0.00003
clamp2() = 0.750
fnt2_1( 5) = 0.00000 value2() = 1.20000 deltas2() = -0.00001
clamp2() = 0.750
fnt2_1( 6) = 0.00000 value2() = 1.15000 deltas2() = -0.00001
clamp2() = 0.750
fnt2_1( 7) = 0.00000 value2() = 1.10000 deltas2() = -0.00001
clamp2() = 0.750
fnt2_1( 8) = 0.00000 value2() = 1.05000 deltas2() = 0.00002
clamp2() = 0.750
fnt2_1( 9) = 0.00000 value2() = 0.33300 deltas2() = 0.00000
clamp2() = 0.020
fnt2_1(10) = 0.00000 value2() = 0.33300 deltas2() = 0.00000
clamp2() = 0.020
fnt2_1(11) = 0.00000 value2() = 0.33300 deltas2() = 0.00000
clamp2() = 0.020
fnt2_1(12) = 0.00000 value2() = 0.33300 deltas2() = 0.00000
clamp2() = 0.020
fnt2_1(13) = 0.00000 value2() = 0.33300 deltas2() = 0.00000
clamp2() = 0.020
fnt2_1(14) = 0.00000 value2() = 0.33300 deltas2() = 0.00000
clamp2() = 0.020
fnt2_1(15) = 0.00000 value2() = 0.33300 deltas2() = 0.00000
clamp2() = 0.020
fnt2_1(16) = 0.00000 value2() = 0.33300 deltas2() = 0.00000
clamp2() = 0.020
select option:
0 stop iteration for current stage
# number of consecutive iterations
999 to stop execution
99 more options
>>0
Note 10: running in variable-speed (const tsr) mode.
Performing 2D sweep analysis.
-> Done performing 2D sweep analysis.
**********************************************
* Output
70

* --------------------------------------------
* rotor cp vs v --> ftn045.dat
**********************************************
Performing 2D sweep analysis.
-> Done performing 2D sweep analysis.
**********************************************
* Output
* --------------------------------------------
* rotor p vs v --> ftn040.dat
* rotor thrust vs wind speed --> ftn051.dat
**********************************************
Performing 1D sweep analysis.
->Done performing 1D sweep analysis.
**********************************************
* Output
* --------------------------------------------
* blade l/d dist --> ftn075.dat
* blade Re dist --> ftn076.dat
* blade alfa dist --> ftn080.dat
* blade cl dist --> ftn085.dat
* blade a dist --> ftn090.dat
* blade chord (ft) --> ftn095.dat
* blade twist (ft) --> ftn099.dat
**********************************************
... determining annual energy
Defaults used
Weibull shape factor: 2.000
Gamma: 0.886227
Wind speed (mph) Annual energy (kwh/yr)
16.00 2175948.18
average wind speed (mph) = 16.000 ( 13)
cutout wind speed (mph) = 45.000 ( 14)
aep (kWh/yr/turb) = 2175948.184 ( 15)
geneff = 1.000 ( 16)
************** Reporting Off ************* ( 17)
*******************************************
71

* Writing propid dump file --> ftn021.dat *
*******************************************
Warning 450:
loobug = tt --> airfoil Re < Re of data somewhere
(endprog.f)
Warning 451:
looblg = tt --> airfoil Re > Re of data somewhere
(endprog.f)
**********************************************
* PROPID: Successful run.
* Closing input file: propid.in -> wt09b-man.in
**********************************************
The >> are user supplied input during the PROPID execution.
References
[1] Selig, M.S. and Tangler, J.L., “A Multipoint Inverse Design Method for Horizontal AxisWind Turbines,” presented at the AWEA WINDPOWER ’94 Conference, Minneapolis,Minnesota, May 9–12, 1994.
[2] Selig, M.S. and Maughmer, M.D., “Multipoint Inverse Airfoil Design Method Based onConformal Mapping,” AIAA Journal , Vol. 30, No. 5, May 1992, pp. 1162–1170.
[3] Selig, M.S., “Multipoint Inverse Design of an Infinite Cascade of Airfoils,” AIAA Journal ,Vol. 32, No. 4, 1994, pp. 774–782.
[4] Tangler, J., Smith, B., Kelley, N., and Jager, D., “Measured and Predicted Rotor Perfor-mance for the SERI Advanced Wind Turbine Blades,” NREL/TP-257-4594, Feb. 1992.
[5] Hibbs, B. and Radkey, R.L., “Small Wind Energy Conversion Systems (SWECS) Ro-tor Performance Model Comparison Study,” Aerovironment, Inc. prepared for RockwellInternational Corporation, Nov. 1981.
[6] Tangler, J.L., “A Horizontal Axis Wind Turbine Performance Prediction Code for Per-sonal Computers (User’s Guide),” Solar Energy Research Institure, Jan. 1987.
[7] Corrigan, J.J. and Schilling, J.J., “Empirical Model for Stall Delay Due to Rotation,”American Helicopter Society Aeromechanics Specialists Conf., San Francisco, CA, Jan.1994.
[8] Tangler, J.L. and Selig, M.S., “An Evaluation of an Empirical Model for Stall DelayDue to Rotation for HAWTs,” American Wind Energy Association WINDPOWER 1997Conference, Austin, TX, 1997.
72

NO WARRANTY
The author and the University of Illinois make NO WARRANTY or representation, eitherexpressed or implied, with respect to this software, its quality, accuracy, merchantability, orfitness for a particular purpose. This software is provided “AS IS,” and you, its user, assumethe entire risk as to its quality and accuracy.
Appendix A: Stall Angle, Stall Delay Angle, and Re-
lated Angles
Foreword
The following describes the reasons and conventions for the various angles used in definingthe airfoil data in PROPID (Mode 3 and 4).
Discussion
In all of the following figures, points A, B, C, etc will denote points on the lift curve. Thesolid black line is the original lift curve. The red curve indicates that a parameter has beenmodified, and the resulting lift curve has been generated. The black dotted lines are used tolocate points on the curves.
Figure 6 shows the basic approach taken in defining the Cl-α curve in PROPID. Thedata input to PROPID via the *.pd file is indicated by the points A-B-C-E. The lift curvegenerated by PROPID is A-B-C-D. The stall angle at point B is specified by the user. Thestall delay angle B-C is also user-defined. If no post stall models are on, PROPID addsthe stall delay angle to the stall angle and holds the cl constant over that range (taking theconstant from the value at point B). The flat-plate model starts at point C, and the liftcurve proceeds to point D and beyond. The location of point C on B-E will depend on themagnitude of the stall delay angle. This is explained in Figure 7.
This approach to defining the airfoil Cl-α curve is best when airfoil data up to stall isavailable, and the airfoil is known to have a gentle stall and data after stall is not available.
The history behind having a variable stall delay angle B-C traces to when a stall delayangle was used to model the stall delay effect of constant-speed stall-regulated wind turbines.This stall delay effect is largest over the inboard part of the blade and is reduced to a neglibleamount outboard. In other words, the delay stall inboard can be modeled by using a higherstall delay inboard than outboard which should behave in a 2D manner with no stall delayother than that of the 2D performance. By varying the stall delay angle, the importance ofblade rotation effects that cause stall delay can be examined.
Figure 7 shows the effect of increasing the stall delay angle. A larger stall delay anglemoves point C to C’ as shown in the figure. The flat plate model will start at point C’.Points A-B-C’-D’ will now describe the lift curve.
Figure 8 shows that PROPID does not use any of the input data after the stall angle.As shown, the code takes the Cl value at the stall angle B’ and holds that value until stall
73

Figure 6: Description of basic angles: stall angle and stall delay angle.
at point C’. Note that for the case shown, the stall delay angle B’-C’ is increased over thatused in Fig. 7. The flat plate model starts for angles higher than stall + stall delay.
In developing the code, this approach was taken so that the effects of a lower Clmaxcould
be rapidly modeled by simply changing the user-prescribed stall angle of attack B’.Figure 9 shows (among other cases) the approach to take when the entire stall behavior
is known and represented in the tabulated airfoil data given in the *.pd file. First, A-B-Cshows the Cl-α data known from experiment. At the stall angle C, the flat plate modelbegins and extends the curve to point D and then to higher angles (not shown). To initiatethe start of the flat plate model at point C, the stall delay angle has been set to zero. Thisapproach is the prefered approach when the stall data is known and representative of theairfoil behavior on the blade.
Two other cases are also shown to illustrate and amplify the effects that the variousangles can have. First, if the stall angle is set at point B’ and a non-zero stall delay angleis used, the clmax is set to that value at point B’ and held to point B’+C”. If on the otherhand the stall delay angle is set to zero, point C” moves to C’ and the flat plate modelthen begins at point B’/C’. Thus, it is quite important to understand the meanings of theseangles and to set them appropriately.
Figure 10 shows the data generation when using UIUC post-stall model. First, it isimportant to note that the post stall models can be used with stall delay, and the modelsbuild the 3D data based on the 2D data as partly defined by the stall and stall delay angles.In the case of the Corrigan model, the lift curve A-E-F-G will follow the shape of the input2D lift curve A-B-C-D exactly (this is not the case shown). The Corrigan stall curve (thoughstalling at a higher angle) follows the 2D curve because the 3D data is generated by simplyadding a constant increment to the 2D stall curve (past the insert angle) followed by a shiftto the right so that the lift curve is continuous. In the UIUC model, point F (the “end”angle) is specified as desired. The “start angle” point E is also user-prescribed. The flatplate model then extends from point F to point G and beyond.
74

Figure 7: The effect of changing the stall delay angle.
Figure 8: The effect of changing the stall angle.
75

Figure 9: Various uses of the stall delay angle and the prefered approach when given theexperimental stall data from clmax and beyond.
Figure 10: The UIUC post stall model (shown) and Corrigan model (not shown).
76

Appendix B: Warnings and Errors
***************************************************************************
Key:
"Notes" - Messages to inform the user.
"Warnings" - Information that the user should understand.
Usually a warning is harmless.
"Errors" - Program failure. Something is seriously wrong and
the code is about to crash or simply give bad data. It
is usually a sign of an error in the user input data.
***************************************************************************
***************************************************************************
Caveat: Some comments in these notes, warnings and error messages are
informational (useful) only to the developers. So if something is not
clear, it might fall in this developer category.
***************************************************************************
***************************************************************************
Notes:
10: This comment is relevant only when lrpmfix is used, which for now
is only in prpswp2.f for writing out fort.45 In deflt.f, lrpmfix = tt
by default (menu.f)
90: This note means that the maximum value (e.g, power, cp,
efficiency, torque) occurs at one the endpoints over the range of wind
speeds specified. Thus, the maximum is not bracketed by the wind
speed range. Sometimes this is OK, e.g. a power curve that continues
to increase over the range.
900: The tip loss effects are modeled somewhat by ignoring the last
segment. To ignore the last 5% of the blade, use 20 segments. If you
use only 10 segments, then the current approach effectively ignores
then 10%. This brute force approach is crude, and it is a little used
feature of the code.
***************************************************************************
***************************************************************************
Warnings:
99: (PROPGA code) Fitness failed for a particular individual in propga.
This could be a result of a number of things according to the ierror
code.
77

3 - chord is somewhere a negative number
6 - chord is somewhere a negative number
375: The number of angles of attack exceeds that allowed for a PROP93
input file. The PROP93 limit is 50 angles of attack.
401: The root bending moment at a point off the center of rotation is
done by approximately. If the offset at which the root bending moment
is desired is larger than ~10%, then a warning is given to indicate
that this calculation is an approximation and gets worse with
increasing offset ’roffset’ in the REPORT_MD_ROFFSET line.
433: When debugging w/ lu17 and lu18 (dct and a2 in prop.f), you need
to use the CATA line before any prop runs. This will reset the
cata1(..) and cata2(..) arrays before doing a prop run and storing the
dct and a2 convergence history for a particular wind speed.
450: The lowest Reynolds number for which airfoil data is available
(*.pd file) is higher than that found during the prop performance
analysis (prop.f). In this case, the code will force the Reynolds
number during the run to be the lowest value found in the *.pd file.
What this means is that the analysis is likely to overpredict the
performance since the higher degradation w/ the actual lower Re is not
accounted for in the analysis. Usually this overprediction is very
small, unless it occurs during the stalled state in which case the
correct Cl is important.
451: Same as 450 above, but this time the Re is above the Re in the
*.pd file.
500: Some undocumented generator functions (GENFUN-line) require the
rpm. Be sure that you write this file using the WRITE_FILES line if
you need to know the rpm to obtain the generator efficiency (menu.f).
850: Warning with airfoil mode 2 (airfoil model). This feature is
currently unsupported.
855: This line MAKE_PROP_AFDATA works w/ all stall delay models,
except the RAJ_MODEL. This code was written by Nikil Raj, but his
thesis model (RAJ_MODEL line) was not implemented. (see Selig PROPID
notes of 001118 p. 1)
875: The tolerance for this particular Newton line is either zero or
unspecified, in which case it is set to zero. The Newton line (jequ1)
is given. The solution will not converge in this case. What is needed
is either a TOLSP1 line, or TOL(.) data on the NEWT* line.
939: An intermediate value in prop.f produced a value of 0 or a
78

negative number. The value has been forced to a small number in an
attempt to continue and find a converged solution inside prop.f.
940,941,942,943,944: (report.f)
945: This mode is not implement in bemtval called w/ REPORT_BE_DATA line.
950: LSAF will only accept up to 24 segments. The LSAF file will need
to be pruned to a smaller number of segments.
956: The angle of attack correction computed by the Corrigan model can
sometimes be negative. This will produce a decrease in cl rather than
an increase in cl. When a negative value is computed, the correction
is forced to zero, hence no correction is made in this
case. (corgan.f) A similar routine has been added to dudelta.f.
957: (Selig - see menu.f)
990: Requesting airfoil data and the Reynolds number for a station is
zero. If this is the root section (jseg = 1), then this is not a
problem. It should not happen otherwise.
999: This line type is not in the PROPID (menu.f).
***************************************************************************
***************************************************************************
Errors:
1010: PROPID has not been checked to work in propeller mode. It
probably will not work correctly.
1020: The prop.f code did not converge to a proper solution, and this
can likely be seen in the cl or axial induction factor distribution
for the segment noted in the screen dump regarding the error. The
solution is to use the RELAXF line with a factor less than 1. With a
factor less than 1 (suggested 0.6), relaxation will be applied to the
value dct used in the iteration loop for a blade segment. The smaller
the relaxf value, the more iterations and longer the run times. The
only advantage to using this factor, is to get a solution, it does not
speed up the solution or create a better solution. If no Error 1020
message is given, then the solution has converged. This error is
likely only to appear with running in TIPMODE 2 (Prandtl model only,
as opposed to the Wilson-Prandtl model - a modified Prandtl model and
not as accurate).
79

1030: The first blend value must be 1 and the last must be 0. Check
the AIRFOIL_FAMILY line.
1031: The first blend value must be 1 and the last must be 0. Check
the AIRFOIL_FAMILY line.
1032: In the AIRFOIL_FAMILY line an airfoil index is specified greater
than the number of airfoils included in the AIRFOIL_MODE line. For
example, 3 airfoils were input through the AIRFOIL_MODE line, and the
AIRFOIL_FAMILY line specified using airfoil index 4 (i.e. the
AIRFOIL_FAMILY line used greater than 3).
1060, 1061: Corrigan data checks. Same error as 9322. (check.f)
1062: Post stall start angle must be less than the stall angle.
1501: When using the GAEP line, the WRITE_FILES line must be used
to write out the power curve (WRITE_FILES 40) before the GAEP line.
1950: LSAF accepts 24 radius points, but there are more than 24 after
the PRUNE line was used in an attempt to reduce the number of points
below the 24 max limit.
1951: PRUNE points may be in descending order from tip to root.
1952: That flap loads case does not exist.
3020: ichord .gt. nchord .or. itwist .gt. ntwist
3021: ichord .gt. nchord .or. itwist .gt. ntwist
4051: Must use mph in the DP line when using the RPM_FIXED_ON_TSR line.
5000: The generator efficiency is greater than 1. This is an error
since the efficiency should always be less than 1.
5055, 5056: An IDES line is required after all of the basic defining
parameters and before the analysis lines. This IDES line is needed
because the predes.f subroutine might be needed to perform some
operations before the analysis. Also, the IDES line will run the
check.f subroutine.
6050: Not a valid mode for use with ALFA_MIN_MAX_INC line.
6071: To use the post stall models, the airfoil data files *.pd must
be used. The PROP format for the airfoil data will not work.
7010: prop.f did not converge after a set number of iterations (set by
80

the line iterprop). What this means is that the blade geometry is
rather unusual. This can sometimes happen when running PROPGA. It
will very rarely happen with running PROPID.
7508: When using the post stall models, it is required that a unique
airfoil file be used for each station. For example, if the S809 is
used along the entire blade, then at least two s809 airfoil files must
be prescribed in the AIRFOIL_MODE line because the stall models will
operate on the data depending on the radial location of the airfoils.
To get even higher fidelity, 4 or more stations of the S809 airfoil
could be used. The post stall models will modify that data for each
station.
8080: An array limit has been reached when using the relative chord
and/or twist distributions. Too many stations are prescribed.
8081: At least two stations must be used with the relative chord
and/or twist distributions.
8082: NS is too large. There are too many segments.
8083: RAJ_MODEL line will not work w/ MAKE_PROPID_AFDATA line.
9026: Increase nxj2 in gaep.f. Or lower the number of wind speed
values used in the 2D_SWEEP line.
9027: Increase ngaep in propid.inc.
9028: Increase nnxj in propid.inc. This variable is used on the
fitness evaluation.
9029: Increase naf in the propid.inc file.
9030: The Corrigan model requires the clmax input for the airfoils
given in the AIRFOIL_MODE line. Include clmax and the insert angle if
the Corrigan model is on.
9031: Increase ncmpt in propid.inc, or reduce icmpt in the ICMPT line.
9032: Increase ndp in propid.inc, or reduce the number of DP lines.
9081: The relative chord and twist distributions must start with a
radius of 0 and end at 1.
9319: DU_MODEL line must come before the AIRFOIL_MODE line because
right after the AIRFOIL_MODE line the data is modified according to
the preceeding Du line.
81

9320: CORRIGAN_EXPN line must come before the AIRFOIL_MODE line
because right after the AIRFOIL_MODE line the data is modified
according to the preceeding Corrigan line.
9321: It is suspected that the start and end angles on the Du model
were not included in the airfoil_mode line input data. Including the
DU_MODEL line requires the start and end angles.
9322: It is suspected that the clmax and insert angle for the Corrigan
model were not included in the airfoil_mode line input data. Including
the CORRIGAN_EXPN line requires this data.
9390: PROPID requires that the drag data extend to 27.5 deg.
9404: There are too many points in the 2D sweep line. Currently ncl is
25. Reduce the number of values sweeps in pitch, tsr, or rpm. The
number of wind speed points does not have to be reduced. See PROPID
history file 980806 for more details.
9405: Similar to 9404. Currently nbl is 20 (1-Jan-2010).
9406: You cannot use a WIND_FIXED line w/ the 2D_SWEEP line. If you
want just one wind speed, then you can use the WIND_SWEEP line with, say,
"10 10 1 2" so that only 10 mph is considered.
9801: When using the CHORD_RELATIVE line, the first and last values in
radius should be 0 and 1, respectively. So the data must span the
blade length.
9802: When using the TWIST_RELATIVE line, the first and last values in
radius should be 0 and 1, respectively. So the data must span the
blade length.
9999: This line is not in the PROPID dictionary as a valid line type.
This error can be suppressed by using the line SKIP_UNKNOWN_WORDS
which is a toggle. (menu.f)
***************************************************************************
82

Index1D SWEEP, 12, 14, 17, 20–22, 43, 53, 632D SWEEP, 12–14, 16–20, 43, 45–47, 49, 50, 53,
62, 63
advance ratio, 6airfoil
blending, 10–11, 27airfoil data, 8–11AIRFOIL FAMILY, 10–11, 16, 52, 59AIRFOIL MODE, 8–11, 15, 51, 59angle of attack, 34
distribution, 20, 37area, 49aspect ratio, 24, 49ATOL, 42axial induction factor, 34, 58
distribution, 20, 37, 40
BE DATA, 15, 27, 43, 51, 58BEEP, 43blade number, 7blade segments, 7BN, 6, 15, 51, 59brake state, 6BUMPALPHA, 43BUMPCD, 43BUMPCL, 43
CALC LOADS, 46CDFAC, 44CH TW, 7, 15, 21, 51, 59chord distribution, 20–22CHORD BASE, 7, 44Cl*c, 34
distribution, 20, 22clamp, 28, 29, 31, 33, 42CLLOSS, 44CONE, 6, 15, 51, 59cone angle, 7, 41Corrigan stall delay model, 9–10, 74CORRIGAN EXPN, 9, 15, 51, 59
density
air, 7, 18design point, 12, 19DP, 12, 16, 18, 29, 31, 35, 52, 60drag coefficient distribution, 20DRY, 45, 60, 62DU stall model, see UIUC post stall modelDUMP PROP93, 27DUMP PROPID, 17, 27, 33, 50, 53, 63dynamic pressure distribution, 20
ECHO INPUT, 45
figure of merit, 33FIXPD, 19, 20, 45, 63flat plate model, 74ftn files
011, 27, 48014, 2715, 27019, 20020, 18021, 27, 33022, 27, 33039, 18040, 18–20, 45, 53045, 18–20, 47, 50, 53050, 18, 19051, 18, 45, 53060, 20061, 20065, 20075, 20, 53076, 20, 21, 53080, 20, 53082, 23084, 20085, 20–22, 53086, 20087, 20088, 20090, 20, 53094, 20, 21095, 20–22, 53
83

096, 20097, 20, 21099, 20, 21, 53100, 20, 21format, 18, 21
GAEP, 16, 27, 46, 53, 63efficiency, see generator efficiency
gaep.dat, 27gearbox efficiency, see generator efficiencygenerator efficiency, 27, 46
HH, 6, 15, 51, 59hub
height, 7radius, 7, 41
HUB, 6, 15, 51, 59hub loss, 6HURRICANE SPECS, 46
IBR, 6, 15, 51, 58IDES, 12, 16, 29, 31, 35, 36, 38, 40, 45, 48,
52, 60–62INCV, 6, 15, 51, 58IS1, 6, 15, 51, 58IS2, 6, 15, 51, 58ISTL, 6, 15, 51, 58ITERMAX, 47ITERPROP, 47
LCOL45, 18, 19, 47, 50, 62LHUB, 6, 15, 51, 58lift coefficient, 34, 36, 58
distribution, 20, 28, 34, 35, 37, 38, 41lift-to-drag ratio distribution, 20LTIP, 6, 15, 51, 58
MODE, 6, 15, 51, 58moment, 33
NEWT1, 28–31, 33, 45, 48NEWT1IDP, 33, 52, 60, 61
200, 33202, 33203, 33205, 33206, 33
207, 33NEWT1ISWP, 28, 52
300, 28, 29, 31, 35301, 28302, 28304, 28
NEWT1LDP, 34, 39, 40, 61, 62500, 34, 36501, 34502, 34504, 34505, 34506, 34
NEWT2, 28, 29, 31, 34, 45, 48NEWT2SDDP, 36, 37, 39, 61, 62
100, 37, 38101, 37, 40102, 37104, 37105, 37
normal force coefficient distribution, 20NS NSEC, 6, 15, 51, 58
PAUSE, 47pitch, 12, 19, 22, 41, 45, 49PITCH DP, 12, 14, 16, 17, 20, 21, 45, 47, 49,
50, 53, 62, 63PITCH FIXED, 12, 14PITCH SWEEP, 12, 14, 18, 19post stall, 73post stall model, 74post-stall model
flat plate, 6Viterna, 6
power, 18, 19, 33, 34, 45, 58distribution, 20, 37peak, 28, 30, 31, 35, 36, 41
power coefficient, 18, 19, 33, 34definition, 18distribution, 20, 37peak, 28
PRINT INPUT, 27, 48PROP, 4, 8PROP93, 33propeller mode, 6
84

PROPSH, 4, 33, 43, 48
radiushub, see hubrotor, 7, 21, 49
RD, 6, 15, 51, 59REPORT 1IDP, 24–25, 61REPORT 1ISWP, 25REPORT 1LDP, 25REPORT BE DATA, 26–27REPORT COMMENT, 23REPORT DP, 61REPORT DP LAST, 23–24REPORT END, 22–23, 53, 63REPORT GEOMETRY, 23–24REPORT IDP, 24–25REPORT ISWP, 25REPORT LDP, 25REPORT MD ROFFSET, 27REPORT SEPARATOR, 23, 61REPORT SPECIAL, 25–26, 53, 63REPORT START, 22–23, 53, 61REPORT VERSION, 26residue, 31Reynolds number
calculation, 21distribution, 20, 21
RHO, 6, 15, 51, 58RKR GAMMA, 48RNEWT, 48rotor speed, see rpmrpm, 12, 13, 18, 19, 22, 41RPM DP, 13, 14, 16–19, 21, 53, 63RPM FIXED, 13, 14RPM SWEEP, 13, 14RPRINT, 49runs directory, 4, 28
SH, 6, 15, 51, 58shaft tilt, 6SKIP UNKNOWN WORDS, 49solidity, 24, 29, 35, 41, 49stall angle, 73, 74stall delay angle, 73, 74SUMMARY INFO, 49swirl, 7
tangential force coefficient distribution, 20thickness distribution, 20, 21thrust, 18, 33thrust coefficient, 18
definition, 18tip loss, 6, 20tip speed, 33tip speed ratio, 6, 12, 13, 18, 19, 45, 58TIPMODE, 7, 16, 52, 59TIPON, 7, 16, 52, 59TIPSPEED, 49tolerance, 28, 29, 31TOLSP1, 40TOLSP2, 40torque, 18, 33
maximum, 28TSR SWEEP, 13, 19, 20, 45–47, 49, 50, 62, 63twist, 36, 38, 39, 41
distribution, 20, 21, 35, 36
UIUC post stall model, 9, 74USE AIRFOIL FAMILY, 11, 16, 52, 59USEAP, 6, 15, 51, 58
version, 26viscosity
kinematic, 21VS MODE, 13, 18, 19, 47, 49, 62
Weibull shape factor, 48WEXP, 6, 15, 51, 58wind boundary layer exponent, 7wind speed
units, 12, 13, 46wind speed at peak power, 28wind turbine mode, 6WIND DP, 14WIND FIXED, 14WIND SWEEP, 13, 14, 16–21, 45–47, 49, 50, 53,
62, 63WRITE FILES, 12, 16–19, 21, 45, 47, 50, 53,
62, 63WT NAME, 50
ZERO TWIST, 50
85