Propagation and Detection of Radio Signals Before, During ...
87
NIST Technical Note 1540 Propagation and Detection of Radio Signals Before, During, and After the Implosion of a 13-Story Apartment Building Christopher L. Holloway Galen Koepke Dennis Camell Kate A. Remley Dylan F. Williams Susan A. Schima Seturnino Canales Douglas T. Tamura
Transcript of Propagation and Detection of Radio Signals Before, During ...

NIST Technical Note 1540
Propagation and Detection of Radio Signals Before, During, and After the Implosion of a 13-Story Apartment Building Christopher L. Holloway
Galen Koepke Dennis Camell Kate A. Remley Dylan F. Williams Susan A. Schima Seturnino Canales Douglas T. Tamura

ii

iii
U.S. Department of Commerce Carlos M. Gutierrez, Secretary Technology Administration Phillip J. Bond, Under Secretary for Technology National Institute of Standards and Technology Hratch G. Semerjian, Acting Director
NIST Technical Note 1540 Propagation and Detection of Radio Signals Before, During and After the Implosion of a Thirteen-Story Apartment Building Christopher L. Holloway Christopher L. Holloway Galen Koepke Dennis Camell Kate A. Remley Dylan F. Williams Susan A. Schima Seturnino Canales Douglas T. Tamura Electromagnetics Division National Institute of Standards and Technology 325 Broadway Boulder, CO 80305 May 2005

iv
Certain commercial entities, equipment, or materials may be identified in this document in order to describe an experimental procedure or
concept adequately. Such identification is not intended to imply recommendation or endorsement by the
National Institute of Standards and Technology, nor is it intended to imply that the entities, materials, or equipment
are necessarily the best available for the purpose.
National Institute of Standards and Technology Technical Note 1540Natl. Inst. Stand. Technol. Tech. Note 1540, 87 pages (May 2005)
CODEN: NTNOEF
U.S. Government Printing OfficeWashington: 2005
For sale by the Superintendent of Documents, U.S. Government Printing OfficeInternet bookstore: gpo.gov Phone: 202-512-1800 Fax: 202-512-2250
Mail: Stop SSOP, Washington, DC 20402-0001

iii
Contents Executive Summary ................................................................................................. v
Abstract..................................................................................................................... 1 1. Introduction.......................................................................................................... 1 2. Building Description ............................................................................................ 3 3. Frequency Bands.................................................................................................. 3 4. Transmitters ......................................................................................................... 5 5. Receiving Antenna and Measurement System .................................................. 6 6. Experimental Set-up ............................................................................................ 8 7. Experimental Results........................................................................................... 9 7.1 Radio Mapping of Building: Measuring Signal Strengths.......................10 7.2 Radio Mapping of Building: Statistical Distributions of Signal Strength...................................................................................11 7.3 Pre-Implosion Radio Signal Measurements with Transmitters at Fixed Sites......................................................................................13 7.4 Implosion Radio Signal Measurements with Transmitters at Fixed Sites with Fixed and Mobile Receiving Sites ..........................14 7.5 Field Tests of the Debris Radiator Concept.............................................15 8. Recovery of Transmitters....................................................................................18 9. Summary of Results and Conclusion .................................................................18 10. References ...........................................................................................................21

v
Executive Summary A fundamental challenge to successful communications into and out of large buildings is the large attenuation of radio signals. Unreliable radio signals are particularly problematic for the public-safety community, since lack of communications can have dire consequences in terms of health and safety. As part of a larger project investigating communications problems experienced by first responders in disaster situations, the National Institute of Standards and Technology (NIST) is carrying out a series of signal propagation experiments in both standing and collapsed buildings. Data on signal propagation and attenuation in a variety of realistic situations are important for improving the design of communications systems. These data will give first responders a better understanding of what to expect from the radio-propagation environment. The goals of the larger project are two-fold: (1) to create a large, public-domain data set describing the attenuation in various building types of radio signals in public safety and cellular telephone bands and (2) to investigate various schemes for detecting signals from first-responders with radios or civilians with cell phones who are trapped in voids in a collapsed or partially collapsed buildings. Toward the above goals, measurements were carried out on a 13-story high-rise apartment building in a suburb of New Orleans, Louisiana. This technical note details the experiments performed before, during, and after the implosion of the building. Frequencies near public safety and cell phone bands (approximately 50 MHz, 150 MHz, 225 MHz, 450 MHz, 900 MHz, and 1.8 GHz) were chosen for these experiments. Radio transmitters similar to those used by first responders were used. An automated system to measure signal strength was developed. Three different types of signal strength experiments were performed. First, a “radio-mapping” experiment investigated how radio signals at the different frequencies coupled into the building and determined the field strength variability throughout the building. This experiment involved carrying a set of transmitters tuned to the various frequencies through the building while recording the received signal at a fixed receive site located outside the building. These measurements were carried out a few days before the building was imploded. Results show that:
The mean signal attenuation for a wide range of locations throughout the standing building ranged from 25 to 50 dB.
The standard deviation ranged from 6 to 14 dB, depending on frequency. These results indicate the variability in signal level a communication-system user might expect throughout a building of this type. Second, radios in protective cases were placed in fixed sites throughout the building. Received signals were collected before, during, and after the implosion. Our receiving sites in this case were both fixed and mobile. A mobile cart was pulled around the perimeter of the building both before and after the implosion, enabling direct comparison of signal strength as a function of azimuth angle through the standing building and the resulting pile of rubble. Results show that:

vi
Some signals experienced large amounts of attenuation, while other signals increased after the implosion, depending on whether the transmitters ended up on top of the debris pile or buried beneath building rubble.
Large amounts of building rubble caused at least 60 to 80 dB of signal attenuation. The true attenuation was not established since we measured only noise.
Thus, if someone was trapped under such a rubble pile and tried to communicate with an emergency responder with a two-way radio or cell phone, their communication link would have to overcome at least 60 to 80 dB of attenuation. Third, the use of metallic “debris radiators” to detect signals from transmitters buried underneath the rubble pile was investigated. The goal was to investigate whether radio signals from transmitter(s) under rubble might couple onto metallic construction material such as pipes or conduit, and radiate signals to the edges of the rubble pile. Results show that:
Post-implosion measurements at locations close to the debris pile show signal attenuation of 55 to 72 dB compared to pre-implosion values.
Directional receive antennas in close proximity to a debris radiator generally had higher received signal levels than did those with a direct connection to the metallic debris through a matching network.
This technical note is the first in a series of reports detailing experiments performed by NIST in conjunction with building implosions to better understand the first responder’s radio propagation environment and to investigate new methods for weak-signal detection. The results of experiments performed at the implosion of Veterans Stadium in Philadelphia and the Washington D.C., Convention Center are the subject of separate reports. Besides implosion experiments, NIST has also performed radio-mapping experiments in various other large structures, including apartment and office buildings, sports stadiums, stores, malls, hotels, a convention center, and warehouses. The results of the signal-strength measurements and statistical distribution for these radio-mapping experiments will also be published separately. Also, a compilation of the results of our experiments on weak-signal detection methods will be published separately.

1
Propagation and Detection of Radio Signals Before, During and After the Implosion of a 13-Story Apartment Building
Christopher L. Holloway, Galen Koepke, Dennis Camell, Kate A. Remley, Dylan F. Williams, Susan A. Schima,
Seturnino Canales, and Douglas T. Tamura
Electromagnetics Division National Institute of Standards and Technology
325 Broadway, Boulder, CO 80305 In this report, we investigated communications problems faced by emergency responders (firefighters and police) in disaster situation such as collapsed buildings. A fundamental challenge to communications into and out of large buildings is the strong attenuation of radio signals caused by losses and scattering in the building materials and structure. We designed experiments that take advantage of building demolitions in an effort to quantify radio signal attenuation through standing and collapsed structures. We also investigated various schemes for detecting signals from firefighters and civilians with portable radios or cell phones who are trapped in voids in these collapsed building. We placed RF transmitters, similar to those used by first responders, in various locations in these buildings and performed measurements before, during, and after the building was imploded. The transmitters were tuned to frequencies near public safety and cell phone bands. Once the building was down, we used the signals from the buried transmitters in the building to investigate various detection schemes that involved searching with directional antennas and connecting instruments to some of the metal debris located on the perimeter of the collapsed building. This report summarizes one such set of experiments in a 13-story apartment complex located in a suburb of New Orleans, Louisiana. In this report, we describe the experiments, detail the measurement system, show primary results of the data we collected, and discuss some of the interesting propagation effects observed. Key words: building shielding and coupling; collapsed buildings; emergency responders; implosion; radio propagation experiments 1. Introduction When first responders enter large structures (e.g., apartment and office buildings, sports stadiums, stores, malls, hotels, convention centers, and warehouses) communication to individuals on the outside is often impaired. Cell phone and portable radio signal strength is reduced due to attenuation caused by the building materials and scattering by the building geometry [1-4]. This problem was very evident in the rescue efforts at the World Trade Center Towers.

2
The National Institute of Standards and Technology (NIST) has a project to investigate the communications problems faced by first-responders (firefighters and police) in disaster situations such as collapsed buildings. As part of this effort, we are investigating the propagation and coupling of radio-waves into large structures. We are also investigating various schemes for detecting first responders and civilians with portable radios or cell phones who are trapped in voids in a collapsed or partially collapsed building. Buildings scheduled for implosion provide the ideal research environment for investigating radio-wave propagation conditions in fully or partially collapsed structures. The rapid change in the building structure during an implosion was also favorable to our experimental time frame. We could perform one set of experiments within about a two-week period as opposed to several months during a conventional demolition. Working in cooperation with demolition and implosion contractors, we identified a high-rise apartment building in New Orleans as the site of our first set of experiments. A short summary of this work appears in Reference [5]. The experiments reported here were performed before, during, and after the implosion of the building and are essentially measurements of the attenuation of radio signals caused by the building materials and structure. In order to study the radio characteristics of the building at the various frequencies of interest to first responders, frequencies near public safety and cell phone bands (approximately 50 MHz, 150 MHz, 225 MHz, 450 MHz, 900 MHz, and 1.8 GHz) were chosen. A detailed description of these transmitters is given in Section 4. Three types of data were collected in the experiment. The first set of data, which we refer to as “radio mapping,” was collected a few days before the building was imploded. This involved carrying transmitters (or radios) tuned to various frequencies throughout the building while recording the received signal at a site located outside the building as discussed above. The reference for these data was a direct, unobstructed line-of-sight signal strength measurement with the transmitters external to the building and in front of the receiving antennas. The purpose of these measurements was to investigate how the signals at the different frequencies couple into the building, and to determine the field strength variability throughout the building. The second set of data was gathered from radios placed at fixed sites throughout the building. Received signals were collected before, during, and after the implosion. The receiving sites in this case were both fixed and mobile. The mobile site consisted of measurement instruments and antennas mounted on a modified garden cart. A detailed description of the measurement system and antennas is given in Section 5. The cart was pulled around the perimeter of the building both before and after the implosion, enabling direct comparison of signal strength as a function of azimuth angle through the standing building and the resulting pile of rubble after the collapse. We collected the third set of data by monitoring signals being coupled to metallic debris located in the proximity of transmitters buried in the collapsed building. These metallic “debris radiators” (cables and pipes) ran through the rubble and were exposed at the perimeter of the collapsed building. The idea is that when a building collapses, metal objects (electrical wires, metal piping, re-bar, venting pipe, etc.) are protruding from the rubble. We then measured the signals using instruments connected directly to the metallic debris. Antennas were also used to investigate signal detection from these metallic debris radiators. This experiment was carried out

3
to investigate the possibility of detecting radio signals from transmitter(s) under the rubble that might couple onto these metal objects and radiate signals to the edges of the rubble pile. Use of debris radiators may improve reception of signals emitted from deep within a building in such emergencies. When first responders approach a collapsed structure, one of their first priorities is to determine whether survivors are present in the debris. Reception of signals from handheld radios or cell phones may let searchers know of survivors’ existence and their condition. Optimal search strategies for survivors with portable radios depend on finding the most effective methods for detecting weak signals. This report summarizes a set of experiments on the 13-story apartment complex in the Algiers neighborhood of New Orleans (see Figure 1) known as the “William J. Fisher High-Rise.” Details of the building layout are presented in Section 2. Section 3 describes the frequencies used in these experiments. Section 4 discusses the transmitters and Section 5 describes the measurement system. In Section 6, our experimental procedures are discussed. In Section 7 we present the data collected at various stages of the experiment. Section 8 briefly discusses the recovery of the transmitter after the implosion. Finally, in Section 9, we summarize the results of this experiment and discuss some of the interesting propagation effects observed. 2. Building Description The building for these radio propagation experiments was a 13-story apartment complex located in a suburb of New Orleans, Louisiana (Figure 1). The 13 stories included a ground-level common area and parking, and 12 floors with 14 efficiency apartments on each floor. The individual apartments on each level opened to a common outside hallway on the west side of the building. There was an elevator control and maintenance room in a penthouse on the roof of the building. This space was accessed by a metal spiral staircase on the top floor. There were two internal passenger elevators and one external freight elevator near the center of the building. Two external stairwells near each end of the building accessed all floors. There was no basement in this building. The building was constructed of reinforced concrete, steel, and standard interior finish materials. Significant demolition was already completed when we arrived; all plumbing fixtures, most glass windows and doors, and the contents of the apartments had been removed. The reinforced concrete walls on the lower two levels had been cut away with only support columns remaining. The ground level common area structure was demolished and the debris in the area removed. Material had been judiciously removed from certain structural parts of the lower levels including stairwells and elevator shafts to facilitate a proper collapse during the implosion. Figures 1-3 show the details of the original building and the some of the preparations and partial demolition of the lower levels. Figure 4 shows a drawing of the structure. 3. Frequency Bands An overview of the frequencies used by the public safety community nationwide (federal, state, and local) is given in Table 1. From this table, we see that there is a broad range of frequencies

4
used by the public safety community, ranging from 30 MHz to 4.9 GHz. The modulation scheme has historically been analog FM, but this is slowly moving toward digital as Project 25 radios come on line [6]. The modulation bandwidth in the VHF and UHF bands has been 25 kHz, but due to the need for additional communications channels in already crowded spectrum, all new allocations are 12.5 kHz. The older wide-bandwidth allocations will gradually be required to move to narrow bandwidths to increase the user density even further. The crowded spectrum and limited bandwidth is also pushing the move to higher frequency bands in order to use new data-intensive technologies. The cellular phone bands are summarized in Table 2. As shown in Table 1, frequencies used by public safety and other emergency responders and cellular telephones are typically below 2 GHz, for current technology. New frequency allocations and systems including higher frequencies (e.g,. around 4.9 GHz) will become increasingly important in the future, but in these studies, we concentrated on the major communications bands in use today. We chose six frequency bands below 2 GHz, from about 50 MHz to just above 1800 MHz. These include four VHF bands typically used for analog FM voice, one band used for multiple technologies (analog FM voice, digital trunked FM, and cellular telephone), and one band near the digital cellular telephone band.
Table 1. Public safety community frequencies.
Frequency band Description 30-50 MHz Used mainly by highway patrol for long-distance propagation. This
is currently being phased out of use. 150-174 MHz Local police and fire. Lower frequency again used because of its
better long distance propagation quality. 406-470 MHz Used by federal officers and others. 700-800 MHz Used in urban areas. 800-869 MHz Primarily urban usage.
4.9 GHz A newly allocated band with 50 MHz bandwidth just coming on line for sending images and data.
Table 2. Cellular phone frequencies.
Frequency band (MHz)
Description
800 AMPS or analog systems. 1900 PCS or digital systems
In designing an experiment to investigate the propagation characteristics into large buildings at these different frequency bands, we chose frequencies very close, but not identical, to the above bands. If frequencies were chosen actually in the public safety or commercial land-mobile bands then interference to the public safety and cellular systems could possibly occur. Conversely, these existing systems could interfere with our experimental setup. In addition, receiving

5
frequency authorizations in these bands for our experiments would have been problematic due to the intense crowding of the spectrum. To circumvent these issues we were able to receive temporary authorization to use frequencies in the U.S. Government frequency bands adjacent to these public safety bands. Table 3 lists the frequency bands that were used in the experiments. The lower four bands correspond to the frequencies used by the public safety community; 902 MHz can be correlated to several services including public safety and cellular phone; and the highest frequency is near the digital cellular phone band.
Table 3. Frequency bands used in the experiments.
Frequency band
(MHz) Description
49 Simulate a public safety band. 162 Simulate a public safety band. 226 Simulate a public safety band. 448 Simulate a public safety band. 902 Simulate a public safety or cellular phone band. 1830 Simulate a cellular phone band.
Table 4. Frequency sets and grouping used in the experiments
Band (MHz) Location 1 Location 2 Location 3 49 49.72 MHz 49.66 MHz 49.60 MHz 162 162.485 MHz 162.09 MHz 162.00 MHz 226 226.65 MHz 226.30 MHz 225.375 MHz 448 448.80 MHz 448.70 MHz 448.60 MHz 902 902.6 MHz -- -- 1830 1832.5 MHz -- --
For the fixed transmitter experiments, fourteen transmitters operating at different frequencies within the above six bands were placed at three different locations in the building. The fourteen different frequencies used in this experiment are listed in Table 4. The first location had frequencies in all six bands, while the other two locations had transmitters tuned to only four different frequency bands. A detailed description of the transmitters is given in the next section.
4. Transmitters The design requirements for the transmitters used in this experiment were to (1) transmit at the frequencies listed in the tables above, (2) operate continuously for 12 hours, (3) be sufficiently robust to have a high probability of surviving the building collapse, and (4) be relatively inexpensive in the event they did not survive the building collapse.

6
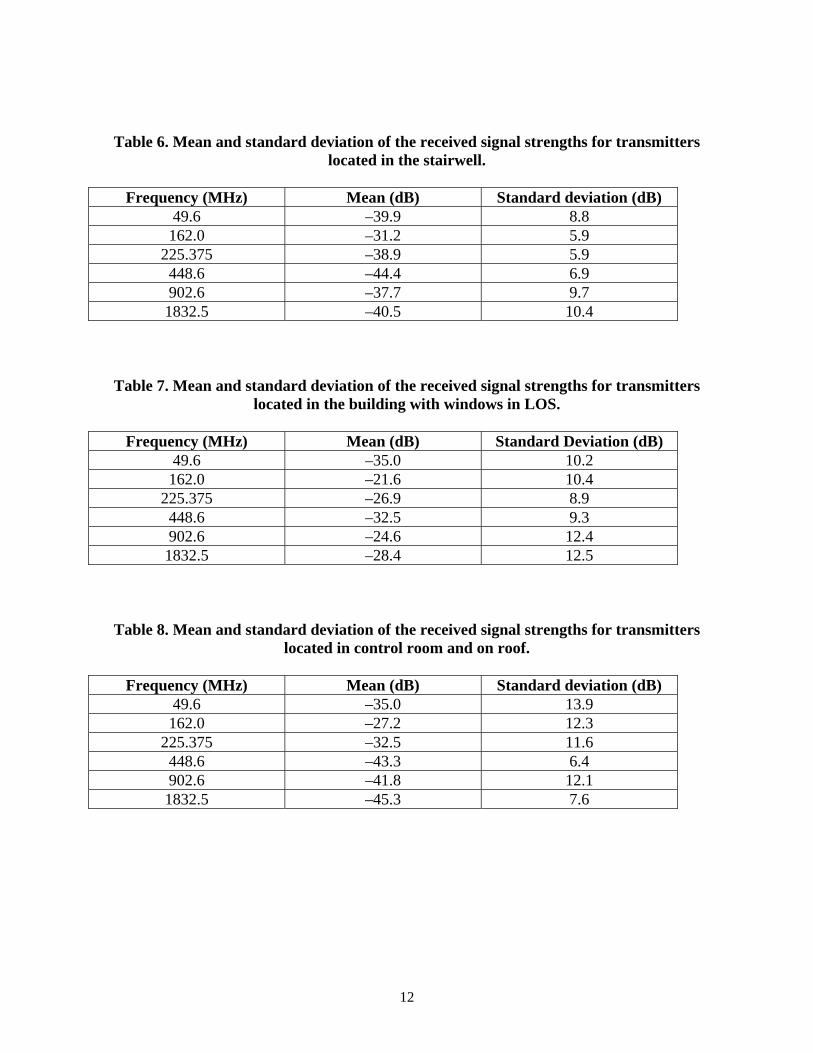
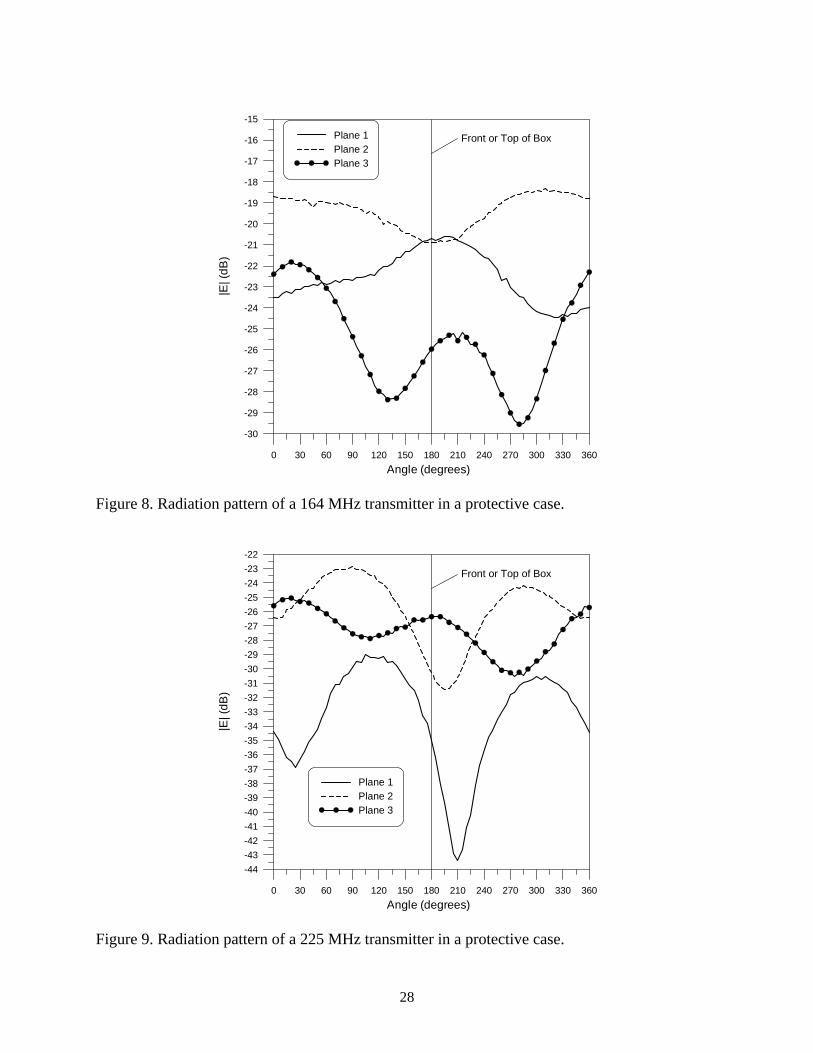
To accomplish this, two different types of transmitters where chosen. For the four lower frequencies bands (the VHF/UHF public safety bands), off-the-shelf amateur radios were modified. The modifications included reprogramming the frequency synthesizer to permit transmitting at government frequencies, disabling the transmitter time-out-timer mode in order to allow for a continuous transmission, and connecting a large external battery pack. The specifications of these modified radios then had to be reported to the National Telecommunication and Information Administration (NTIA) frequency coordinator in order to gain approval for use in government frequencies bands. With the larger battery packs, the modified radios could transmit continuously for 12 to 18 hours. The extended transmitting time required us to provide additional cooling since the radios were designed for typical communications, that is, to transmit intermittently with cooling time between transmissions. The stability and radiated power from these inexpensive radios was measured over a 24-hour period. This measurement was performed in the NIST reverberation chamber, and is discussed below. The modified radios and battery packs were placed in durable orange plastic cases to provide some protection from debris during the implosion. These cases obviously could not withstand a crushing load of debris, so careful placement in the building was key to survival. Figure 5 shows the final arrangement of modified transmitters used for the lower four frequency bands. Commercial transmitters were available for the two higher frequency bands (900 and 1800 MHz). These off-the-shelf transmitters were already in plastic protective cases and could transmit continuously for 12 hours. Figure 6 shows these transmitters. Note the higher-frequency transmitters were grey in color and not orange. To insure that the plastic protective cases did not affect the total radiated power and radiation pattern of the transmitters, measurements of these two quantities were taken in the NIST reverberation and fully anechoic chambers. Measurements of the total radiated power both with and without the plastic cases indicated that the cases had little effect on the total radiated power. Radiated power patterns of the transmitters in the protective cases were also measured to ensure that the cases did not have dramatic effects on the radiation patterns. The transmitters were placed in the NIST anechoic chamber (see Figure 7) for these pattern measurements. Figures 8-10 illustrate the results for 164 MHz, 225 MHz, and 448 MHz. These figures show that the radiation patterns of the transmitters in the protective cases were very similar to the dipole type pattern that the radio would produce in free space. 5. Receiving Antenna and Measurement System The receiving system is sketched in Figure 11. We assembled four antennas on a 4-meter mast as illustrated. The radio-frequency output from each antenna was fed through a 4:1 broadband power combiner. This arrangement gave us a single input to the portable spectrum analyzer that could then scan over all the frequencies of interest without switching antennas. The four antennas were chosen to be optimal (or at least practical) for each of the frequency bands we were measuring. The selected antennas were an end-fed vertical omnidirectional antenna for 50 MHz., a log-periodic-dipole-array (LPDA) used for the 160, 225, and 450 MHz bands, and

7
Yagi-Uda arrays for 900 and 1830 MHz. This assembly could then be mounted on a fixed tripod at one of the listening sites or it could be inserted into the modified garden cart for portable measurements. The receiving sites contained, in addition to the antenna system, a generator, uninterruptible power supply (UPS), spectrum analyzer, global positioning system (GPS) receiver, computer, and associated cabling. A photo of the antenna assembly mounted on a tripod and secured to a large metal storage container at listening site (receiving site B) near the implosion site is shown in Figure 12. As shown in Figure 11, the measurement system consists of a portable spectrum analyzer, GPS receiver, and a laptop computer. The data collection process was automated using a graphical programming language. This software was designed to control the analyzer, collect, process, and save data at the maximum throughput of the equipment. The software controlled the spectrum analyzer via the IEEE-488 interface bus and the GPS receiver via a serial interface. The GPS information was recorded to track the position of the mobile cart during the perimeter measurements around the building. The software was written to maximize throughput of the data collection process and to run for an undefined time interval. This was achieved by running parallel processes of collecting, processing, and saving the data for post-collection processing. The data were continuously read from the spectrum analyzer at its optimal settings and stored in data buffers. These buffers were read and processed for each signal and displayed for operator viewing. The processed data were then stored in additional buffers to be re-sorted and saved to a file on disk. The initial setup of the parameters for the spectrum analyzer determined the quality of optimization for this process. There were several instrument parameters that were critical during the setup, including the analyzer sweep time, resolution bandwidth and frequency span of the spectrum analyzer trace. The number and spread of the test frequencies in a particular band influenced the allowed range of adjustment for these parameters. These two factors also influenced the number of traces necessary to cover all the test frequencies. Interference from signals in the adjacent spectrum influenced the instrument setup and data collection speed by forcing smaller resolution bandwidths. The reference level for each trace was also checked and adjusted during the measurement to improve the resolution and accuracy of the power level reading. All of these factors had some effect on the sampling rate. The sampling rate of a complete measurement sequence was the major factor in how much spatial resolution we had during walk-through or field-mapping experiments (we also had some flexibility in our walking speed) and the time resolution for recording the signals during the implosion. The time resolution of the measured data determined how much detail we could record for the rapid changes in signal strength as the building collapsed. Even though we were concerned primarily with the before and after values, we hoped to record the signals with enough detail to correlate the movement of the structure during the event to our received signals. We used three different models of spectrum analyzers, each having a different sampling rate, ranging from about 2 to 7 seconds to measure all 14 frequencies in the 5 or 6 frequency bands. The frequencies were spaced such that we could utilize one spectrum analyzer trace for each band. These rates were achieved only after optimizing the instrument control and data transfer

8
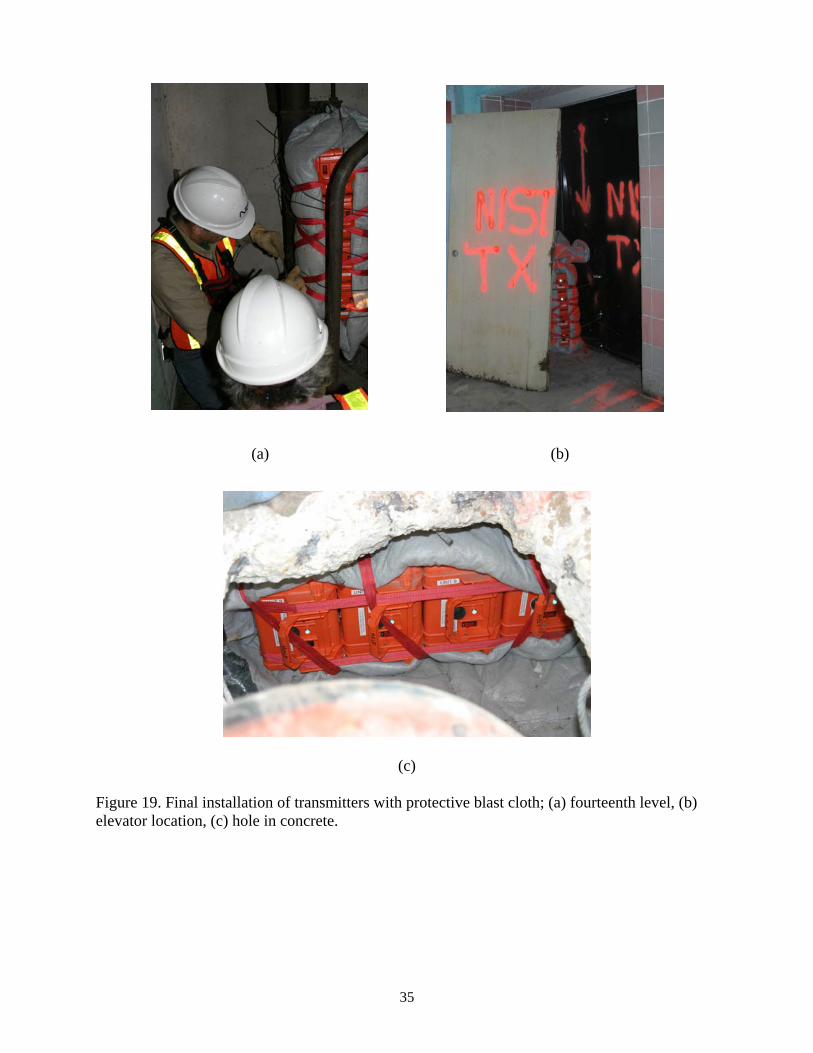
processes mentioned above. The data from the spectrum analyzer trace were saved in binary format to disk (to allow us to reprocess the raw data at a later time if needed); they were then processed to extract the signals at each particular frequency. These results were then put into a spreadsheet file and saved with other measurement information. The sampling rates were sufficient for the field-mapping experiments (if we did not walk too fast) but we got very few samples during the implosion. 6. Experimental Set-up Three types of data were collected in the experiment. The first set of data, which is here referred to as “radio mapping,” was collected a few days before the building was imploded. This involved carrying transmitters (or radios) tuned to various frequencies through the building while recording the received signal from a site located outside the building. The purpose of these measurements was to investigate how signals at the different frequencies couple into the building and to determine the field strength variability throughout the building. For the radio mapping experiments, one fixed receiving site (as described above) was assembled on the northeast side of the building (see Figure 13), approximately 30 m from the northeast corner of the building. During this experiment, the transmitters were carried throughout the building (see Figure 14) and the received signal levels were recorded. As the received signal was recorded, the location of the transmitters in the buildings was also recorded. For the second data set, radios were placed at three different fixed locations in the building where they would have a high likelihood of surviving the implosion (see Figure 15). Received signals were collected before, during, and after the implosion. After a careful analysis of the building, the following three sites where chosen; (1) the spiral stairwell on thirteenth floor of the building (see Figure 16), (2) the outside of the freight elevator door on the third floor landing (see Figure 17), and (3) a hole in the concrete floor located at the bottom center of the building (see Figure 18). A few comments are in order about the transmitters placed in the hole. This building had no basement, and once the hole in the concrete was made, some dirt was removed under the concrete slab in order to generate a cavity for the transmitters. Placing the transmitters under the concrete slab ensured that this set of transmitters would have some protection from the impact of the collapse and the majority of the concrete rubble would be on top of the transmitters after the implosion. To protect the transmitters from the implosion dust they were all wrapped in blast cloth, a fabric used to contain shrapnel from the explosions (see Figure 19). The final installation of the transmitters at the elevator is shown in Figure 19. Notice that a door was placed near the transmitters located at the elevator. This was done to give added protection to the transmitters from flying shrapnel. The receiving sites in this second mode of data collection were both fixed and mobile. Three fixed receiving sites were used to collect data before, during, and after the implosion. These three sites were placed around the perimeter of the building (see Figures 20 and 21). Two sites were located in vans placed 304.8 m (1000 ft) from the building and had NIST personnel monitoring the test systems during the implosion. One of these sites faced the south-east corner of the building (referred to as Receiving Site A, see Figure 20) and the other faced the northeast corner of the building (referred to as Receiving Site C, see Figure 20). The third fixed site was 30 m

9
(100 ft) from the building and the system collected data during the implosion without NIST personnel being present (referred to as Receiving Site B, see Figure 20). The measurement equipment at this site was protected in a metal construction container (see Figure 21b). The mobile site consisted of a measurement system placed on a cart (see Figure 22) as described above. The cart was pulled around the perimeter of the building both before and after the implosion, enabling direct comparison of signal strength through the standing building and through the rubble. We collected a third set of data to investigate the use of so-called “debris radiators.” This set of data was collected by first using antennas and then connecting instruments to metal in the building rubble. The idea is that when a building collapses metal objects (electrical wires, metal piping, re-bar, venting pipe, etc.) protrude from the rubble. This experiment was to investigate the possibility of detecting radio signals from a transmitter under the rubble that might couple onto these metal objects and carry signals to the edges of the rubble pile. To simulate the best-case scenario, the experiment was designed to ensure that there was an unbroken metallic object placed near a transmitter set. Two different metallic objects were used. In the first set-up, two steel cables were placed in the concrete hole location and run 15 m from the east side of the building (see Figure 23). The 15 m distance was anticipated to be beyond where the building debris would lie after the implosion so that we could connect instruments to the ends of the cable. The cables were laid parallel to one another to simulate a parallel transmission line. The other ends of these two cables were placed next the transmitters in the hole location. In the second set-up, one end of a 6-inch metal pipe was placed in the hole in the concrete and the other end was run 10 m from the west side of the building. Another steel cable was pulled through this pipe (see Figure 24). One end of the cable was placed next to the transmitters and the other end was run 10 m out the west end of the pipe. Once again, the end of cable was placed at a distance away from the building such that it could be reached after the implosion. 7. Experimental Results In this section the measured data are presented. This section is divided into several subsections, where each subsection covers the different types of experiments performed in the effort.

10
7.1 Radio Mapping of Building: Measuring Signal Strengths The six different frequencies listed in Table 5 are the ones used in the radio mapping or building walk-through, experiments. The receiving site for this set of experiments was outside the building at a location approximately 30 m (100 ft) from the northeast corner of the building (see Figures 13 and 20). To calibrate the system, the transmitting units were turned on at a location outside the building which was at a line-of-sight (LOS) location halfway between the receiving antennas and the building. Once all six of the transmitters were turned on, the units were then carried through the building. At various points in the building, the transmitter locations were noted in the data file.
Table 5. Frequencies used in the building walk-through experiments.
Frequency band (MHz)
Description
49.60 Simulate a public safety band. 162.00 Simulate a public safety band.
225.375 Simulate a public safety band. 448.60 Simulate a public safety band. 902.60 Simulate a public safety or cellular phone band.
1832.50 Simulate a cellular phone band. Figures 25-30 show the received signal strengths for the entire dataset collected during the building walk-through. Each graph in these figures corresponds to one of the six different frequencies. The results in these figures have been normalized to the peak received signal at their respective frequencies. The peak valued occurred at the line-of-sight location (the location where the transmitters were initially turned on). From these six graphs we can see a large variability in the received signal as the transmitters were moved throughout the building. Since the locations of the transmitters were noted in the dataset during the walk-through, the variability in the received signal at various locations in the building can be investigated. Figures 31-36 show the start of the walk-through and show the effect of placing the transmitters in the hole in the concrete floor. While being taken to the hole in the floor, the transmitters were carried behind a small building (see Figure 13). The results in these figures show the effect of walking behind the building. The decrease in the signal in these figures illustrates the so-called “knife-edge diffraction” of building corners. These figures also show that a reduction of 15 to 20 dB in signal strength occurred when the transmitters were placed in the hole. The next set of data illustrates the signal variability as the transmitters were carried up and down the northwest stairwell. These results are shown in Figures 37-42. The stairwell was external to the building (see Figure 1); however, the stairwell was on the opposite side of the building from where the receiving antennas were located. The results in these figures show that the signal strength varies on the order of 20 to 40 dB (depending on the frequencies) throughout the stairwell.
11
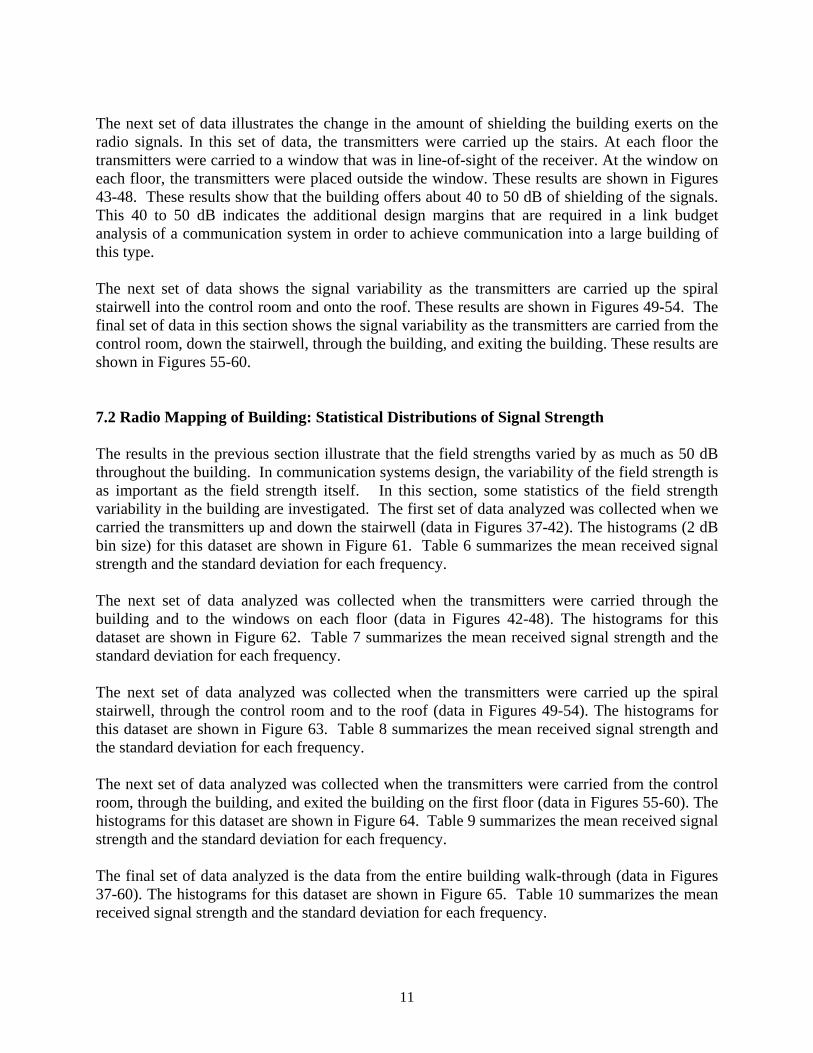
The next set of data illustrates the change in the amount of shielding the building exerts on the radio signals. In this set of data, the transmitters were carried up the stairs. At each floor the transmitters were carried to a window that was in line-of-sight of the receiver. At the window on each floor, the transmitters were placed outside the window. These results are shown in Figures 43-48. These results show that the building offers about 40 to 50 dB of shielding of the signals. This 40 to 50 dB indicates the additional design margins that are required in a link budget analysis of a communication system in order to achieve communication into a large building of this type. The next set of data shows the signal variability as the transmitters are carried up the spiral stairwell into the control room and onto the roof. These results are shown in Figures 49-54. The final set of data in this section shows the signal variability as the transmitters are carried from the control room, down the stairwell, through the building, and exiting the building. These results are shown in Figures 55-60. 7.2 Radio Mapping of Building: Statistical Distributions of Signal Strength The results in the previous section illustrate that the field strengths varied by as much as 50 dB throughout the building. In communication systems design, the variability of the field strength is as important as the field strength itself. In this section, some statistics of the field strength variability in the building are investigated. The first set of data analyzed was collected when we carried the transmitters up and down the stairwell (data in Figures 37-42). The histograms (2 dB bin size) for this dataset are shown in Figure 61. Table 6 summarizes the mean received signal strength and the standard deviation for each frequency. The next set of data analyzed was collected when the transmitters were carried through the building and to the windows on each floor (data in Figures 42-48). The histograms for this dataset are shown in Figure 62. Table 7 summarizes the mean received signal strength and the standard deviation for each frequency. The next set of data analyzed was collected when the transmitters were carried up the spiral stairwell, through the control room and to the roof (data in Figures 49-54). The histograms for this dataset are shown in Figure 63. Table 8 summarizes the mean received signal strength and the standard deviation for each frequency. The next set of data analyzed was collected when the transmitters were carried from the control room, through the building, and exited the building on the first floor (data in Figures 55-60). The histograms for this dataset are shown in Figure 64. Table 9 summarizes the mean received signal strength and the standard deviation for each frequency. The final set of data analyzed is the data from the entire building walk-through (data in Figures 37-60). The histograms for this dataset are shown in Figure 65. Table 10 summarizes the mean received signal strength and the standard deviation for each frequency.
12
Table 6. Mean and standard deviation of the received signal strengths for transmitters located in the stairwell.
Frequency (MHz) Mean (dB) Standard deviation (dB)
49.6 –39.9 8.8 162.0 –31.2 5.9
225.375 –38.9 5.9 448.6 –44.4 6.9 902.6 –37.7 9.7 1832.5 –40.5 10.4
Table 7. Mean and standard deviation of the received signal strengths for transmitters located in the building with windows in LOS.
Frequency (MHz) Mean (dB) Standard Deviation (dB)
49.6 –35.0 10.2 162.0 –21.6 10.4
225.375 –26.9 8.9 448.6 –32.5 9.3 902.6 –24.6 12.4 1832.5 –28.4 12.5
Table 8. Mean and standard deviation of the received signal strengths for transmitters located in control room and on roof.
Frequency (MHz) Mean (dB) Standard deviation (dB)
49.6 –35.0 13.9 162.0 –27.2 12.3
225.375 –32.5 11.6 448.6 –43.3 6.4 902.6 –41.8 12.1 1832.5 –45.3 7.6

13
Table 9. Mean and standard deviation of the received signal strengths for transmitters carried throughout building without window stops.
Frequency (MHz) Mean (dB) Standard deviation (dB)
49.6 –49.1 8.6 162.0 –38.9 6.8
225.375 –41.4 6.8 448.6 –45.7 5.9 902.6 –42.3 10.5 1832.5 –43.5 10.8
Table 10. Mean and standard deviation of the received signal strengths for transmitters carried through the entire building.
Frequency (MHz) Mean (dB) Standard Deviation (dB)
49.6 –38.6 12.1 162.0 –28.4 11.2
225.375 –33.9 10.4 448.6 –40.7 9.2 902.6 –35.2 13.1 1832.5 –38.4 12.5
7.3 Pre-Implosion Radio Signal Measurements with Transmitters at Fixed Site Before the implosion, sets of transmitters were place at three fixed sites and secured (see Section 6 for details). After the implosion, it was hoped that the transmitters in the hole in the concrete floor would not only survive the implosion but would be buried under a large portion of the building. Therefore, to get an indication of the relative difference in signal strengths for the transmitters in the hole before and after the implosion, a set of baseline data was collected. The data were collected by placing the transmitters in the hole and measuring the received signals with the equipment on the mobile cart. The cart was pulled around the perimeter of the building. A route was chosen that would be the same as that used after the implosion. Figure 66 shows the GPS coordinates of the building footprint and the cart coordinates as the cart was pulled around the building. Figure 67 shows the variability in the signal strength around the perimeter of the building. From this plot, we see that the presence of the hole and building causes the signal to vary as much as 40 dB around the building perimeter. It should be noted that as the cart was pulled around the building, the antennas on the cart were always pointed toward the hole in the concrete floor.

14
7.4 Implosion Radio Signal Measurements with Transmitters at Fixed Sites with Fixed and Mobile Receiving Sites
On the day of the implosion, the fixed receiver sites discussed in Section 6 were assembled and the data collection programs were turned on two hours before the implosion. The transmitters at the three fixed locations in the building (see discussion in Section 6) were also turned on two hours before the implosion. Figures 68-70 show the pre- and post implosion data for the fixed receiver located at Receiving Site A. Each of these three figures corresponds to one of the three fixed transmitter sites. The implosion occurred at around 8 a.m., and this is indicated in the figures by the dramatic change in the signal levels. From Figure 68, it is seen that all four transmitters in the spiral staircase going to the control room stopped transmitting once that section of the building hit the ground. Additional data shown later illustrate that the transmitters were transmitting as they were falling. In fact, after recovering the transmitters, it was determined that the transmitters themselves survived the long fall, but their batteries were destroyed. When the transmitters were connected to new batteries after the recovery, they still transmitted. More discussion on these transmitters is given below. From Figure 69, it is seen that the signal strength of the transmitters tied to the third floor elevator increased after the implosion. This is explained by the fact that the once the building collapsed, the elevator shaft ended on the top of the debris pile (see Figure 71). Therefore, the signals from these transmitters no longer had to propagate through the entire building to be received at the receiver site locations. From Figure 70, it is seen that after the implosion, the signals from the transmitters in the hole decreased dramatically, with the exception of the 1832.5 MHz transmitter. The 1832.5 MHz signal changes by only a small amount. The decrease in the five lower-frequency transmitters is due to the fact that after the implosion a large portion of the building covered the transmitters, resulting in a large amount of attenuation as the signal propagated through the building rubble. While the 1832.5 MHz transmitter was also covered by a large amount of rubble, the metal pipe that was placed in the hole (see Section 6) allowed the high-frequency signal to propagate more freely through the rubble pile. This is explained by the fact the cutoff frequency for a circular pipe is given by [7]:
a
xf 4048.22103 8
π= , (1)
where a is the radius of the pipe. For the 6-inch pipe used in the experiment, the cut-off frequency was around 1500 MHz. Figures 72-74 show the pre- and post-implosion data for the fixed receiver located at Receiver Site B. Each of these three figures corresponds to the three fixed transmitter sites. Once again, the implosion at about 8 a.m. is indicated in the figures by the dramatic change in the signal levels. The data from Receiver Site C are analyzed next. Figures 75-77 show the pre- and post-implosion data for the fixed receiver located at Site C. Each of these three figures corresponds to

15
the three fixed transmitter sites. Once again, after the implosion occurred we see a dramatic change in the signal levels. This implosion was designed to obtain a total collapse of the building, representing a worst-case scenario for simulating first responder communications. This is illustrated in Figures 78-80. Figure 78 shows the building collapsing, Figure 79 shows the building after the implosion, and Figure 80 shows the mobile cart being used. After the implosion, the mobile cart was used as a receiving site and pulled around the perimeter of the building to record the transmitted signals. The path that was used for this data set collection is shown in Figure 66. This is the same path that was used in the cart measurements before the implosion. Figures 81 and 82 show the receiver signal strengths for the transmitters in the hole and in the elevator, respectively. Note that the transmitters in the control room stopped transmitting after the implosion, and hence, no results for those transmitters are shown here. Measurements for the transmitters in the hole were made before the implosion such that a pre- and post-signal strengths could be compared. These comparisons are shown in Figure 83-88. From these figures, it appears as if the post-implosion signals are either not transmitting or at the noise floor of the measurement instruments. With other measurements (see next section) it was confirmed that the transmitters in the hole were indeed transmitting. Thus, from the results in Figures 83-88, we see that the large amount of building rubble causes as much as 60 to 80 dB of attenuation of the signal. Thus, if someone is trapped under such a rubble pile and is trying to communicate with an emergency responder with a two-way radio or cell phone, their communication link would have to overcome 60 to 80 dB of attenuation. 7.5 Field Tests of the Debris Radiator Concept The far-field electromagnetic energy emanating from signal source decreases in strength with the square of the distance from the antenna. This means that the electric field strength available to a receiver drops off rapidly as one moves away from the transmitting antenna. When line-of-sight conditions exist between transmitter and receiver, using a standard single-element antenna on a handheld radio or cell phone poses no problem even at distances on the order of miles. However, inside buildings, signal attenuation (loss) and multipath (reflected signals that interfere with the primary received signal) can reduce the usable operating range of these radios to much shorter distances. As our propagation studies have shown, in the case of a collapsed building, a dense pile of debris can reduce the electric field strength at a receiver by 50 dB or more, making standard point-to-point communications difficult. However, in collapsed building scenarios, a great deal of metallic debris is often present. Some of this debris takes the form of long metallic objects such as conduit, wiring, and pipes. To form a debris radiator, one utilizes the metallic debris at hand to guide energy through rubble to a receiver outside. This can be done by either replacing the existing transmit or receive antenna on a handheld radio with long metallic debris or by placing the existing transmit or receive antenna in the proximity of the metallic object.

16
Since the opportunity to select a suitable metallic object in an emergency scenario is an uncertain condition, use of debris radiators is envisioned as a tool of last resort for someone trapped in the debris pile. Optimally, one would choose as a debris radiator an object that runs unbroken from the inside to the outside of a building and has suitable transmission properties, including its proximity to earth ground. Close proximity to earth ground can reduce the efficiency of the radiator. Since the choice of debris radiator is quite open ended and the propagation environment is complicated, use of simulation studies to verify even simple problems would need to be exhaustive. We have opted for laboratory and field tests to investigate the debris radiator concept. Our studies show that improvement in received signal level can range from zero to several orders of magnitude when debris radiators are used. Measurements carried out during the New Orleans implosion served as the first field tests for the debris radiator concept. To maximize our chances of a useful outcome, we utilized a set of transmitters located in an area with a high chance of surviving the implosion, namely, the transmitters located in the hole. We then simulated the best-case scenario of a metallic object running continuously from a radio to a receive site by laying stranded steel cables from the hole (in close proximity to the radios) to the edge of what would be the debris pile after implosion. Use of the pre-placed cables also meant that even if post-blast safety considerations kept us from getting close to the collapsed building, we could still acquire useful data. Two cables were run to the east side of the building (Figure 23) and one cable was placed in a protective steel fire-sprinkler pipe and run to the west side of the building (Figure 24). The set-up is shown schematically in Figure 89. We measured the received signals both before and after the building implosion using a spectrum analyzer as our receiver. We compared reception using two receiving antenna scenarios. The first consisted of a directional, log-periodic antenna with a gain of about 10 in the direction of the array (received signal 10 times stronger than with an omni-directional antenna). For the second scenario, we attached the spectrum analyzer directly to the steel cables through an impedance tuner. These impedance tuners are available commercially for use in the amateur radio bands. These two setups are shown in Figure 90. The directional antenna is mounted on the tripod, and the impedance tuner set up is being connected to the cables on the ground. Connecting our spectrum analyzer to the cable through the tuner maximized the coupling of the signal between the cable and the spectrum analyzer. We measured signals in the 160 MHz, 220 MHz, and 450 MHz frequency bands, all of which are near public-safety bands. Received-signal measurements were conducted before (Figure 90) and after (Figure 91) the building collapse. Figure 92 shows post-implosion measurements made on the east and west side of the building, respectively. After the implosion, the signals from the transmitters in the hole were not received by the methods used in the other experiments such as the mobile cart (see Figure 90). Those methods utilized standard directional antennas located some distance from the debris pile. When we moved close to the debris pile, and, more importantly, close to our debris radiator, we were able to receive very weak signals from the transmitters in the hole. This led us to conclude that the debris radiators were indeed coupling transmitted energy outside the debris pile.

17
Table 11 shows the results of our measurements. Post-implosion measurements at locations close to the debris pile show signal attenuation of 55 to 72 dB compared to pre-implosion values. This level is comparable to that found by the free-field measurements using the mobile cart and the fixed receiver sites discussed in earlier sections. These levels of attenuation can be thought of as a first-cut estimate for how much additional gain first responders must achieve to ensure communications with those trapped inside collapsed structures of this size and material. Table 11 also shows that use of the directional receiving antenna in close proximity to the debris radiator generally resulted in a higher received signal level than use of direct connection. However, on the west side of the building, direct connection to the metallic debris yielded results comparable to that of the antenna in the 162 MHz band. The west side was the case where the cable was protected from debris by the metal pipe. Several explanations are possible for the higher received signal level from the debris radiator: the pipe may have protected the cable from direct contact with lossy debris, the pipe may have protected the cable from being severed during the implosion, or the pipe may be acting as a debris radiator itself. The experiments discussed here were conducted to investigate whether debris radiators may enhance coupling of signals from deep within a collapsed structure to a receiver site outside in certain emergency situations. These measurements constitute the first field test of the debris radiator concept. Through experiments such as these, we are beginning to gain an understanding of what conditions make debris radiators more effective. Further tests in the field and in the laboratory have been carried out and will be discussed in subsequent publications.

18
Table 11. Summary of data collected from debris radiator experiments
8. Recovery of Transmitters After the implosion, the demolition contractor of the building recovered the transmitters so that we could examine them to determine whether the implosion destroyed them. This was needed to ensure that I n the case that a signal for one particular transmitter was not detected after the implosion, non-detection of signals was a result of the signal attenuation through the rubble, not a result of the transmitter being destroyed. Figure 93 shows a few of the recovered transmitters. The transmitters in Figure 93 (e) and (f) were not transmitting, but the others in this figure were operating properly after the implosion. 9. Summary of Results and Conclusion This report summarized radio propagation measurements performed before, during, and after the implosion of a 13-floor apartment building near New Orleans. Three different types of experiments were performed during this effort. The first set of data, which is referred to as “radio mapping,” was collected a few days before the building was imploded. This involved carrying transmitters tuned to various frequencies through the building while recording the received signal at a site located outside the building as mentioned above. The purpose of these measurements was to investigate how the signals at the different frequencies couple into the building and to determine the field strength variability throughout the building. The results in this report indicate that the building caused about 40 to 50 dB of attenuation of the signals. These attenuation numbers were obtained by normalizing the signal to outside LOS values. Therefore, this 40 to 50 dB indicates the additional design margins that may be required in a link budget analysis of a communication system in order to achieve communication into a large building of this type.
Pre-blast Post-blast
RX Location
Frequency (MHz)
Cable (C) (dBm)
Antenna (A) (dBm)
Diff. (C-A) (dB)
Cable (C) (dBm)
Antenna (A) (dBm)
Diff.(C-A) (dB)
162 –72 –35 –37 (noise) –94 --
225 –72 –39 –33 (noise) –94 -- East side
450 –71 –51 –20 -- -- --
162 –34 –28 –6 –104 –100 –4
225 –44 –30 –14 (noise) –99 -- West side
450 –65 –49 –16 -- -- --

19
The results in Section 7.1 illustrated that the field strengths varied throughout the building. In designing communication systems, the variability of the field strength is as important as the field strength itself. Some statistics of the field strength variability in the building were also investigated. The results in Section 7.2 show how the mean and standard deviation of the signals varied with both frequency and location in the building. These results show that the mean attenuation due to the building ranged from 25 to 50 dB and the standard deviation ranged from 6 to 14 dB, depending on frequency. These results indicate the variability in signal level a communication system might experience throughout a building of this type. There are a number of interesting studies and measurements published in the literature related to the attenuation of radio-frequency signals into buildings and through building materials [8-17]. Many, if not most, of these studies concentrated on frequencies allocated to cellular and personal communications systems near 850 and 1900 MHz and the higher GHz bands using measurement scenarios that model some part of the commercial cellular network including building interiors. While direct comparison of these results to our measurements is not possible, since each building and experimental setup is different, we can comment generally on how our data compare with the results in the literature. A comprehensive review of earlier (pre-1991) building attenuation studies is given by Molkdar [10]. The author notes that the statistics of the received signal strengths depend strongly on the structural design, building materials, and contents of the building. The surrounding environment (i.e., adjacent structures) also had an effect. Results for building attenuation or penetration loss were tabulated for several distinct categories; including residential (–2 to 24 dB), office building in suburban areas (1.5 to 36 dB), and office building in urban areas (2 to 38 dB). Again, these results were for the higher cellular frequencies. Devasirvatham et al. [9] claimed that the statistics of signal attenuation within the interior of a large commercial stone and masonry building for four different frequencies (850 MHz, 1.9 GHz, 4.9 GHz, and 5.8 GHz) were nearly the same. They reported path losses ranging from 20 dB to near 70 dB and standard deviations from 3 to 9 dB. In more recent experiments, Ju et al. [11] shows attenuation (path loss) between locations within an office building ranging from 20 to 80 dB at 1800 MHz with 15 to 35 dB from floor to floor. Tarng et al. [12] measured attenuation between floors in another office structure ranging from 20 to 47 dB at 900 MHz. The attenuation values of Ju et al. and Tarng et al. are similar to our measurements, but again, the measurement setups are quite different. Walker [13] measured attenuation into several different buildings at 850 MHz and showed average attenuation that ranged from 15 to 20 dB with standard deviations ranging from 5 to 11 dB. These buildings were illuminated by multiple cellular transmitters at distant locations, and the exterior and interior signal strength measurements were extensively averaged. Davidson et al. [14] also measured building penetration loss using cellular base transmitters some distance from the buildings (similar to Walker [13]). These measurements favored the side of the building facing the transmitter. The mean attenuation of all the buildings measured was 10.8 dB at 900 MHz and 10.2 dB at 1500 MHz, while standard deviations of 5.8 dB and 5.6 dB, respectively. In similar measurements, Tanis et al. [15] reported attenuation ranging from 16 to 19 dB for 880 MHz and 1922 MHz. The measurements of Loew et al. [16] are more similar to our configuration. They measured the path loss from a street level transmitter near the building (both line-of-sight and shadowed by another structure) to various points within multistory

20
commercial structures. These measurements showed mean attenuation of as much as 22 dB to 33 dB for 912 MHz and 1920 MHz for specific buildings. Standard deviations varied from 8.8 to 14.5 dB. In one of the few studies at the lower VHF frequencies, Rice [17] measured several structures and reported a mean penetration loss of 24.8 dB at 35 MHz with a standard deviation of 14 dB and 23 dB loss at 150 MHz with a standard deviation of 12 dB. We see there is huge variability in the experimental setup and objectives, the definition of the reference measurement, the building properties, and the surrounding environment in the various studies of building penetration loss. However, there is a consistent message in the data, namely that there is always some attenuating effect on the radio-frequency energy caused by the building. This attenuation is usually on the order of 10 to 30 dB but in certain situations it can climb as high as 80 dB or more. In the second type of data collection, radios were placed in fixed sites throughout the building. Received signals were collected before, during, and after the implosion. Our receiving sites in this case were both fixed and mobile. A mobile cart was pulled around the perimeter of the building both before and after the implosion, enabling direct comparison of signal strength as a function of azimuth angle through the standing building and the resulting pile of rubble. The implosion is indicated in the results by the dramatic change in the signal levels. In fact, the results show that some signals experienced large amounts of attenuation, while other signals increased after the implosion. This is explained by the fact that the once the building collapsed, the elevator shaft ended up on the top of the debris pile. Therefore, the signals from these transmitters no longer had to propagate through the entire building to be received. Measurements for the transmitters in the hole were made before the implosion such that a pre- and post-signal strength comparison could be made. These results show that large amounts of building rubble caused at least 40 to 80 dB of attenuation of the signal. The true attenuation is not established since we measured only noise. Thus, if someone is trapped under such a rubble pile and is trying to communicate with an emergency responder with a two-way radio or cell phone their communication link would have to overcome 60 to 80 dB of attenuation. The third set of data, referred to as “debris radiators,” was collected by connecting instruments to the building rubble. The purpose of this experiment was to investigate the probability of detecting radio signals from transmitter(s) under the rubble that might couple onto these metal objects and radiate signals to the edges of the rubble pile. Use of these so-called “debris radiators” may improve reception of signals emitted from deep within a building in such emergencies. Post-implosion measurements at locations close to the debris pile show signal attenuation of 55 to 72 dB compared to pre-implosion values. The results show that use of the directional receive antenna in close proximity to the debris radiator generally resulted in a higher received signal level than did use of direct connection. However, on the west side of the building, direct connection to the metallic debris yielded results comparable to that of the antenna in the 162 MHz band. The west side was the case where the cable was protected from debris by the metal pipe. Several explanations are possible for the higher received signal level from the debris radiator. Through experiments such as these, we are beginning to gain an understanding of what conditions make debris radiators more effective. Further tests in the field and in the laboratory have been carried out and will be discussed in subsequent publications.

21
The results in this report are the first of a set implosion experiments performed by NIST. The results of similar implosion experiments performed in a sports stadium, convention center, and additional buildings are the subject of separate reports. Besides implosion experiments, NIST has also performed radio-mapping experiments in various other large structures, including apartment and office buildings, sports stadiums, stores, malls, hotels, a convention center, and warehouses. The results of the signal strengths and statistical distribution for these radio-mapping experiments will also be published separately.
————————— This work was sponsored by the U.S. Department of Justice and the U.S. Department of Homeland Security through the Office of Law Enforcement Standards of NIST. We thank Jim Redyke of Dykon Explosive Demolition and John Angelina of D.H. Griffin Demolition Contractors for their assistance during this experiment. Without their help, this experiment would not have been possible. We also thank members of the technical staff of the Electromagnetics Division 818, who pulled together the equipment in a short time, including Dennis Friday, Perry Wilson, and Robert Judish for managerial support. 10. References [1] Statement of Requirements: Background on Public Safety Wireless Communications, The
SAFECOM Program, Department of Homeland Security, v.1.0, March 10, 2004. [2] M. Worrell and A. MacFarlane, Phoenix Fire Department Radio System Safety Project,
Phoenix Fire Dept. Final Report, Oct. 8, 2004, http://www.ci.phoenix.az.us/FIRE/radioreport.pdf. [3] 9/11 Commission Report, National Commission on Terrorist Attacks Upon the United
States, 2004. [4] Final report for September 11, 2001 New York World Trade Center terrorist attack,
Wireless Emergency Response Team (WERT), October 2001. [5] C.L. Holloway, G. Koepke, D. Camell, K.A. Remley, and D. Williams, Radio
Propagation Measurements During a Building Collapse: Applications for First Responders, Proc. Intl. Symp. Advanced Radio Tech., Boulder, CO, March 2005, pp. 61-63.
[6] APCO International, APCO Project 25 Standards for Public Safety Digital Radio, Aug.,
1995, http://www.apcointl.org/frequency/project25/information.html#documents.
[7] W.L. Weeks, Electromagnetic Theory for Engineering Applications. New York, N.Y.:
John Wiley & Sons, Inc., 1964, p. 475.

22
[8] Rubinstein, T.N., Clutter losses and environmental noise characteristics associated with various LULC categories, IEEE Trans. Broadcasting, 44(3): 286-293; Sept. 1998.
[9] D.M.J. Devasirvatham, C. Banerjee, R.R. Murray, and D.A. Rappaport, Four-frequency
radiowave propagation measurements of the indoor environment in a large metropolitan commercial building, Proc. GLOBECOM 1991, Phoenix, AZ, 2-5 Dec. 1991, pp. 1282-1286.
[10] D. Molkdar, Review on radio propagation into and within building, IEE Proceeding-H,
38(1): 61-73; Feb. 1991. [11] K.M. Ju, C.C. Chiang, H.S. Liaw, S.L. Her, Radio propagation in office building at 1.8
GHz, Proc. 7th IEEE Intl. Symp. on Personal, Indoor and Mobile Radio Communications, Taipei, 15-18 Oct., 1996, pp. 766-770.
[12] J.H. Tarng and D.W. Perng, Modeling and measurement of UHF radio propagating
through floors in a multifloored building, Proc. IEE, Microwave Antennas Propagat., 144(5): 359-363; Oct. 1997.
[13] E. Walker, Penetration of radio signals into building in the cellular radio environment,
Bell Syst. Tech. J., 62(9), Nov. 1983. [14] A. Davidson and C. Hill, Measurement of building penetration into medium buildings at
900 and 1500 MHz, IEEE Trans. Veh. Technol., 46(1): 161-168; Feb. 1997. [15] W.J. Tanis and G.J. Pilato, Building penetration characteristics of 880 MHz and 1922
MHz radio waves, Proc. 43th IEEE Veh. Technol. Conf., Secaucus, NJ, 18-20 May 1993, pp. 206-209.
[16] L.H. Loew, Y. Lo, M.G. Lafin, and E.E. Pol, Building penetration measurements from
low-height base stations at 912, 1920, and 5990 MHz, NTIA Report 95-325, National Telecommunications and Information Adminstration, Sept. 1995.
[17] L.P. Rice, Radio transmission into buildings at 35 and 150 mc, Bell Syst. Tech. J., pp.
197-210, Jan. 1959.

23
Figure 1. Fisher apartment building.
Figure 2. External hall.

24
Figure 3. Inside the apartment building.

25
Figu
re 4
. Bui
ldin
g pl
an.

26
Figure 5. Typical transmitters used for the lower four frequency bands.
Figure 6. Transmitters used for the two higher frequency bands.

27
Figure 7. Transmitter in the NIST Boulder anechoic chamber.
28
0 30 60 90 120 150 180 210 240 270 300 330 360Angle (degrees)
-30
-29
-28
-27
-26
-25
-24
-23
-22
-21
-20
-19
-18
-17
-16
-15
|E| (
dB)
Plane 1Plane 2Plane 3
Front or Top of Box
Figure 8. Radiation pattern of a 164 MHz transmitter in a protective case.
Front or Top of Box
0 30 60 90 120 150 180 210 240 270 300 330 360Angle (degrees)
-44-43-42-41-40-39-38-37-36-35-34-33-32-31-30-29-28-27-26-25-24-23-22
|E| (
dB)
Plane 1Plane 2Plane 3
Figure 9. Radiation pattern of a 225 MHz transmitter in a protective case.

29
Front or Top of Box
0 30 60 90 120 150 180 210 240 270 300 330 360Angle (degrees)
-64-62-60-58-56-54-52-50-48-46-44-42-40-38-36-34-32-30-28-26-24-22-20-18
|E| (
dB)
Plane 1Plane 2Plane 3
Figure 10. Radiation pattern of a 448 MHz transmitter in a protective case.

30
Figure 11. Schematic of the receiving system.
WidebandPower
Combiner
50 MHzVertical Whip
1830 MHzYagi Antenna
900 MHzYagi Antenna
120 - 1000 MHzLPDA
Portable Spectrum Analyzer
Antenna Mast installed inTRIPOD or CART
GPS Receiver

31
Figure 12. Photo of the weather-resistant antenna system mounted on a tripod and secured to a storage container to prevent tipping during the implosion. The receiving instruments are
protected inside the container.

32
Figure 13. Receiving site at on the northeast perimeter of the building.
Figure 14
Figure 14. Walking transmitters through the building.
Figure 15. Back side of building prepared for implosion
showing three fixed-transmitter site locations.

33
Figure 16. Fixed transmitter location on fourteenth floor.
Figure 17. Fixed transmitter location on third floor at elevator.
Spiral staircase location
third floor elevator location

34
Figure 18. Fixed transmitter location in hole in concrete on bottom floor.
35
(a) (b)
(c) Figure 19. Final installation of transmitters with protective blast cloth; (a) fourteenth level, (b) elevator location, (c) hole in concrete.

36
Figure 20. Location of the three fixed receiving sites.

37
(a) (b) (c) (d) Figure 21. Locations of the three fixed receiving sites. (a) site C: north site (unstaffed site, 30 m away), (b) building used to protect measurement system at site C, (c) site B: northeast site (staffed, 304.8 m away), and (d) site A: southeast site (staffed, 304.8 m away).

38
Figure 22. Mobile measurement cart.

39
Figure 23. Cables on east side of building. Cables were run from the transmitter site under the building to the east side of the building.
Figure 24. Pipe and cable on west side of building. This cable was enclosed in a protective metallic pipe that ran from the transmitter site under the building to the west side of the building.

40
300 350 400 450 500 550 600 650 700 750 800 850 900Data file location
-70
-60
-50
-40
-30
-20
-10
0
Pow
er (d
B)
Figure 25. Building walk-through at 49.6 MHz.
300 350 400 450 500 550 600 650 700 750 800 850 900Data file location
-70
-60
-50
-40
-30
-20
-10
0
Pow
er (d
B)
Figure 26. Building walk-through at 162.0 MHz.

41
300 350 400 450 500 550 600 650 700 750 800 850 900Data file location
-70
-60
-50
-40
-30
-20
-10
0P
ower
(dB
)
Figure 27. Building walk-through at 225.375 MHz.
300 350 400 450 500 550 600 650 700 750 800 850 900Data file location
-70
-60
-50
-40
-30
-20
-10
0
Pow
er (d
B)
Figure 28. Building walk-through at 448.6 MHz.

42
300 350 400 450 500 550 600 650 700 750 800 850 900Data file location
-70
-60
-50
-40
-30
-20
-10
0
Pow
er (d
B)
Figure 29. Building walk-through at 902.6 MHz.
300 350 400 450 500 550 600 650 700 750 800 850 900Data file location
-70
-60
-50
-40
-30
-20
-10
0
Pow
er (d
B)
Figure 30. Building walk-through at 1832.5 MHz.

43
Turn
ing
on T
x
All o
n an
d w
alki
ng
Wal
king
beh
ind
smal
l bui
ldin
g
At H
ole
In H
ole
Out
of H
ole
Wal
king
to S
tairs
300 310 320 330 340 350 360 370Data file location
-100
-90
-80
-70
-60
-50
-40
-30
-20
-10
0
Pow
er (d
B)
Figure 31. Starting walk-through and hole data at 49.6 MHz.
Turn
ing
on T
x
All o
n an
d w
alki
ng
Wal
king
beh
ind
smal
l bui
ldin
g
At H
ole
In H
ole
Out
of H
ole
Wal
king
to S
tairs
300 310 320 330 340 350 360 370Data file location
-100
-90
-80
-70
-60
-50
-40
-30
-20
-10
0
Pow
er (d
B)
Figure 32. Starting walk-through and hole data at 162.0 MHz.

44
Turn
ing
on T
x
All o
n an
d w
alki
ng
Wal
king
beh
ind
smal
l bui
ldin
g
At H
ole
In H
ole
Out
of H
ole
Wal
king
to S
tairs
300 310 320 330 340 350 360 370Data file location
-100
-90
-80
-70
-60
-50
-40
-30
-20
-10
0
Pow
er (d
B)
Figure 33. Starting walk-through and hole data at 225.375 MHz.
Turn
ing
on T
x
All o
n an
d w
alki
ng
Wal
king
beh
ind
smal
l bui
ldin
g
At H
ole
In H
ole
Out
of H
ole
Wal
king
to S
tairs
300 310 320 330 340 350 360 370Data file location
-100
-90
-80
-70
-60
-50
-40
-30
-20
-10
0
Pow
er (d
B)
Figure 34. Starting walk-through and hole data at 448.6 MHz.

45
Turn
ing
on T
x
All o
n an
d w
alki
ng
Wal
king
beh
ind
smal
l bui
ldin
g
At H
ole
In H
ole
Out
of H
ole
Wal
king
to S
tairs
300 310 320 330 340 350 360 370Data file location
-100
-90
-80
-70
-60
-50
-40
-30
-20
-10
0
Pow
er (d
B)
Figure 35. Starting walk-through and hole data at 902.6 MHz.
Turn
ing
on T
x
All o
n an
d w
alki
ng
Wal
king
beh
ind
smal
l bui
ldin
g
At H
ole
In H
ole
Out
of H
ole
Wal
king
to S
tairs
300 310 320 330 340 350 360 370Data file location
-100
-90
-80
-70
-60
-50
-40
-30
-20
-10
0
Pow
er (d
B)
Figure 36. Starting walk-through and hole data at 1832.5 MHz.

46
Walking up stairs to FL 12
Win
dow
on
FL 1
2
Leav
ing
win
dow
Wal
king
dow
n S
tairs
360 370 380 390 400 410 420 430 440 450 460 470 480 490 500Location
-100
-90
-80
-70
-60
-50
-40
-30
-20
-10
0
Pow
er (d
B)
a
Figure 37. Stairwell data 49.6 MHz.
Walking up stairs to FL 12
Win
dow
on
FL 1
2
Leav
ing
win
dow
Wal
king
dow
n S
tairs
360 370 380 390 400 410 420 430 440 450 460 470 480 490 500Location
-100
-90
-80
-70
-60
-50
-40
-30
-20
-10
0
Pow
er (d
B)
a
Figure 38. Stairwell data 162.0 MHz.

47
Walking up stairs to FL 12
Win
dow
on
FL 1
2
Leav
ing
win
dow
Wal
king
dow
n S
tairs
360 370 380 390 400 410 420 430 440 450 460 470 480 490 500Location
-100
-90
-80
-70
-60
-50
-40
-30
-20
-10
0
Pow
er (d
B)
a
Figure 39. Stairwell data 225.375 MHz.
Walking up stairs to FL 12
Win
dow
on
FL 1
2
Leav
ing
win
dow
Wal
king
dow
n S
tairs
360 370 380 390 400 410 420 430 440 450 460 470 480 490 500Location
-100
-90
-80
-70
-60
-50
-40
-30
-20
-10
0
Pow
er (d
B)
a
Figure 40. Stairwell data 448.6 MHz.

48
Walking up stairs to FL 12
Win
dow
on
FL 1
2
Leav
ing
win
dow
Wal
king
dow
n S
tairs
360 370 380 390 400 410 420 430 440 450 460 470 480 490 500Location
-100
-90
-80
-70
-60
-50
-40
-30
-20
-10
0
Pow
er (d
B)
a
Figure 41. Stairwell data 902.6 MHz.
Walking up stairs to FL 12
Win
dow
on
FL 1
2
Leav
ing
win
dow
Wal
king
dow
n S
tairs
360 370 380 390 400 410 420 430 440 450 460 470 480 490 500Location
-100
-90
-80
-70
-60
-50
-40
-30
-20
-10
0
Pow
er (d
B)
a
Figure 42. Stairwell data 1832.5 MHz.

49
500 510 520 530 540 550 560 570 580 590 600 610 620 630 640 650Location
-100
-90
-80
-70
-60
-50
-40
-30
-20
-10
0
Pow
er (d
B)
Eas
t Win
dow
Flo
or 2
Eas
t Win
dow
Flo
or 3
Eas
t Win
dow
Flo
or 4
Eas
t Win
dow
Flo
or 6
Eas
t Win
dow
Flo
or 7
Eas
t Win
dow
Flo
or 8
Eas
t Win
dow
Flo
or 1
0
Eas
t Win
dow
Flo
or 1
1
Eas
t Win
dow
Flo
or 1
2
Figure 43. Building walk-through with transmitters at window (LOS to receiver) of each floor at 49.6 MHz.
500 510 520 530 540 550 560 570 580 590 600 610 620 630 640 650Location
-100
-90
-80
-70
-60
-50
-40
-30
-20
-10
0
Pow
er (d
B)
Eas
t Win
dow
Flo
or 2
Eas
t Win
dow
Flo
or 3
Eas
t Win
dow
Flo
or 4
Eas
t Win
dow
Flo
or 6
Eas
t Win
dow
Flo
or 7
Eas
t Win
dow
Flo
or 8
Eas
t Win
dow
Flo
or 1
0
Eas
t Win
dow
Flo
or 1
1
Eas
t Win
dow
Flo
or 1
2
Figure 44. Building walk-through with transmitters at window (LOS to receiver) of each floor at 162.0 MHz.

50
500 510 520 530 540 550 560 570 580 590 600 610 620 630 640 650Location
-100
-90
-80
-70
-60
-50
-40
-30
-20
-10
0
Pow
er (d
B)
Eas
t Win
dow
Flo
or 2
Eas
t Win
dow
Flo
or 3
Eas
t Win
dow
Flo
or 4
Eas
t Win
dow
Flo
or 6
Eas
t Win
dow
Flo
or 7
Eas
t Win
dow
Flo
or 8
Eas
t Win
dow
Flo
or 1
0
Eas
t Win
dow
Flo
or 1
1
Eas
t Win
dow
Flo
or 1
2
Figure 45. Building walk-through with transmitters at window (LOS to receiver) of each floor at 225.375 MHz.
500 510 520 530 540 550 560 570 580 590 600 610 620 630 640 650Location
-100
-90
-80
-70
-60
-50
-40
-30
-20
-10
0
Pow
er (d
B)
Eas
t Win
dow
Flo
or 2
Eas
t Win
dow
Flo
or 3
Eas
t Win
dow
Flo
or 4
Eas
t Win
dow
Flo
or 6
Eas
t Win
dow
Flo
or 7
Eas
t Win
dow
Flo
or 8
Eas
t Win
dow
Flo
or 1
0
Eas
t Win
dow
Flo
or 1
1
Eas
t Win
dow
Flo
or 1
2
Figure 46. Building walk-through with transmitters at window (LOS to receiver) of each floor at 448.6 MHz.
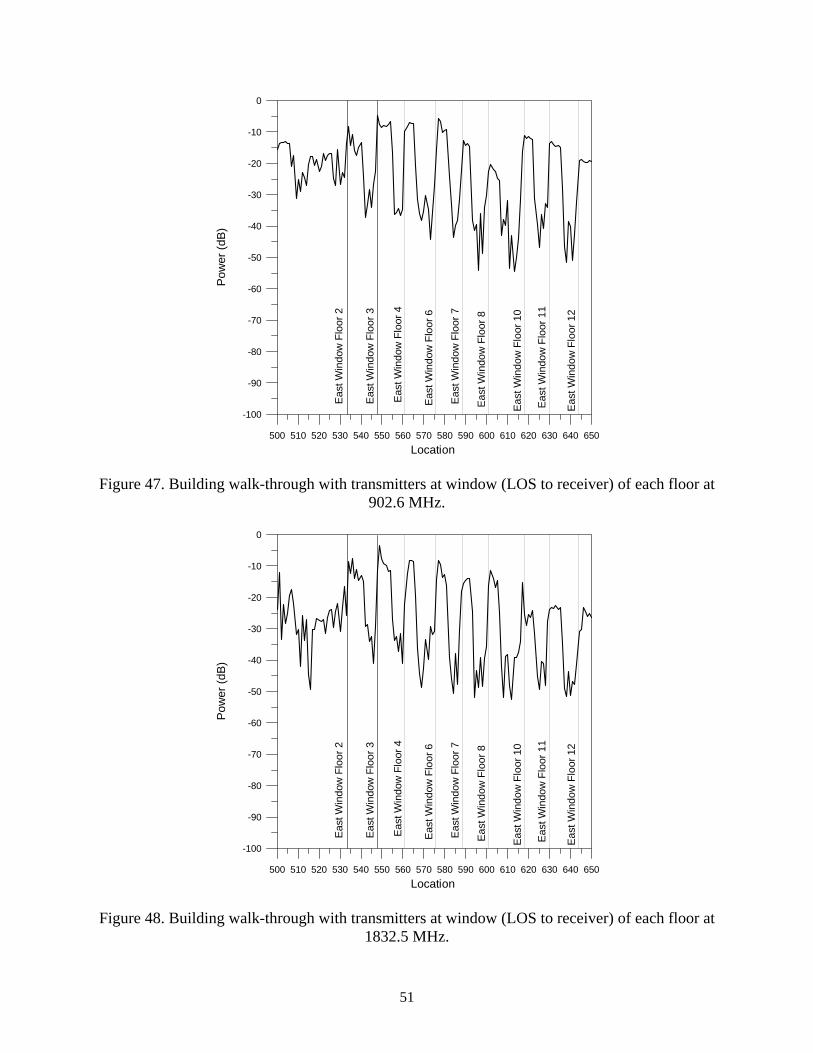
51
500 510 520 530 540 550 560 570 580 590 600 610 620 630 640 650Location
-100
-90
-80
-70
-60
-50
-40
-30
-20
-10
0
Pow
er (d
B)
Eas
t Win
dow
Flo
or 2
Eas
t Win
dow
Flo
or 3
Eas
t Win
dow
Flo
or 4
Eas
t Win
dow
Flo
or 6
Eas
t Win
dow
Flo
or 7
Eas
t Win
dow
Flo
or 8
Eas
t Win
dow
Flo
or 1
0
Eas
t Win
dow
Flo
or 1
1
Eas
t Win
dow
Flo
or 1
2
Figure 47. Building walk-through with transmitters at window (LOS to receiver) of each floor at 902.6 MHz.
500 510 520 530 540 550 560 570 580 590 600 610 620 630 640 650Location
-100
-90
-80
-70
-60
-50
-40
-30
-20
-10
0
Pow
er (d
B)
Eas
t Win
dow
Flo
or 2
Eas
t Win
dow
Flo
or 3
Eas
t Win
dow
Flo
or 4
Eas
t Win
dow
Flo
or 6
Eas
t Win
dow
Flo
or 7
Eas
t Win
dow
Flo
or 8
Eas
t Win
dow
Flo
or 1
0
Eas
t Win
dow
Flo
or 1
1
Eas
t Win
dow
Flo
or 1
2
Figure 48. Building walk-through with transmitters at window (LOS to receiver) of each floor at 1832.5 MHz.

52
Con
trol R
oom
Terra
ce o
n FL
oor 1
2
Roo
f
Rot
ate
Box
es
Rot
ate
Box
es
Leav
ing
Roo
f
Wal
king
to S
tairs
655 670 685 700 715 730 745 760 775 790Location
-100
-90
-80
-70
-60
-50
-40
-30
-20
-10
0
Pow
er (d
B)
a
Figure 49. Control room and roof top at 49.6 MHz.
Con
trol R
oom
Terra
ce o
n FL
oor 1
2
Roo
f
Rot
ate
Box
es
Rot
ate
Box
es
Leav
ing
Roo
f
Wal
king
to S
tairs
655 670 685 700 715 730 745 760 775 790Location
-100
-90
-80
-70
-60
-50
-40
-30
-20
-10
0
Pow
er (d
B)
a
Figure 50. Control room and roof top at 162.0 MHz.

53
Con
trol R
oom
Terra
ce o
n FL
oor 1
2
Roo
f
Rot
ate
Box
es
Rot
ate
Box
es
Leav
ing
Roo
f
Wal
king
to S
tairs
655 670 685 700 715 730 745 760 775 790Location
-100
-90
-80
-70
-60
-50
-40
-30
-20
-10
0
Pow
er (d
B)
a
Figure 51. Control room and roof top at 225.375 MHz.
Con
trol R
oom
Terra
ce o
n FL
oor 1
2
Roo
f
Rot
ate
Box
es
Rot
ate
Box
es
Leav
ing
Roo
f
Wal
king
to S
tairs
655 670 685 700 715 730 745 760 775 790Location
-100
-90
-80
-70
-60
-50
-40
-30
-20
-10
0
Pow
er (d
B)
a
Figure 52. Control room and roof top at 448.6 MHz.

54
Con
trol R
oom
Terra
ce o
n FL
oor 1
2
Roo
f
Rot
ate
Box
es
Rot
ate
Box
es
Leav
ing
Roo
f
Wal
king
to S
tairs
655 670 685 700 715 730 745 760 775 790Location
-100
-90
-80
-70
-60
-50
-40
-30
-20
-10
0
Pow
er (d
B)
a
Figure 53. Control room and roof top at 902.6 MHz.
Con
trol R
oom
Terra
ce o
n FL
oor 1
2
Roo
f
Rot
ate
Box
es
Rot
ate
Box
es
Leav
ing
Roo
f
Wal
king
to S
tairs
655 670 685 700 715 730 745 760 775 790Location
-100
-90
-80
-70
-60
-50
-40
-30
-20
-10
0
Pow
er (d
B)
a
Figure 54. Control room and roof top at 1832.5 MHz.

55
Stai
rs F
L3
Wal
king
to S
tairs
Gro
und
Floo
r
In h
ole
a766 781 796 811 826 841 856 871
Location
-100
-90
-80
-70
-60
-50
-40
-30
-20
-10
0
Pow
er (d
B)
Walking
down s
tairs
to FL3
Blast L
oc. F
loor 3
Build
ing
Edge
Figure 55. From the control room to exiting the building at 49.6 MHz.
Stai
rs F
L3
Wal
king
to S
tairs
Gro
und
Floo
r
In h
ole
a766 781 796 811 826 841 856 871
Location
-100
-90
-80
-70
-60
-50
-40
-30
-20
-10
0
Pow
er (d
B)
Walking
down s
tairs
to FL3
Blast L
oc. F
loor 3
Build
ing
Edge
Figure 56. From the control room to exiting the building at 162.0 MHz.

56
Stai
rs F
L3
Wal
king
to S
tairs
Gro
und
Floo
r
In h
ole
a766 781 796 811 826 841 856 871
Location
-100
-90
-80
-70
-60
-50
-40
-30
-20
-10
0
Pow
er (d
B)
Walking
down s
tairs
to FL3
Blast L
oc. F
loor 3
Build
ing
Edge
Figure 57. From the control room to exiting the building at 225.375 MHz.
Stai
rs F
L3
Wal
king
to S
tairs
Gro
und
Floo
r
In h
ole
a766 781 796 811 826 841 856 871
Location
-100
-90
-80
-70
-60
-50
-40
-30
-20
-10
0
Pow
er (d
B)
Walking
down s
tairs
to FL3
Blast L
oc. F
loor 3
Build
ing
Edge
Figure 58. From the control room to exiting the building at 448.6 MHz.

57
Stai
rs F
L3
Wal
king
to S
tairs
Gro
und
Floo
r
In h
ole
a766 781 796 811 826 841 856 871
Location
-100
-90
-80
-70
-60
-50
-40
-30
-20
-10
0
Pow
er (d
B)
Walking
down s
tairs
to FL3
Blast L
oc. F
loor 3
Build
ing
Edge
Figure 59. From the control room to exiting the building at 902.6 MHz.
Stai
rs F
L3
Wal
king
to S
tairs
Gro
und
Floo
r
In h
ole
a766 781 796 811 826 841 856 871
Location
-100
-90
-80
-70
-60
-50
-40
-30
-20
-10
0
Pow
er (d
B)
Walking
down s
tairs
to FL3
Blast L
oc. F
loor 3
Build
ing
Edge
Figure 60. From the control room to exiting the building at 1832.5 MHz.

58
(a) (b)
(c) (d)
(e) (f) Figure 61. Histograms for data collected in stairwell.
-100 -90 -80 -70 -60 -50 -40 -30 -20 -10 0Power (dB)
0
4
8
12
16
20
N
Frequency: 49.6 MHzMean: -39.9Std Dev: 8.8
-100 -90 -80 -70 -60 -50 -40 -30 -20 -10 0Power (dB)
0
10
20
30
N
Frequency: 162.0 MHzMean: -31.2Std Dev: 5.9
-100 -90 -80 -70 -60 -50 -40 -30 -20 -10 0Power (dB)
0
10
20
30
N
Frequency: 225.375 MHzMean: -38.9Std Dev: 5.9
-100 -90 -80 -70 -60 -50 -40 -30 -20 -10 0Power (dB)
0
10
20
30
N
Frequency: 448.6 MHzMean: -44.4Std Dev: 6.9
-100 -90 -80 -70 -60 -50 -40 -30 -20 -10 0Power (dB)
0
4
8
12
16
20
N
Frequency: 902.6 MHzMean: -37.7Std Dev: 9.7
-100 -90 -80 -70 -60 -50 -40 -30 -20 -10 0Power (dB)
0
4
8
12
16
20
N
Frequency: 1832.5 MHzMean: -40.5Std Dev: 10.4

59
(a) (b)
(c) (d)
(e) (f)
Figure 62. Histograms for data collected in building with windows in LOS.
-100 -90 -80 -70 -60 -50 -40 -30 -20 -10 0Power (dB)
0
10
20
30
N
Frequency: 49.6 MHzMean: -35.0Std Dev: 10.2
-100 -90 -80 -70 -60 -50 -40 -30 -20 -10 0Power (dB)
0
5
10
15
20
25
N
Frequency: 162.0 MHzMean: -21.6Std Dev: 10.4
-100 -90 -80 -70 -60 -50 -40 -30 -20 -10 0Power (dB)
0
10
20
30
N
Frequency: 225.375 MHzMean: -26.9Std Dev: 8.9
-100 -90 -80 -70 -60 -50 -40 -30 -20 -10 0Power (dB)
0
4
8
12
16
20
N
Frequency: 448.6 MHzMean: -32.5Std Dev: 9.3
-100 -90 -80 -70 -60 -50 -40 -30 -20 -10 0Power (dB)
0
4
8
12
16
N
Frequency: 902.6 MHzMean: -24.6Std Dev: 12.4
-100 -90 -80 -70 -60 -50 -40 -30 -20 -10 0Power (dB)
0
4
8
12
16
N
Frequency: 1832.5 MHzMean: -28.4Std Dev: 12.5

60
(a) (b)
(c) (d)
(e) (f)
Figure 63. Histograms for data collected in control room and roof.
-100 -90 -80 -70 -60 -50 -40 -30 -20 -10 0Power (dB)
0
4
8
12
16
20
N
Frequency: 49.6 MHzMean: -35.0Std Dev: 13.9
-100 -90 -80 -70 -60 -50 -40 -30 -20 -10 0Power (dB)
0
10
20
30
40
N
Frequency: 162.0 MHzMean: -27.2Std Dev: 12.3
-100 -90 -80 -70 -60 -50 -40 -30 -20 -10 0Power (dB)
0
4
8
12
16
20
N
Frequency: 225.375 MHzMean: -32.5Std Dev: 11.6
-100 -90 -80 -70 -60 -50 -40 -30 -20 -10 0Power (dB)
0
10
20
30
40
N
Frequency: 448.6 MHzMean: -43.3Std Dev: 6.4
-100 -90 -80 -70 -60 -50 -40 -30 -20 -10 0Power (dB)
0
5
10
15
20
25
N
Frequency: 902.6 MHzMean: -41.8Std Dev: 12.1
-100 -90 -80 -70 -60 -50 -40 -30 -20 -10 0Power (dB)
0
5
10
15
20
25
N
Frequency: 1832.5 MHzMean: -45.3Std Dev: 7.7

61
(a) (b)
(c) (d)
(e) (f)
Figure 64. Histograms for data collected throughout building without window stops.
-100 -90 -80 -70 -60 -50 -40 -30 -20 -10 0Power (dB)
0
4
8
12
16
20
N
Frequency: 49.6 MHzMean: -49.1Std Dev: 8.6
-100 -90 -80 -70 -60 -50 -40 -30 -20 -10 0Power (dB)
0
10
20
30
N
Frequency: 162.0 MHzMean: -38.9Std Dev: 6.8
-100 -90 -80 -70 -60 -50 -40 -30 -20 -10 0Power (dB)
0
10
20
30
N
Frequency: 225.375 MHzMean: -41.4Std Dev: 6.8
-100 -90 -80 -70 -60 -50 -40 -30 -20 -10 0Power (dB)
0
4
8
12
16
20
N
Frequency: 448.6 MHzMean: -45.7Std Dev: 5.9
-100 -90 -80 -70 -60 -50 -40 -30 -20 -10 0Poawer (dB)
0
4
8
12
16
20
N
Frequency: 902.6 MHzMean: -42.2Std Dev: 10.5
-100 -90 -80 -70 -60 -50 -40 -30 -20 -10 0Power (dB)
0
4
8
12
16
20
N
Frequency: 1832.5 MHzMean: -43.5Std Dev: 10.8

62
(a) (b)
(c) (d)
(e) (f)
Figure 65. Histograms for data collected for entire building.
-100 -90 -80 -70 -60 -50 -40 -30 -20 -10 0Power (dB)
0
10
20
30
40
50
N
Frequency: 49.6 MHzMean: -38.6Std Dev: 12.1
-100 -90 -80 -70 -60 -50 -40 -30 -20 -10 0Power (dB)
0
10
20
30
40
50
N
Frequency: 162.0 MHzMean: -28.4Std Dev: 11.2
-100 -90 -80 -70 -60 -50 -40 -30 -20 -10 0Power (dB)
0
10
20
30
40
50
N
Frequency: 225.375 MHzMean: -33.9Std Dev: 10.4
-100 -90 -80 -70 -60 -50 -40 -30 -20 -10 0Power (dB)
0
20
40
60
N
Frequency: 448.6 MHzMean: -40.7Std Dev: 9.2
-100 -90 -80 -70 -60 -50 -40 -30 -20 -10 0Power (dB)
0
10
20
30
40
50
N
Frequency: 902.6 MHzMean: -35.2Std Dev: 13.2
-100 -90 -80 -70 -60 -50 -40 -30 -20 -10 0Power (dB)
0
10
20
30
40
50
N
Frequency: 1832.5 MHzMean: -38.4Std Dev: 12.5

63
Figure 66. Coordinates of the building footprint (yellow) and cart location (blue).
-80
-70
-60
-50
-40
-30
-20
-10
0
10
0 45 90 135 180 225 270 315 360
Azimuth from Hole (deg)
Pow
er (d
Bm
)
49.6 MHz 162.0 MHz 225.375 MHz448.60 MHz 902.6 MHz 1832.5 MHz
Figure 67. Pre-implosion data from the mobile cart for the transmitters in the hole.
Walk Around Path Pre-Blast
2.42
2.43
2.44
2.45
2.46
2.47
2.48
2.49
55.92 55.93 55.94 55.95 55.96 55.97 55.98 55.99 56 56.01
Latitude (N29)
Long
itude
(W90
)

64
-105
-100
-95
-90
-85
-80
-75
-70
-65
-60
7:59
:07
8:01
:06
8:03
:04
8:05
:01
Time
Pow
er (d
Bm
)
Roof: 49.6 MHz
Roof: 162.0 MHz
Roof: 225.375 MHz
Roof: 448.60 MHz
Figure 68. Pre- and post-implosion data collected from Receiver Site A for the transmitters
in the control room.
-105
-100
-95
-90
-85
-80
-75
-70
-65
-60
7:59
:07
8:01
:06
8:03
:04
8:05
:01
Time
Pow
er (d
Bm
)
Elevator: 49.66 MHz
Elevator: 162.09 MHz
Elevator: 226.3 MHz
Elevator: 448.7 MHz
Figure 69. Pre- and post-implosion data collected from Receiver Site A for the transmitters
at the third floor elevator.

65
-105
-100
-95
-90
-85
-80
-75
-70
-65
-60
7:59
:07
7:59
:37
8:00
:06
8:00
:36
8:01
:06
8:01
:35
8:02
:05
8:02
:34
8:03
:04
8:03
:33
8:04
:02
8:04
:32
8:05
:01
8:05
:30
8:06
:00Time
Pow
er (d
Bm
)
Hole: 49.72 MHzHole: 162.485 MHzHole: 226.65 MHzHole: 448.8 MHzHole: 902.6 MHzHole: 1832.5 MHz
Figure 70. Pre- and post-implosion data collected from Receiver Site A for the transmitters in the hole.
Figure 71. Location of the elevator shift and transmitters after the implosion.

66
-105
-100
-95
-90
-85
-80
-75
-70
-65
-60
8:00
:43
8:01
:35
8:02
:28
8:03
:20
Time
Pow
er (d
Bm
)
Roof: 49.6 MHz
Roof: 162.0 MHz
Roof: 225.375 MHz
Roof: 448.60 MHz
Figure 72. Pre- and post-implosion data collected from Receiver Site B for the
transmitters in the control room.
-105
-100
-95
-90
-85
-80
-75
-70
-65
-60
8:00
:43
8:01
:35
8:02
:28
8:03
:20
Time
Pow
er (d
Bm
)
Elevator: 49.66 MHz
Elevator: 162.09 MHz
Elevator: 226.3 MHz
Elevator: 448.7 MHz
Figure 73. Pre- and post-implosion data collected from Receiver Site B for the
transmitters at the third floor elevator.

67
-105
-100
-95
-90
-85
-80
-75
-70
-65
-60
8:00
:43
8:00
:51
8:00
:58
8:01
:06
8:01
:14
8:01
:22
8:01
:30
8:01
:38
8:01
:46
8:01
:53
8:02
:01
8:02
:09
8:02
:17
8:02
:25
8:02
:33
8:02
:41
8:02
:49
8:02
:57
8:03
:05
8:03
:12
8:03
:20
8:03
:28
8:03
:36
8:03
:44
Time
Pow
er (d
Bm
)
Hole: 49.72 MHzHole: 162.485 MHzHole: 226.65 MHzHole: 448.8 MHzHole: 902.6 MHzHole: 1832.5 MHz
Figure 74. Pre- and post-implosion data collected from Receiver Site B for the
transmitters in the hole.
-105
-100
-95
-90
-85
-80
-75
-70
-65
-60
7:57
:38
8:00
:16
8:02
:55
8:05
:33
Time
Pow
er (d
Bm
)
Roof: 49.6 MHzRoof: 162.0 MHzRoof: 225.375 MHzRoof: 448.60 MHz
Figure 75. Pre- and post-implosion data collected from Receiver site C for the
transmitter in the control room.

68
-105
-100
-95
-90
-85
-80
-75
-70
-65
-60
7:57
:38
8:00
:16
8:02
:55
8:05
:33
Time
Pow
er (d
Bm
)
Elevator: 49.66 MHz
Elevator: 162.09 MHz
Elevator: 226.3 MHz
Elevator: 448.7 MHz
Figure 76. Pre- and post-implosion data collected from Receiver Site C for the
transmitters at the third floor elevator.
-105
-100
-95
-90
-85
-80
-75
-70
-65
-60
7:57
:38
7:58
:02
7:58
:26
7:58
:49
7:59
:13
7:59
:37
8:00
:00
8:00
:24
8:00
:48
8:01
:12
8:01
:36
8:02
:00
8:02
:24
8:02
:48
8:03
:12
8:03
:35
8:03
:59
8:04
:22
8:04
:46
8:05
:10
8:05
:33
8:05
:56
8:06
:20
8:06
:44
Time
Pow
er (d
Bm
)
Hole: 49.72 MHzHole: 162.485 MHzHole: 226.65 MHzHole: 448.8 MHzHole: 902.6 MHzHole: 1832.5 MHz
Figure 77. Pre- and post-implosion data collected from Receiver Site C for the
transmitters in the hole.

69
(a) (b)
(c) (d)
(e) (f)
Figure 78. The building collapsing after implosion.
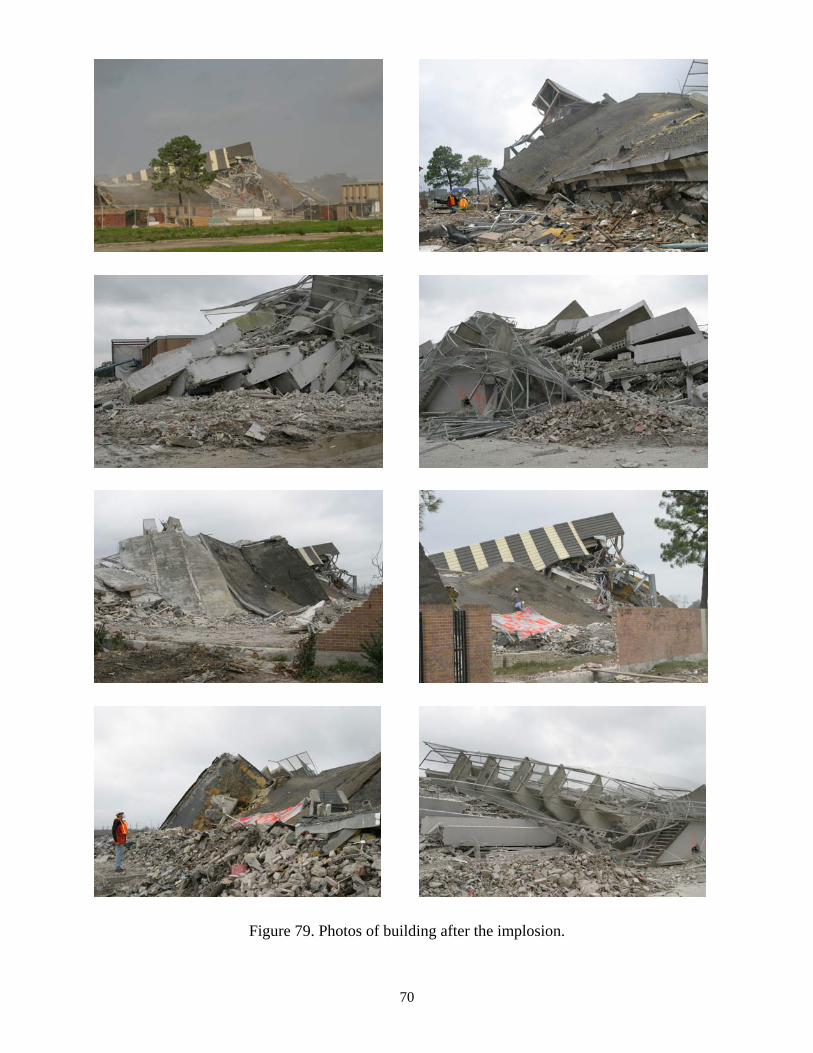
70
Figure 79. Photos of building after the implosion.
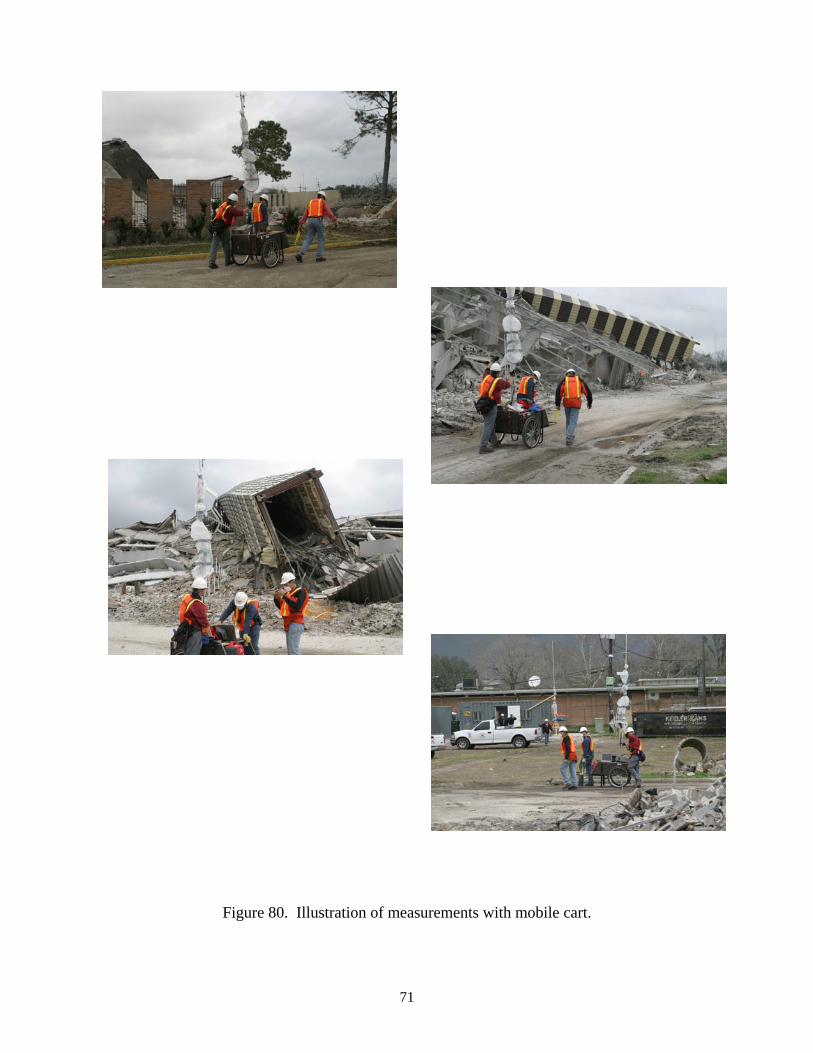
71
Figure 80. Illustration of measurements with mobile cart.

72
-105
-103
-101
-99
-97
-95
-93
-91
0 45 90 135 180 225 270 315 360
Compass Bearing (deg)
Pow
er (d
Bm
)
Hole: 49.72 MHz Hole: 162.485 MHz Hole: 226.65 MHzHole: 448.8 MHz Hole: 902.6 MHz Hole: 1832.5 MHz
Figure 81. Post-implosion mobile cart measurements for the transmitters in the hole.
-105
-85
-65
-45
-25
-5
15
0 45 90 135 180 225 270 315 360
Compass Bearing (deg)
Pow
er (d
Bm
)
Elevator: 49.66 MHz Elevator: 162.09 MHz
Elevator: 226.3 MHz Elevator: 448.7 MHz
Figure 82. Post-implosion mobile cart measurements for the
transmitters at the third floor elevator.

73
-120
-100
-80
-60
-40
-20
0
0 45 90 135 180 225 270 315 360
Compass Bearing From Hole (deg)
Pow
er (d
Bm
)
Hole: 49.72 MHz Pre-implosion: 49.6 MHz
Figure 83. Comparison of pre- and post-implosion mobile cart measurements for the
transmitters in the hole in 49 MHz band.
-120
-100
-80
-60
-40
-20
0
0 45 90 135 180 225 270 315 360
Compass Bearing from Hole (deg)
Pow
er (d
Bm
)
Hole: 162.485 MHz Pre-implosion: 162.0 MHz
Figure 84. Comparison of pre- and post-implosion mobile cart measurements for the
transmitters in the hole in 162 MHz band.

74
-120
-100
-80
-60
-40
-20
0
0 45 90 135 180 225 270 315 360
Compass Bearing from Hole (deg)
Pow
er (d
Bm
)
Hole: 226.65 MHz Pre-implosion: 225.375 MHz
Figure 85. Comparison of pre- and post-implosion mobile cart measurements for the
transmitters in the hole in 225 MHz band.
-120
-100
-80
-60
-40
-20
0
0 45 90 135 180 225 270 315 360
Compass Bearing from Hole (deg)
Pow
er (d
Bm
)
Hole: 448.8 MHz Pre-implosion: 448.60 MHz
Figure 86. Comparison of pre- and post-implosion mobile cart measurements for the
transmitters in the hole in 448 MHz band.

75
-120
-100
-80
-60
-40
-20
0
0 45 90 135 180 225 270 315 360
Compass Bearing from Hole (deg)
Pow
er (d
Bm
)
Hole: 902.6 MHz Pre-implosion: 902.6 MHz
Figure 87. Comparison of pre- and post-implosion mobile cart measurements for the
transmitters in the hole in 902 MHz band.
-120
-100
-80
-60
-40
-20
0
0 45 90 135 180 225 270 315 360
Compass Bearing from Hole (deg)
Pow
er (d
Bm
)
Hole: 1832.5 MHz Pre-implosion: 1832.5 MHz
Figure 88. Comparison of pre- and post-implosion mobile cart measurements for the
transmitters in the hole in 1832 MHz band.

76
Hole in floor of building
txtxtxWest Side of Building East Side of Building
Figure 89. Schematic representation of the layout for the debris radiator tests carried out in New Orleans. Two steel cables were run on the east side of the building to the edge of the debris pile. One steel cable was run inside a protective metal pipe to the west side of the building.
Figure 90. Two NIST scientists connect an impedance tuner between a debris radiator cable and a handheld spectrum analyzer. A log-periodic directional antenna is mounted on the tripod.

77
Figure 91. Post-implosion measurements. The mobile cart is in the foreground and the debris radiator tests are at right.
(a) (b)
Figure 92. Illustration of debris radiator measurements. (a) on one of the two cables on the east side of the building after implosion, (b) on the west side of the building. The end of the metal pipe housing the cable is located at the bottom of the stairs.
Debris Radiator Tests
Mobile Cart Tests

78
(a) (b)
(c) (d)
(e) (f)
Figure 93. Recovered transmitters.

NIST Technical Publications
Periodical
Journal of Research of the National Institute of Standards and TechnologyCReports NIST research and development in metrology and related fields of physical science, engineering, applied mathematics, statistics, biotechnology, and information technology. Papers cover a broad range of subjects, with major emphasis on measurement methodology and the basic technology underlying standardization. Also included from time to time are survey articles on topics closely related to the Institute's technical and scientific programs. Issued six times a year. Nonperiodicals MonographsCMajor contributions to the technical literature on various subjects related to the Institute's scientific and technical activities. HandbooksCRecommended codes of engineering and industrial practice (including safety codes) developed in cooperation with interested industries, professional organizations, and regulatory bodies. Special PublicationsCInclude proceedings of conferences sponsored by NIST, NIST annual reports, and other special publications appropriate to this grouping such as wall charts, pocket cards, and bibliographies. National Standard Reference Data SeriesCProvides quantitative data on the physical and chemical properties of materials, compiled from the world's literature and critically evaluated. Developed under a worldwide program coordinated by NIST under the authority of the National Standard Data Act (Public Law 90-396). NOTE: The Journal of Physical and Chemical Reference Data (JPCRD) is published bimonthly for NIST by the American Institute of Physics (AlP). Subscription orders and renewals are available from AIP, P.O. Box 503284, St. Louis, MO 63150-3284. Building Science SeriesCDisseminates technical information developed at the Institute on building materials, components, systems, and whole structures. The series presents research results, test methods, and performance criteria related to the structural and environmental functions and the durability and safety characteristics of building elements and systems. Technical NotesCStudies or reports which are complete in themselves but restrictive in their treatment of a subject. Analogous to monographs but not so comprehensive in scope or definitive in treatment of the subject area. Often serve as a vehicle for final reports of work performed at NIST under the sponsorship of other government agencies. Voluntary Product StandardsCDeveloped under procedures published by the Department of Commerce in Part 10, Title 15, of the Code of Federal Regulations. The standards establish nationally recognized requirements for products, and provide all concerned interests with a basis for common understanding of the characteristics of the products. NIST administers this program in support of the efforts of private-sector standardizing organizations. Order the following NIST publicationsCFIPS and NISTIRsCfrom the National Technical Information Service, Springfield, VA 22161. Federal Information Processing Standards Publications (FIPS PUB)CPublications in this series collectively constitute the Federal Information Processing Standards Register. The Register serves as the official source of information in the Federal Government regarding standards issued by NIST pursuant to the Federal Property and Administrative Services Act of 1949 as amended, Public Law 89-306 (79 Stat. 1127), and as implemented by Executive Order 11717 (38 FR 12315, dated May 11,1973) and Part 6 of Title 15 CFR (Code of Federal Regulations). NIST Interagency or Internal Reports (NISTIR)CThe series includes interim or final reports on work performed by NIST for outside sponsors (both government and nongovernment). In general, initial distribution is handled by the sponsor; public distribution is handled by sales through the National Technical Information Service, Springfield, VA 22161, in hard copy, electronic media, or microfiche form. NISTIRs may also report results of NIST projects of transitory or limited interest, including those that will be published subsequently in more comprehensive form.

U.S. Department of Commerce National Bureau of Standards and Technology 325 Broadway Boulder, CO 80305-3328 Official Business Penalty for Private Use $300