Project: VIGO Detection of cytokine expression in A549 cells · 2 Principle of the Method...
18
Document Type Document ID Version Status Page SOP I_qRT-PCR_A549 1.0 1/18 Project: VIGO Detection of cytokine expression in A549 cells Quantitative real-time reverse-transcription polymerase chain reaction (qRT-PCR) AUTHORED BY: DATE: Cordula Hirsch 16.01.2014 REVIEWED BY: DATE: Harald Krug 10.04.2014 APPROVED BY: DATE: DOCUMENT HISTORY Effective Date Date Revision Required Supersedes 15.02.2014 DD/MM/YYYY DD/MM/YYYY Version Approval Date Description of the Change Author / Changed by 1.0 DD/MM/YYYY All Initial Document Cordula Hirsch
Transcript of Project: VIGO Detection of cytokine expression in A549 cells · 2 Principle of the Method...

Document Type Document ID Version Status Page SOP I_qRT-PCR_A549 1.0 1/18
Project: VIGO
Detection of cytokine expression in A549 cells
Quantitative real-time reverse-transcription polymerase chain reaction (qRT-PCR)
AUTHORED BY: DATE:
Cordula Hirsch 16.01.2014
REVIEWED BY: DATE:
Harald Krug 10.04.2014
APPROVED BY: DATE:
DOCUMENT HISTORY
Effective Date Date Revision Required Supersedes
15.02.2014 DD/MM/YYYY DD/MM/YYYY
Version Approval Date Description of the Change Author / Changed by
1.0 DD/MM/YYYY All Initial Document Cordula Hirsch

Document Type Document ID Version Status Page SOP I_qRT-PCR_A549 1.0 2/18
Table of Content 1 Introduction ..................................................................................................................................... 3
2 Principle of the Method .................................................................................................................. 3
3 Applicability and Limitations ........................................................................................................... 3
4 Related Documents ......................................................................................................................... 4
5 Equipment and Reagents ................................................................................................................ 4
5.1 Equipment ............................................................................................................................... 4
5.2 Reagents .................................................................................................................................. 4
5.3 Reagent Preparation ............................................................................................................... 6
5.3.1 Complete cell culture medium ........................................................................................ 6
5.3.2 Pluronic F-127 .................................................................................................................. 6
5.3.3 Recombinant TNF-α ......................................................................................................... 6
6 Procedure ........................................................................................................................................ 6
6.1 General remarks ...................................................................................................................... 6
6.2 Flow chart 1 ............................................................................................................................. 7
6.3 Cell seeding .............................................................................................................................. 7
6.3.1 Cell culture ....................................................................................................................... 7
6.3.2 Cell seeding into 24-well plate ........................................................................................ 8
6.4 Cell treatment.......................................................................................................................... 8
6.4.1 Dilution of nanomaterials ................................................................................................ 8
6.4.2 Dilution of TNF-α (chemical positive control) ............................................................... 11
6.4.3 Application of stimuli ..................................................................................................... 11
6.5 RNA isolation ......................................................................................................................... 12
6.6 RNA measurement ................................................................................................................ 14
6.7 cDNA synthesis using iScriptTM (BioRad)................................................................................ 15
6.8 Real-time PCR using iQTM SYBR® Green Supermix and iCycler .............................................. 15
6.9 Data evaluation ..................................................................................................................... 17
7 Quality Control, Quality Assurance, Acceptance Criteria .............................................................. 17
8 Health and Safety Warnings, Cautions and Waste Treatment ...................................................... 18
9 Abbreviations ................................................................................................................................ 18
10 References ................................................................................................................................. 18

Document Type Document ID Version Status Page SOP I_qRT-PCR_A549 1.0 3/18
1 Introduction In general inflammation describes a systemic and complex reaction of the body to harmful stimuli, as e.g. pathogens or irritants. This process involves (among others) the production of different cytokines by different cell types to allow for a coordinated defense reaction of the body. Apart from analyzing cytokine release using the ELISA technique (enzyme-linked immunosorbent assay; see SOP “Detection of cytokine release in A549 cells”) the transcription level of the respective cytokines can be studied by qRT-PCR analysis.
2 Principle of the Method Quantitative real-time reverse transcription polymerase chain reaction (qRT-PCR) is used to amplify and simultaneously quantify a DNA molecule (gene) of interest. The procedure relies on the general PCR principle which will not be further detailed here (for basic textbook knowledge see e.g. “Molekulare Genetik, Rolf Knippers”).
To assess the amount of an actively transcribed gene of interest its level of messenger RNA (mRNA) is analyzed. Therefore total RNA is isolated and purified. Using reverse transcriptase copy DNA (cDNA) is synthesized and serves as the template for PCR analysis. Specific primers for human interleukin 8 (IL-8) and the housekeeping gene glyceraldehyde 3-phosphate dehydrogenase (GAPDH) are used. For PCR reaction and DNA detection an iCycler (BioRad) and Sybr Green are used, respectively. Gene expression levels are determined using the ∆∆CT method.
3 Applicability and Limitations Cytokine expression and release is cell type dependent. Not all cell types release cytokines and not all cytokines are released by one cell type. This SOP specifically addresses the analysis of Interleukin-8 (IL-8) expression in A549 cells. To be able to directly compare gene regulation on the mRNA level and protein release (assessed by ELISA, described in SOP “Detection of cytokine release in A549 cells) we harvest both biomolecules from the same sample. This necessitates optimized culture conditions as described in chapter 6 “Procedure”. We use the RNeasy Micro kit (Qiagen) for RNA extraction and purification, the iScript cDNA synthesis kit (BioRad) for cDNA synthesis and SYBR Green to detect DNA amplification in an iCycler (BioRad). Any other mRNA extraction method and cDNA synthesis procedure revealing comparable purity and yield of mRNA can be used instead.

Document Type Document ID Version Status Page SOP I_qRT-PCR_A549 1.0 4/18
4 Related Documents Table 1: Documents needed to proceed according to this SOP and additional NM-related interference control protocols.
Document ID Document Title cell culture_A549 Culturing A549 cells RNeasy® Micro Handbook - Qiagen qRT-PCR_ efficiency
Efficiency testing for qRT-PCR - ∆∆CT method for qRT-PCR data analysis
M_NM suspension_metal oxides
Suspending and diluting Nanomaterials – Metal oxides and NM purchased as monodisperse suspensions
M_NM suspension_ carbon based
Suspending and diluting Nanomaterials – Carbon based nanomaterials
5 Equipment and Reagents
5.1 Equipment • Centrifuge (for cell pelleting; able to run 15 ml as well as 50 ml tubes at 200 x g) • Conical tubes (15 ml and 50 ml; polypropylene or polystyrene; e.g. from Falcon) • Flat bottom 24-well cell culture plates • Hemocytometer • iCycler (or comparable real-time PCR device) • Laminar flow cabinet (biological hazard standard) • Light microscope (for cell counting and cell observation) • Microcentrifuge (with rotor for 2 ml tubes) • Micro-pipettes (0.5 µl – 1 ml) • Microreaction tubes (1.5 ml; e.g. from Eppendorf) • optically clear heat seal (e.g. BioRad) • qRT-PCR suitable 96-well plates (e.g.MultiplateTM low-profile 96-well unskirted PCR plates,
BioRad) • RNase-free pipet tips • spectrophotometer (to assess RNA concentration and purity; e.g. Nanodrop ND-1000) • Vortex®
5.2 Reagents For cell culturing:
• Bovine serum albumin (BSA) [CAS number: 9048-46-8] • Fetal Calf Serum (FCS) • L-glutamine • Neomycin1) • Penicillin1) • Phosphate buffered saline (PBS)

Document Type Document ID Version Status Page SOP I_qRT-PCR_A549 1.0 5/18
• Recombinant tumor necrosis factor alpha (TNF-α) [CAS number: 94948-59-1] • Roswell Park Memorial Institute medium (RPMI-1640) • Streptomycin1) • Trypsin-EDTA (0.05%)
1) bought as a 100x concentrated mixture of Penicillin, Streptomycin and Neomycin (PSN) e.g. from Gibco.
Additionally necessary to dilute carbon based NM:
• 10x concentrated RPMI-1640 • Sodium bicarbonate solution, 7.5% (NaHCO3) [CAS-number: 144-55-8]
For RNA isolation, cDNA synthesis and qRT-PCR:
• DNase I [Qiagen #79254] • Ethanol (70% and 100%) [CAS number: 64-17-5] • iQTM SYBR® Green Supermix [BioRad#170-8882] • iScriptTM cDNA Synthesis Kit [BioRad #170-8891] • Nuclease-free ddH2O • QIAshredder homogenizer [Qiagen #79656] • RNeasy® Micro Kit [Qiagen #74004] • β-mercaptoethanol [CAS number: 60-24-2] • specific primer pairs:
name gene sequence amplicon length
annealing temp.
hIL8_sense human interleukin 8 5'-tct gca gct ctg tgt gaa gg-3' 153 bp 60°C hIL8_antisense 5'-aat ttc tgt gtt ggc gca gt-3' GAPDH_sense human glyceraldehyde 3-
phosphate dehydrogenase 5'-agt cag ccg cat ctt ctt tt-3' 97 bp 60°C GAPDH_ antisense 5'-cca ata cga cca aat ccg ttg-3'
For nanomaterial (NM) suspension and dilution:
• Pluronic F-127 [CAS number: 9003-11-6]

Document Type Document ID Version Status Page SOP I_qRT-PCR_A549 1.0 6/18
5.3 Reagent Preparation
5.3.1 Complete cell culture medium Basic medium:
• RPMI-1640
supplemented with:
• 10% FCS • 1x PSN, which results in final concentrations of:
o 50 µg/ml Penicillin o 50 µg/ml Streptomycin o 100 µg/ml Neomycin
• 0.2 mg/ml L-glutamine
5.3.2 Pluronic F-127 Stock:
• 160 ppm in ddH2O: 160 µg/ml (=16 mg/100 ml)
5.3.3 Recombinant TNF-α Solvent:
• 0.1% BSA in PBS: 0.1 g BSA/100 ml PBS
Stock:
• 100 µg/ml in 0.1% BSA in PBS: reconstitute the whole vial (50 µg) in 500 µl of sterile PBS containing 0.1% BSA
• Freeze this stock in single use aliquots at -20°C. • Never re-freeze after thawing! • Can be stored for years.
6 Procedure
6.1 General remarks Well size and cell numbers are optimized to allow mRNA and protein measurements from the same sample. Cells (lysed to obtain mRNA) and supernatants (containing proteins) are harvested after 3, 8 and 24 hours of treatment. For technical reasons a separate 24-well plate for each time point is used.

Document Type Document ID Version Status Page SOP I_qRT-PCR_A549 1.0 7/18
6.2 Flow chart 1
Figure 1: Brief outline of the workflow: from cell seeding to qRT-PCR performance. *RLT-working buffer is specific for the RNeasy Micro kit (Qiagen). Use the sampling buffer suitable for you RNA extraction method. Samples can be stored in RLT-working buffer at -20°C for several weeks or even months. **At this step the supernatant of the cells can be harvested for cytokine release analysis by ELISA (see SOP “Detection of cytokine release in A549 cells”).
6.3 Cell seeding
6.3.1 Cell culture A549 cells are grown in T75 cell culture flasks in a total volume of 20 ml of complete cell culture medium. They are kept at 37°C, 5% CO2 in humidified air in an incubator (standard growth conditions according to SOP “Culturing A549 cells”).

Document Type Document ID Version Status Page SOP I_qRT-PCR_A549 1.0 8/18
6.3.2 Cell seeding into 24-well plate • One day prior to experimental start harvest and count cells as described in SOP “Culturing
A549 cells”. • For 3 and 8 h measurements seed 1x10⁵ cells in 500 µl complete cell culture medium per well
into a 24-well cell culture plate. Due to continuous proliferation of A549 cells, cell numbers are halved for 24 h samples. Therefore seed 5x10⁴ cells in 500 µl complete cell culture medium per well. The plate layout for cell seeding is shown in Figure 2.
• To fill two 24-well plates (3 and 8 h samples) according to Figure 2 2x10⁶ cells are suspended in 10 ml complete cell culture medium (2x10⁵ cells/ml). For the third time point (24 h) 5x10⁵ cells are suspended in 5 ml complete cell culture medium (1x10⁵ cells/ml).
• Using a 1 ml micro-pipette 500 µl of these cell suspensions are distributed into each of the green wells depicted in Figure 2 (B1 to B3 and C1 to C6).
Figure 2: Cell seeding into a 24-well plate. Cells are seeded in 500 µl complete cell culture medium per well into each of the green wells. Cell numbers per well are: 1x10⁵ cells per well for the 3 h and 8 h time points. 5x10⁴ cells per well for the 24 h time point. Black wells receive 500 µl complete cell culture medium each.
• Remaining wells (labeled in black in Figure 2) receive 500 µl complete cell culture medium
only. • Cells are kept in a humidified incubator at standard growth conditions overnight (ON).
6.4 Cell treatment
6.4.1 Dilution of nanomaterials For this SOP we distinguish two types of nanomaterials (NM) according to their solvent, suspension properties and highest concentrations used in the assay. See also respective related documents (3).
(1) Metal oxide NM, Polystyrene beads and all NM delivered as monodisperse suspensions by the supplier: solvent either determined by the supplier or ddH2O; sub-diluted in ddH2O; highest concentration in assay 100 µg/ml
(2) Carbon based NM: suspended and sub-diluted in 160 ppm Pluronic F-127; highest concentration in assay 80 µg/ml
Volumes given in the following dilution schemes are enough for three 24-well plates.

Document Type Document ID Version Status Page SOP I_qRT-PCR_A549 1.0 9/18
Note: “Mixing” in the context of diluting NMs means, the solvent containing tube is put on a continuously shaking Vortex® and the previous sub-dilution (or stock suspension, respectively) is put dropwise into the shaking solvent. The resulting suspension stays on the Vortex® for additional 3 seconds before proceeding with the next sub-dilution.
(1) Metal oxide NM:
Prepare serial sub-dilutions of the stock suspension (1 mg/ml) in ddH2O:
• Label six microreaction tubes (1.5 ml total volume) with 1 to 6 (relates to steps 1-6 below). • Add 1 ml NM stock suspension to tube no. 1. • Add 350 µl ddH2O to tubes no. 2, 4, 5 and 6. • Add 390 µl ddH2O to tube 3.
1. 1 ml NM stock suspension in ddH2O 1 mg/ml (1) 2. 350 µl of 1 mg/ml stock suspension (1) are mixed with 350 µl of ddH2O 500 µg/ml (2) 3. 260 µl of 500 µg/ml (2) are mixed with 390 µl ddH2O 200 µg/ml (3) 4. 350 µl of 250 µg/ml (3) are mixed with 350 µl ddH2O 100 µg/ml (4) 5. 350 µl of 100 µg/ml (4) are mixed with 350 µl ddH2O 50 µg/ml (5) 6. 390 µl ddH2O solvent control (6)
Preparation of final dilutions:
• Label six conical tubes (15 ml total volume) as follows: 1. 100 µg/ml 2. 50 µg/ml 3. 20 µg/ml 4. 10 µg/ml 5. 5 µg/ml 6. Solvent control
• Add 1.8 ml complete cell culture medium to each tube. • Mix on the Vortex® with 200 µl of the respective NM sub-dilutions or the solvent (ddH2O):
1. 200 µl of the stock suspension (1 mg/ml) are mixed with 1.8 ml medium 100 µg/ml (1)
2. 200 µl of the 500 µg/ml sub-dilution are mixed with 1.8 ml medium 50 µg/ml (2) 3. 200 µl of the 200 µg/ml sub-dilution are mixed with 1.8 ml medium 20 µg/ml (3) 4. 200 µl of the 100 µg/ml sub-dilution are mixed with 1.8 ml medium 10 µg/ml (4) 5. 200 µl of the 50 µg/ml sub-dilution are mixed with 1.8 ml medium 5 µg/ml (5) 6. 200 µl of ddH2O (solvent) are mixed with 1.8 ml medium solvent control (6)
(2) Carbon based NM:
Prepare serial sub-dilutions of the stock suspension (500 µg/ml) in 160 ppm Pluronic F-127:
• Label six microreaction tubes (1.5 ml total volume) with 1 to 6 (relates to steps 1-6 below). • Add 1 ml NM stock suspension to tube no. 1.

Document Type Document ID Version Status Page SOP I_qRT-PCR_A549 1.0 10/18
• Add 500 µl 160 ppm Pluronic F-127 to tubes 2 to 6.
1. 1 ml NM stock suspension in 160 ppm Pluronic 500 µg/ml (1) 2. 500 µl of 500 µg/ml stock suspension (1) are mixed with 500 µl of Pluronic F-127 250 µg/ml (2)
3. 500 µl of 250 µg/ml (2) are mixed with 500 µl Pluronic F-127 125 µg/ml (3) 4. 500 µl of 125 µg/ml (3) are mixed with 500 µl Pluronic F-127 62.5 µg/ml (4) 5. 500 µl of 62.5 µg/ml (4) are mixed with 500 µl Pluronic F-127 31.25 µg/ml (5) 6. 500 µl 160 ppm Pluronic F-127 solvent control (6)
Preparation of final dilutions:
• Prepare the appropriate dilution of a 10x concentrated medium stock as follows. This mixture (A) is used in all following steps for the preparation of the final NM concentrations. Mixing NM sub-dilutions with (A) will result in 1x concentrated medium containing the correct concentrations of all supplements and the respective NM concentrations.
Reagent Volume 10x RPMI 1.7 ml 100x PSN 170 µl 100x L-Glutamine 170 µl 7.5% NaHCO3 450 µl 100% FCS 1.7 ml ddH2O 10 ml
• Label six conical tubes (15 ml total volume) as follows: 1. 80 µg/ml 2. 40 µg/ml 3. 20 µg/ml 4. 10 µg/ml 5. 5 µg/ml 6. Solvent control
• Add 2.1 ml (A) to each tube. • Mix on the Vortex® with 400 µl of the respective NM sub-dilutions or the solvent (160 ppm
Pluronic F-127): 1. 400 µl of the stock suspension (500 µg/ml) are mixed with 2.1 ml medium 80 µg/ml (1)
2. 400 µl of the 250 µg/ml sub-dilution are mixed with 2.1 ml medium 40 µg/ml (2) 3. 400 µl of the 125 µg/ml sub-dilution are mixed with 2.1 ml medium 20 µg/ml (3) 4. 400 µl of the 62.5 µg/ml sub-dilution are mixed with 2.1 ml medium 10 µg/ml (4) 5. 400 µl of the 31.25 µg/ml sub-dilution are mixed with 2.1 ml medium 5 µg/ml (5) o 400 µl of 160 ppm Pluronic F-127 (solvent) are mixed with 2.1 ml medium solvent control (6)

Document Type Document ID Version Status Page SOP I_qRT-PCR_A549 1.0 11/18
6.4.2 Dilution of TNF-α (chemical positive control) Prepare a 10 µg/ml sub-dilution of the TNF-α stock (100 µg/ml) in 0.1%BSA in PBS:
• mix 9 µl of 0.1%BSA in PBS with 1 µl of the stock.
Prepare the final concentrations in complete cell culture medium as follows:
• 200 ng/ml: 2 ml medium + 4 µl stock (100 µg/ml) • 20 ng/ml: 2 ml medium + 4 µl sub-dilution (10 µg/ml)
Apply NM as well as TNF-α as described below.
6.4.3 Application of stimuli Note: All NM dilutions have to be vortexed directly before application to the cells.
One day after cell seeding:
• Remove complete cell culture medium. • Wash cells twice with 1 ml of pre-warmed PBS per well. • Add 500 µl per well of complete cell culture medium containing the corresponding TNF-α and
NM concentrations according to the pipetting scheme shown in Figure 3. • Culture cells for appropriate time points (3 h, 8 h, 24 h) under standard growth conditions.
Figure 3 Application of stimuli. NMs as well as TNF-α are applied in 500 µl complete cell culture medium per well after two washing steps in PBS. 1) NM concentrations given here refer to metal oxide NMs. Carbon based NM concentrations are detailed in the text.

Document Type Document ID Version Status Page SOP I_qRT-PCR_A549 1.0 12/18
6.5 RNA isolation Proceed according to the RNeasy® Micro Handbook provided by Qiagen. Only cell harvest is described briefly below.
• Prepare RLT-working buffer by adding 10 µl β-mercaptoethanol per 1 ml of RLT buffer. 350 µl RLT-working buffer is needed per well of a 24-well plate. For one plate as shown in figure 3 3.5 ml RLT buffer are mixed with 35 µl β-mercaptoethanol.
• After appropriate time points (3 h, 8 h, 24 h) remove supernatant (can be transferred to a separate 1.5 ml microreaction tube and used for protein measurement by ELISA. See SOP “Detection of cytokine release in A549 cells”) and add 350 µl RLT-working buffer per well.
• Remove cells from the bottom of the cell culture well using a sterile pipet tip. The RLT-working buffer – cell mixture is viscous and clear.
• Make sure to scratch around the well long and rigorous enough to remove all cells from the well.
• Transfer everything into a 1.5 ml microreaction tube. • Vortex to homogenize samples. • Samples in RLT-working buffer can be frozen at -20°C till further processing. • Proceed according to the RNeasy® Micro Handbook (attached to this SOP). For a brief
overview see Figure 4.

Document Type Document ID Version Status Page SOP I_qRT-PCR_A549 1.0 13/18
Figure 4: Workflow of total RNA isolation. Picture source: RNeasy Micro Handbook 12/2007. (Modified to illustrate, that we start from cell material only, but that other biological sources (tissue, LMD samples) could also be processed.) To extract RNA stick closely to the protocol of the manufacturer.

Document Type Document ID Version Status Page SOP I_qRT-PCR_A549 1.0 14/18
6.6 RNA measurement Here we describe only the computer assisted measurement using of the Nanodrop ND-1000 spectrophotometer. When using any other equipment please refer to the corresponding protocol/SOP.
Make sure to mix every sample properly before measurement. All samples are measured in duplicates.
• Start computer and nanodrop software. • Clean sensor with ddH2O and tissue. • Choose “Nucleic Acid” as the measurement parameter. • Initialization:
o Put 1 µl ddH2O on top of the sensor. o Close lid. o Press “o.k.” (software).
• Choose sample type “RNA40”. • Clean sensor with ddH2O and tissue. • Blank measurement:
o Put 1 µl of solvent (in our case RNA is dissolved in ddH2O) on top of the sensor. o Close lid. o Press “blank” (software).
• Clean sensor with ddH2O and tissue. • Sample measurement:
o Put 1 µl per sample on top of the sensor. o Close lid. o Press “measurement” (software). o Measure every sample twice. o Clean sensor with ddH2O and tissue after each sample.
• Proceed with subsequent sample. • Safe report and transfer values to excel for further calculations.
Report will contain the following parameters:
• Concentration of RNA (ng/µl) • A260: OD measured at 260 nm
(used to calculate RNA concentration according to equation (1))
RNA conc. (ng/µl) = OD(260 nm) x dilution factor x 40 (1)
• A280: OD measured at 280 nm (used to assess contamination by proteins or phenols which absorb at 280 nm)
• Ratio 260/280 (used to assess the purity of the RNA preparation; a ratio ~2 is considered as “pure RNA”)

Document Type Document ID Version Status Page SOP I_qRT-PCR_A549 1.0 15/18
6.7 cDNA synthesis using iScriptTM (BioRad) Volumes given are for one single reaction only. Make sure to prepare enough iScript master mix for all samples to be processed.
iScript master mix:
• 5x iScript reaction mix 4 µl • Add iScript reverse transcriptase 1 µl
Note: Prepare this mix shortly before usage. If necessary keep it on ice (at 4°C) until needed.
Note: As it is almost impossible to completely eliminate genomic DNA from RNA samples, it is important to run a so called “no amplification control” (NAC). This reaction contains all reagents except the reverse transcriptase. If later on in the qRT-PCR reaction a product is formed, it indicates the presence of contaminating DNA in the sample. Make sure to include these mock samples into the calculation for the iScript master mix.
Calculate the volumes needed per sample for a final amount of 200 ng RNA.
All further steps are performed in a qRT-PCR 96-well plate.
• Add 200 ng RNA of each sample into one 96-well. • Ad up with ddH2O to a final volume of 15 µl. • Add 5 µl iScript master mix per well.
Results in a total reaction volume of 20 µl (per well).
• Run reverse transcription program on iCycler: 5 minutes 25°C 30 minutes 42°C 5 min 85°C hold at 4°C
• After reaction is completed add 80 µl ddH2O to the reaction mix. Results in a total volume of 100 µl that contain an equivalent of 200 ng RNA. Assuming a complete transcription into cDNA this corresponds to a final concentration of 2 ng/µl cDNA.
6.8 Real-time PCR using iQTM SYBR® Green Supermix and iCycler Volumes given are for one single reaction only. Working stock concentration for all primers used is 10 µM. All reactions are performed in duplicates in a qRT-PCR 96-well plate and in a total volume of 12 µl. An equivalent of 10 ng RNA (corresponds to 5 µl of the cDNA reaction performed in 6.7) per well is used.
Controls to be run:
• NAC (see 6.7): these wells receive 5 µl mock cDNA samples (as described above) instead of template. A signal here indicates contamination of samples with genomic DNA.
Document Type Document ID Version Status Page SOP I_qRT-PCR_A549 1.0 16/18
• No template control (NTC): these wells receive 5 µl ddH2O instead of template. A signal here indicates that one or more of the qRT-PCR reagents is contaminated with the amplicon.
Actual procedure:
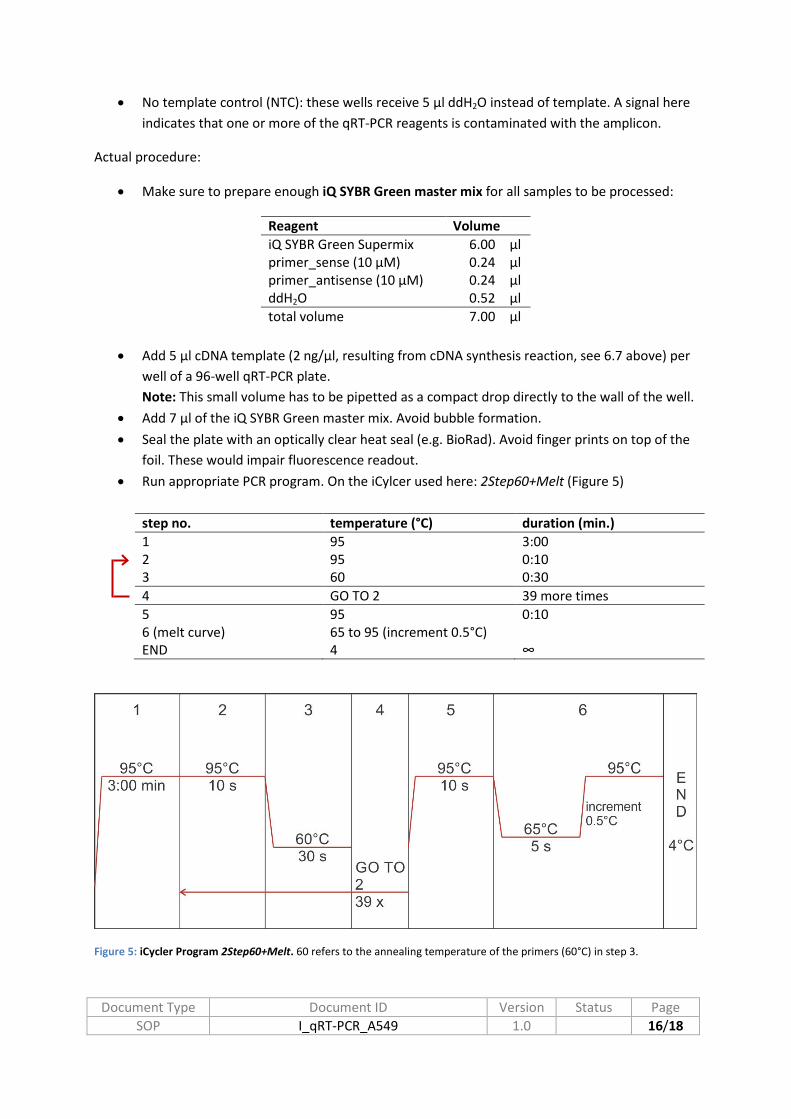
• Make sure to prepare enough iQ SYBR Green master mix for all samples to be processed:
Reagent Volume iQ SYBR Green Supermix 6.00 µl primer_sense (10 µM) 0.24 µl primer_antisense (10 µM) 0.24 µl ddH2O 0.52 µl total volume 7.00 µl
• Add 5 µl cDNA template (2 ng/µl, resulting from cDNA synthesis reaction, see 6.7 above) per
well of a 96-well qRT-PCR plate. Note: This small volume has to be pipetted as a compact drop directly to the wall of the well.
• Add 7 µl of the iQ SYBR Green master mix. Avoid bubble formation. • Seal the plate with an optically clear heat seal (e.g. BioRad). Avoid finger prints on top of the
foil. These would impair fluorescence readout. • Run appropriate PCR program. On the iCylcer used here: 2Step60+Melt (Figure 5)
step no. temperature (°C) duration (min.) 1 95 3:00 2 95 0:10 3 60 0:30 4 GO TO 2 39 more times 5 95 0:10 6 (melt curve) 65 to 95 (increment 0.5°C) END 4 ∞
Figure 5: iCycler Program 2Step60+Melt. 60 refers to the annealing temperature of the primers (60°C) in step 3.

Document Type Document ID Version Status Page SOP I_qRT-PCR_A549 1.0 17/18
6.9 Data evaluation Resulting CT values of the housekeeping gene (GAPDH) and the gene of interest (IL-8) are analyzed using the ddCt method. For a more detailed review on this algorithm please refer for example to Livak and Schmittgen, 2001 or Zhang et al., 2013.
∆Ct refers to the difference between the CT value of the gene of interest (CT,x) and the CT value of the housekeeping gene (CT,0) under the same experimental conditions (see equation 2).
∆𝐶𝑡𝑥 = 𝐶𝑇,𝑥 − 𝐶𝑇,0 (2)
∆∆Ct represents the difference between the ∆Ctx values of one treatment condition (e.g. TNF-α treatment to induce gene expression) and the ∆Cty values of a reference treatment condition (e.g. untreated samples) (see equation 3).
∆∆𝐶𝑡𝑥 = ∆𝐶𝑡𝑥 − ∆𝐶𝑡𝑦 (3)
The relative expression of the gene of interest in treated vs. reference samples is finally given by equation (4):
𝑟𝑒𝑙𝑎𝑡𝑖𝑣𝑒 𝑒𝑥𝑝𝑟𝑒𝑠𝑠𝑖𝑜𝑛 (𝑥) = 2−∆∆𝐶𝑡𝑥 (4)
Note: For the ddCt calculation to be valid, the amplification efficiencies of the gene of interest and the housekeeping gene must be approximately equal. A protocol how to assess the efficiency of a specific primer pair can be found for example at http://www3.appliedbiosystems.com/cms/groups/mcb_marketing/documents/generaldocuments/cms_053906.pdf or in brief in the related document “qRT-PCR_efficiency”.
7 Quality Control, Quality Assurance, Acceptance Criteria RNA purity: A ratio of absorbance at 260 nm and 280 nm of ~2 is generally accepted.
PCR efficiency: The PCR efficiency of each primer pair has to be determined in advance and is not part of this SOP. Generally, a PCR efficiency between 90 and 110% is considered acceptable (Lifetechnolgie).
Negative controls (NAC and NTC) have to be negative (no CT value detectable).
Melt curves of each amplicon yield a sharp peak at the melting temperature of the respective amplicon. This indicates that the products are specific. As a conclusion SYBR Green fluorescence is directly correlated to the accumulation of the product of interest.
Biological readout: Treatment of A549 with 200 ng/ml TNF-α for 3 hours should result in an approximately 8-fold induction of IL-8 expression compared to the untreated 3 hour control sample.

Document Type Document ID Version Status Page SOP I_qRT-PCR_A549 1.0 18/18
8 Health and Safety Warnings, Cautions and Waste Treatment Cell seeding has to be carried out under sterile conditions in a laminar flow cabinet (biological hazard standard). For this only sterile equipment must be used and operators should wear laboratory coat and gloves (according to laboratory internal standards).
Discard all materials used to handle cells (including remaining cells themselves) according to the appropriate procedure for special biological waste (i.e. by autoclaving).
9 Abbreviations BSA bovine serum albumin cDNA copy deoxyribonucleic acid ddH2O double-distilled water DNA deoxyribonucleic acid EDTA Ethylenediaminetetraacetic acid ELISA enzyme-linked immunosorbent assay FCS fetal calf serum g constant of graviation GAPDH glyceraldehyde 3-phosphate dehydrogenase IL-8 interleukin 8 mRNA massenger ribonucleic acid NAC no amplification control NTC no template control ON overnight PBS phosphate buffered saline ppm parts per million PSN Penicillin, Streptomycin, Neomycin qRT-PCR quantitative real-time reverse transcription polymerase chain reaction RPMI Roswell Park Memorial Institute medium TNF-α tumor necrosis factor alpha
10 References Knippers, R. Molekulare Genetik. Textbook. Thieme Verlag. Livak, KJ, Schmittgen, TD. Analysis of Realtive Gene Expression Data Using Real-Time Quantitative PCR and the 2-∆∆CT Method. Method, 25(4): 402-408, 2001 Zhang, JD, Ruschhaupt, M, Biczok R. ddCt method for qRT-PCR data analysis, 2013. http://www.bioconductor.org/packages/release/bioc/vignettes/ddCt/inst/doc/rtPCR.pdf

![IA conf QRT 2802-v3[2]](https://static.fdocuments.net/doc/165x107/62025ebf15fda437256e43fc/ia-conf-qrt-2802-v32.jpg)


![QRT Report [2001-2005]](https://static.fdocuments.net/doc/165x107/588c6afc1a28abbe218b82c4/qrt-report-2001-2005.jpg)