Project #: RES2016-18 UTC Report Submitted to TDOT By
81
FINAL REPORT IMPROVING RIGID PAVEMENT SMOOTHNESS USING POLYLEVEL ® Project #: RES2016-18 UTC Report Submitted to TDOT By: Dr. Mbakisya Onyango (PI) Dr. Aldo McLean (Co-PI) Dr. Joseph Owino (Co-PI) Dr. Ignatius Fomunung (Co-PI) Dr. Louie Elliot (Co-PI) May 2018
Transcript of Project #: RES2016-18 UTC Report Submitted to TDOT By

FINAL REPORT
IMPROVING RIGID PAVEMENT SMOOTHNESS USING POLYLEVEL®
Project #: RES2016-18
UTC Report Submitted to TDOT
By:
Dr. Mbakisya Onyango (PI)
Dr. Aldo McLean (Co-PI)
Dr. Joseph Owino (Co-PI)
Dr. Ignatius Fomunung (Co-PI)
Dr. Louie Elliot (Co-PI)
May 2018

1. Report No. FHWA-CFL/TD-0x-00x
2. Government Accession No. 3. Recipient's Catalog No.
4. Title and Subtitle
Improving Rigid Pavement Smoothness using PolyLevel®
5. Report Date May 2018
6. Performing Organization Code
7. Author(s): Mbakisya Onyango, Joseph Owino, Aldo McLean, Ignatius Fomunung and Louie Elliot.
8. Performing Organization Report No.
9. Performing Organization Name and Address University of Tennessee at Chattanooga615 McCallie Avenue, Dept.Chattanooga TN 37403
10. Work Unit No. (TRAIS)
11. Contract or Grant No. 40100-15416
12. Sponsoring Agency Name and AddressFederal Highway AdministrationCentral Federal Lands Highway Division12300 W. Dakota Avenue, Suite 210Lakewood, CO 80228
13. Type of Report and Period Covered Final Report October, 2015 to March, 2018
14. Sponsoring Agency Code HFTS-16.4
15. Supplementary NotesCOTR: First & Last name, FHWA CFLHD; Advisory Panel Members: List First & last names. This projectwas funded under the FHWA Federal Lands Highway Technology Deployment Initiatives and PartnershipProgram (TDIPP). Or the Coordinated Technology Implementation Program (CTIP).
16. Abstract Concrete pavement slab differential settlement (drop-off) is one of the major problems encountered in
jointed rigid pavements after years of service. The conventional method to rectify this problem is to lift the slabs using injected asphalt or concrete mud, slab grinding, partial/full depth repair or asphalt overlay. The Tennessee Department of Transportation (TDOT) investigated the use of PolyLevel® material to level settled slab in Chattanooga, Tennessee (TN). The study sections were monitored for two and half years to evaluate pavement surface roughness using a high-speed inertia profiler to obtain raw longitudinal profiles; and a smartphone-based application called Roadroid app to obtain the estimated IRI (eIRI). The raw longitudinal profiles were analyzed by the profile viewing and analyzing (ProVAL) software to compute the international roughness index (IRI) and the mean roughness index (MRI). The application of PolyLevel® was within the scheduled time. A ride quality survey was conducted before application of the material, and at about every eight months after application using the high-speed inertial profiler. The smartphone-based app was used to monitor the treated sections monthly. Generally, the pavement ride quality improved (numerical decrease in index values) immediately after application. It increased approximately one year after application on some section and continued to decrease on others. However, the decrease or increase in MRI did not change the state of section (in terms of ride quality condition) in which it was before application of the material. The questionnaire sent to state DOT's indicated that out of the respondents that have used polyurethane materials, about 90% recommend a continual use of polyurethane materials. Laboratory tests were performed to obtain mechanical properties of PolyLevel® needed for finite element (FE) analysis. FE analysis indicated that strains on PolyLevel® material will increase with increase on cyclic loading but the number of cycles it takes for materials to fail was not determined in this study. 17. Key Words
RIGID PAVEMENTS, PRESERVATION, SMOOTHNESS, POLYURETHANE, POLYLEVEL® MRI, eIRI
18. Distribution Statement
No restriction. This document is available to the public from the sponsoring agency at the website https://www.tn.gov/
19. Security Classif. (of this report) Unclassified
20. Security Classif. (of this page) Unclassified
21. No. of Pages xxx
22. Price
2

DISCLAIMER This research was funded through the State Research and Planning (SPR) Program by the
Tennessee Department of Transportation and the Federal Highway Administration under
RES2016-18, Research Project Title: Improving Rigid Pavement Smoothness using PolyLevel®
material
This document is disseminated under the sponsorship of the Tennessee Department of
Transportation and the United States Department of Transportation in the interest of information
exchange. The State of Tennessee and the United States Government assume no liability of its
contents or use thereof.
The contents of this report reflect the views of the author(s) who are solely responsible for the
facts and accuracy of the material presented. The contents do not necessarily reflect the official
views of the Tennessee Department of Transportation or the United States Department of
Transportation.
3

TABLE OF CONTENTS DISCLAIMER ................................................................................................................................ 3
TABLE OF CONTENTS ................................................................................................................ 4
LIST OF TABLES .......................................................................................................................... 6
LIST OF FIGURES ........................................................................................................................ 7
EXECUTIVE SUMMARY ............................................................................................................ 9
1. INTRODUCTION ................................................................................................................ 11 1.1. Rigid Pavements .............................................................. Error! Bookmark not defined. 1.2. Problem Statement ......................................................................................................... 12
1.2.1. Objectives ............................................................................................................... 14
1.2.2. Scope ....................................................................................................................... 14
1.2.3. Deliverables ............................................................................................................ 15
2. LITERATURE REVIEW ..................................................................................................... 16
2.1. Polyurethane materials for rigid pavement smoothness improvement .......................... 16
2.2. Pavement Performance Prediction Models .................................................................... 20
2.3. Polyurethane (PolyLevel®) Materials ............................................................................ 21
2.3.1. Performance Specifications .................................................................................... 22
3. METHODOLOGY ............................................................................................................... 23
3.1. Pavement Roughness (Smoothness) Measurements ...................................................... 23
3.1.1. International Roughness Index (IRI) Measurements .............................................. 23
3.1.2. Longitudinal Pavement Profile – Profile Index (PI) ............................................... 24
3.1.3. Road Roughness measurements using estimated IRI - Roadroid ........................... 25
3.2. Methodology .................................................................................................................. 27
3.2.1. Tasks ....................................................................................................................... 31
4. DOT QUESTIONNAIRE ON POLYURETHANE MATERIALS ..................................... 33
5. LABORATORY TESTING AND FINITE ELEMENT ANALYSIS .................................. 38
5.1. Compressive Strength Test ............................................................................................ 38
5.1.1. Compressive Strength tests at UTC ........................................................................ 38
5.1.2. Compressive Strength tests at TTI on small samples ............................................. 40
5.1.3. Compressive Strength tests at TTI on large samples .............................................. 43
5.1.4. Dynamic Modulus of PolyLevel® Material ............................................................ 45
5.2. Modelling of PolyLevel® material under Traffic Loading by using Finite Element Analysis..................................................................................................................................... 47
5.2.1. Finite Element Model ............................................................................................. 48
4

5.2.2. Material Properties .................................................................................................. 49
5.2.3. Analysis Results ...................................................................................................... 51
5.2.4. Finite Element Analysis Conclusions and Discussions .......................................... 53
6. DATA ANALYSIS, RESULTS AND FINDINGS .............................................................. 55
6.1. Pavement Roughness Data Collection using Roadroid App .......................................... 55
6.1.1. Testing Variability of Roadroid Data Due to Vehicle Change ............................... 56
6.1.2. Roadroid Data Analysis .......................................................................................... 58
6.2. Ride Quality Assessment Using the ICC Profiler .......................................................... 61
6.3. Analysis of Results ......................................................................................................... 65
6.3.1. Effectiveness of PolyLevel® to Improve Pavement Ride Quality .......................... 65
7. CONCLUSION AND RECOMMENDATIONS ................................................................. 70
7.1. DOT Questionnaire ........................................................................................................ 70
7.2. Finite Element (FE) Analysis ......................................................................................... 71
7.3. Pavement Surface Roughness Measurements ................................................................ 71
7.4. Recommendations .......................................................................................................... 73
REFERENCES ............................................................................................................................. 74
APPENDIX 1 State DOTs Questionnaire..................................................................................... 77
APPENDIX 2 States that Responded to questionnaire ................................................................. 79
APPENDIX 3 Treated sections IRI readings prior and post injection of PolyLevel .................... 80
5

LIST OF TABLES Table 1.1 Sections treated with PolyLevel® Materials ................................................................. 13
Table 2.1 TDOT minimum requirements and PolyLevel® product specification ........................ 22
Table 3.1 Test site information and PolyLevel® application dates ............................................... 27
Table 4.1 Cost effectiveness of methods ...................................................................................... 36
Table 5.1 Specimens’ Bulk densities and Young’s modulus ........................................................ 39
Table 5.2 Compressive strength and Young’s modulus ............................................................... 42
Table 5.3 Large sample test results for density and elastic modulus ............................................ 44
Table 5.4 Pavement layer material properties............................................................................... 51
Table 6.1 Estimated IRI ranking in Roadroid ............................................................................... 55
Table 6.2 Analysis of variance of means using Turkey (HSD) test.............................................. 58
Table 6.3 NHS ride quality scale .................................................................................................. 62
Table 6.4 Overall MRI measurements of before and after PolyLevel® application ..................... 65
Table 6.5 Paired t tests to assess improvements of the test sections............................................. 67
6

LIST OF FIGURES Figure 1.1 Jointed Plain Concrete Pavement (JPCP) plan and profile ........ Error! Bookmark not
defined.
Figure 1.2 Mid slab cracks and longitudinal joint faulting of over 1 in. on I-24 West ................ 13
Figure 3.1 The IRI Roughness Scale ............................................................................................ 24
Figure 3.2 Google map showing the tested sections on I-24 and I-75 .......................................... 28
Figure 3.3 Before and after leveling slabs using PolyLevel® material on I-24 West ................... 28
Figure 3.4 Drilling holes and installation of PolyLevel® materials on I-24 West ........................ 29
Figure 3.5 View of I-75 South ...................................................................................................... 29
Figure 3.6 Injection holes on concrete slabs ................................................................................. 30
Figure 3.7 PolyLevel® injection on I-75 South ............................................................................. 30
Figure 3.8 Injected PolyLevel® material sipping out mud/water under the slab. ......................... 30
Figure 4.1 Map of USA showing states that responded to the questionnaire ............................... 33
Figure 4.2 Methods commonly used for levelling concrete pavement slabs ................................ 34
Figure 4.3 Polyurethane brand names used in US DOTs ............................................................. 35
Figure 4.4 DOT slab repair project budgets .................................................................................. 36
Figure 5.1 Stress-strain relationship for PolyLevel® material ...................................................... 39
Figure 5.2 Compression test of PolyLevel® specimen.................................................................. 40
Figure 5.3 Stress-strain curve ....................................................................................................... 41
Figure 5.4 Poisson’s ratio-strain relationship ............................................................................... 41
Figure 5.5 Stress-strain curves comparison .................................................................................. 42
Figure 5.6 Larger samples............................................................................................................. 43
Figure 5.7 Poisson’s ratio versus vertical strain for PolyLevel® combined data .......................... 45
Figure 5.8 Dynamic modulus test setup ........................................................................................ 46
Figure 5.9 Dynamic modulus against frequency at different temperature .................................... 46
Figure 5.10 PolyLevel® master curve ........................................................................................... 47
Figure 5.11 Finite Element Pavement model ................................................................................ 50
Figure 5.12 Stress-strain behavior of PolyLevel® used in FEM modeling ................................... 50
Figure 5.13 Vertical deflection contours when tire moves from one end of ALF test pavement to
the other ........................................................................................................................................ 52
7

Figure 5.14 Deflections at the top of PolyLevel® leveling patch with cyclic traffic loading ....... 53
Figure 6.1 Satellite view of Roadroid data points on I-24 in Chattanooga, TN ........................... 56
Figure 6.2 Zoomed view near I-24 and Hwy 27 split in Chattanooga, TN .................................. 56
Figure 6.3 Repeatability of eIRI with vehicle type ....................................................................... 57
Figure 6.4 Average IRI variations on I-24 West from Sept. 2019 to March 2018 ....................... 59
Figure 6.5 Average IRI variations on I-24 East_182 from Sept. 2019 to March 2018 ................ 59
Figure 6.6 Average IRI variations on I-24 East at Moore Bridge from Sept. 2019 to March 2018
....................................................................................................................................................... 60
Figure 6.7 Average IRI variations on I-75 North from Sept. 2019 to March 2018 ...................... 60
Figure 6.8 Average IRI variation on I-75 South from Sept. 2019 to March 2018 ........................ 61
Figure 6.9 IRI and MRI measurements for I-75 South MM 9 to MM 7....................................... 62
Figure 6.10 IRI and MRI measurements for I-75 North MM 7 to MM 9..................................... 63
Figure 6.11 IRI and MRI measurements for I-24 between Moore Rd. and Mc Brien Rd ............ 63
Figure 6.12 IRI and MRI measurements for I-24 East, between MM182.3 and MM183 ............ 64
Figure 6.13 IRI and MRI measurements for I-24 West, between MM 179.5 and MM 178. ........ 64
Figure 6.14 Regression model of averaged MRI versus time ....................................................... 68
Figure 6.15 Regression model of averaged eIRI versus time ....................................................... 69
8

EXECUTIVE SUMMARY This study was conducted by the University of Tennessee at Chattanooga (UTC) in collaboration
with the Tennessee Department of Transportation (TDOT) to analyze the smoothness
improvement on rigid pavements lifted using PolyLevel® material. PolyLevel® is a high density
expanding polyurethane foam formed after an exothermic reaction when two main components
are mixed together with water and catalysts.
In recent years, concrete slab lifting technique using polyurethane material has been used to
improve concrete pavement smoothness. They have primarily been used in residential and
commercial applications to lift sidewalks, driveways, and office floors, but found effective in
leveling settled concrete pavement slabs. Several state DOT’s and the US Air Force have used
PolyLevel®/URETEK 486® or similar materials to lift pavement and airport slabs with success.
Polyurethane material has less weight therefore, it exerts less stress while densifying the soil
underneath the slab as it cures, due to its cementitious and flowability properties. Compared to
the traditional slab jacking material such as concrete mud and asphalt; polyurethane materials are
cost effective, can be installed with fewer lane closure, and they take short time to react and cure
hence the section can be opened to traffic within an hour after injection.
This study evaluates the effectiveness of the injected PolyLevel® material as a rigid pavement
maintenance material to improve pavements smoothness in Tennessee. The assessment was
performed by monitoring surface roughness of five sections treated with PolyLevel® materials on
two interstates I-24 and I-75, in Chattanooga, Tennessee. The application of PolyLevel® on the
five sections happened between February 2015 and June 2016. The research team evaluated both
immediate and long-term pavement performance by collecting longitudinal profiles data on the
treated sections using a high-speed inertial profiler before and after application of the material,
and estimated IRI (eIRI) using Roadroid App after PolyLevel® application for the contract period
time of two and a half years. The raw profile data was analyzed using the profile viewing and
analyzing (ProVAL) software to obtain the international roughness index (IRI) and mean
roughness index (MRI).
9

MRI was used to evaluate the improvement before and after PolyLevel® application. There was
an average MRI reduction of 0.07 m/km (4.56 in./mi.), which is 3.32 percent (3.32 %)
improvement. Four out of the five sections experienced reduction in MRI readings while one
section had increased MRI reading immediately after application. Long term data analysis, after
two years, indicated fluctuations on both MRI and eIRI readings. The trends of MRI data are
limited by the length of intervals of data collection (about 8 months). The eIRI data was
collected on monthly interval and its readings are fluctuating. The overall trend using linear
regression gave a negative slope indicating continual improvement with time. Only one section
had MRI readings slightly above the initial reading, twenty-nine months after PolyLevel®
application. The other four are still below the initial reading and within the acceptable MRI
range, about two years from its application.
It was also determined that eIRI underestimated roughness measurements as compared to MRI.
The section that is on “failed” category using MRI is in “good” category using eIRI ranking. All
the data points collected using eIRI fall within the “good” category at least two years after
PolyLevel® application.
Laboratory testing provided PolyLevel® properties useful for finite element modeling. Tests
performed yielded density, yield stress, elastic modulus, dynamic modulus and Poisson’s ratio.
Results also indicated that Poisson’s ratio of polyurethane material increased with increase in
vertical strain. The finite element modeling revealed that the cycling loading increases
permanent strains on PolyLevel® material. This indicates that PolyLevel® could render a quickly
lift of pavement slabs, but it may experience permanent deformation with time under repeated
traffic loading. The finite element model did not capture the time it takes to deteriorate
PolyLevel® material below acceptable limits due to limited number of cyclic loads applied.
10

1. INTRODUCTION
1.0 Rigid Pavements Pavements are designed to provide to road users a smooth ride, resulting to comfort, safety,
and lower vehicle operating cost. Distresses on pavements, such as slab faulting (drop-offs),
pose safety hazard to motorists, especially motor bikes. Therefore, it is imperative for
transportation agencies to maintain pavement smoothness by correcting the developed
pavement defects. There are two types of pavements flexible pavements and rigid pavements.
Rigid pavements consist of Portland Cement Concrete (PCC) slab(s) resting on a granular
base course or directly on a subgrade. Concrete slabs develop transverse cracks when
thermally induced tensile stresses exceed the concrete tensile strength; hence, concrete slabs
require either transverse joints or tensile reinforcements [1].
There are mainly three types of concrete pavements: (1) Continuously reinforced concrete
pavements (CRCP), constructed with reinforcement bars to take care of the tensile stresses,
this type does not have joints but allows transvers cracks to develop randomly along the slab
as the reinforcements support tensile stresses. (2) Jointed reinforced concrete pavements
(JRCP) have reinforcement bars and joints spaced between 9 to 30 m. (30 to 100 ft.). Joints
are provided to control transverse cracks, and load transfer mechanism (dowel bars) are
provided at the joints. (3) Jointed plain concrete pavement (JPCP) have no reinforcement bars
but jointed slabs between 4.57 to 9.14 m (15 to 30 ft.) long. For JPCP, vertical load transfer
mechanism between adjacent slabs is provided by either aggregate interlock or dowel bars
(Figure 1). When vertical load transfer efficiency is reduced due to subgrade erosion
(pumping) or other reasons, slab faulting or drop-off is experienced that may pose unsafe
driving conditions [1].
Plan
4.6 - 9.1 m/ 15 - 30 ft
Profile
or
11

Figure 1.1 Jointed Plain Concrete Pavement (JPCP) plan and profile
This study evaluates the performance of polyurethane materials (injected under rigid
pavement - JPCP) immediately after installation and their long-term performance. To assess
the long-term performance of the material, the treated sections are monitored by measuring
their surface roughness using a high-speed inertial profiler, a smartphone-based app
(Roadroid app) and visual inspection.
1.1. Problem Statement After several years of performance, rigid pavements deteriorate due to traffic loading,
environmental effect, and failure due to displacement of undelaying materials caused by
pumping. This creates voids underneath the pavement slabs at the joints, causing slab drop
off and/or faulting of joints, sometimes the failures may extend to mid-slab cracks. Pavement
failures increase pavement roughness, resulting to poor ride quality and increased road users
vehicle operating/maintenance costs. The conventional method to rectify concrete slab drop-
off is to lift the slabs using injected asphalt, concrete mud or slab grinding. When the
concrete slab distresses are extensive, full/partial depth slab repair (slab replacement) or
asphalt overlay is recommended.
In recent years, a different concrete slab lifting technique using polyurethane materials was
introduced to level concrete structures. PolyLevel® and a similar product called URETEK
486® are high-density expanding foam that are formed by combining diisyconate and polyol
to form a urethane linkage. These high-density polyurethane (HDP) foams stabilize/lift PCC
slab with poor foundation support (voids). HDP foams have primarily been used in residential
and commercial applications to lift sidewalks, driveways, and office floors, but it has been
found effective in leveling of concrete pavement slabs. Several DOTs and the US Air Force
have used PolyLevel®/URETEK 486® to lift pavement and airport slabs with success [2]. The
advantage of these materials is that the repair requires shorter time and fewer lane closures
compared to the conventional materials.
TDOT Region 2 has been experiencing severe slab settlement (drop-offs) on some of the
sections of its concrete pavements (I-24 and I-75), that carry high traffic volumes. Generally,
the settlements varied from 25 mm. (1 in.) to almost 75 mm (3 in.) on some locations. Figure
1.2 shows faulting experienced on sections of I-24 West. Evaluating possible maintenance
12

techniques, such as mud jacking, slab replacement, and diamond grinding, TDOT Region 2
elected to treat few sections of distressed areas with polyurethane materials. Reasons being
that this method requires fewer lane closures and shorter lane closure times, the work can be
performed at night (9:00 pm to 4:00 am or 5:00 am) when the interstates are less congested,
and the sections can reopen to traffic in about half an hour after application. A TDOT Region
2 engineer also deemed this method to be more cost effective.
Figure 1.2 Mid slab cracks and longitudinal joint faulting of over 1 in. on I-24 West
This project was conducted to evaluate the performance of five (5) pavement sections on U.S
interstates I-24 and I-75 in Chattanooga, Tennessee that were treated with polyurethane
material (PolyLevel®) to preserve and improve the performance of the pavements section.
Table 1.1 shows the sections treated with PolyLevel® materials and considered for
monitoring program.
Table 1.1 Sections treated with PolyLevel® Materials
Highway Section ID Start Mile End Mile Length
(mi.) Treated Lane #
PolyLevel® Application
Date
I-24 West 179.50 178.2 1.30 2 9/27 - 10/1/15 I-24 East_182 182.35 183.00 0.65 3 11/2 - 11/5/15 I-24 East Moore Brg McBrien Brg 0.30 2 2/9 - 2/11/15 I-75 North 7.00 9.00 2.00 3 6/5 - 6/9/16 I-75 South 9.00 7.00 2.00 3 5/8 -5/9/16
[1.00 mi. is equivalent to 1.61 km]
Treated lanes are counted from the left in the direction of travel
13

1.1.1. Objectives
The objective of this project was to evaluate the effectiveness of the injected PolyLevel®
material as rigid pavement maintenance technique to improve pavement smoothness in
Tennessee. The tasks of this research project included:
1. Monitoring the condition of the selected pavement sections with PolyLevel® to evaluate
the performance of PolyLevel® materials.
2. Collect pavement roughness regularly with help from TDOT Region 2 using high-speed
inertial profiler.
3. Use Roadroid App to collect estimated international roughness index (eIRI) monthly for
two years.
4. Perform visual inspection for cracks and similar distresses that may have resulted from
the PolyLevel® installation on the slabs.
5. Distribute a questionnaire to DOT’s to gather information about and experiences with
polyurethane materials.
6. Use linear and/or nonlinear predictive models to estimate pavement condition
deterioration in comparison to measured condition.
7. Obtain mechanical properties of PolyLevel® materials needed for computational
modeling of the material.
1.1.2. Scope
The scope of this project included:
1. Literature review on PolyLevel® materials
2. Development and distribution of a questionnaire to evaluate the usage of PolyLevel® or
similar material among DOTs in USA.
3. Conducting a pavement condition survey to obtain roughness measurements of the treated
section by using a high-speed inertial profiler.
4. Collection of pavement condition data after every specified period of time (one month in
this case) using Roadroid app.
5. Use linear predictive models to estimate pavement condition deterioration.
14

1.1.3. Deliverables
Upon acceptance of this report, the University of Tennessee at Chattanooga (UTC) research
team will provide TDOT with:
• Results of pavement roughness measurements using the high-speed inertial profiler and
Roadroid Application.
• Results of DOTs survey on the use of polyurethane materials in USA.
• Correlation of pavement roughness over time
• A final report documenting literature review, results, analysis and findings.
15

2. LITERATURE REVIEW This literature review presents published information related to the use of polyurethane
materials on lifting and/or leveling concrete pavement slabs to improve ride quality or
pavement smoothness. The literature review also reports the methods used to evaluate
pavement performance in comparison to method used at UTC and the expected/anticipated
performance period after polyurethane application. The review includes polyurethane
materials as construction material.
2.1. Polyurethane materials for rigid pavement smoothness improvement Vennapusa and White (2014) reported the results using high-density polyurethane (HDP)
foam by Penn DOT on 9.70 km (6.03 mi.) of US Highway 422, near Indiana and
Pennsylvania. According to this report, the objective of the project was to stabilize the
subbase aggregate layer, mitigate faulting, and improve joint load transfer efficiency (LTE).
In situ test methods selected for this project included a robotic total station to monitor
elevation changes; a high speed inertial profiler to measure the ride quality of the section (in
IRI); lightweight deflectometer (LWD) to determine elastic modulus of the subbase layer;
dynamic cone penetrometer (DCP) which was correlated with the California Bearing Ratio
(CBR) to determine the strength of the foundation layers; air permeameter test device to
determine saturated hydraulic conductivity of the subbase layer. After one year of testing,
results showed that spatial extensions of the HDP foam propagation in the subbase layer
ranged between 0.30 to 1.00 m (0.98 to 3.28 ft.) from injection points. Consequently, the
process resulted in concentrated areas of foam in the subbase, which when compared to
untreated areas, exhibited low permeability, low stiffness, and high shear strength.
Unfortunately, the average IRI measured in this section increased from an average of 1.70
m/km (107.71 in./mi.) before treatment to 1.90 m/km (120.38 in./mi.) after treatment. This
suggested poor ability of the foam lifting process to control variations in the pavement
surface elevation. LTE at cracks increased from 15% to 45% shortly after treatment and LTE
at joints did not show significant improvements [3].
Opland and Barnhart (1995) evaluated the performance of pavement sections lifted using
URETEK 486® injected by the Michigan DOT. Tests were conducted on three sections of I-
75 in Monroe County: a trunk road with 255 to 280 mm (10 to 11 in.) reinforced concrete
slabs, resting on an open-graded base course After monitoring, these three sites showed
16

hairline or minor cracks, severe transverse cracking, faulting, and severe cracked slabs with
settlement. They collected and analyzed data from before and after ride quality tests, as well
as falling weight deflectometer (FWD) measurements, and before/after pavement elevations.
Measurements showed that after the placement of URETEK 486®, there was some initial
improvement on ride quality, but it returned to the pre-treatment levels after one year. Base
support and joint transfer were initially improved as well, but improvements decreased during
the one-year trial period. Their final recommendation was not to use URETEK 486® as a
substitute for mud-jacking for pavement with open-grade base. Additional testing to gain
experience on the limitations and capabilities of URETEK 486® was recommended [4].
Soltesz (2002) assessed Oregon DOT’s test sections, which used injected URETEK 486® to
raise slabs at 12 sites around the Glenn Jackson Bridge on southbound side of I-205. The test
site was monitored for elevation changes for over two years. Laboratory tests measured hole
infiltration, compressive strength, and expected water permeability of the polyurethane
material. Observations taken a few days after injection showed exposed polyurethane,
indicating that either the grout seal had not been applied or had popped out. Soltesz observed
that slabs may have settled after being raised with polyurethane, producing elevations
changes during settling. The maximum decrease in elevation observed was 10.50 mm (0.41
in.), with most of the decrease occurring in the first three months after injection. Settling
continued during the two years of observations. The concern was that settling might open-up
new or existing cracks. On the other hand, the compressive strength of the material did not
appear to decrease in the 23 months following application [4]. Regarding the drilled
polyurethane infiltration holes, the team concluded that the injected material can penetrate
openings as small as 6.35 mm (0.25 in.) due to the high pressure and temperature at which the
material is injected. Polyurethane expands before settling, which tends to seal the holes.
Therefore, the injected polyurethane will help to reduce water infiltration and flow to the
subgrade [5].
Gaspard and Movak (2004) assessed the effectiveness of the URETEK® process in leveling
faulting on continuously reinforced concrete pavement, jointed concrete pavement, and
bridge approaches for the Louisiana Transportation Research Center. They determined that
URETEK® could be used for undersealing or leveling operations. They recommended the
polyurethane injection process to be included as an alternative rehabilitation method and that
other Departments of Transportation to set up methods for accurate cost estimation of
17

material and labor for this practice. The team also developed guidelines for selecting
appropriate pavement projects for polyurethane application. This includes specifications and
application methods that consider the benefit of soil improvement and identify applications as
they relate to various base course and pavement types. They concluded that suppliers and/or
contractors should be responsible for developing a detailed lab testing protocol for addressing
issues with the polyurethane foam and developing a detailed field testing program to evaluate
various pavement conditions. It was also recommended to carefully monitor the long-term
performance of the treated sections while establishing the life expectancy of the polyurethane
injection repairs [6].
Abu and LaBarca (2007) conducted a five-year project for the Wisconsin Department of
Transportation to monitor the effectiveness of using URETEK 486® to reestablish Portland
cement concrete (PCC) pavement elevations and increase the stability of the slab after
pavement lifting. The project focused exclusively on evaluations of concrete pavement
leading to bridge approach slabs. Pavement evaluations used visual inspections and ride
quality inspections to measure improvements. Two sites were tested. The first test site
included treatment to four concrete slabs in the bridge approach for both the passing and
driving lanes on I-39 and USH 78, in Columbia County. The second site included lifting four
slabs, left and center lanes, in the bridge approach of the three-lane highway on USH 12 near
the city of Middleton in Dane County. Results showed that the slab lifting process was
successful and that the pavement ride quality and safety improved at both test sites. However,
on site 1, the lifting method took longer than anticipated and required a total of 1,450 kg
(3,200 lbs.) of material on both lanes, 862 kg (1,900 lbs.) for the passing lane and 590 kg
(1,300 lbs.) on the driving lane. This by far exceed the initial contractor estimate of 272 kg
(600 lbs.) for both passing and driving lanes. Likewise, site 2 required 474 kg (1,043 lbs.) of
material, compared to an initial estimate of 250 kg (550 lbs.) Abu and LaBarca concluded
that the method is successful on lifting concrete slabs but might not be cost effective when
filling large voids is required. They also recommend using ground penetrating radar (GPR)
technology for an accurate estimate of the type and size of voids underneath the pavement as
well as material required to fill the void. An acceptable material estimation should be within
10 - 25% of what is required. A six-month inspection of site 1 showed four fine transverse
cracks developed in the approach slab, likely due to the drilling of injection holes. Site 2 did
not develop new cracks after the lifting process [7].
18

Priddy, Tingle, McCaffrey and Rollings (2007) reported the results of a test designed to
determine whether foam injection could increase the bearing capacity of compacted soil and
fill the voids under distressed pavements. They also compared foam backfill to a traditional
backfill materials, capped with similar materials having same thicknesses. Results validated
polyurethane foam as viable options for backfilling repairs, but the quality of the repairs were
not as strong as clay-gravel as they did not sustain as many simulated vehicles passes before
failure [8].
Priddy, Jersey and Reese (2010) evaluated the use of injected polyurethane material for the
repair of deteriorating concrete slabs on rigid pavements and airfields. The main objective
was to quantify the benefits of foam injection technology for conducting rapid repairs of PCC
pavement. For this purpose, they prepared four test slabs: (1) slab with 32 holes, (2) slab with
nine holes, (3) slab with five holes, and (4) slabs with no holes (control slab). The test also
included simulation of traffic load, and full-depth PCC repairs with traditional backfill
materials, such as compacted aggregates and poured foam. The concrete slabs were tested
after 28 days of curing (considered as “young concrete”), a first for the polyurethane injection
method, which has been used almost exclusively on fully cured (old) PCC pavements. Initial
observations confirmed significant cracking occurrences after injection on the first test slab
due to high number of injection holes and high volume of injected material. Results showed
that 5 to 9 holes were adequate as injection holes and had fewer cracks compared to 32 holes
[9].
Gaspard and Zhang (2012) presented their findings on the assessment of the effectiveness of
reducing faulting on jointed concrete pavement (JCP) using polyurethane foam (PF). The
analysis took place on sections of the Louisiana LA 1 Bypass. Pre-test and post-test were
performed on the three test sections of the Bypass, each with eleven slabs. Performance
evaluation continued for a period of five years using falling weight deflectometer (FWD),
walking profilers, and manual fault measurements tests. In addition, cores were taken from
various locations for polyurethane foam (PF) lab testing and statistical analysis, including
experimental design techniques to identify the differences between the test samples.
Significant improvements to reducing faults at joints were found, as well as service live
extensions of 3.10 to 5.70 years based on IRI and 6.00 to 8.00 years based on fault height
tests. However, it was noticed that the slab correction process reduced load transfer efficiency
(LTE) at the transverse joints. These finding lead the team to not recommend the use of
19

polyurethane foam lifting processes as a pavement preservation treatment for fault correction
or ride quality improvements [9].
From the literature review, different experiences on the usefulness and life expectancy of
polyurethane materials are reported. Some researchers experienced cracking after the
applications polyurethane materials, while others did not. The sections monitored by UTC did
not crack after application of polyurethane. There are reports on IRI measurements and load
transfer efficient that did not improve with polyurethane applications, although other reports
recommend the use of polyurethane materials since there was improvements in IRI
measurements. Similarly, UTC experienced a general improvement on IRI readings from
most sections although some of the sections improvements were not statistically significant as
reported in Chapter 6 of this report. Louisiana DOT recommended the use of polyurethane
materials as one of concreter preservation techniques and developed guidelines to select
candidate pavements for polyurethane treatment.
This study utilized PolyLevel® materials unlike most of the studies above that used URETEK
486®. Much as they are from different manufacturers, similar performance is expected. This
study used both a high speed inertial profiler and a smartphone-based app to monitor the
performance of pavement sections with PolyLevel® application. The findings from this study
are similar to the findings presented in the literature review as detailed in the conclusion of
this study. A DOT survey conducted during this study, on the use of polyurethane materials,
gives conflicting views according the DOT’s experience with the materials. Some
recommend the use of the materials others do not. Generally, 89 percent of respondents that
have used polyurethane materials recommend its use for maintaining rigid pavements.
2.2. Pavement Performance Prediction Models Pavement performance is usually defined by a means of performance curve that depicts the
trend between the pavement distress condition and service time or accumulated load
applications [10]. Performance indicators include pavement condition index (PCI), present
serviceability index (PSI), and IRI. The outcomes of the pavement performance assessment
are used in estimating the state probabilities and transition probabilities deployed by the
Markov model [11]. An effective pavement performance prediction model is considered an
essential component of any modern pavement management system. Several advanced
20

pavement management systems have incorporated a stochastic-based model to develop an
optimum long-term pavement maintenance and rehabilitation (M&R) plan at the network
level [12-14].
Markovian-based pavement performance prediction models
The goal for most models, including the Markovian-based modeling, is to assess pavement
cracking and deformation. This method includes visual inspection of roadway distress and
measurement of roadway riding quality where data is obtained after every year or two. The
probabilistic models are typically represented by Markov transition or knowledge-based-
expert-decision models for the prediction of pavement performance or deterioration modeling
[15]. Markovian models also describe a probable before and after condition of the pavement.
The before condition is described by probabilities that the pavement will be found in each of
the assumed finite number of states and the after condition is described is a similar manner
[16]. The types of Markovian prediction models include: the primary pavement response to
traffic loading and climatic conditions “Primary Response model”. Pavement distress of all
sorts “Structural Performance Model”. Pavement functional performance (PSI) “Functional
Performance Model”. Pavement damage models “Damage Models”. In addition, survivor
models described by survivor curves used for planning maintenance and rehabilitation
alternatives on pavement networks [16].
Initially UTC planned to use performance prediction models to evaluate the performance of
the sections treated with polyurethane, but the pavement condition data available on sections
with polyurethane materials was less than two year, while the models requires longer data
collection time, about ten years’ worth of data to establish the prediction models.
Furthermore, the team did not have enough time to work on the available pavement condition
data before PolyLevel® due to limited time from data availability to end of the project.
Therefore, this task was not performed instead linear regression of collected data was used to
estimate the longevity of the pavement sections treated with polyurethane material. The data
collection period was also an issue on the linear models. Longer data collection period is
recommended in order to develop reasonable prediction models.
2.3. Polyurethane (PolyLevel®) Materials According to the manufacturer’s website [2], PolyLevel® is a high-density polyurethane
compound that offers concrete leveling solutions for both commercial and residential
21

concrete faulting. PolyLevel® material comprises of two liquid parts that combine in the
nozzle at high pressure and temperature while being applied:
1. A petroleum-based isocyanate that is a modified geotechnical version of spray
polyurethane foam (SPF), a commonly building insulator.
2. A mixture of polyol resin, a surfactant, a blowing agent, and a catalyst.
When the mixture reacts with the isocyanate, the result is an expanding foam, which is
injected directly beneath the slab through strategically drilled, 15.88 cm (0.63 in.) diameter
holes, a much smaller injection point than in mud jacking techniques, which often require
holes that are 50.00 mm (2.00 in.) in diameter or larger. The foam weighs 2.37 kg/m3 (4.00
lb./yd3), a fraction of the weight of materials used in mud jacking (typically 71.2 kg/m3
(120.00 lb./yd3)). PolyLevel® achieves 90 percent of its full rigidity and strength in 15
minutes, compared to the hours or days required for materials applied through mud jacking
techniques to cure. Cured PolyLevel® is inert. It does not leech chemicals into the soil, wash
away, or absorb water [2]. Polyurethane (PU) is used in most concrete slab collapse repairs
because of its flexibility and strength. It can also seal out cracks, so that wet and leaking
spots do not pose any structural risks.
2.3.1. Performance Specifications
Testing of polyurethane product used in a TDOT project must follow the procedure stated in
ASTM D1621-D1623. Table 2.1 below, shows the minimum requirements for TDOT and the
actual product specifications for PolyLevel® material.
Table 2.1 TDOT minimum requirements and PolyLevel® product specification
Category TDOT Requirements PolyLevel® Product Specs Free-Rise Density (lb./ft3) 3.00 4.00 Density in Place (lb./ft3) - 6.50 Compressive Strength at Free-Rise Density (psi) - 75 Compressive Strength in Place (psi) 80 100 Tensile/Shear Strength (psi) 100 140
Strength Gain 90% Comp. Strength in
15 Minutes 90% Comp. Strength in 15
Minutes
Longevity - Less than 10% degradation
in 100 years Water Resistance - Water Proof
22

3. METHODOLOGY The main objective of this project was to evaluate the effectiveness of PolyLevel® as material
used to improve rigid pavement smoothness. Pavement surface roughness index was used to
assess the performance of the treated sections. TDOT hired a contractor to collect roughness
measurements by using a high-speed inertial profiler before and after application of the
material. This raw roughness data collected by the standard inertial profiler was analyzed
using the profile viewing and analyzing (ProVAL) software to obtain IRI and MRI. The UTC
team used the Roadroid app to collect estimated IRI (eIRI) monthly. ProVAL was used to
analyze longitudinal profile data into IRI and MRI because the app gives its reading in
estimated IRI only.
3.1. Pavement Roughness (Smoothness) Measurements Pavement roughness is a phenomenon that results from the interaction of the road profile and
the vehicle moving along the road. Road roughness is affected by parameters such as a
vehicle’s suspension (including how the tires are connected to the vehicle body with springs
and a shock absorber), tire pressure, and human sensibility to vibration as the vehicle travels
at a certain speed. Road comfort and safety to its users are mostly related to smoothness
(roughness) of the particular road. Road smoothness also affects vehicle-operating costs,
including the cost of tires, fuel, maintenance, and repairs. If all other factors are constant, the
smoother the road the less it costs to operate and maintain the vehicle [18]. Two pavement
surface roughness (or smoothness) indices used in this research (i.e. IRI/MRI and eIRI) are
explained here below.
3.1.1. International Roughness Index (IRI) Measurements
IRI was agreed to serve as an index for measuring road roughness after the International
Road Roughness Experiment, which was conducted in Brasilia, Brazil in 1982 [17]. The IRI
is based on a simulation of the roughness response of a quarter car travelling at 80 km/h and
represented by the scale shown in Figure 3.1 [17]. The scale can be used for calibration and
for comparative purposes and to calculate the average rectified slope (ARS), or the ratio of
the accumulated suspension motion of a vehicle during the test. The IRI summarizes the
roughness qualities affecting vehicle response. IRI is appropriate when a roughness measure
relates to the overall vehicle operating cost, overall ride quality, dynamic wheel loads (e.g.,
23

damage to the road from heavy trucks and braking and cornering safety limits available to
passenger cars), and overall surface condition is desired [17].
Figure 3.1 The IRI Roughness Scale
3.1.2. Longitudinal Pavement Profile – Profile Index (PI)
A longitudinal pavement profile is the measure of road roughness/smoothness and road
texture resulting from the difference in elevation as the vehicle transverses along the
pavement. It varies from gravel roads to asphalt/concrete paved roads. According to Sayers
and Karamihas, (1996) instruments and tests are used to produce a sequence of numbers
related to a “true profile” from an imaginary line in the road. Sometimes the measurements
do not obtain the true profile; instead, its components are used for analysis [18].
Static methods (Rod and Level, Dipstick) and automatic instruments (profilers such as
California Profilograph, ICC Laser Profiler etc.) are available for measuring the longitudinal
pavement profile. The static methods are slower, time consuming, and liable to human errors.
The mentioned drawbacks of static method make them less preferred over dynamic methods
(automatic instruments) which compute profiles with high accuracy. Important factors such
as humidity, temperature, and operating speed affect the accuracy of the data collected. The
manufacturer should specify the range (for instance operating speed) in which the profiler
will yield accurate profile readings [19].
24

After collecting pavement profiles, digital profilers send the data to a computer where a
software developed or specified by the manufacturer is used for analysis. Sample intervals
(the longitudinal distance between points) are digitized and fed into the computational
algorithm. The sample interval ranges from 25 mm to 360 mm (1 in. to 14 in.) [19].
Relationship between International Roughness Index and Profile Index
Road roughness is a function of the profile index (PI). Some profile measuring devices and
software packages (e.g., Rodruf and ProVal) have a built-in capability to process profile data
and yield the IRI. Various research studies conducted in the US have published correlation
equations between IRI and PI using different roughness measuring devices. This study did
not develop any correlation between PI and IRI.
3.1.3. Road Roughness measurements using estimated IRI - Roadroid
To monitor project performance, the team used a low-cost app to collect pavement roughness
data each month. The research team considered three apps for this purpose. The team
assessed the app “rRuf,” and “rInspector,” which are based in Canada. Logistics and app data
availability involved with these apps made the UTC team to opt the “Roadroid” app.
Roadroid App
Roadroid is a free pavement condition-monitoring app developed by a Swedish company.
This app is compatible with android phones, specifically the Samsung Galaxy 5 or higher.
The advantage of this app is that it works over a Wi-Fi connection, so it does not require a
phone line or data plan. During data collection, the app saves the data file until it is connected
to Wi-Fi, when it sends the data to Roadroid servers. Data is accessed from the server into the
computer.
The download link for the classic app is at: www.Roadroid.com/app/Roadroid.apk. The latest
Roadroid app version is Pro2 v2.3.5. Roadroid also has a beta-testing version 2, which has
GPS-video and a brake friction test option. Roadroid manager requires the phone IMEI
number for account registration. This app is free for university researchers. Data acquisition
is also free for higher learning institutions. Roadroid maintains a Facebook group of app
users at: https://www.facebook.com/Roadroid.
25

Roadroid, an android application, evaluates pavement smoothness based on an in-built
accelerometer, and its results are affected by vehicle vibrations as it (the vehicle) travels.
Roadroid is low cost, portable, and easy to use compared to other profilers [21, 22]. After
data collection, the operator imports the data from a smart phone. The measured data are
aggregated in sections of 5 m, 10 m, 20 m, 50 m, 100 m (default), 160 m and 200 m
depending on the length of the section, accuracy required and importance and purpose of the
project. Roadroid also has the capability to capture GPS photographs during the survey,
which can be processed at the locations they were taken or used for in-office visual
inspection of the road surface in case there are other pavement distresses [22].
Roadroid collects roughness data at a Class 3 level (IRI computed based on correlation
equations). Essentially, Roadroid is a response-type road roughness measuring system. It is
easy and cost effective to use, especially for roads where expensive and complex instruments
cannot be used (e.g., bicycle paths, low volume roads and roads in developing countries).
Compared to Class 4 (subjective rating), Roadroid is objective, highly portable and gives
powerful and effective data collection and visualization through an online map. Furthermore,
Roadroid can be used in winter to determine the performance of snow-removal and ice
grinding. Moreover, in frost and heave actions it tells when and where is happening while
comparing the situation to the previous event IRI [19].
The IRI will vary depending on the vehicle type, vehicle operating speed, and road surface
condition. A study conducted in 2013 by the University of Pretoria evaluating the variations
of estimated IRI obtained from Roadroid application with factors such as speed, pavement
surface, tire pressure, etc. concluded that Roadroid yields consistent results if the above-
mentioned key indicators are standardized [20]. Roadroid gives two options for obtaining the
road section IRI [20, 22]:
1. Estimated IRI (eIRI) which is based on the peak and root mean square vibration analysis
and correlates to Swedish laser measurements on paved roads. The eIRI values are
collected in a speed between 20 - 100 km/hr. (12 – 62 mi./hr.). eIRI is the base for
Roadroid Index (RI) classification of single points and road stretches.
2. Calculated IRI (cIRI) is based on the quarter car simulation. Data are collected at a speed
of 60 – 90 km/hr. (37 – 56 mi./hr.). The operator can set a known reference when
measuring cIRI.
26

For this study pavement profile data collected by TDOT Region 2 contractor using high-
speed inertial profiler (ICC Profiler) at an interval of about 8 months and eIRI collected
monthly using Roadroid app by UTC team are used to evaluate the smoothness of the
pavement test sections on I-24 and I-75.
3.2. Methodology This study was conducted to evaluate the effectiveness of PolyLevel® material as rigid
pavement maintenance technique for pavement smoothness improvement in Tennessee. The
study included five pavement sections treated with PolyLevel® materials on US Interstates I-
24 and I-75 as listed on Table 3.1. As per 2017 TDOT traffic data log the Average Annual
Daily Traffic (AADT) of sections treated with PolyLevel® material on I-24 East and I-24
West was 134,740 vehicles per day and 119,930 vehicles per day respectively, with trucks
being 18.50 percent. The AADT on I-75 sections was 77,150 vehicles per day; of which
14.50 percent were trucks. TDOT Region 2 engineers determined the treatment sections
depending on the severity of observed distresses (roughness). Figure 3.2 maps the location of
tested sections.
Table 3.1 Test site information and PolyLevel® application dates
Highway Section ID Start Mile End Mile Length
(mi.) Treated Lane #
PolyLevel® Application
Date
I-24 West 179.5 178.2 1.30 2 9/27 - 10/01/15 I-24 East_182 182.35 183 0.65 3 11/20 - 11/5/15 I-24 East Moore Brg McBrien Brg 0.30 2 2/09 - 2/11/15 I-75 North 7 9 2.00 3 6/05 - 6/09/16 I-75 South 9 7 2.00 3 5/08 -5/09/16
Note: [1.00 mi. is equivalent to 1.61 km] Treated lanes are counted from the left in the direction of travel
27

Figure 3.2 Google map showing the tested sections on I-24 and I-75
The test sections have lane width of 3.65 m (12.00 ft.) slab thickness of 255 mm (10 in.) and
joint spacing of 4.57 m (15.00 ft.) Figure 3.2 shows slab faulting on I-24 West section with a
faulting of 25 mm (1 in.) before and about 3.80 mm (0.15 in.) after treatment.
Figure 3.3 Before and after leveling slabs using PolyLevel® material on I-24 West
The application of PolyLevel® materials involve drilling holes that are about 1.58 cm (5/8 in.)
diameter. The main two components of polyurethane materials are mixed in the nozzle and
injected at high pressure and temperature under the slab through the holes. As the materials
mix they expand and lift the 254-mm (10-in.) rigid pavement slab. Care must be taken to
avoid slab overcorrection. Figure 3.4 shows AFS crew drilling the holes with a three-rig
drilling machine and applying the PolyLevel® material through the holes.
I-75 South I-24 West
I-75 North
I-24 East Moore
I-24 East_182
28

Figure 3.4 Drilling holes and installation of PolyLevel® materials on I-24 West
Figure 3.5 below shows a view of I-75 North before installation. Figure 3.6 shows the
preparation of drilled holes before the application of polyurethane materials. The application
of the two-part polyurethane materials via injection nozzle is shown in Figures 3.4 and 3.6.
Holes are patched after injection of the material as shown in Figure 3.7. As polyurethane is
pumped, it fills the air or water pockets underneath the concrete slab and water or mud is
expelled out. A more stable underlying layer results from the process.
Figure 3.5 View of I-75 South
29

Figure 3.6 Injection holes on concrete slabs
Figure 3.7 PolyLevel® injection on I-75 South
Figure 3.8 Injected PolyLevel® material sipping out mud/water under the slab.
30

The pavement roughness was measured before and after application of polyurethane
materials to evaluate the immediate effectiveness of the material for pavement maintenance
and performance. UTC used the Roadroid app to conduct monthly pavement roughness
measurements for the project duration (two and a half years). The average pavement
roughness index (MRI) before and after was compared using statistical analysis methods to
evaluate the improvement at 95% significance level.
3.2.1. Tasks
The tasks performed during the course of this project include:
Task 1: Literature Review
A comprehensive literature search was conducted to obtain published and unpublished
information on the use and performance of polyurethane materials as applied for improvement of
pavement smoothness. Resources such as library holdings, databases, and gateway services and
external database services, such as TRB, ASCE, ITE, NCHRP, TRIS, Elsevier Science, Google
Scholar and others were accessed as reported in Chapter 2.
Task 2: Pavement Condition Monitoring
Longitudinal profile data (MRI) and eIRI data were collected periodically to monitor the
condition of the selected pavement sections treated with PolyLevel® to evaluate the
performance of the materials. Visual inspection was also performed regularly.
Task 3: Evaluation of Pavement Performance
Pavement performance was evaluated by gaging measured pavement condition to the FHWA
acceptable thresholds. Tables 6.1 show an example of the IRI rating thresholds in m/km.
Task 4 DOT Survey
A questionnaire was sent to state DOT’s to collect information regarding the usage of
polyurethane materials as pavement levelling or pavement preservation technique. This is
reported in Chapter 4.
Task 5: Laboratory testing of Polyurethane materials and Finite element Analysis
This task included testing PolyLevel® material to obtain its physical characteristics like
density, Poisson’s ratio, yield stress, yield strain elastic and dynamic moduli and its response
to pavement loading. Chapter 5 presents findings from lab testing and finite element analysis.
Task 6: Result Analysis
The analysis of data collected was performed to provide information pertaining the
performance of PolyLevel® material for improving pavement smoothness and the possible
adoption of it as rigid pavement preservation technique.
31

Task 7: Quarterly reports and Final report writing
Quarterly reports were submitted documenting activities performed in that quarter as well as
the final report with all results, analysis, conclusions and recommendations.
32

4. DOT QUESTIONNAIRE ON POLYURETHANE MATERIALS In April 2016, a 19-question questionnaire was sent through Survey Monkey to pavement and
maintenance engineers at all 50 state DOTs as well as Canadian Ministries of Transportation to
collect information on the use of polyurethane materials. The engineers’ contact information was
obtained from the American Association of State Highway and Transportation Officials
(AASHTO) website. The questionnaire submission window was left open for six months to give
the DOT engineers time to respond. The questionnaire is appended to this report in Appendix 1.
Twenty-five state DOTs and British Columbia Province Ministry of Transportation and
Infrastructure in Canada responded to the questionnaire. Figure 4.1 shows the states that
responded. Of the 26 respondents, 20 states (76 %) currently use or have used polyurethane
material for slab lifting and six state DOTs (24 %) have not. Three states had conflicting
responses (“yes” and “no”) on the use of polyurethane materials. The questionnaires with a “no”
response was discarded, as the answers to the remaining questions were not applicable.
Figure 4.1 Map of USA showing states that responded to the questionnaire
Nearly 90% of the respondents that have used polyurethane materials recommend its use.
However, they noted that severely cracked slabs and subsurface condition may limit the ability to
apply the material. Therefore, polyurethane materials should only be used to level slabs that are
structurally sound. Further analysis of survey results yielded the following:
33

i. Of the five types of materials/methods commonly used to level concrete slabs, slab
replacement was reported to be used by 73 % of respondents, followed by polyurethane
material at 69 %, HMA overlay at 54 %, and mud jacking at 42 %. Asphalt injection was the
least used at 4 %. Nearly one quarter of respondents (23 %) reported the use of other
methods, such as diamond grinding or compaction grout. Figure 4.2 summarizes the
percentage of techniques used, as reported on the survey.
Figure 4.2 Methods commonly used for levelling concrete pavement slabs
ii. Regarding the use of Polyurethane material, 20 of the 26 respondents reported to have used
it. As shown in Figure 4.3 below, URETEK 486® is the most commonly used brand,
followed by PolyLevel®.
42.31% 53.85%
3.85%
69.23% 73.08%
23.08%
0.00%10.00%20.00%30.00%40.00%50.00%60.00%70.00%80.00%
Perc
ent
Slab levelling Materials
Techniques used for concrete slab leveling
34

Figure 4.3 Polyurethane brand names used in US DOTs
iii. Respondents were asked to rate the cost-effectiveness of the methods used by their DOT to
repair concrete pavements. A scale of 1 to 5 was used to define the cost effectiveness of the
methods, with 1 being the least cost effective (too expensive and time consuming) and 5
being very cost effective (performance is comparable to capital invested). Respondents found
the use of polyurethane to be the most cost effective, followed by HMA overlay, slab
replacement, and mud jacking, which all received the same average score. However, slab
replacement was reported the most cost-effective method when slabs are severely damaged.
Asphalt injection, which is not commonly used, was reported the least cost effective. Table
4.1 summarizes the cost effectiveness score of the methods, as reported by respondents.
The cost of the material/methods varies by state and are dependent of factors like slab
thickness, subsurface conditions, and amount of work. Slab replacement costs range from
US$100 - US$1,000 per square yard. Polyurethane injection costs vary from US$40 -
US$300 per square yard, and HMA overlay costs range from US$3.75 - US$15 per square
yard. Diamond grinding and mud jacking had an average cost of US$5.50 and US$10 per
square yard, respectively, based on the survey responses.
Uretek 69%
Polylevel 11%
Other 8%
NCFI 24-003 4%
Geotek 4%
Prima resins precision lift
4%
Uretek Polylevel Other NCFI 24-003 Geotek Prima resins precision lift
35

Table 4.1 Cost effectiveness of methods
Material/Technique Average Score Mud-Jacking 3 HMA overlay 3 Asphalt injection 2 Polyurethane injection 4 Slab replacement 3
iv. As shown in Figure 4.4, most of the respondents (94 %) reported that their slab repair budget
was consistently on or below the allotted amount. Out of seventeen respondent, only one
respondent (6 %) experienced projects that were over budget.
Figure 4.4 DOT slab repair project budgets
v. All 20 respondents who have used polyurethane for slab levelling drilled holes for material
injection, and 89% did not experience any effects due to drilled holes. Of those who reported
experiencing effects stated that they were minimal since the holes are small (approximately
15.88 mm or 0.63 in.). Only four (4) respondents out of 20 used GPR to determine voids
underneath the slab prior to injection.
vi. While some sections treated with polyurethane took as long as 10 years to show signs of
failure (e.g., cracking or settlement), other respondents reported that signs of failure appeared
6%
71%
23%
Over budget On budget under budget
36

after only 1 to 1.5 years. Respondents noted that cracking is caused by overcorrection of
slabs, which induces tensile stresses that crack the slabs, and not due to the holes drilled
during the injection of the material underneath the slab. Small lifts of the slabs are
recommended to minimize overcorrection and cracking. Settling of the slabs appeared 2 to 3
years after application was also reported.
vii. Respondents used the following methods to monitor the treated pavement sections:
• Ride Quality (PRI or IRI)
• GPS surface elevation
• Continuous laser level and dial indicator method
• Site evaluations
• Falling Weight Deflectometer (FWD) before and after application
Some respondents did not monitor the sections post treatment, specifically, but they did
include the sections in the usual pavement condition data collection process.
The conclusions drawn from the survey is that polyurethane injection is good for preventive
maintenance of rigid pavements on open graded granular base as it is cheaper than slab
replacement, but it is very important to evaluate the extent of slab failure before application. If
the slab is severely damaged, slab replacement is more cost-effective method. More than three-
quarters (78%) of respondents who use polyurethane stated that the method is cost effective.
Seventeen out of twenty respondents (89%) recommended the use of polyurethane. Those who
did not recommend gave the following reasons:
• Increased in deflections on joints that were stable before application of the material
• Thin injection of polyurethane material created more voids underneath the slab so deep
injections were recommended.
• Polyurethane application worked better to correct slab settlement but not level
pavement.
37

5. LABORATORY TESTING AND FINITE ELEMENT ANALYSIS Mechanical properties of materials are essential in finite element modeling of materials. Several
tests were performed at UTC laboratory and Texas A & M Transportation Institute to obtain
physical and mechanical properties of PolyLevel®. Tests performed include compressive strength
and dynamic modulus. Finite element analysis was performed as reported in section 5.2
5.1. Compressive Strength Test Laboratory tests on PolyLevel® materials were performed to obtain the mechanical properties of
the PolyLevel® material for the finite element analysis. PolyLevel® samples were obtained from
AFS Foundation and Waterproofing Specialists. The sample were casted in plastic cups, which
allowed the research team to shape the samples in the cubic shape required by test procedures.
These yielded either cylindrical samples with 55 mm. (2 in.) diameter or cubical samples with
sides approximately 55 mm (2 in.). Larger samples were then casted by AFS Foundation in
cylinders that were 101 mm (4 in.) diameter by 202 mm (8 in.) height. Tests were performed on
both the smaller and the larger samples. Material properties required for FEA model in Abaqus
were density, Young’s modulus, Poisson’s ratio, yield stress and yield strain. Three tests were
conducted: (1) compressive stress-strain test to obtain elastic modulus, yield stress, and strain
measurements; (2) compressive stress test to obtain Poisson’s ratio and Elastic modulus; and (3)
dynamic modulus test to obtain the dynamic modulus of the material. The UTC lab conducted
compressive strength tests that followed the procedures described in ASTM D1621-00 and
density determination tests based on ASTM D1622-03. Test numbers 1, 2 and 3 also were
performed at Texas A & M Transportation Institute (TTI).
5.1.1. Compressive Strength tests at UTC
The unconfined compressive strength test was conducted in accordance to ASTM D695 to obtain
the elastic modulus and yield stress and strain measurements. The test was performed on an
Instron 5655 Machine available at the UTC Mechanics of Materials Laboratory on the 55 mm (2
in.) cubes specimens. The results indicate that the materials contained voids due to the slippage
observed on the curve before the materials attain a linear relationship. This is expected for foam
materials. Results also indicate the material becomes a perfect plastic after it yields (Figure 5.1).
38

Figure 5.1 Stress-strain relationship for PolyLevel® material
Eight cubic shaped samples were tested and yielded significant variations in density and Young’s
modulus values (Table 5.1). Since the production of PolyLevel® materials follow standardized
procedures, the team expected the values to be repeatable or have minor variations. The variation
in this density results may be due to the manual process involved in measuring the specimen’s
dimensions and the fact that specimens were not in a perfect square.
Table 5.1 Specimens’ Bulk densities and Young’s modulus
Specimen 1 2 3 4 5 6 7 8 Mean STD
Bulk density (kg/m3)
52.41 52.52 51.73 54.33 50.66 50.03 51.69 48.06 51.43 1.88
Young's modulus (MPa) 6.59 5.57 4.93 8.00 9.66 4.47 7.30 6.16 6.58 1.71 STD stands for standard deviation
Furthermore, PolyLevel® is injected under confined conditions, whereas the tests were conducted
on specimens that were fabricated without or with partial confinement. The values obtained in
Table 5.1 are very low compared to in service values. For instance, the test density is half of the
in-service density of PolyLevel®, which is 104.12 kg/m3 (6.50 lb./ft3) [2]. The team, therefore,
used high-density polyurethane material properties obtained from literature for modelling
PolyLevel® material in Abaqus. Further testing was performed at Texas A & M transportation
Institute (TTI).
0.00
0.05
0.10
0.15
0.20
0.25
0.30
0.35
0.00 0.02 0.04 0.06 0.08 0.10 0.12
Stre
ss (M
Pa)
Strain
slippage
39
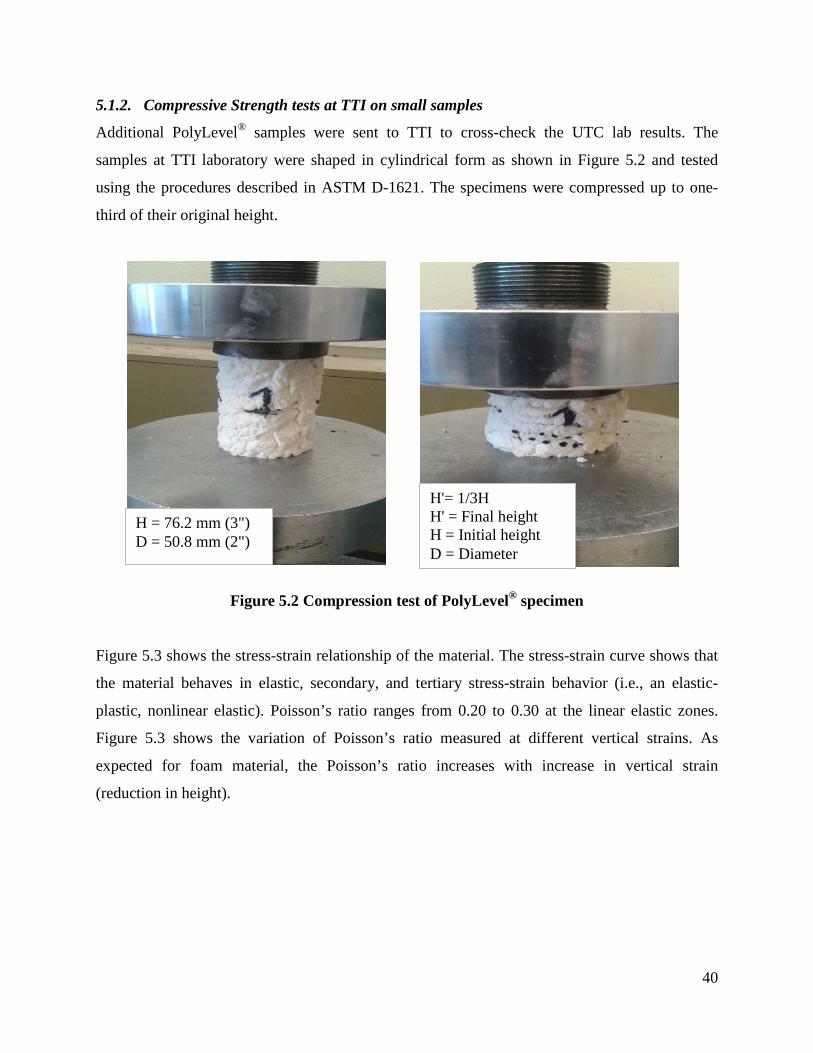
5.1.2. Compressive Strength tests at TTI on small samples
Additional PolyLevel® samples were sent to TTI to cross-check the UTC lab results. The
samples at TTI laboratory were shaped in cylindrical form as shown in Figure 5.2 and tested
using the procedures described in ASTM D-1621. The specimens were compressed up to one-
third of their original height.
Figure 5.2 Compression test of PolyLevel® specimen
Figure 5.3 shows the stress-strain relationship of the material. The stress-strain curve shows that
the material behaves in elastic, secondary, and tertiary stress-strain behavior (i.e., an elastic-
plastic, nonlinear elastic). Poisson’s ratio ranges from 0.20 to 0.30 at the linear elastic zones.
Figure 5.3 shows the variation of Poisson’s ratio measured at different vertical strains. As
expected for foam material, the Poisson’s ratio increases with increase in vertical strain
(reduction in height).
H = 76.2 mm (3") D = 50.8 mm (2")
H'= 1/3H H' = Final height H = Initial height D = Diameter
40

Figure 5.3 Stress-strain curve
Figure 5.4 Poisson’s ratio-strain relationship
0
10
20
30
40
50
60
70
80
0 0.1 0.2 0.3 0.4 0.5 0.6 0.7
Stre
ss (p
si)
Vertical Strain
Compressive strength =32 psi = 0.22MPa Young's Modulus = 680 psi = 4.69MPa
0.000
0.050
0.100
0.150
0.200
0.250
0.300
0.350
0.400
-0.7 -0.6 -0.5 -0.4 -0.3 -0.2 -0.1 0
Pois
son'
s ra
tio
Vertical Strain
41

Table 5.2 shows compressive strength and modulus of elasticity of the material. Variations of the
results (i.e. specimen 3 and others) is due to differences in the height of the specimens. Stress-
strain curves of all specimens were compared. The curves of specimen 1 and 2 are close because
their dimensions are the same (Figure 5.5). It has to be pointed out that the lab tests were not
laterally confined, which is different from the field application. The expansion pressure or
compressive strength and modulus of elasticity of the material are expected to be high even
without experiencing a large vertical strain as seen in Figure 5.5. To limit the vertical
deformation, higher density PolyLevel is desired.
Table 5.2 Compressive strength and Young’s modulus [Units: MPa (psi)]
Specimen 1 2 3 Mean STD Compressive strength 0.22 (32) 0.22 (32) 0.32 (47) 0.26 (37) 0.06 (9) Young's modulus 5.17 (750) 4.69 (680) 8.10 (1175) 5.98 (868) 1.85 (268)
Figure 5.5 Stress-strain curves comparison
0
20
40
60
80
100
120
140
0 0.1 0.2 0.3 0.4 0.5 0.6 0.7 0.8
Stre
ss (p
si)
Vertical Strain
Specimen 3: H = 2 in.
Specimen 1 and 2: H = 3 in.
42

5.1.3. Compressive Strength tests at TTI on large samples
AFS Foundation availed to UTC larger test samples, 101 mm (4 in.) diameter by 202 mm (8 in.)
height (Figure 5.6), that were trimmed to 101 mm (4 in.) diameter by150 mm (6 in.) height for
testing. These were subjected to compressive strength to obtain the elastic modulus and
Poisson’s ratio (Table 5.3). The Elastic modulus of 40 MPa (4985 psi) and Poisson’s ratio
ranging between 1.125 to 2.40 were measured. Much higher values of bulk density were
obtained from these samples (Table 5.3). with average density of 91.22 kg/m3 (5.69 lb./ft3) which
is much closer to the publish values of 104 kg/m3 (6.50 lb./ft3), and much better than density
measured from the smaller samples (unconfined). Larger sample (semi-confined) yielded density
values closer to the published values because the confinement in making larger samples
increased the density compared to the smaller unconfined samples. So smaller sample have more
air voids and hence lower density.
Figure 5.6 Larger samples
43

Table 5.3 Large sample test results for density and elastic modulus
Specimen ID
Diameter (mm)
Height (mm)
Volume (mm3)
Weight (gram)
Density (g/cm3)
Density (kg/m3)
Compressive Strength (psi) MPa
PU-C/D1 101.80 63.41 516.14 45.6 0.0883 88.35 PU-C/D2 101.50 77.84 629.81 58.77 0.0933 93.32 5800 40 PU-C/D3 101.30 74.97 604.19 55.95 0.0926 92.60 PU-C/D4 101.70 75.72 615.12 54.45 0.0885 88.52 4214 29 PU-C/D5 100.80 77.42 617.82 57.36 0.0928 92.83 4940 34 PU-C/D6 101.10 75.27 604.27 55.42 0.0917 91.71
Mean 91.22 4984.67 34.33
STD 2.22 793.94 5.51
CV 2.437 16 16 CV stands for coefficient of variation
Poisson’s ratio (PR) results indicates that the Poisson’s ratio values increased with increase in
vertical strain (VS), which is expected for foam materials like PolyLevel®. Figure 5.7 shows the
variation of Poisson’s ratio against vertical strain for combine data, yielding a linear relationship
PR = 0.2047 VS + 0.2442 with a correlation value R2 of 0.7789. The average peak stresses and
strains on larger samples were 0.84 MPa (121.54 psi) and 7.62 mm/mm (0.30 in./in.)
respectively.
44

Figure 5.7 Poisson’s ratio versus vertical strain for PolyLevel® combined data
5.1.4. Dynamic Modulus of PolyLevel® Material
The dynamic modulus of the PolyLevel® large specimens was performed using the Asphalt
Mixture Performance Tester (AMPT). The test was conducted on cylindrical specimen with a
diameter of 101 mm (4 in.) and 153 mm (6 in.) in height. Standardized procedure described in
AASHTO PP 60 and AASHTO TP 79 were followed during specimen preparation and dynamic
modulus testing, respectively. Figure 5.8 shows the PolyLevel® specimen in the AMPT testing
chamber.
y = 0.2047x + 0.2442 R² = 0.7789
0.000
0.050
0.100
0.150
0.200
0.250
0.300
-0.700 -0.600 -0.500 -0.400 -0.300 -0.200 -0.100 0.000
Pois
son'
s rat
io
Vertical Strain
45

Figure 5.8 Dynamic modulus test setup
During dynamic modulus testing, specimens were subjected to continuous sinusoidal, stress-
controlled loading at a specified frequency and temperature. The dynamic modulus varied from
78 MPa to 55 MPa (11312.90 psi to 7977.08 psi) at temperatures ranging from 4ºC to 40ºC (39ºF
to 104ºF) (Figure 5.9). According to [23], the dynamic modulus is defined as the peak stress
divided by the peak strain and is a measure of the overall stiffness of the mixture at a particular
test temperature and loading frequency.
Figure 5.9 Dynamic modulus against frequency at different temperature
10.0
100.0
0.1 1 10 100
Dyna
mic
mod
ulus
(Mpa
)
Frequency (Hz)
4C deg 20C deg 40C deg Log. (20C deg)
46

Dynamic modulus curves obtained at different temperatures and frequencies are aligned to form
a smooth continuous curve called the master curve (Figure 5.10). The master curve represents the
material response at various temperature and loading rates. Conditions relating to cold
temperature and fast traffic speeds are the high reduced frequencies on one end (left hand side)
of the master curve and conditions relating to high temperature and slow traffic speeds are the
low reduced frequencies at the other end (right hand side) of the master curve [23]. This method
was used because currently, there is no protocol to measure the dynamic modulus of
polyurethane materials.
Figure 5.10 PolyLevel® master curve
5.2. Modelling of PolyLevel® material under Traffic Loading by using Finite Element Analysis
PolyLevel® is polyurethane foam of high-density polymers with capabilities of being
expandable. Some state DOT’s (TDOT, IDOT, NDDOT etc.) are using this material for quick
repair of settled concrete pavements. However, literature review revealed that there has been
10
100
0.000001 0.0001 0.01 1 100 10000
l E*
l (M
pa)
Reduced Frequncy (Hz)
47

very limited research conducted in regard to the properties of this material, and its long-term
performance under cyclic traffic loading.
This study utilized finite element method (FEM) to evaluate long-term performance of
PolyLevel® since it is a mature numerical tool being widely adopted to study many aspects of
pavements. A commercially available FEM package, Abaqus, is used because it features user
defined materials and loadings, as well as strong adaptability in geotechnical engineering. An
Abaqus subroutine DLOAD written in FORTRAN is developed to model cyclic loadings. The
highway traffic loads are applied on a twelve meters-long Accelerated Loading Facility (ALF)
field test pavement. Two PolyLevel® foams with different densities are placed underneath a
concrete slab joint. Deformations of the PolyLevel® foams are monitored to evaluate its
performance.
Studies that are mostly related to this research include: Hadi and Bodhinayake [24] modelled
pavement deflection by considering the non-linear material properties with cyclic loading.
Zaghloul and White [25] conducted a sensitive 3D Finite Element analysis to investigate the
effect of various factors (cross-section and load attributes) on pavement performance. Properly
chosen material behavior for the pavement foundation is critical in FE modeling, Kim,
Tutumluer and Kwon [26] thus developed an Abaqus user material subroutine to model the
nonlinear stress-dependent behavior of the geomaterials.
5.2.1. Finite Element Model
The pavement structure used in this study (Figure 5.11(a)) is modified from a pavement section
where ALF test was carried out, at Callington, South Australia [23, 27]. A rigid concrete slab
replaces the top asphalt layer with an average thickness of 280 mm. The length of the ALF field
test pavement is 12 m. (Figure 5.11(b)) more about ALF is outlined in [28]. Two injected
polylevel foam patches 0.6 𝑚𝑚 × 0.2𝑚𝑚 × 0.05𝑚𝑚 (L× W× H), one with a density of 72.10 kg/m3
(4.50 lb./ft3) and the other of 152 kg/m3 (9.50 lb./ft3) are placed right underneath the bottom of
the rigid concrete slab. A cyclic load of up to 80.00 KN (17984.7 lbf.), on dual Michelin X type
tires, is applied along a 0.2 m (0.66 ft.) wide strip (darker area in Figure 5.11 (b)) on the surface
of the pavement at a constant speed of 20 km/hr. (12 mi./hr.) Approximately 380 load cycles are
48
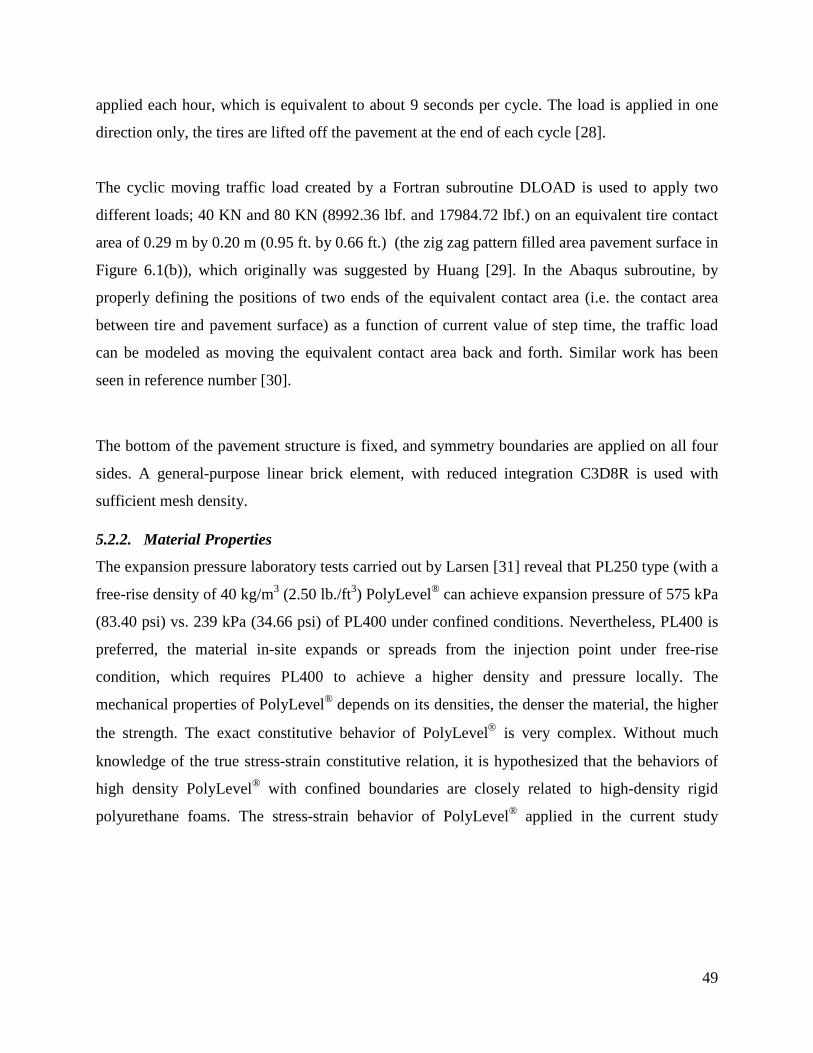
applied each hour, which is equivalent to about 9 seconds per cycle. The load is applied in one
direction only, the tires are lifted off the pavement at the end of each cycle [28].
The cyclic moving traffic load created by a Fortran subroutine DLOAD is used to apply two
different loads; 40 KN and 80 KN (8992.36 lbf. and 17984.72 lbf.) on an equivalent tire contact
area of 0.29 m by 0.20 m (0.95 ft. by 0.66 ft.) (the zig zag pattern filled area pavement surface in
Figure 6.1(b)), which originally was suggested by Huang [29]. In the Abaqus subroutine, by
properly defining the positions of two ends of the equivalent contact area (i.e. the contact area
between tire and pavement surface) as a function of current value of step time, the traffic load
can be modeled as moving the equivalent contact area back and forth. Similar work has been
seen in reference number [30].
The bottom of the pavement structure is fixed, and symmetry boundaries are applied on all four
sides. A general-purpose linear brick element, with reduced integration C3D8R is used with
sufficient mesh density.
5.2.2. Material Properties
The expansion pressure laboratory tests carried out by Larsen [31] reveal that PL250 type (with a
free-rise density of 40 kg/m3 (2.50 lb./ft3) PolyLevel® can achieve expansion pressure of 575 kPa
(83.40 psi) vs. 239 kPa (34.66 psi) of PL400 under confined conditions. Nevertheless, PL400 is
preferred, the material in-site expands or spreads from the injection point under free-rise
condition, which requires PL400 to achieve a higher density and pressure locally. The
mechanical properties of PolyLevel® depends on its densities, the denser the material, the higher
the strength. The exact constitutive behavior of PolyLevel is very complex. Without much
knowledge of the true stress-strain constitutive relation, it is hypothesized that the behaviors of
high density PolyLevel® with confined boundaries are closely related to high-density rigid
polyurethane foams. The stress-strain behavior of PolyLevel® applied in the current study
49

follows [32] and is shown in Figure 5.12.
Figure 5.11 Finite Element Pavement model
PolyLevel- 4.5pcf PolyLevel® material with a density of 72.10 kg/m3 (4.50 pcf.)
Figure 5.12 Stress-strain behavior of PolyLevel® used in FEM modeling
The mechanical properties of pavement layers used in this study are given in Table 5.4.
Researches show proper definition of nonlinear material behaviors for subgrade materials is
essential to accurately predict the total deflection of pavement [23, 25]. In this study, the focus
0
0.5
1
1.5
2
2.5
3
3.5
0 0.05 0.1 0.15 0.2
Stre
ss (M
Pa)
Strain PolyLevel-4.5pcf PolyLevel-9.5pcf
280mm
85mm
230mm 175mm
370mm
2200mm
Fill
Concrete
Subbase Base
Rockfill
Subgrade
(a) Pavement structure (b) ALF field test pavement
3.34m
1.3m
Polylevel® patch
Tire equivalent contact area
50

was on comparison of vertical deflections on the top of two types of injected polylevel foams
with a certain cycles of traffic loading. Linear elastic material properties are used for all the layer
materials except for the subgrade. Mohr Coulomb plasticity model is used to define subgrade
whose properties follow the ones given in [33].
Figure 5.5 shows that the stress-strain constitutive relation of PolyLevel® is size dependent and
the PolyLevel® experiences very large deformation without lateral confinement. However, the
lateral deflection of PolyLevel® used in pavement leveling is constrained, which means the
stress-strain relation seen in Figure 5.5 may not actually represent the true response of the
material under the pavement. It is also known that the expansion pressure (thus compressive
strength) of PolyLevel® is positively correlated to its density [31]. The bulk density of
PolyLevel® material used by TDOT was found to be 90.53 kg/m3 (5.7 pcf) (Table 5.7), which is
in between 72 kg/m3 (4.5 pcf) and 152 kg/m3 (9.5 pcf). Without knowledge of true stress-strain
relation, it could be a good representation to use well-established stress-strain constitutive
relation of high density polyurethane foam with densities of 72 kg/m3 and 152 kg/m3 to capture
or estimate the response of PolyLevel® under critical traffic cyclic loadings.
Table 5.4 Pavement layer material properties
Pavement Layer
Modulus of Elasticity (MPa)
Poisson’s Ratio
Concrete 30337.00 0.25 Base 138.00 0.35 Sub-base 96.60 0.35 Fill 72.45 0.35 Rock fill 62.10 0.35 Subgrade* 55.20 0.35 * Mohr Coulomb Plasticity model is used for this material.
5.2.3. Analysis Results
A geostatic stress field procedure allows verification of equilibrium of the initial geostatic stress
field with applied loads (i.e. gravity force in this study) and boundary conditions [34]. Elevation-
dependent initial stresses were specified in each layer of the pavement structure in order to reach
51

equilibrium that can be verified by negligible soil displacement in the vertical direction at the
end of geostatic step.
In 1974, Brown established a relationship between the permanent strain and the number of stress
cycles for a granular material through a repeated load tri-axial test under drained condition [35].
His study demonstrated that permanent strains would reach equilibrium value after about 104
stress cycles. It would be computationally expensive to apply such cyclic loadings in order to
determine the equilibrium permanent strains. Currently this study limits the number of cycles to
28 to test the workability of the user subroutine. Traffic loadings with many more cycles will be
considered in future studies.
The 0.2 m (0.66 ft.) wide strip is defined in Abaqus CAE, the loads (40 K and 80 K) are
specified in FORTRAN subroutine DLOAD that is called by Abaqus to execute the job. Figure
5.13 shows the vertical deflection contour plots when the equivalent contact area (tire) moves
from one end of ALF test pavement to the other. The deflections on the top of PolyLevel®
leveling foams when using different levels of traffic loads (40K and 80K) and different
PolyLevel® materials (72 kg/m3 and 152 kg/m3) are presented in Figure 5.14.
Figure 5.13 Vertical deflection contours when tire moves from one end of ALF test
pavement to the other
52

Figure 5.14 Deflections at the top of PolyLevel® leveling patch with cyclic traffic loading
5.2.4. Finite Element Analysis Conclusions and Discussions
It was determined that:
• The deflections fluctuate when cyclic traffic loads move back and forth on the rigid
pavement surface along the strip. Relatively small permanent deformations are observed. The
maximum peak deflection of all four cases is nearly 1.55 mm (0.6 in.). The increasing trend of
permanent deflection is not observed.
• It is found that the permanent deflection tends to be most significant when the largest
traffic load (i.e. 80 KN of 18,000 lbf) and the lowest density (72.10 kg/m3 or 4.50 pcf) rigid
polyurethane foams is used.
• One notices that the permanent deflections are almost identical if the load is 40 KN
(9,000 lbf) with a density of 72.10 kg/m3 (4.50 pcf) PolyLevel® and a load of 80 KN (18,000 lbf)
-0.20
0.00
0.20
0.40
0.60
0.80
1.00
1.20
1.40
1.60
1.80
0 5 10 15 20 25 30
Dis
plac
emen
t (m
m)
Cycles
Density4.5-F40K Density9.5-F40K
Density4.5-F80K Density9.5-F80K
53

but with a density of 152 kg/m3 (9.50 pcf) PolyLevel®. Nevertheless, the amplitude of the
fluctuation is almost doubled with high-density PolyLevel® and very large traffic load.
• When a high-density PolyLevel® foam is used for leveling the pavement, small traffic
load will result in the smallest permanent deflection and peak displacement. Relatively small
permanent deflection of polyurethane foam type PolyLevel® is observed with cyclic traffic
loadings applied. PolyLevel® may be used to quickly repair and restore slab drop-offs on rigid
pavement if proper density of PolyLevel® material is injected. Higher density PolyLevel® is
necessary to reduce the deflection and resist heavier highway traffic loads. With increasing
cycles, the permanent deflection is expected to become even larger, which is not obvious through
this study. Further and careful characterization of PolyLevel® material is needed.
• The PolyLevel® may be used to level settled rigid pavement quickly but it may
experience permanent deformation under long-term cyclic traffic loadings.
• Cyclic loading effect (increasing permanent deformation) is not significant with limited
cycles applied in this study. Well-established constitutive material models have to be created
through extensive experimental testing in order to better and further capture the performance of
PolyLevel®.
• Long-term permanent deformation may not be captured by cyclic traffic loading only
without properly considering material behaviors of subgrade layers and PolyLevel®.
• The creep property of PolyLevel® may also need to be considered, which is believed to
contribute significantly to the ultimate deformation of PolyLevel®.
54

6. DATA ANALYSIS, RESULTS AND FINDINGS Mean Roughness Index (MRI) and estimated International Roughness Index (eIRI) data was
collected periodically to monitor a key variable that correspond to pavement performance
(smoothness) of the PolyLevel® treated sections. Data was collected on five test locations on I-24
and I-75 in Chattanooga, Tennessee using the Roadroid app (eIRI), and high-speed inertia
profiler (for MRI). The MRI data was collected by a TDOT contractor at about eight months
intervals, while eIRI data was collected by UTC team every month after the application. The
eIRI before treatment is not available because the research team did not have the app ready when
PolyLevel® was applied on the selected sections. This section details the data collection and
results.
6.1. Pavement Roughness Data Collection using Roadroid App UTC adopted the use of Roadroid application for data collection. A Samsung Galaxy 5 was
purchased for this purpose. The trial eIRI data was collected on May 1st and May 15th of 2016 for
segments on I-24 West and I-24 East_182 (mile marker 179.5 to 178.2, and 182.35 to 183
respectively) using the Roadroid app. Roadroid classifies the IRI profile index with the
categories/thresholds shown on Table 6.1 [1].
Table 6.1 Estimated IRI ranking in Roadroid
IRI Threshold (m/km)
Speed (km/hr.) Rating
< 2.2 > 70 Good 2.2 – 3.8 50 - 70 Ok 3.8 – 5.4 30 - 50 Fair
> 5.4 < 30 Poor [1.00 m /km is equivalent to 63.36 in./mi.]
The data was collected on five sections listed on Table 1.1. Figures 6.1 and 6.2 provide a satellite
view of the trial section taken by the Roadroid app at the I-24 West near neat US-27 split. The
dotted lines are somehow off mark due to GPS errors, but they serve an illustrative purpose.
Figure 6.1 is a zoomed photo near the split.
55

Figure 6.1 Satellite view of Roadroid data points on I-24 in Chattanooga, TN
Figure 6.2 Zoomed view near I-24 and Hwy 27 split in Chattanooga, TN
6.1.1. Testing Variability of Roadroid Data Due to Vehicle Change
In anticipation of possible variations of the IRI measurements caused by the condition or type of
vehicle used, an experimental test was conducted in June 2016. This experiment used three (3)
passenger cars with different vehicle conditions to collect two full runs of IRI measurements at
80 km/hr. (50 mph) for each vehicle. The testing utilized the UTC vehicle test track, a 1.61 km
56

(1.00 mi.) track managed by the Center for Energy, Transportation, and the Environment
(CETE). The results are shown in Figure 6.3 below, with two runs each for vehicle i, j, and a,
respectively.
Figure 6.3 Repeatability of eIRI with vehicle type
The eIRI data obtained from the six runs on the test truck were analyzed using the Analysis of
variance (ANOVA) test, to evaluate the difference of the mean eIRI of the six runs. The results
showed that there is a mean difference at 95% significance level, since the p value 0.000655 was
smaller than 0.05 indicating rejection of the null hypothesis that eIRI means are equal for the six
runs. This analysis did not provide what test sets have different means. Therefore, a further
analysis using Turkey Honest Significant Differences (HSD) test, which performs pairwise
comparison of data sets, indicated existence of mean eIRI difference on four or five pairs out of
fifteen pairs tested (Table 6.2).
Tukey HSD test results show that there is a difference between the following means (the rest in
Table 6.2 are regarded have no difference)
j1 and i1: p-value adjusted = 0.009
j2 and i1: p-value adjusted = 0.037
j1 and i2: p-value adjusted = 0.028
a1 and j1: p-value adjusted = 0.021
a2 and j1: p-value adjusted = 0.048 (can also be interpreted as no difference ~ 0.05)
The difference was mainly between other cars (a and i) against car j which is older than the other
two cars used for the test. We can conclude that there could be some difference in measurements
0.000.200.400.600.801.001.201.401.601.802.00
eIR
I
i1
i2
j1
j2
a1
a2
57

depending on the car age and maintenance status. However, since two out of the three vehicles
showed no difference in mean eIRI values, we assumed no mean difference. The eIRI data
collection utilized only two cars, one car in the first year and the second car in the second year.
Table 6.2 Analysis of variance of means using Turkey (HSD) test
Data Groups Mean Differences
Confidence Interval P-value adjusted Lower
End Upper End
i2 - i1 -0.020 -0.150 0.111 1.000 j1 - i1 -0.157 -0.287 -0.027 0.009 j2 - i1 -0.135 -0.266 -0.005 0.037 a1 - i1 -0.015 -0.145 0.115 0.999 a2 - i1 -0.028 -0.158 0.102 0.989 j1 - i2 -0.137 -0.265 -0.009 0.028 j2 - i2 -0.116 -0.244 0.012 0.098 a1 - i2 0.005 -0.123 0.133 1.000 a2 - i2 -0.009 -0.137 0.119 1.000 j2 - j1 0.021 -0.107 0.149 0.997 a1 - j1 0.142 0.014 0.270 0.027 a2 - j1 0.129 0.001 0.257 0.048 a1 - j2 0.121 -0.007 0.249 0.076 a2 - j2 0.107 -0.021 0.235 0.152 a2 - a1 -0.013 -0.141 0.115 1.000
6.1.2. Roadroid Data Analysis
From September 2016 to March 2018, the research team at UTC conducted nineteen (19)
Roadroid runs, using a smartphone mounted on the front windshield of a passenger car travelling
at speeds ranging from 82 km/hr. (51 mi./hr.) to 102 km/hr. (63 mi/hr.). Data collected using
Roadroid smartphone app at these speeds was stored on Roadroid servers, downloaded into a
computer over Wi-Fi, and analyzed.
As Figures 6.4 – 6.8 show, all sections are performing well, with estimated IRI varying in a band
of 1.0 to 1.5 m/km (63.36 in./mi. to 95.04 in./mi.) except I-24 West and I-24 East_182, which
had values higher than 1.5 m/km (95.04 in./mi.) runs conducted from September 2016 to January
2017 and October 2017 to March 2018 respectively. All sections however, are performing within
58

the desirable IRI (below 2.2 m/km) for measurements conducted at a speed greater than 70
km/hr. (43 mph).
Figure 6.4 Average IRI variations on I-24 West from Sept. 2019 to March 2018
Figure 6.5 Average IRI variations on I-24 East_182 from Sept. 2019 to March 2018
0.5
1.0
1.5
2.0
2.5Se
pt.,
2016
Oct
., 20
16
Nov
., 20
16
Dec.
, 201
6
Jan.
, 201
7
Feb.
, 201
7
Mar
ch, 2
017
April
, 201
7
May
, 201
7
June
, 201
7
July
, 201
7
Aug.
, 201
7
Sept
., 20
17
Oct
., 20
17
Nov
., 20
17
Dec.
, 201
7
Jan.
, 201
8
Feb.
, 201
8
Mar
ch.,
2018
eIRI
(m/k
m)
Roadroid Runs
I 24 West
0.5
1.0
1.5
2.0
2.5
Sept
., 20
16
Oct
., 20
16
Dec.
, 201
6
Jan.
, 201
7
Feb.
, 201
7
Mar
ch, 2
017
April
, 201
7
May
, 201
7
June
, 201
7
July
, 201
7
Aug.
, 201
7
Sept
., 20
17
Oct
., 20
17
Nov
., 20
17
Dec.
, 201
7
Jan.
, 201
8
Feb.
, 201
8
Mar
ch.,
2018
eIRI
(m/k
m)
Roadroid Runs
I 24 East_182
Upper limit for desirable estimated IRI
Upper limit for desirable estimated IRI
59

Figure 6.6 Average IRI variations on I-24 East at Moore Bridge from Sept. 2019 to March
2018
Figure 6.7 Average IRI variations on I-75 North from Sept. 2019 to March 2018
0.5
1.0
1.5
2.0
2.5
Sept
., 20
16
Oct
., 20
16
Nov
., 20
16
Dec.
, 201
6
Jan.
, 201
7
Feb.
, 201
7
Mar
ch, 2
017
April
, 201
7
May
, 201
7
June
, 201
7
July
, 201
7
Aug.
, 201
7
Sept
., 20
17
Oct
., 20
17
Nov
., 20
17
Dec.
, 201
7
Jan.
, 201
8
Feb.
, 201
8
Mar
ch.,
2018
eIRI
(m/k
m)
Roadroid Runs
I 24 East_Moore Brg
0.5
1.0
1.5
2.0
2.5
Sept
., 20
16
Oct
., 20
16
Nov
., 20
16
Dec.
, 201
6
Jan.
, 201
7
Feb.
, 201
7
Mar
ch, 2
017
April
, 201
7
May
, 201
7
June
, 201
7
July
, 201
7
Aug.
, 201
7
Sept
., 20
17
Oct
., 20
17
Nov
., 20
17
Dec.
, 201
7
Jan.
, 201
8
Feb.
, 201
8
Mar
ch.,
2018
eIRI
(m/k
m)
Roadroid Runs
I 75 North
Upper limit for desirable estimated IRI
Upper limit for desirable estimated IRI
60

Figure 6.8 Average IRI variation on I-75 South from Sept. 2019 to March 2018
It can be concluded that, eIRI data may, to a small extent, be affected by a vehicle used for data
collection depending on the vehicle condition. The eIRI data collected was below the upper limit
(2.2 m/km), which indicated that the sections performed well. The correlation between eIRI and
MRI was not performed on this study.
6.2. Ride Quality Assessment Using the ICC Profiler An ICC profiler was used to obtain a true ride quality that had no influence of vehicle vibrations
as it travels. TDOT hired a contractor to collect the longitudinal profiles using the standard ICC
inertial profiler before and after injection of the PolyLevel® material underneath the test sections
slabs. The data was analyzed using ProVAL. Raw profile data were collected at a sampling
interval of 26.27 mm (1.03 in.).
The FHWA categorizes the pavement condition of the National Highway System (NHS) based
on ride quality as follows: Good for IRIs below 1.50 m/km (95 in./mi.); Fair for IRI between 1.5
and 2.70 m/km (95 and 170 in./mi.); and Failed for IRIs above 2.7 m/km (170 in./mi.). The ride
quality of the pavement is considered acceptable if the IRI falls in either the good or fair
category [37].
0.5
1.0
1.5
2.0
2.5
Sept
., 20
16
Oct
., 20
16
Nov
., 20
16
Dec.
, 201
6
Jan.
, 201
7
Feb.
, 201
7
Mar
ch, 2
017
April
, 201
7
May
, 201
7
June
, 201
7
July
, 201
7
Aug.
, 201
7
Sept
., 20
17
Oct
., 20
17
Nov
., 20
17
Dec.
, 201
7
Jan.
, 201
8
Feb.
, 201
8
Mar
ch.,
2018
IRI (
m/k
m)
Roadroid Runs
I 75 South
Upper limit for desirable estimated IRI
61

Table 6.3 NHS ride quality scale
IRI (m/km) Rating < 1.50 Good
1.50 - 2.70 Fair > 2.70 Failed
[1.00 m/km is equivalent to 63.36 in./mi]
The ride quality of the test sections was within the acceptable level before application of the
PolyLevel® and remained the same nineteen months or more after the injection. The only
exception was the section at I-24 East_182, which consistently measured in the failed category
(IRI > 2.7 m/km (170 in./mi.)) before and after application, with an irregularity at the eighth
month post injection measurement that fell within the acceptable level (see Figure 6.12). This
may be attributed to wheel wander, in which wheel paths differ per vehicle passes, among other
things. The Roadroid results also indicated fluctuations on IRI measurements (Figures 6.4 – 6.8).
The material was injected on different dates while the ICC profiler runs were conducted on the
same dates each time. This means that data were collected on different pre- and post- application
lengths/intervals.
Figure 6.9 IRI and MRI measurements for I-75 South MM 9 to MM 7
1.001.201.401.601.802.002.202.402.602.803.00
Before application One week afterapplication
Thirteen monthsafter application
IRI/
MRI
(m/k
m)
I-75 South
Left wheel track IRI
Right wheel track IRI
MRI
acceptable region
62

Figure 6.10 IRI and MRI measurements for I-75 North MM 7 to MM 9
Figure 6.11 IRI and MRI measurements for I-24 between Moore Rd. and Mc Brien Rd
1.001.201.401.601.802.002.202.402.602.803.00
Before application One week afterapplication
Thirteen months afterapplication
IRI/M
RI (
m/k
m)
I-75 North
Left wheel track IRI
Right wheel track IRI
MRI
acceptable region
1.001.201.401.601.802.002.202.402.602.803.00
Beforeapplication
One month afterapplication
Thirteen monthsafter application
Twenty ninemonths afterapplication
IRI/M
RI (
m/k
m)
I-24 East_Moore
Left wheel track IRI
Right wheel track IRI
MRI
acceptable region
63

Figure 6.12 IRI and MRI measurements for I-24 East, between MM182.3 and MM183
Figure 6.13 IRI and MRI measurements for I-24 West, between MM 179.5 and MM 178.2
11.21.41.61.8
22.22.42.62.8
3
Before application One week afterapplication
Eight months afterapplication
Nineteen monthsafter application
IRI/M
RI (
m/k
m)
I-24 West
Left wheel track IRI
Right wheel track IRI
MRI
acceptable region
1.001.201.401.601.802.002.202.402.602.803.00
Before application One week afterapplication
Eight months afterapplication
Nineteen monthsafter application
IRI/M
RI (
m/k
m)
I-24 East_182
Left wheel track IRI
Right wheel track IRI
MRI
acceptable region
64

6.3. Analysis of Results and Findings Roughness data collected using ICC Profiler was subjected to statistical analysis to determine the
if a statistical difference in MRI before and after PolyLevel® applications exists.
6.3.1. Effectiveness of PolyLevel® to Improve Pavement Ride Quality
The UTC research team conducted a statistical analysis of MRI data collected before and after
PolyLevel® application to assess the improvement on ride quality of the sections treated with
PolyLevel®. The raw roughness measurements obtained using an ICC profiler were initially
analyzed using the ProVAL software to obtain the mean roughness index MRI. Table 6.4 below
shows the overall roughness measurements of the treated sections.
Table 6.4 Overall MRI measurements of before and after PolyLevel® application
Highway Section ID
Start Mile
End Mile
Lane #
Before Application After Application After Application After Application
Date MRI Date MRI Date MRI Date MRI
I-24 West 179.5 178.2 2 9/24/2015 2.19 10/08/2015 2.06 6/16/2016 2.03 7/12/2017 2.09 I-24 East_182 182.35 183.0 3 9/24/2015 2.83 10/08/2015 2.89 6/16/2016 2.54 7/12/2017 2.85 I-24 East Moore Brg McBrien 2 2/9/2015 2.19 3/2/2015 2.05 3/21/2016 1.75 7/12/2017 1.68 I-75 North 7.0 9.0 3 3/21/2016 1.68
6/16/2016 1.64 7/12/2017 1.82
I-75 South 9.0 7.0 3 3/21/2016 1.83 6/16/2016 1.77 7/12/2017 1.87 *MRI is in m/km [1m/km is equivalent to 63.36 in./mi.]
The following is observed from Table 6.4:
i. In general, the MRI of four test sections decreased after application of PolyLevel® except
for I-24E_182, which slightly increased. This section had MRI before application on the
failed region with (MRI > 2.7 m/km) while the rest of the test sections were in the fair
region (1.5 < MRI <2 .7 m/km) (Table 6.3).
ii. A continual decrease in MRI readings after application was observed on section I-24
East_Moore Bridge, while I-24 West MRI readings remained almost the same as after
applications. There is no specific pattern observed, almost all sections had fluctuations on
MRI readings except for I-24 East Moore Brg., which its MRI values continued to
decrease (improved smoothness). Fluctuations were also experienced with eIRI readings.
65

iii. Approximately two years after the PolyLevel® injection on I-24 East_182, the ride
quality is almost the same as before application. Two and a half years after application on
I-24 East_Moore Bridge, the ride quality is continuing to show improvement (MRI
values decreasing).
Further statistical analysis to assess changes in ride quality of the sections was conducted on
every interval of 100 m using a paired t test to compare MRI measurements (before and after
application of PolyLevel®). The assumption was the underlying MRI population data is normally
distributed and the null hypothesis was accepted if the MRI means are equal; otherwise, it was
rejected with confidence level of 95% or a level of significance of 0.05. Results of the paired t
tests summarized in Table 6.5.
The results in Table 6.4 show a reduction on MRI readings after PolyLevel® application,
although Table 6.5 show that no statistical significant changes were achieved in all sections
immediately after application. I-75 North and I-24 East_182 had statistical significant changes
on MRI readings thirteen and eight months after PolyLevel® application respectively. The MRI
of I-24 East_Moore decreased from 2.19 m/km to 2.05 m/km (138.76 in./mi. to 129.89 in./mi.)
one month after application, this change was not statically significant, but it continued to
decrease thirteen month and twenty-nine months after application, which was a statistical
significant decrease in MRI (Figure 6.11). Sections on I-75 South and I-24 West did not show
any statistical significant changes on MRI readings at any time on the data collection periods
although there was a reduction on MRI readings immediately after application and it went back
to almost original readings thirteen months after application for I-75 South. I-24 West had a
reduction on MRI immediately after application and twenty-nine months after application it was
still below the original readings although not statistically significantly different.
66
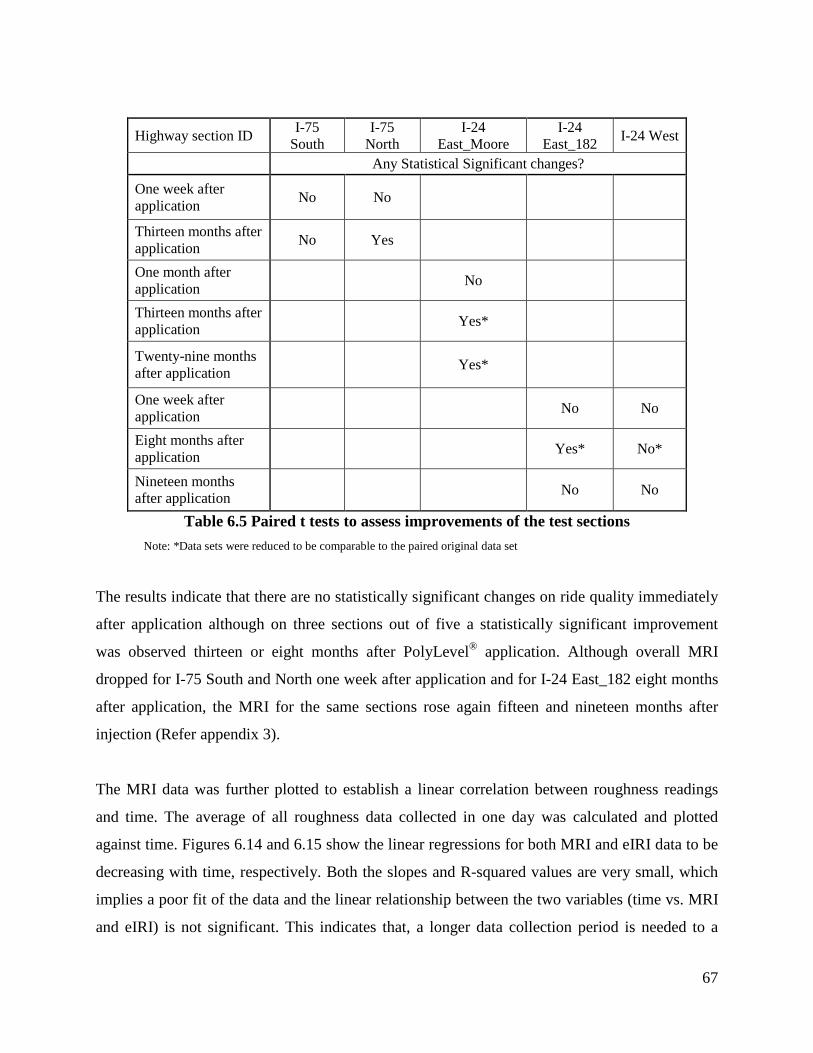
Table 6.5 Paired t tests to assess improvements of the test sections Note: *Data sets were reduced to be comparable to the paired original data set
The results indicate that there are no statistically significant changes on ride quality immediately
after application although on three sections out of five a statistically significant improvement
was observed thirteen or eight months after PolyLevel® application. Although overall MRI
dropped for I-75 South and North one week after application and for I-24 East_182 eight months
after application, the MRI for the same sections rose again fifteen and nineteen months after
injection (Refer appendix 3).
The MRI data was further plotted to establish a linear correlation between roughness readings
and time. The average of all roughness data collected in one day was calculated and plotted
against time. Figures 6.14 and 6.15 show the linear regressions for both MRI and eIRI data to be
decreasing with time, respectively. Both the slopes and R-squared values are very small, which
implies a poor fit of the data and the linear relationship between the two variables (time vs. MRI
and eIRI) is not significant. This indicates that, a longer data collection period is needed to a
Highway section ID I-75 South
I-75 North
I-24 East_Moore
I-24 East_182 I-24 West
Any Statistical Significant changes?
One week after application No No
Thirteen months after application No Yes
One month after application No
Thirteen months after application Yes*
Twenty-nine months after application Yes*
One week after application No No
Eight months after application Yes* No*
Nineteen months after application No No
67

point where most of the sections fail to determine a better deterioration model and a true
performance period of the PolyLevel® material on highways. The linear regression models are
currently not a good representation of long term performance of pavements with PolyLevel
application.
Fluctuations on MRI and eIRI readings could be attributed to test vehicle wheel wonder or
change in properties of PolyLevel® materials with change in temperature or environment
(humidity and rainfall), which is not part of this study.
6.14
Figure 6.14 Regression model of averaged MRI versus time
y = -0.0036x + 2.1115 R² = 0.0115
1.00
1.20
1.40
1.60
1.80
2.00
2.20
2.40
2.60
0 5 10 15 20 25
MRI
(m/k
m)
Time (months)
y = -0.0008x + 1.388 R² = 0.002
0.0
0.2
0.4
0.6
0.8
1.0
1.2
1.4
1.6
1.8
0 5 10 15 20
Road
roid
IRI (
m/k
m)
Time (months)
68

Figure 6.15 Regression model of averaged eIRI versus time
69

7. CONCLUSION AND RECOMMENDATIONS This study was conducted to evaluate the effectiveness of the injected PolyLevel® material in
rigid pavement slabs to improve surface smoothness on interstates I-24 and I-75 in Chattanooga,
Tennessee. To evaluate the short and long-term performance of the material, three main
methodologies were applied:
i. A detailed questionnaire to state DOTs maintenance engineers to obtain their experience
on using polyurethane material
ii. Monitoring the treated sections and assessing surface roughness changes before and after
application of the material.
iii. Finite element modeling of a pavement section with PolyLevel® application.
PolyLevel® material were applied on five sections of U.S interstate I-24 and I-75 in Chattanooga
Tennessee between February 2015 and June 2016 (Table 1.1). These sections had length ranging
from 1.050 km (0.65 mi.) to 3.220k m (2.0 mi.). The sections rest on a 255 mm (10 in.) granular
base; they are made of PCC slabs with thickness of 255 mm (10 in.), and joint spacing of 4.57 m
(15 ft.). By 2017, the AADT of the treated sections on I-24 East and I-24 West was 134,740
vehicles per day and 119,930 vehicles per day respectively, with trucks being 18.50 percent. The
AADT of treated sections on I-75 was 77,150 vehicles per day, of which 14.5 percent were
trucks.
7.1. DOT Questionnaire The questionnaire was dispersed to 50 state DOTs in the U.S and one Canadian province
ministry of infrastructure and Transportation. Fifty percent (50 %) of the questionnaire
recipients responded, of which approximately 90 percent of those who used or are using
polyurethane for leveling settled pavement slabs, recommend a continual use of polyurethane
materials. It was reported that the most common or preferred technique for slab levelling is slab
replacement followed by polyurethane application and the least is asphalt injection. On cost
effectiveness, respondents indicated that polyurethane injection was the most cost-effective
technique (low cost and shorter time) whereas asphalt injection is reported as the least cost-
effective technique. Ninety four percent (94 %) of respondents who have used polyurethane
material reported that their projects were below or on the budget, only six percent (6 %) had over
the budget experience with polyurethane materials. The life span of polyurethane treated
70

sections varied from one year to ten years, and slab cracking and settlement are the common
indicator for failure of the section.
7.2. Finite Element (FE) Analysis Laboratory tests were performed to obtain mechanical properties of PolyLevel® materials needed
for FE analysis. However, challenges of obtaining samples and testing the on time made it
difficult to use the parameters on the model. Laboratory results indicated that the materials
contain voids therefore the confinement of the material changes its properties. The bulk density
of PolyLevel® material sampled under non-confined condition (small samples) was 51 kg/m3
which corresponds to the free rise density specified by TDOT of 48.00 kg/m3 (3.00 pcf) but
twenty percent (20 %) below the PolyLevel® free rise density specifications (Table 2.1). The
compressive strength and Young’s modulus were 0.26 MPa (37.71 psi) and 5.98 MPa (867.33
psi) respectively; with Poisson’s ratio ranging from 2.00 to 3.00. Specimen sampled under a
partially confined condition (larger samples) have a bulk density of 91.22 kg/m3 (5.69 pcf) with
compressive strength of 34 MPa (4931.28 psi).
The finite element analysis (FEA) model showed that treated sections will undergo permanent
deformation under long term cyclic loading; this analysis also recommend use of high density
foam to resist the effect of heavy traffic loading.
7.3. Pavement Surface Roughness Measurements Ride quality survey for pavement surface roughness was conducted to assess both short- and
long-term pavement performance. Longitudinal profiles data on the treated sections was
collected using a high-speed inertial profiler before and after application of the material, and a
smartphone-based app after PolyLevel® application for a period of two and a half years. Since
the PolyLevel® application dates differed significantly the data collection intervals between the
sections also differed (Table 6.4). The following conclusion can be drawn:
i. Generally, the pavement roughness measured (MRI) after the application showed
reduction of MRI readings, meaning improved smoothness, but the improvement was not
statistically significant at 95% confidence level (Table 6.5).
71

ii. The MRI of four test sections (I-75South, I-75North, I-24East_Moore, and I-24West)
decreased just after application of PolyLevel® except for I-24East_182, which increased
by 2.12 percent. Approximately one year after application of the material, the MRI of I-
75 South and I-75 North increased, while that of I-24 East_Moore and I-24 West
decreased approximately two years and one year and a half after injection of the material
respectively.
iii. MRI of section I-24 East_182 before application of the material was in the failed region
(MRI > 2.70 m/km) and it has remained in the same region after application of
PolyLevel®. The MRI of other four sections were in fair region (1.50 <MRI<2.70) and
they remained in this region after application of PolyLevel®. For the sections monitored
there was no improvement that went beyond the performance region after PolyLevel®
application.
iv. The fluctuations observed in roughness reading for both MRI and eIRI resulted into a
negative slope when a linear regression was performed on the data, indicating that the
smoothness is increasing with time. A longer data collection period is recommended to
capture the time when most of the sections will have readings below the acceptable
range.
v. Approximately two years after the PolyLevel® injection on I-24 East_182, the ride
quality is almost the same as before application. Two and a half years after application on
I-24 East_Moore, the ride quality is continuing to show improvement (MRI values
decreasing). For the data collection period it can be concluded that the PolyLevel® lasted
from thirteen (13) months to over twenty-nine (29) months from the application date.
These results are similar to what was reported from the questionnaire that most sections
lasted from one year to 10 years.
vi. On average eIRI indicated that all sections performed within the acceptable region, while
MRI readings showed that section I-24 E_182 was in a poor condition. This shows that
eIRI may under estimate roughness readings compared to MRI.
In conclusion, application of PolyLevel® underneath the pavement slabs neither did statistically
significantly improve nor retrogress the condition of the sections but maintained it in their state
before application of the material. Therefore, for a pavement section in a poor condition
(IRI/MRI >2.70 m/km) polyurethane foams injection is not the best option, as the section will
72

remain in the same state even after application of the material. However, state DOTs can apply
polyurethane foams on section with good or those transiting to a fair condition to extend the life
of the pavement.
7.4. Recommendations This research study recommends the following:
i. Prior injection of the material, a detailed ground investigation of the damaged pavement
section must be carried out to establish the causes, and whether polyurethane foam
injection will be the appropriate remedial measure.
ii. Polyurethane foams should be injected under structural sound slabs resting on granular
base; and sophisticated leveling equipment should be used to avoid overcorrection of the
treated slabs.
iii. For structural damaged slabs, slab replacement (full/partial depth repair) is more cost
effective and a very appropriate option.
iv. If polyurethane injection is conducted on interstates where heavy trucks are expected; the
density of the material is recommended to be very high. A further study on PolyLevel® is
necessary to establish material properties required on high traffic roadway.
v. Development of a standardized protocol for selecting pavement sections suitable for
treatment with PolyLevel® and application procedure to avoid overcorrection of slabs.
vi. Progressive monitoring of the sections to capture a full long-term performance of the
material, and possible appropriate treatments after their service life time.
73
REFERENCES [1] Huang Y. H,. Pavement Analysis and Design, Second Ed. Pearson Prentice Hall, New
Jersey, 2004.
[2] PolyLevel® www.PolyLevel®.com Retrieved in February 2016.
[3] Vennapusa, P. K. R. and White, D. 2014. Field assessment of a jointed concrete pavement
foundation treated with injected polyurethane expandable foam. International Journal of
Pavement Engineering, 16 (10), 906-918.
[4] Opland, W. H., and Barnhart, V.T. 1995. Evaluation of the URETEK Method for Pavement
Undersealing. Michigan Department of Transportation (MDOT), Research Projects 93 G-
294, Report No. R-1340
[5] Soltesz, S. 2002. Injected Polyurethane Slab Jacking, Oregon Department of
Transportation Research Group and Federal Highway Administration, Grant No. SPR 306-
261
[6] Gaspard, K., and Morvant, M. 2004. Assessment of the Uretek Process on Continuously
Reinforced Concrete Pavement, Jointed Concrete Pavement, and Bridge Approach Slabs.
Louisiana Transportation Research Center (LTRC) project No. 05-1TA.
[7] Abu Al-Eis, K. and La Barca, I. 2007. Evaluation of the URETEK method of pavement
lifting. Madison, WI: Wisconsin Department of Transportation, Report No: WI-02-07
[8] Priddy, L. P., Tingle, J. S., McCaffrey, T. J. and Rolling, R. S. 2007. Laboratory and Field
Investigation of Small Crater Repair Technologies. ERDC/GSL TR-07-27. U.S. Army
Engineer Research and Development Center, Vicksburg, Mississippi.
[9] Priddy, L. P., Jersey, S. R. and Reese, C. M. 2010. Full-scale field testing for injected foam
stabilization of Portland Cement Concrete Repairs. Transportation Research Record:
Journal of the Transportation Research Board, No. 2155. Transportation Research Board of
the National Academies, Washington, D.C., 24-33.
[10] Abaza, K. A. (2016). Back-calculation of transition probabilities for Markovian-based
pavement performance prediction models. International Journal of Pavement Engineering,
17(3), 253-264.
[11] Roadroid User Guide, 2015
74

[12] Ferreira, A., Antunes, A., & Picado-Santos, L. I. S. (2002). Probabilistic segment-linked
pavement management optimization model. Journal of Transportation Engineering, 128(6),
568-577
[13] Reigle, J., & Zaniewski, J. (2002). Risk-based life-cycle cost analysis for project-level
pavement management. Transportation Research Record: Journal of the Transportation
Research Board, (1816), 34-42.
[14] Abaza, K., & Murad, M. (2007). Dynamic probabilistic approach for long-term pavement
restoration program with added user cost. Transportation Research Record: Journal of the
Transportation Research Board, (1990), 48-56.
[15] Butt, A. A., Shahin, M. Y., Feighan, K. J., & Carpenter, S. H. (1987). Pavement
performance prediction model using the Markov process.
[16] Sayers, M. W., Gillespie, T. D., & Paterson, W. D. (1986a). Guidelines for conducting and
calibrating road roughness measurements.
[17] Sayers, M. W., Gillespie, T. D., & Queiroz, A. (1986b). The international road roughness
experiment. Establishing correlation and a calibration standard for measurements.
[18] Sayers, M. W., & Karamihas, S. M. (1996). Interpretation of road roughness profile data.
[19] Karamihas, S., Gillespie, T., Perera, R., & Kohn, S. (1999). Guidelines for longitudinal
pavement profile measurement.
[20] Jones, H., & Forslof, L. (2014). Roadroid continuous road condition monitoring with
smartphones. Paper presented at the Proceedings of the 5th SARF/IRF Regional
Conference, Pretoria, South Africa.
[21] Scholotjes, M., Visser, A., & Bennett, C. (2014). Evaluation of a smartphone roughness
meter.
[22] Roadroid User Guide, 2015
[23] FHWA. (2013). Asphalt Mixture Performance Tester
[24] Hadi, M. NS, and Bodhinayake, B. C. Non-linear Finite Element Analysis of Flexible
Pavements. Advances in Engineering Software, Vol. 34, 2003, pp. 657-662.
[25] Zaghloul, Sameh M., and White, T. Use of a Three-dimensional, Dynamic Finite Element
Program for Analysis of Flexible Pavement. Transportation Research Board, Washington,
D.C., 1993.
75

[26] Kim, M., Tutumluer, E., and Kwon, J. Nonlinear Pavement Foundation Modeling for
Three-dimensional Finite-element Analysis of Flexible pavements. International Journal of
Geomechanics, Vol. 9, No. 5, 2009, pp.195-208.
[27] Kadar, P. The Performance of Overlay Treatments and Modified Binders Under
Accelerated Full-scale Loading—The Callington ALF Trial. Research Report ARR, No.
198Australian Road Research Board, Victoria, Australia, 1991.
[28] Koniditsiotis, C. Accelerated Loading Facility (ALF)-Does It Actually Do What It
Claims? Combined 18th ARRB Transportation Research Conference and Transit New
Zeland Transport Symposium, Christchurch, New Zeland, 1996.
[29] Huang, Y.H. Pavement Analysis and Design. Englewood Cliffs, Prentice-Hall, New Jersey,
1993.
[30] The Abaqus FAQ, http://www-h.eng.cam.ac.uk/help/programs/fe/abaqus/faq68/
abaqusf7.html. Accessed July 01, 2017.
[31] Larsen, J. Expansion Pressure Testing of Polyurethane Foam for Concrete Stabilization and
Lifting. 2015 Foundation Supportworks. http://d6449bb3dc657045bfc9-
290115cc0d6de62a29c33db202ae565c.r80.cf1.rackcdn.com/319/TechnicalWP_ExPressure
TestingPolyFoam.pdf. Accessed July 15, 2017
[32] Traeger, R. K. Physical Properties of Rigid Polyurethane Foams. Journal of Cellular
Plastics Vol. 3, No. 9, 1967, pp. 405-418.
[33] Bodhinayake, B. C. A Study on Nonlinear Behaviour of Subgrades Under Cyclic Loading
for the Development of a Design Chart for Flexible Pavements, Ph.D. Thesis, University of
Wollongong, 2008.
[34] Abaqus 6.14 CAE User’s manual. Dassault Systèmes, the 3DEXPERIENCE Company,
Providence, Rhode Island, 2016.
[35] Brown, S.F., 1974 Repeated Loading Test of a Granular Material, Journal of Geotechnical
Engineering Division, ASCE, Vol. 100, No. GT7, July, pp 825-841.
[36] Gaber and Garber, N. J., & Hoel, L. A. (2014). Traffic and highway engineering 5th Ed.:
Cengage Learning, United States 2015
[37] USDOT. (2015). 2015 Status of the Nation's Highway, Bridge, and Transit: Condition and
Performance Report to Congress. FHWA. Washington, DC.
76

APPENDIX 1 State DOTs Questionnaire
Application of PolyLevel® Materials on Pavements PolyLevel®/URETEK is a high-density polyurethane compound that offers concrete leveling solutions for both commercial and residential projects. This method of leveling foundations and highways has been in practice since 1975. This questionnaire is prepared by the University of Tennessee at Chattanooga (UTC) for Tennessee Department of Transportation (TDOT), with the aim to find ways to evaluate and improve the cost effectiveness of concrete pavement leveling by using PolyLevel® materials in the state of Tennessee. Your response to this questionnaire will be very beneficial to this study and is highly appreciated. At the end of this study, results will be shared with you. Thank you in advance for your participation. 1. Please provide your state DOT? ___________________________ 2. Your contacts:
Name: __________________________ Phone number ______________________ Email Address_________________________ Position ____________________________
3. What method do you use for leveling concrete pavement slabs (Check all that apply)?
a. Mud-jacking b. HMA overlay c. Polyurethane compounds d. Slab replacement e. Other: Please specify: _______________________
4. Out of the methods listed on Q 3, what is the approximate cost per sq. yd. of each method? a. Mud-jacking ____________ b. HMA overlay ______________ c. Polyurethane compounds ___________________ d. Slab replacement _________________ e. Other: Please specify: _______________________
5. According to your experience, what is the cost effectiveness of the materials, 1 being not cost effective (too expensive and time consuming) and 5 being very cost effective (good performance for the money paid)?
Cost effectiveness 1 2 3 4 5 a Mud-jacking b HMA overlay c Poly compounds d Slab replacement e Other: ___________
6. Have you used PolyLevel®/URETEK (polyurethane compound) materials in your state?
a. Yes b. No
77

If the answer to questions 6 is no, you may stop here. If the answer to question 6 is yes please proceed to question 7.
7. What type or trade name of Polyurethane materials (PolyLevel®®, URETEK etc.) have you
used? a. _______________________________ b. ______________________________ c. _______________________________ d. _______________________________
8. Was the project completed on predicted time?
a. Yes b. No 9. Was the project cost as estimated correctly?
a. Yes b. No
10. Did the contractor use ground penetrating radar (GPR) prior to project implementation? a. Yes b. No
11. Did the contractor bore holes to inject the material?
a. Yes b. No
12. What effects does the hole drilling have on the slabs? Did they provide weakness (Such as cracking) to the pavement structure?
________________________________________________________________________________________________________________________
13. How did you monitor the performance of pavement sections with Polyurethane material?
________________________________________________________________________________________________________________________
14. How long did the section last before first sign of distress?
Cracking _______________________________________ Settling ________________________ Other: Specify _________________________________________________
15. Would you consider Poly materials to be cost effective? a. Yes b. No
16. What was the saving in cost per yd2 compared to other methods? a. Mud-jacking ____________ b. HMA overlay ______________ c. Polyurethane compounds ___________________ d. Slab replacement _________________ e. Other: Please specify: _______________________
78

APPENDIX 2 States that Responded to questionnaire
SN States Responded Usage of Polyurethane
No. Responded
Not responded
Yes No 1 ALABAMA Y 1 ALASKA 2 BRITISH COLUMBIA˟ N 1 ARIZONA 3 COLORADO Y 1 ARKANSAS 4 DELAWARE N CALIFORNIA 5 IDAHO+ Y N 2 CONNECTICUT 6 IOWA+ Y N 2 D.OF COLUMBIA* 7 KANSAS Y 1 FLORIDA 8 LOUISIANA Y 1 GEORGIA 9 MAINE N 1 HAWAII 10 MARYLAND Y 1 ILLINOIS 11 MASSACHUSSETS N 1 INDIANA 12 MICHIGAN Y 1 KENTUCKY 13 MINNESOTA+ Y N 2 NEBRASKA 14 MISSISSIPI Y 1 NEW HAMPSHIRE 15 MISSOURI Y 1 NEW JERSEY 16 MONTANA N 1 NEW MEXICO 17 NEVADA Y 1 NORTH DAKOTA 18 NEW YORK Y OKLAHOMA 19 NORTH CAROLINA Y 1 PENNSYLVANIA 20 OHIO Y 1 PUERTO RICO* 21 OREGON Y 1 RHODE ISLAND 22 SOUTH CAROLINA Y 1 SOUTH DAKOTA 23 TENNESSEE Y 1 UTAH 24 TEXAS Y 2 VERMONT 25 VIRGINIA N 1 WEST VIRGINIA 26 WASHINGTON Y 2 WYOMING 27 WISCONSIN 28 29 Totals 20 6 26
+ Two conflicting response were received, during the analysis one was discarded based on question #6 on the questionnaire, Yes survey was used because it could be the other engineer was not aware of the usage of polyurethane materials. ˟ Canadian Province * Puerto Rico and District of Columbia were contacted.
79

APPENDIX 3 Treated sections IRI readings prior and post injection of PolyLevel
Highway section ID I 75 South I 75 North I 24 East_Moore I 24 East_182 I 24 West IRI (m/km)
80

[1.00 m/km is equivalent to 63.36 in./mi.]
Wheel track profile Left Mean Right Left Mean Right Left Mean Right Left Mean Right Left Mean Right
Before application 1.83 1.84 1.84 1.76 1.68 1.6 2.14 2.19 2.23 2.91 2.83 2.75 2.13 2.19 2.25 One week after application 1.81 1.80 1.79 1.72 1.64 1.56
Thirteen months after application 1.94 1.87 1.79 1.91 1.82 1.73
One month after application 2.04 2.05 2.06
Thirteen months after application 1.75 1.75 1.75
Twenty-nine months after application 1.68 1.68 1.68
One week after application 2.85 2.89 2.92 1.99 2.06 2.13
Eight months after application 2.54 2.55 2.55 1.97 2.04 2.10
Nineteen months after application 2.91 2.86 2.8 2.06 2.09 2.12
81