Project Report Submitted to the - Kerala
129
FINAL REPORT EMPLOYMENT GENERATION THROUGH ENTREPRENEURSHIP DEVELOPMENT IN TOURISM SECTOR: AN EVALUATIVE STUDY IN THE STATE OF KERALA Project Report Submitted to the Kerala Institute of Labour and Employment By DR. D. MURALEEDHARAN KERALA INSTITUTE OF LABOUR AND EMPLOYMENT TRIVANDRUM MARCH 2015
Transcript of Project Report Submitted to the - Kerala

FINAL REPORT
EMPLOYMENT GENERATION THROUGH ENTREPRENEURSHIP DEVELOPMENT IN TOURISM SECTOR: AN EVALUATIVE STUDY
IN THE STATE OF KERALA
Project Report Submitted to the
Kerala Institute of Labour and Employment
By
DR. D. MURALEEDHARAN
KERALA INSTITUTE OF LABOUR AND EMPLOYMENT
TRIVANDRUM
MARCH 2015

Dr. D. Muraleedharan Principal Investigator
Kerala Institute of Labour and Employment
Trivandrum
Declaration
I Dr. D. Muraleedharan hereby declare that this project entitled
EMPLOYMENT GENERATION THROUGH ENTREPRENEURSHIP
DEVELOPMENT IN TOURISM SECTOR: AN EVALUATIVE STUDY IN THE
STATE OF KERALA, is a bonafide record of research work done by me during
the course of my research and that the project has not previously formed the
basis for the award to me of any degree, diploma, associate ship, fellowship of
other similar title or recognition.
Trivandrum
20th MARCH 2015 Dr. D. Muraleedharan

CONTENTS
Page No
EXECUTIVE SUMMARY vi-ix
LIST OF TABLES x
LIST OF FIGURES xi
LIST OF ABBREVIATIONS xii
CHAPTER I INTRODUCTION 1-15
1.01 Entrepreneurship 2
1.02 Statement of the problem 3
1.03 Scope of the Study 4
1.04 Review of Literature 5
1.05 Objectives of the Study 5
1.06 Research questions 6
1.07 Key variables and terms used in the study 6
1.08 Definition of the term Tourist 6
1.09 Areas identified for the study 7
1.10 Hypothesis of the study 7
1.11 Methodology 7
1.12 Estimating Employment in Tourism: Approaches,
Methods and Data Past studies
9
1.13 Details of the work completed 12
1.14 Definition of employment coefficient 12
1.15 Presentation of Report 15
CHAPTER II REVIEW OF LITERATURE 16-37
2.00 Introduction 16

2.01 Generation of employment in Tourism Sector 17
2.02 Nature of Tourism Employment 20
2.03 Tourism 24
2.04 Entrepreneurship Development in Tourism 26
2.05 Destination development in Tourism 28
2.06 Employment generation in Tourism 31
CHAPTER III TOURISM EMPLOYMENT – AN OVERVIEW 38-57
3.00 Introduction 38
3.01 Tourism Industry in Kerala – A preview 39
3.02 Direct Employment 42
3.03 Indirect Employment 44
3.04 Induced Employment 47
3.05 Manpower management in Tourism – The components 49
3.06 Manpower Planning 50
3.07 Recruitment and Selection 51
3.08 Induction and Training 52
3.09 Motivation 52
3.10 Compensation to employees 53
CHAPTER IV ANALYSIS AND INTERPRETATION 58-68
4.00 Introduction 58
4.01 Personal profile of stakeholders 59
CHAPTER V HUMAN RESOURCE DEVELOPMENT MODELS 69-90
5.00 Introduction 69
5.01 Employment co-efficient model 72
5.02 Estimation of Employment co-efficient 73

CHAPTER VI SUMMARY AND FINDINGS 91-98
6.00 Introduction 91
6.01 Summary 92
6.02 Findings 94
CHAPTER VII ACTION PLAN FOR TOURISM
DEVELOPMENT IN THE STATE 99-110
APPENDICES: 111-136
APPENDIX-I BIBLIOGRAPHY 111
APPENDIX-II INTERVIEW SCHEDULE 118
APPENDIX-III TABLE-I 131
APPENDIX-IV TABLE-II 132
APPENDIX-V SCHEDULE OF DISCUSSION 133
APPENDIX-VI REPORT OF DISCUSSION 135

vi
Executive summary
The present study employment generation through entrepreneurship development
at tourism destinations in the state of Kerala is the result of a research study sponsored by
Kerala Institute of Labour and Employment. The abstract of the study is given below in the
form of an executive summary. Tourism as an instrument for economic development and
employment generation, particularly in remote and backward areas, that has been well
recognized all over the world. It is the largest service sector industry, globally in terms of
revenue as well as foreign exchange earnings. Tourism plays an important and effective role
in achieving the social objectives of growth with equity. Tourism is an economic sector that
has the potential to grow at a higher rate and can generate lot of employment opportunities at
the destinations.
As a seasonal industry it provides alternative and off-seasonal employment
opportunities to the labour force of Kerala. It is true to state that by promoting young
entrepreneurs, enormous employment opportunities can be generated from tourism sector
through entrepreneurship development programmes. Entrepreneurship Development
Programme (EDP) and Human Resource Information System (HRIS) can transform
entrepreneurial ambitions as income and employment. Employment co-efficient method is
used in this study to predict the capacity to generate employment opportunities of this sector.
Employment co-efficient is the index computed on the basis of interrelationship between the
volume of income and employment.
The study is designed in the present format, by taking into consideration the following
objectives
To identify the present volume of employment generated in the State through different
sectors of tourism.
To promote Entrepreneurship Development Programme as a tool for employment
generation in tourism sector
To identify other promotional activities required in tourism sector to generate more
employment.

vii
To forecast the volume of employment that can be generated from tourism in future.
Employment coefficient index is that unit or quantity of income required producing
one unit of employment. The employment coefficient is computed for all the sectors and
subsectors related to tourism to ascertain the volume of employment in each of these sectors.
The report of this study is presented in a well structured format consisting of seven
chapters.
The first chapter deals with objectives of the study, statement of the problem, scope of
the study, methodology and hypothesis.
The second chapter gives the details of an extensive literature survey specifying
quotations from various books, articles, thesis, bulletins and websites. To have indepth
knowledge in the subject matter a detailed analysis of the available literature has been done;
inferences arrived from the analysis of the secondary data reveals a clear cut picture about
subject matter related to the study.
The third chapter gave an idea about the nature of tourism, employment opportunity
in different sectors of tourism, Entrepreneurship Development Programmes etc in tourism
sectors. Different strategies were adopted in the study for estimation of man power, human
resources development, employment and generation.
The fourth chapter deals with the analysis and interpretation. The profile of stake
holders were reviewed and analysed here extensively. Statistical test like percentages, chi-
square and F test were used in the study for data analysis to arrive at inferences.
The fifth chapter describes details regarding analysis of income and employment
generation models for tourism development and human resource development. The
employment co-efficient model and the input output models were developed to measure and
project the future to measure employment potential of the state.
The sixth chapter gives a detailed account of the summary of findings.
Chapter seven is drafted in the form of an action plan which consists of 10
prospective proposals suitable to be implemented at different tourism destinations of Kerala.

viii
These suggested proposals are based on the result of analysis and shortcomings identified at
various destinations. If these proposals are properly promoted and implemented,
revolutionary change can be made in the tourism segment of the state in generating
employment to the people and income to the stakeholders.
The following inferences and findings were arrived at as outcome of the study based on the
statistical analysis.
The volume of total income generated from tourism in Kerala in 2013 increased to 22,
927 crores rupees from Rs 4500 crores in 2001.
The volume of domestic tourists arrival to the state in the year 2013 was 108.58 lakhs
as against 50.13 lakhs in 2000. Over a period of 14 years, there was a two fold
increase in the volume of domestic tourist inflow.
The volume of foreign tourist inflow to the state for the period increased in 2013 to
8.58 lakhs as against 2.09 lakhs in the year 2000. The growth in the inflow of foreign
tourists during the period was fourfold as against the two fold increase in the volume
of domestic tourists inflow.
The projection on income and employment in this study was made for a period of 12
years extending from 2014 to 2025.During this period the estimated volume of
income from tourism was 1, 19, 750 crores rupees where as it was only 26, 287 crores
in 2014, which reveals a four and a half times increase (450%).
Employment co-efficient index was used to predict the future employment potential
of tourism industry of the state. It showed a declining trend. This was due to the cost
reduction and labour saving techniques adopted by the stake holders. This index
declined to 85 in 2025 as against 140 in 2002. The overall decrease in the
employment coefficient for the study period was estimated as 55 persons per rupees
one crores of value added.
The projection reveals that tourism industry will make tremendous growth rate for the
projected period of 24 years. By 2025 the volume of employment opportunities in
tourism sector of the state will be 101.92 lakhs as against 6.90 lakhs in 2002 .This
increases will be to the tune of 14.77 times for the projected period
The effects of tourism employment between different tourism activities are found to
be uniform.

ix
Many stakeholders are self employed, particularly in destinations where tourism
enterprises are small.
Destination development leads to increased tourist inflows which in turn results in
generation of additional income and employment opportunities to the State.
Entrepreneurship Development Programmes leads to tourism development and
employment generation.
Tourism employment requires low skill levels and low entry requirements. In areas
were specific skills are required, particularly in poorly developed destinations, the
industry often turns to outside expertise rather than provide training for local people.
Tourism employment is structured by gender; the majority of jobs in most tourism
tasks are held by women, particularly the low-paid, part-time and seasonal positions
Tourism facilitates to improve the livelihood and standard of living of the locals at
destinations
On the final part of the study an action plan for tourism development through
entrepreneurship development programmes in the state of Kerala has proposed. In this part 13
innovative proposals having much wider scope and potential based on the regional
peculiarities were identified and suggested to be implemented in the tourism sector for its
transformation growth and development.

x
LIST OF TABLES
Table No. Title Page
No. 3.01 Month Wise Arrival of Foreign and Domestic Tourists - The State of
Kerala 2013 39
3.02 Earnings from Tourism 40
3.03 Trends in Domestic and Foreign Tourist arrivals into Kerala 41
4.01 Personal profile of stakeholders 58
4.02 Types of Tourism activities 60
4.03 Types of Tourism products 61
4.04 Classification of stakeholders 62
4.05 Factors needed for inclusive development of tourism industry 63
4.06 Annual earnings from tourism 64
4.07 Status of employment opportunity 65
4.08 Status of tourism industry 66
4.09 Mean opinion score of stakeholders about services available at the destination
67
5.01 Income from tourism 76
5.02 Estimation of employment co-efficient 77
5.03 Aggregate employment co-efficient of tourism sector in Kerala 78
5.04 Estimated volume of employment generated from foreign tourism 80
5.05 Estimated volume of income from foreign tourism in different tourism sub sectors
83
5.06 Estimated volume of employment in different sub sectors due to foreign tourism
84
5.07 Estimated volume of income and employment from domestic Tourism 85
5.08 Distribution of income among different tourism subsectors 88
5.09 Distribution of employment in different tourism subsectors 89
xi
LIST OF FIGURES
Figure No. Title
Page No.
4.01 Factors needed for inclusive development 64
4.02 Annual earnings from tourism 65
4.03 Status of tourism industry 66
4.04 Mean opinion score of stakeholders about services available at the destination
68
5.01 Classification of tourist spending 69
5.02 Model for developing tourism industry 71
5.03 Income from tourism estimated through trend projection curve method
79
5.04 Volume of employment in tourism sector 82
5.05 Graphical representation of volume of employment from domestic tourism
87

xii
List of abbreviation
BOOT - Build Own Operate and Transfer
BOT - Build Operate and Transfer
CAGR - Compound Annual Growth Rate
CGE - Computational General Equilibrium
DFID - Department for International Development
EC - Employment Coefficient
EDP - Entrepreneurship Development Programme
ESCAP - Economic and Social Commission for Asia and Pacific
GDP - Gross Domestic Product
GOI - Government of India
GOVT. - Government
ICSB - International Council for Small Business
KILE - Kerala Institute of Labour and Employment
KITTS - Kerala Institute of Travel and Tourism Management
KTDC - Kerala Tourism Development Council
MOT - Ministry of Tourism
NCEAR
National Council for Applied Economic Research
NGO - Non Government Organisations
NRI - Non Resident Indian National
PPP - Public Private Partnership
SAGR - Simple Average Growth Rate
TSA - Tourism Satellite Account
UN - United Nations
UNWTO
United Nations World Tourism Organisation
USD - US Dollar
WTC - World Tourism Council
WTTC - World Travel and Tourism Council

1
CHAPTER I
INTRODUCTION
Tourism has been a major social phenomenon of the societies all along .It is
motivated by the natural urge of every human being for new experiences; adventure,
education and entertainment .The motivation for tourism also includes social, religious, and
business interests. The spread of education has fostered a desire to know more about different
parts of the globe. The basic human thirst for new experience and knowledge has become
stronger, as technological advances are overcoming communication barriers. Progresses in air
transport and development of tourist facilities have encouraged people to venture out to the
foreign world.
The importance of Tourism as an instrument for economic development and
employment generation, particularly in remote and backward areas, has been well recognized
all over the world. It is the largest service sector industry globally in terms of revenue as well
as foreign exchange earnings. Tourism can play an important and effective role in achieving
the social objectives of growth with equity. Tourism is one economic sector in India that has
the potential to grow at a high rate and can generate a lot of employment opportunities at the
destinations. It has the capacity to capitalize on the country’s success in the service sector and
provide sustainable models of growth.
Tourism has the potential to stimulate other economic sectors through its backward
and forward linkage and cross- sectoral synergies with sectors like agriculture, horticulture,
poultry, handicrafts, transports, construction etc. Expenditure on tourism induces a chain of
transactions requiring supply of goods and services from a good number of related and
unrelated sectors. The consumption demand, emanating from tourist expenditure, also
induces more employment opportunities that generate a multiplier effect on the economy.

2
Thus, the expansion of the tourism sector can lead to large-scale employment generation and
poverty alleviation programmes. The economic benefit that flow into the economy through
growth of tourism in the shape of increased national and state revenues, business receipts,
employment, wages and salary , and tax receipts leads to overall growth in the economy.
Tourism has become an instrument for sustainable human development including:
Poverty elimination
Environmental regeneration
Job creation
Advancement of woman and other disadvantaged groups
Tourism is overwhelmingly an industry of private sector service providers, although the
public sector has significant role to play in infrastructure areas either directly or through
public private partnership (PPP) mode. The related sectors include airlines, surface transport,
hotels, basic infrastructure and facilitation systems etc. Thus the growth of tourism cannot be
attained unless the issues related to all the related sectors are addressed simultaneously.
1.01 Entrepreneurship
Tourism entrepreneurship is defined by Saayman,A.& Saayman,M. (1997) as
activities related to creating and operating a legal tourists enterprise. Legal enterprise refers to
those businesses that operate on a profitable basis and seek to satisfy the needs of tourists and
visitors. These enterprises include hotels, guesthouses, travel agencies and tour operators.
The persons who hawk goods or services, like arts and craft, to tourists are also considered as
tourism entrepreneurs.
Tourism is currently the fastest growing industry in Kerala, the largest industry in the
world and also the biggest employer. Globalisation has brought about economic changes in
general, and particular changes in the tourism industry. The focus of the tourism industry has

3
shifted from air travel, overnight meals and so on to total experiences or fantasy worlds
associated with specific destinations(Keller and Koch,1995) this new tourism phenomenon is
not only influenced by economic factors but also by new cultures and a new generation of
tourists.
1.02 Statement of the problem
Tourism is a major economic and social activity of the present day. It is the
temporary movement of people from their normal place of residence or work to the tourism
destinations for pleasure. It is not a single industry but a group of industries, complementary
to each other, spread over many sectors like hotel, transport, recreational, entertainment,
handicrafts business and other similar industries which provide facilities and products for
satisfying the wants and needs of the tourists. It provides employment opportunities to
millions of people, generates foreign exchange, promotes national integration, and ensures
balanced regional development.
Kerala fondly referred to as God’s own Country having the potential to develop as
tourism capital of the world. It is since more than a decade now, we have started to develop
tourism as the most prominent industry of the state. But the contribution of this sector in
generating income and employment opportunities are still negligible. A lot of employment
opportunities are there yet remains unidentified and untapped in the existing tourism
destinations like beach tourism, backwater tourism and ecotourism. Tourism related
manpower development and Entrepreneurship Development Programmes are inevitable for
development and generation of more employment in the State. Most of the tourism and
vocational courses do not serve these purposes and most of them are outdated in the present
scenario. In designing the tourism course curriculam more emphasis is to be given to impart
career related awareness courses through on the job and off the job training programmes,
rather than imparting theoretical knowledge. There is only a limited number of tourism

4
related Entrepreneur development cells functioning in the state. Therefore innovative skills
development programmes for young entrepreneurs in tourism sector are to be brought out. In
this scenario the present study attempts to find the major areas where EDP are necessary to
explore more employment opportunities in tourism industry and, to identify new and
potential areas of tourism destinations in Kerala.
Tourism is one of the biggest industries of the world. It is a smokeless industry which
requires minimum capital investment to generate maximum income and employment
opportunity. It is estimated that worldwide travel and tourism industry creates a new job in
every 10 seconds. Out of every nine persons, one person earns a living from tourism and one
out of every ten inhabitants of this planet is a tourist.
Tourism is a seasonal industry and it provides alternative and off-seasonal
employment opportunities to the labour force of Kerala. It is true to state that by promoting
young entrepreneurs, enormous employment opportunities can be generated in tourism sector
through entrepreneurship development programmes in the state.
1.03 Scope of the study
The present study is exploratory in nature based on survey method. It is decided to
gather quantitative as well as qualitative information to gather data for the study. The
methodology of the study is designed in such a manner to arrive at inferences based on
collection and analysis of quantitative information through interview schedules and
qualitative information from knowledgeable persons through interactive sessions. For this,
along with well structured interview schedules, the researcher will use interview guide to
elicit the required information from the selected respondents. In this study it is estimated to
project the potential of generating employment opportunities in the tourism sector through
EDP. In order to avoid the element of risk in these new projects, risk profile analysis shall
also be made as part of this study.

5
1.04 REVIEW OF LITERATURE
Chantell Van Nikerk (2013) argues that tourism creates three types of employment,
direct employment for people who are directly employed in tourism facilities, indirect
employment defined as the jobs that contribute to the tourism industry and induced
employment in an area due to the economic upsurge which is caused by tourism.
Keller and Koch (1995) state that tourism is currently the fastest growing and the
largest industry in the world and also the biggest employer. Globalization has brought about
economic changes in general, but also particular changes in the tourism industry. The focus
of the tourism industry has shifted from air travel, overnights, and meals and so on to total
experiences or fantasy worlds associated with specific destinations.
Gupta (2004) defines entrepreneurial leadership as “leadership that creates visionary
scenarios used to assemble and mobilize a supporting cast of participants who become
committed by the vision to the discovery and exploitation of strategic value creation”
1.05 Objectives of the study
Following are the specific objectives set for the smooth conduct of the study.
1. To identify the present volume of employment generated in the State through different
sectors of tourism.
2. To promote Entrepreneurship Development Programme as a tool for employment
generation in tourism sector
3. To identify other promotional activities required in tourism sector to generate more
employment.
4. To forecast the volume of employment that can be generated from tourism in future.

6
1.06 Research questions
Does tourism generates substantial employment opportunities in the state of Kerala
How far entrepreneurship development programmes in tourism sector generates
employment opportunities
In the near future, how much employment opportunities can be generated in tourism
through entrepreneurship development programmes.
1.07 Key variables and terms used in the study
Entrepreneurship Development Programme, Capacity building, Manpower training,
man power planning, skill development programmes , stakeholders , tourism products,
Destination development, Job creation, value creation, infra-structure development, direct,
indirect and induced employment, local participation, and Public Private Partnership.
1.08 Definition of the term ‘Tourist’
Domestic tourist
A domestic tourist is a person who travels within the country to a place other
than his usual place of residence and stays in hotels or other hotel establishments run on
commercial basis in dharmashalas ,agraharas etc for a duration of not less than 24 hours or
one night and for not more than 12 months at a time for pleasure ,pilgrimage,social
functions,business conferences and study and health programmes.
Foreign tourist
A foreign tourist is defined in line with the UN/WTO tourism statistics as any
person normally living outside India (with an Indian or foreign nationality) and travelling to
India for less than 12 months and “whose main purpose of the trip is other than the exercise
of an activity remunerated from within the place visited.” Therefore foreign tourists include
foreign nationals as well as non‐resident Indian nationals (NRI).

7
1.09 Areas identified for the study
For the present study the geographical location is the State of Kerala. The total
volume of employment generated through tourism is the population for the study. Tourism
products and services are back water tourism, beach tourism, health tourism, pilgrim tourism,
mountaineering, adventure tourism eco-tourism, cultural tourism, home stay facilities, farm
tourism, hill station tourism etc.
1.10 Hypotheses of the study
𝑯𝟎 There is no significant difference in employment opportunity in different tourism
activities
𝑯𝟏 There is significant variation in factors needed for inclusive development of tourism
Industry
𝑯𝟐 There is significant difference in the level of earnings among different tourism
Products
𝑯𝟑 There is significant difference in reasons for the success of tourism industry
𝑯𝟒 There is significant difference in various tourism services available at destinations
1.11 Methodology
The vision of the researchers is to develop a model to forecast the volume of
employment that can be generated through development of new destinations and through
expanding the existing destinations. For this three destinations were identified to carry out the
study in the state. They are Kovalam in Thiruvananthapuram district, Kuttanadu in
Alappuzha district and Thenmala in Kollam district. Kovalam is a centre for beach tourism.
Kuttanadu is a centre for back water tourism and Thenmala is a centre for eco- tourism.
These destinations were selected based on the product popularity. Each of these three
destinations was carefully investigated by collecting primary data through well structured
interview schedules from ten selected groups of stake holders. 10 respondents each from each

8
group of stake holders were selected through convenient sampling method to collect the
primary data from each of these destinations selected for the study. In addition to this the
researchers has collected qualitative data from a group of selected persons well acquainted
with tourism activities through interactive sessions using schedule guides. Through a detailed
analysis of this information and by establishing interrelationships with variables a good
number of inferences were emulated.
To forecast the employment potential from similar other destinations, with the help
of these inferences, appropriate models has developed and used as tools to forecast the
employment potential of tourism industry in the State. As there exist a positive correlation
between the size, nature and volume of tourists inflow, it can be manipulated to micro to
macro level depending on the requirements of the state and policies of the planners and
administrators for destination development, and for generating new employment
opportunities. The volume of employment prevailing at the existing destinations will be equal
to the actual number of employees presently working there plus the manpower required to fill
the deficiency gap.
The volume of employment predicted through the model, when multiplied with the
number of destinations in relation to its size and tourist inflow, the total volume of
employment that can be generated in the tourism sector, can be predicted. To ascertain the
volume of employment in the new destinations the primary data collected through the
interview schedule, was tabulated and statesticaly analysed. Details regarding the scope and
potential relating to the new destinations was collected from the stakeholders through
interview schedules. All these responses were revalidated through repeatedly asked questions
to the respondents. Those areas identified as new destinations were can be used to estimate
the probable number of employment opportunities that can be generated from the tourism
sector through Entrepreneurship Development Programmes. In order to estimate the future
9
incremental growth rate, the trend projection method has used. The average annual compound
growth rate in employment generation for a period of five years has used to determine the
trend, to estimate the future growth rate.
To conduct the present study data relating to ten categories of employment,
directly and indirectly related to tourism, were identified .They are the following;
House boat owners
Hotels and resorts
Travel agents & Tour operators
Eco-tourism
Domestic and Foreign Tourist
Street vendors
Artisans, Handicrafts
Taxi service
Tourist guides
Ayurveda resorts
Primary data from 300 sample respondents from the entire population comprising 10
respondents each from each of the categories of stake holders from each of the three
destinations were collected and analysed for the study.
1. 12 Estimating Employment in Tourism: Approaches, Methods and Data Past studies
Three different approaches have generally been used for estimating employment in
the tourism sector. They are (i) employment coefficient approach, (ii) input‐output analysis
approach, and (iii) computational general equilibrium analysis approach (CGE). Each of
these approaches has its own advantages and limitations. The employment coefficient is the
ratio of employment (number of jobs) to output. In the case of tourism, employment

10
coefficient is derived as the weighted average of the coefficients of sectors and subsectors in
which employment gets generated as a result of tourism. Estimating employment with the use
of coefficients is straight forward method provided that data on output or income are
available for the sectors concerned.
The input‐output analysis has been popular among scholars, institutions and
government agencies estimating the employment impacts of tourism (Dwyer and Forsyth
1998; Stynes 2001). In the input‐output method, estimates for industry output for different
sectors are estimated for a given aggregate tourism expenditure. Aggregate
tourism‐generated employment is then estimated by multiplying the tourism related output
of each industry by employment coefficient (employment to output ratio) for that industry
and summing estimates across industries (Dwyer and Forsyth 1998 and ESCAP 1990).
Input‐output method is, however, criticised for its unrealistic assumptions and inflexibility
as far as changes in prices and technology are concerned.
The World Travel and Tourism Council (WTTC) estimates employment generated by
Travel and Tourism Industry and Travel and Tourism Economy for various countries using
the Tourism Satellite Accounts (TSA) methodology that is based on input‐output method.
In India, a recent study has attempted to estimate total employment and output generated by
the tourism sector using the TSA methodology (NCAER 2006). The computable general
equilibrium (CGE) analysis can be described as an improvement over the input‐output
method. The CGE method does not suffer from some of the inadequacies of the
input‐output method (Dwyer and Forsyth 1998). CGE models allow for detailed analysis of
inter‐industry links together with price variations and supply constrains. However, setup
costs of a CGE model are high in terms of hardware, software and data requirements. Thus,
analysis based on CGE models is generally undertaken by large agencies such as the

11
government and institutions that have a long‐term interest in monitoring an economy or
specific sectors of the economy.
There have been some earlier attempts to estimate total employment due to tourism in
India without distinguishing between employment effects of domestic and foreign tourism.
The United Nations Economic and Social Commission for Asia and the Pacific (ESCAP)
estimated the direct and indirect employment generated by tourism in India for a few years
till 1989–90. The National Council of applied Economic Research (NCAER) has recently
developed the first ever Tourism Satellite Account for India (NCAER 2006). This provides
estimates of total output and employment generated by tourism in India without
distinguishing between domestic and foreign tourism. The TSA estimates are based on
surveys on tourist expenditure pattern conducted in 2002–03 and input output tables of 1998–
99.
The WTTC has been estimating country‐wise annual data on employment
generated in the tourism sector since 1998.Based on TSA methodology, the WTTC provides
estimates of employment generated by tourism at two levels: the travel and tourism industry
and the travel and tourism economy. While the former captures direct employment due to
tourism, the latter includes indirect employment in the economy due to tourism. The present
study, attempts to estimate the size and volume of employment that can be generated by
tourism industry in Kerala. After making some improvements in methodologies used in
earlier studies.
The present study is an attempt to estimate direct employment generated by tourism in
Kerala in recent years. The study also attempts to make projections on employment
generation for the next 62 years in domestic and foreign tourism sectors of Kerala.
In order to estimate the volume of employment due to tourism in Kerala, the
researcher has decided to use the employment coefficient approach. The employment

12
coefficients are computed for such sectors and sub‐sectors that provide goods and services
to foreign tourists as hotels and restaurants, transport and travel services, cultural and
recreational services, trade (retail trade of food products, trade in products such as
handicrafts, textiles and so on) and manufacture (food products, textiles, gems and jewellery,
handicraft and so on).
1.13 Details of the work completed
As scheduled earlier in the first phase of the study, the researcher has examined the
available literature relating to tourism, tourism entrepreneurship, destination development
and employment generation.
For collection of data two separate sets of questionnaires were developed, one for
domestic and international tourists and the other for tourism stake holders. The schedules
were drafted with generation utmost care after taking into consideration. The objectives of the
study all other aspects related to employment generation. In order to estimate employment
generation three internationally accepted methods are used. The employment coefficient
model was selected for this study to determine the employment potential of the tourism sector
in Kerala state. The other two methods approaches, namely input output analysis approach
and computational general equilibrium approach (CGE) are found not as suitable as
employment co-efficient approach.
1. 14 Definition of employment coefficient
Employment coefficient measures the ratio between employment and output/value
added in a sector/economy, and can be expressed in several ways. In this exercise the
researcher defines employment coefficient for a sector as the number of workers employed in
that sector for a crore of rupees of value added in that sector. If the currency used in the
computation of the employment coefficient is the US dollar, the corresponding definition of
employment coefficient is given as the number of workers employed for every million US

13
dollar worth of value added that is generated. The aggregate employment coefficient for the
economy or for a composite sector such as the tourism sector is given by the weighted
average of the employment coefficients of the different sub‐sectors that form the economy
or composite sector. The estimate of total employment in the composite sector is given by the
product of the total expenditure in the composite sector and aggregate employment
coefficient for the composite sector.
Thus, if n1 is the number of workers employed in sector i and if v1 is the value added
in that sector then the employment co-efficient for the sector i is given by
eci = ni /vi ………………….1
The aggregate employment coefficient is then
EC = ∑ wi eci …………………2
Or
EC = ∑ wi ni /vi
Where i = 1…m (total number of sub sectors), and wi = weight for sector i
The employment in the economy/composite sector is given by
Employment = EC × GDPc …………………3
Where, GDP c is the domestic product of the economy or the composite sector. In case
of a composite sector (tourism), the tourism GDP can be estimated from the sum total of all
expenditures by tourists.
Note: in case of tourism, weight w of each of the sub sectors is derived from the expenditure
pattern of tourists.
Main assumptions
The estimation involves the following main assumptions arising primarily from the
limitations of data availability.
1. There is no leakage due to imports. It is assumed that all goods and services provided

14
to foreign tourists in India are produced within the country and not imported. This
assumption could have been avoided if data on the amount or share of imports in
tourists’ consumption were available.
2. The employment coefficient for all firms is equal. It is assumed that the labour
productivity of all firms within a sector associated with tourism is equal. In other
words, we assume that labour productivity in restaurants that cater to tourists and
non‐tourists is equal. This assumption may not hold as it is known that certain firms
specialise in servicing tourists (as against non‐tourists) and that this could lead to a
different labour productivity in such firms.
3. The expenditure pattern of foreign tourists remains stable. As in the case of previous
assumption, due to lack of data, it is assumed that the pattern of expenditure of
tourists remains constant over the period of this estimation. Thus, the sub‐sectors
that are identified as being part of the composite tourism sector remain and their
relative weights remain constant for the estimation period. This could be an
unrealistic assumption as it is seen from the earlier studies that the expenditure pattern
indeed changes over time.
The researcher has also made a few personal interviews and interactive sessions with
some stake holders. The results of these interactions are appended as last part of this report.
All the activities in connection with this study are progressing as scheduled earlier. The
procedure to begin second phase of the study is progressing. Data collection and data
analysis are scheduled to be completed in this phase. All the activities in connection with this
study are progressing as scheduled earlier. The researcher is confident in submitting the
report of the study within the stipulated time.

15
1. 15 Presentation of Reports
The project is presented in six different chapters as follows.
The first chapter of the project contain and introduction, objectives of the study,
statement of the problem, scope of the study, operation definition, methodology and
presentation of report.
The second chapter is literature review wihich contains abstract of the published
articles and research studies in the research
The third chapter provide a conceptual idea about tourism, employment opportunity in
Tourism, EDP practices in tourism, different development practices of human resources,
motivation and compensation to employees.
The forth chapter is analysis and interpretation. The profile of stake holders reviewed
and analysed extensively in three destination viz; Beach tourism in Kovalam, Eco tourism in
Thenmala and Backwater tourism in Alleppey.
A development model for tourism and destination development is given in Chapter
Five. The employment coefficient is computed for all the sectors and subsectors related to
tourism to ascertain the volume of employment in that sector.
Chapter six, the final chapter contains Summary, Findings and Conclusions.

16
CHAPTER II
REVIEW OF LITERATURE
2.00 INTRODUCTION
Kerala is famed as God‟s own country. It looks like a „fairy land‟ with its fresh green
hills, dense forests, palm- fringed lakes, rivers, backwaters and lagoons. The backwaters of
Kerala are the backbone of Kerala Tourism. It is unique and found nowhere else in the World.
Forty one west-flowing rivers of Kerala are a magnificent gift of nature. Most of the finest
beaches in India are in Kerala. The rolling high ranges of the Western Ghats are very attractive
and also play an important role in determining the climate of the State. Eco-tourism centers of
Kerala are very popular. India‟s first planned eco-tourism centre at Thenmala is in Kerala.
Kerala is renowned as a health tourism destination also. The Ayurvedic health tourism is more
popular here because the State has an unparalleled wealth of herbs and natural vegetation;
perhaps, similar plants are seen only in the Himalayas. It is due to the unique geographical
position and tropical climate of the State. The humid climatic condition is also favourable for
Ayurvedic treatment and is considered as the best attraction to the tourist. Exotic wildlife,
monuments, fairs and festivals, cultural heritage, spectacular arts and handicrafts, architecture
and cuisine etc renders distinctive charm to Kerala tourism. Apart from being a tourist
destination, Kerala is also India‟s most literate, most peaceful and cleanest State. Kerala was
adjudged as one of the „Ten paradises of the World by the National Geographic Traveller. A
forecast study conducted by WTTC states that travel and tourism related to economic activity
of Kerala grows at 11.4% during 2004-2013 and shall provide employment to 2.2 million (15
per cent of total employment) by 2013.
In order to have an indepth knowledge in the subject matter the detailed analysis of the
available literature has done. The analysis of the secondary data revealed a clear cut picture of

17
the subject matter related to the study which was given in the following part under different
heads.
2. 01 Generation of Employment in Tourism sector
The adoption of tourism as a development strategy is commonly based on the benefits
that tourism potentially brings employment opportunities to the people at destinations. One of
the most frequently reported benefits of tourism is the generation of employment not only for
those who live in the localities but also for those in surrounding areas or who temporarily
immigrate in search of tourism income. While the contribution of tourism to employment at a
macro level has been largely documented, little is known about the actual effects that tourism
employment has on the livelihoods at a micro level. These effects will unquestionably be
shaped by the specific characteristics of the tourism employment held by each individual.
The characteristics of tourism employment have been commonly cited by scholars.
Attributes such as low income, seasonality and low wages, to mention some, have been used
to describe tourism employment. While most of these characteristics may be commonly
applicable to various destinations, it is reasonable to believe that such characteristics are not
ever-present in the so called tourism industry. This recognition makes sense if we take into
account that socioeconomic, cultural and political conditions vary among destinations. The
specific qualities of tourism employment at a particular destination will be shaped by several
factors, namely, the economic conditions existing in the destination, the social and cultural
structures of local communities, and certainly the type of tourism activity.
Tourism is widely recognised as a labour‐intensive service sector. In addition, the
nature of the sector is such that the multiplier and spill over effects are generally expected to
be higher than other sectors. Tourism also generates employment for workers at all levels of
skill (ESCAP 1996). But, for the reasons given above in respect of income and output no
direct estimates of employment in tourism are possible on the basis of the prevalent scheme

18
of generating statistics at the sectoral and sub‐sectoral levels. The present study is an
attempt has been made in this paper to estimate trends in employment generated by tourism
in Kerala by applying an alternative methodology that uses derived coefficients from
available data.
Apart from the contribution for foreign exchange earnings, the importance of tourism
industry can be measured in terms of its contribution to the national income (as measured by
the tourism GDP) and employment. The nature of tourism industry, however, makes
estimation of these parameters difficult. Tourism is a composite sector. It generates income in
a large number of activities that feature as sectors and sub‐sectors in the classificatory
scheme of the National Accounts Statistics (NAS). Important among them are (i) Hotels and
other accommodation units; (ii) Restaurants; (iii) Travel agents and tour operators; (iv)
Transport services; (v) Tourist resorts and complexes; (vi) Entertainment facilities; (vii)
Shopping facilities including sales outlets for curios, handicrafts, souvenirs, etc.; (viii)
Conference and Convention facilities; (ix) Adventure and recreational sports facilities; and
(x) Guide services. These activities provide goods and services to both the local population
and tourists and therefore there is the problem of apportionment of output between tourism
and non‐tourism components and further, within tourism, between that generated by
domestic and foreign tourism.
The travel and tourism industry is one of the largest and most dynamic industries in
today‟s global economy. It is expected to generate about 9 per cent of total GDP and provide
more than 235 million jobs in 2010, representing 8 per cent of global employment. Last
November, over 150 government, employer and worker delegates from more than 50
countries, meeting at the ILO‟s Global Dialogue Forum on New Developments and
Challenges in the Hospitality and Tourism Sector, discussed new developments and

19
challenges in the sector. The Forum was opened by Mr Taleb Rifai, Secretary-General of the
World Tourism Organization (UNWTO) and Mr Juan Somavia, Director-General of the ILO.
Compared to other sectors of the global economy, the industry is one of the fastest
growing, accounting for more than one-third of the total global services trade. The ILO
Forum addressed the high intensity of labour within the industry, making it a significant
source of employment and placing it among the world„s top creators of jobs that require
varying degrees of skills and allow for quick entry into the workforce by youth, women and
migrant workers.
According to an ILO report1 prepared for the Forum, international tourism was
affected by the global economic and social crisis but is projected to grow significantly over
the coming decade. The United Nations World Tourism Organization (UNWTO) is
expecting the sector„s global economy to provide 296 million jobs by 2019.
The tourism sector suffered a decline beginning in the second half of 2008 and
intensifying in 2009 after several consecutive years of growth. A sharp reduction in tourist
flows, length of stay and spending, as well as increased restrictions on business travel
expenses, led to a significant contraction of economic activity in the sector worldwide.
Among the most affected during the crisis were international tourist arrivals,
decreasing by 4 per cent in 2009, while international tourism revenues were projected to go
down 6 per cent by the end of 2009. The regions hit hardest by the decline in worldwide
international tourism were the Middle East (–4.9 per cent), Europe (–5.7 per cent), and the
Americas (–4.6 per cent). Only Africa showed constant growth (+2.9 per cent), based on a
comparatively low travel volume.
Despite the crisis, global employment in the tourism industry increased by about 1 per
cent between 2008 and 2009, the report says. But there were significant regional differences
with respect to the impact of the crisis on employment in hotels and restaurants. While the

20
Americas suffered a 1.7 per cent decrease in employment, employment in Asia and the
Pacific region remained resilient, gaining 4.6 per cent.
Tourism has emerged as one of the largest industries both in terms of gross domestic
product (GDP) and employment in the world today (ESCAP 1999; WTTC 2004b). In 2006
tourism GDP is likely to account for about 10 per cent of world GDP (WTTC 2006). India
also has a large unexploited potential for foreign tourism (GOI 2001). Foreign tourism has
been steadily increasing in India. In terms of number of tourist arrivals to the country in the
last decade and a half, the number of tourists of foreign nationality visiting India increased
from about 16.8 lakhs in 1991 to about 33.7 lakhs in 2004 . Thus, the average annual growth
rate of tourism in terms of foreign tourist arrivals was about 5.1 per cent in this period.
The importance of tourism as a source of foreign exchange for India cannot be
ignored. The total foreign exchange earnings from tourism increased from about USD 1861
million in 1991 to about USD 4810 million in 2004 . Thus, tourism receipts recorded an
average annual growth rate of about 7.02 per cent between 1991 and 2004. In 2004, it
accounted for about 12.1 per cent of total services exports from India. Its share in total
exports (of goods and services) in the same year was 4.2 per cent.
2. 02 Nature of Tourism Employment
Several studies have examined the contribution of tourism to employment within
specific destinations. Many cases including Bali (Cukier & Wall, 1993), Gambia (Farver,
1984), Hawaii (Choy, 1995), the UK (Hughes, 1982), the Seychelles (Archer & Fletcher,
1996), to mention but a few, have been documented. A large number of these investigations
have examined the effect of tourism on employment at a macro or national level, and very
few have focused on very specific micro levels. Analysing the conditions of tourism
employment at a micro level, particularly in developing countries, may be useful in the
understanding and explaining the diverse dimensions of employment in the context of

21
tourism. Consequently, it may also help to explain the various, diverse and complex
relationships between tourism and employment at regional and national levels. General
observations about the “inherent” characteristics of tourism employment .To Wall and
Mathieson (2006), be summarised as follows:
1. Employment and income effect are closely but not perfectly related,
2. The effects of tourism employment vary by tourist activity; some tourism activities
are more labour-intensive than others.
3. Many jobs are self employed, particularly in destinations where tourism enterprises
are small,
4. Tourism employment is characterised by being low-wage occupations, parttime and
casual,
5. Tourism employment commonly requires low skill levels and low entry requirements.
Where specific skills are required, particularly in poorly developed areas, the industry
often turns to outside expertise rather than provide training for local people (Cohen,
1984; Murphy, 1981),
6. Tourism employment is strongly seasonal,
7. The effects of tourism employment are frequently not visible and hence not
recognised; tourism may take people from other sectors of the economy and go
beyond a narrowly defined destination area, and,
8. Tourism employment is structured by gender; the majority of jobs in most tourism
tasks are held by women, particular the low-paid, part-time and seasonal positions. It
has been estimated that over 70% of tourism employees are women (Marshall, 2001).
However, determining the distinguishing characteristics of tourism employment at a
global basis cannot, or should not, be an easy task. This is especially true when considering
that the views of what tourism employment is like are various and sometimes opposing;

22
“The image of tourism as a generator primarily of low-wage and low-skill
employment is a misleading one, and underestimates tourism’s impact on overall wages and
salaries. In fact, many of the jobs at the technical, managerial, and professional levels
require education and training which command compensation commensurate with these
qualifications” (UNWTO, 1997, p. 213-214).
While the characteristics of a large number of tourism positions may concur with
commonly held beliefs (see also Choy, 1995), they may also differ significantly from each
other. The attributes of many, if not all, social phenomena (including employment) are rarely
determined by only one factor. The characteristics and qualities of tourism employment are
not to be defined exclusively by the alleged „nature‟ of tourism, but also by the macro and
specific micro economic, political and socio-cultural conditions in the destination
community. Issues such as the economic development of the region, the type of tourism
activity, and the existence of employment alternatives will be important factors in defining
the attributes of tourism employment in each location, particularly in developing world
destinations. As Mitchell and Ashley (2010, p. 39) argue, “There is little consensus about the
quality of tourism employment and wages of the poor. Much depends on the specific country,
its labour market and tourism seasonality, and on whether the comparison is with desired
norms, other sectors, or other countries”; in summary, the specific conditions of the
destination area will play an important role in defining at a micro level the characteristics of
employment of any type of tourism.
A large number of studies on tourism employment have been undertaken on the basis
of quantitative methods (Brown & Connelly, 1986). Quantitative approaches seem to be more
reliable and more valuable for policy design and the intervention of governments due to the
potential for representativeness. However, qualitative approaches offer a valuable alternative
in examining the characteristics of tourism employment from the perspective of informants.

23
Through the eyes of informants, the actual attributes of employment in ecotourism can be not
only listed and described, but also explained and illustrated in depth through the experiences
of those involved in ecotourism jobs. Bearing this in mind, a qualitative approach was
adopted for the aim of this study. In particular, in-depth interviews, participant observation
and a large number of informal conversations with employees in the park were used as
research techniques for the collection of data. For the interviewing process, a series of
guiding questions were designed to explore the specific properties of employment in the park.
Based primarily on existing literature, questions about seasonality, level of skills, wages,
training, to mention some, were incorporated in the instrument. At the same time, visitations
to the park permitted to observe certain characteristics that had not been sufficiently cited in
the literature; these included issues such as staff turnover, contracts, recruitment procedure
and child labour, and were therefore incorporated in the instrument.
A study conducted in Great Britain to predict the employment potential in tourism
sector, a good number of employment categories are used as a proxy to predict the
employment potential in tourism sector. This employment estimate is then used to calculate
the amount of tourism revenue required to generate each job i.e. „revenue per job‟. The
revenue per job can be estimated by dividing the total tourism expenditure by the total
number of tourism related jobs estimated from the statistics provided by the tourism
department and Government.
In order to determine accurate tourism employment data a micro economic approach
is developed to calculate the tourism related employment and tourism revenue required to
create each job. The key sectors of tourism employment namely Accommodation,
Restaurants and Attractions accounts for 60 percent of tourism expenditure. This sectoral
wise analysis can provide micro level data to provide accurate estimate of tourism
employment

24
In order to make an in-depth analysis of the secondary data, the researcher identified
certain facts and features about the research topic which were specifically listed here under
different heads for a comprehensive analysis and understanding.
2. 03 TOURISM
1. Tourism includes all activities and interplay that happens in period of tourist journey.
It can contain tour planning, reaching to destination, staying, returning and many
activities like that (Mansourifar, 2010)
2. Leiper (1995) said that destinations are places where people travel to and where they
stay for awhile in order to have certain travel experiences, depending on the
destinations‟ attractions. Hu and Ritchie (1993) also stated that a “tourism destination
reflects the feelings, beliefs, and opinions that an individual has about a destinations‟
perceived ability to provide satisfaction in relation to his or her special vacation needs
(p.25).”
3. New Tourism is characterised mainly by supersegmentation of demand, the need for
flexibility of supply and distribution, and achieving profitability through diagonal
integration and subsequent system economies and integrated values, instead of
economies of scale (Fayos-Solá, 1996)
4. This new tourism phenomenon is not only influenced by economic factors but also by
new cultures and a new generation of tourists. In tourism, the different destinations
compete worldwide through globalisation (Saayman, 1998).
5. The more we integrate the world, the more we‟ll want to differentiate our experiences.
The more global exposure we get, the more desire to experience them firsthand
(Anon, 1998).
6. Tourism is currently the fastest growing industry in South Africa, the largest industry
in the world and also the biggest employer. Globalisation has brought about economic

25
changes in general, but also particular changes in the tourism industry. The focus of
the tourism industry has shifted from air travel, overnights, meals and so on to total
experiences or fantasy worlds associated with specific destinations (Keller and Koch,
1995).
7. Tourism strategies are looking for enabling urban, especially rural producers to
reduce reliance on agriculture, and engage in new economic opportunities that are
competitive in the more globalized markets, which now reach their doorstep (Holland,
Burian and Dixey, 2003)
8. It is also defined as “the ability of a country to create added value and thus increases
national wealth by managing assets and processes, attractiveness, and aggressiveness,
and proximity, and by integrating these relationship into an economic and social
model” (Ritchie & Crouch, 2000, p. 306).
9. A recent study by Buhalis (2000) lists six major components of tourism attractions
and resources (p.98) that most of the tourism literature commonly includes in
assessing and evaluating the elements of tourism destinations.
These components are as follows:
Attractions -natural, man-made, artificial, purpose-built, heritage, special events
Accessibility – entire transportation system comprised of routes, terminals and
vehicles
Amenities – accommodations, catering facilities, retailing, other tourist services
Available packages – prearranged packages by intermediaries and principals
Activities – all activities available at the destination and what consumers will do
during their visit
Ancillary services – services used by tourists such as banks, telecommunications,
newsagents, hospitals.

26
2. 04 ENTREPRENEURSHIP DEVELOPMENT IN TOURISM
10. Tourism entrepreneurship is defined as activities related to creating and operating a legal
tourist's enterprise. Legal enterprises refer to those businesses that operate on a profitable
basis and seek to satisfy the needs of tourists (Saayman & Saayman, 1998).
11. Entrepreneurship and innovation are critical factors in tourism and are both central to the
continued success and development of the industry, both globally and regionally(Parra
Lopéz, Buhalis&Fyall, 2009).
12. Tourism entrepreneurship is defined by Koh (1996:30) and Saayman and Saayman (1997)
as activities related to creating and operating a legal tourists enterprise. Legal enterprises
refer to those businesses that operate on a profitable basis and seek to satisfy the needs of
tourists and visitors. These enterprises include, among others, hotels, guest houses, travel
agencies and tour operators. This means that persons who hawk goods or services, such
as arts and crafts, to tourists are also tourism entrepreneurs, but are more often referred
to as street vendors
13. Alonso-Almedia (2012) claimed that tourism entrepreneurship is a good opportunity for
women coming from culturally and socially constrained societies because it is seen as an
extension of their domestic work and as a result, appropriate for the women. Thus, we
can see there is a tension surrounding issues of perspectives and socio-cultural
benchmarks and that it is the Muslim women‟s perspective that needs to be considered
14. Entrepreneurial individuals also channel and transform their entrepreneurial ambitions
and qualities into actions. So, an organizational extension of individual entrepreneurial
actions and a behavioural manifestation of entrepreneurship could be identified in small
firms (Wennekers and Thurik 1999).

27
15. Tourism entrepreneurship is controlled by entrepreneurs who wish to extract a certain
social lifestyle, and economic incentives play a secondary role (Skokic & Morrison,
2010).
16. Schumpeter (1934) argued that the entrepreneur is an innovator, i.e. a person that brings
about change by means of new processes and/or products.
17. Accordingly, competitiveness has been viewed as “producing more and better quality
goods and services that are marketed successfully to consumers” (Newall, 1992, p. 94).
18. Sundbo (2009:438) argues that “innovation requires entrepreneurship through which
somebody struggles to realize the idea as a business idea”.
19. Gupta (2004) define entrepreneurial leadership as “leadership that creates visionary
scenarios used to assemble and mobilize a „supporting cast‟ of participants who become
committed by the vision to the discovery and exploitation of strategic value creation”.
20. New small tourism businesses contribute to the flourishing of entrepreneurship as
important catalysts or actors in technological innovations; as agents of change in market
structure and competition environment and as critical forces in industrial restructuring
and national competitive advantage upgrading (Hart 2003, Porter 1990).
21. The World Travel and Tourism Council (WTTC) estimates employment generated by
Travel and Tourism Industry and Travel and Tourism Economy for various countries
using the Tourism Satellite Accounts (TSA) methodology that is based on input‐output.
22. In India, a recent study has attempted to estimate total employment and output generated
by the tourism sector using the TSA methodology (NCAER 2006).
23. Shaw & Williams (1998) identified both ‟non-entrepreneurs‟ (i.e. (semi)retired in-
migrants to the destination) and ‟constrained entrepreneurs‟ (i.e. younger entrepreneurs
constrained by minimum business skills and shortage of capital).

28
24. Wickham‟s (2004) claim that size of a business is a poor guide as to whether it is
entrepreneurial or not and henceforth, that SMTEs are not – per se – entrepreneurial.
This means that we have to be extremely careful before we label small enterprises
„entrepreneurial‟ and that we can only expand the pool of knowledge on innovation and
entrepreneurship in tourism if we focus on those enterprises that are, in fact,
entrepreneurial and not on all small tourism businesses
25. Hjalager (2009:12) argues that, within tourism, “many entrepreneurs fail, and turbulence
challenges both long-term consolidations and improvements based on experience of
business models”.
2. 05 DESTINATION DEVELOPMENT IN TOURISM
26. Tourism has commonly been regarded as a mechanism for improving the livelihoods of
local people in destinations. Particularly the potential of tourism for the generation of
employment and income for locals has been one of the main reasons for the adoption of
tourism. Tourism may also be useful for other purposes such as reducing out migration;
in the case of some countries, for example, tourism has been adopted to provide more
rural employment with special emphasis on the needs of the young population who form
the bulk of out-migrants (Murphy, 1985).
27. One of the goals of tourism planning and development is to create more valuable tourism
products and services for potential or current tourists so that destinations and their
communities receive social and economic benefits. However, it has been suggested that
there is a need for a clearer understanding of the ability of the tourism destination to
compete effectively in an increasingly saturated market (Evans, Fox, & Johnson, 1995;
Ritchie, Crouch, & Hudson, 2000).

29
28. Competitiveness in the tourism literature has been considered as a “destination‟s ability to
create and integrate value-added products that sustain its resources while maintaining
market position relative to competitors” (Hassan, 2000).
29. The destination attractions/resources such as natural/cultural components, heritage/
historical resources, supporting facilities/services, infrastructure, hospitalities,
sports/recreation activities, transportation/accessibility, and cost, should be considered as
not only basic to understanding tourism planning, but also essential for successful
tourism development (Gunn, 1994; Pearce, 1997).
30. Furthermore, maintaining and developing the quality of these tourism resources is
important to the competitiveness of most types of tourism destinations (Inkeep, 1991; Go
& Govers, 2000).
31. Bansal S.P.and Prasant Gautam stated that tourism has, today, emerged as one of the fast
growing industries in the World and shows its importance in developing social and
cultural linkages at the national and international level. On account of its multifarious
and far-reaching benefits in terms of employment generation, foreign exchange earnings,
improvement in living standard, modernization of infrastructure and contribution
towards protection, preservation and conservation of our natural and cultural heritage,
obviously becomes vitally significant for the developing economies as an agent to the
holistic development.
32. Vinay chauhan and Savidha Khanna (2007) stated that adequate tourism infrastructure is
necessary for the growth and development of tourism industry. Tourism infrastructure
includes accommodation, transportation, communication, drinking water, and civic
amenities such as parking, health, sanitation, power, toilets, parks, amusement and
entertainment facilities.

30
33. Anurag Fadia (2009) in his study “International trends in nature based tourism” observed
that nature tourism has grown as a consequences of the dissatisfaction with conventional
forms of tourism which have, in a general sense, ignored social and ecological elements
of foreign regions in favour of a more anthropocentric and strictly profit centered
approach to the delivery of tourism products. He concluded that ecotourism has
blossomed into a rich array programmes and opportunities in the public, private and not
for profit sectors. Good coordination must exist between these stake holders such that the
appropriate values (economic and emotional) are attached to the ecotourism experience.
34. It is necessary to consider the tourism business networks collectively, for a more
complete picture in terms of destination development. Individual networks are still
considered but from the tourism business epicentre. It is necessary to choose an epicentre
to create perspective, angle and focus to the research. From a tourism perspective, the
activities of small businesses within such tourism destinations are of research interest in
terms of their contributions towards sustainable economic and community development
of the destination (Tinsley and Lynch, 2001
35. Morrison (2004) establish the core of a network as inter organisational learning and
knowledge exchange, with a sense of community and purpose-giving cohesion. A core
element of these communities is that they have been historically shaped by different
socio-political and economic interactions amongst actors in a bid to sustain the
competitive advantage of the destination.
36. Lynch and Morrison (2007) emphasise social network analysis to understand the impact
on destination development of interfirm interaction among community-embedded small
tourism organisations.
37. Lashley (2000, p. 12) argues that because commercial hospitality provision depends on
monetary transactions, “both host and guest enter the hospitality occasion with a reduced

31
sense of reciprocity and mutual obligation” and “the exchange of money absolves the
guest of mutual obligation and loyalty”.
2. 06 EMPLOYMENT GENERATION IN TOURISM
38. The importance of tourism in the generation of employment has been evidenced
worldwide. In the case of countries such as Hawaii, for instance, direct employment in
the tourism industry has accounted for 24% of total civilian employment (Choy, 1995)
39. According to the World Tourism Organisation (UNWTO, 2012), the current contribution
of tourism to employment is estimated in the order of 6-7% of the overall number of
both direct and indirect jobs worldwide, meaning over 260 million jobs in the travel and
tourism and related sectors.
40. The role and contribution of tourism to employment that it may arguably be described as
the world‟s largest source of employment in the world (Sharpley & Telfer, 2002), in both
developed and developing countries.
41. The World Travel and Tourism Council (WTTC) estimates employment generated by
Travel and Tourism Industry and Travel and Tourism Economy for various countries
using the Tourism Satellite Accounts (TSA) methodology that is based on input‐output
42. The significance of tourism employment seems to be a generalisation, it is very difficult,
if not impossible, to determine accurately the size of tourism-related employment. This
is due to the difficulty in defining the boundaries of tourism, the lack of official and
reliable statistics, and a tendency to focus on only occupations directly involved in
dealing with tourists.
According to Wall and Mathieson (2006), tourism employment characteristics can be
summarised as follows:
Employment and income effect are closely but not perfectly related,

32
The effects of tourism employment vary by tourist activity; some tourism activities
are more labour-intensive than others,
Many jobs are self employed, particularly in destinations where tourism enterprises
are small,
Tourism employment is characterised by being low-wage occupations, part time and
casual, (Wall & Mathieson, 2006)
43. In the global economy small businesses are playing a critical role in reducing
unemployment, penetrating new markets and generally growing national economies. It
follows that small businesses represent an important vehicle for addressing the challenges
of job creation, economic development and social development. Tourism is an under-
exploited sector with considerable potential for expansion, particularly given the high
labour absorption capacity of small businesses (Bengtsson, M., Boter, H., Vanyushyn, V.,
2003).
44. Levitt‟s (1960) argument that there is no such thing as a growth industry (but only
companies organized and operated to create and capitalize on growth opportunities) as the
innovativeness of the case company seems to relate far more to the owners‟ quest to
identify and responsiveness towards growth opportunities than to the industrial context.
As a token of this, the case company has actually experienced high growth rates in
periods, during which the industry as such has experienced stagnation.
45. Lynch and Morrison (2007) define networks as “social structures that enable the operators
of small firms to build the level of trust necessary for them to share in the development of
the local tourism product”.

33
END NOTES
1. MANSOURIFAR, Mohammad(2010). Investigate Tourism Industry Development
Barriers in MAZANDARAN. MAZANDARAN, SARI: SHELPHIN Press, 2010,
978-600-100-103-1.
2. . Hu, Y., & Ritchie, J. R. B. (1993). Measuring destination attractiveness: A
contextual approach. Journal of Travel Research, 32(2), 25-34.
3. FAYOS-SOLá, E. 1996. Tourism Policy: a midsummer night‟s dream? Tourism
Management. 17:6, pp 405-412. Britain: Elsiever Science Ltd.
4. SAAYMAN, M. 1998. The impact of globalisation on tourism in Africa. Paper
presented at the World Leisure and Recreation Conference. Sao Paulo, Brazil. 26-30
October 1998.
5. ANON. 1998. A Gallery of how the world works. http:// studsys.
mscs.mu.edu/~cheung /Page. dir/pg.metaworld1.html
6. KELLER, P. and KOCH, K. 1995. Die globalisierung des toursimus. Eine
Herausforderung für die schweiz als traditionelles tourismusland. Die Volkswirtschaft
(68):5.
7. Holland, Jenny; Burian, Michael; Dixey, Louise (2003). Tourism in Poor Rural Areas:
Diversifying the product and expanding the benefits in rural Uganda and the Czech
Republic. Economic and Social Research Unit (ESCOR) of the UK Department for
International Development (DFID).
8. . Ritchie, J. R. B.,& Crouch, G. I. (2000). Are destination stars born or made: Must a
competitive destination have star genes? In 2000 TTRA Annual Conference
Proceedings (pp. 306- 315).

34
9. Buhalis, D. (2000). Marketing the competitive destination of the future. Tourism
Management, 21, 97-116.
10. Saayman, M &Saayman, A. 1998. Tourism and the South African Economy: Growing
Opportunities for Entrepreneurs. African Journal for Health, Physical Education,
Recreation and Dance.Vol5:1.
11. Parra Lopéz, Eduardo; Buhalis, Dimitrios; Fyall, Alan (2009).Entrepreneurship and
Innovation in Tourism.PASOS.Revista de Turismo y Patrimonio Cultural.ISSN 1695-
7121.
12. SAAYMAN, A. & SAAYMAN, M. Tourism and the South African economy:
growing opportunities for entrepreneurs. 10th annual SAESBA conference, Victoria
Falls, Zimbabwe. 27-29 April 1997.
13. Alonso-Almedia, M. D., 2012. Water and waste management in the Moroccan
tourism industry: The case of three women entrepreneurs. Women Studies
International Forum, 35, pp. 343-353.
14. Wennekers, S. and Thurik, R., 1999. Linking entrepreneurship and economic growth.
Small business economics, 13 (1), 27_55.
15. Skokic, Vlatka& Morrison, Alison (2010). Tourism and hospitality entrepreneurship,
social setting and research methodology: movinginto the beyond. Guildford:
University of Surrey, School of Management
16. . Schumpeter, Joseph 1934 The Theory of Economic Development. Oxford: Oxford
University Press
17. Newall, J. E. (1992). The challenge of competitiveness. Business Quarterly, 56, 94-
100.
18. Sundbo, Jon 2009“Innovation in the Experience Economy: A Taxonomy of
Innovation Organizations”. The Service Industries Journal, 29(4): 431-455

35
19. Gupta, V., MacMillan, I.C. & Surie, G. 2004. “Entrepreneurial leadership:
Developing and measuring a cross-cultural construct”, Journal of Business Venturing,
19: 241-260
20. Hart, C., Doherty, N. & Ellis-Chadwick, F. 2000. “Retailer adoption of the Internet -
Implications for retail marketing”, European Journal of Marketing.
21. WTTC (2006) Progress and Priorities 2006/07, Annual Report, The World Travel &
Tourism Council, London.. NCAER (2006) Tourism Satellite Account for India,
National Council for Applied Economic Research, New Delhi
22. . NCAER (2006) Tourism Satellite Account for India, National Council for Applied
EconomicResearch, New Delhi
23. . Shaw, Gareth & Williams, Allan M. 1998 “Entrepreneurship, Small Business
Culture and Tourism Development”. In Ioannides, Dimitri & Debbage, Keith (Eds):
Economic Geography of the Tourist Industry: A Supply Side Analysis (235-255).
London: Routhledge
24. Wickham, Philip A. 2004 Strategic Entrepreneurship. 3rd Edition. Essex: Pearson
Yin, Robert K.
25. Hjalager, Anne-Mette ( 2009) “A Review of Innovation Research in Tourism”.
Forthcoming in Tourism Management
26. Murphy, P. E. (1985), Tourism: A community approach. NewYork: Methuen.
27. . Evans, M. R., Fox, J. B., & Johnson, R. B. (1995). Identifying competitive strategies
for successful tourism destination development. Journal of Hospitality and Leisure
Marketing, 3(1), 37-45.
28. Hassan, S. S. (2000). Determinants of market competitiveness in an environmentally
sustainable tourism industry. Journal of Travel Research, 38 (February), 239-245.

36
29. . Gunn, C. A. (1994). Tourism Planning (3rd ed.). New York: Taylor and Francis.,
Pearce, D. (1997). Competitive destination analysis in South east Asia. Journal of
Travel Research, 35 (4), 16-24.
30. Inkeep, E. (1991). Tourism planning: An integrated and sustainable development
approach. New York: Van Nostrand Reinhold., Go, F. M., & Govers, R. (2000).
Integrated quality management for tourist destinations: A European perspective on
achieving competitiveness. Tourism Management, 21, 79-88.
31. Bansal.S.P., Prashant Gautam Sonia, Sushama & Chander Mohan, (2007), (Eds),
Cutting Edge Research in Tourism New Directions, Abhishek Publications,
Chandigarh, pp.3-5.
32. Vinay chauhan and Savidha Khanna, (2007), “Tourism Infrastructure Vis-à-vis
Tourist satisfaction- A Case of Jammu and Kashmir”, In Bansal.S.P, Prashant
Gautam Sonia and Others, (Eds), Cutting Edge Research in Tourism New Directions,
Abhishek Publications, Chandigarh, p 456.
33. Anurag Fadia, (2009), International Trends in Nature Based Tourism, Cyber Tech
Publications, New Delhi, pp.3,4 & 254.
34. Tinsley , R . and Lynch , P . (2001) “Small Tourism Business Networks and
Destination Development”, International Journal of Hospitality Management , 20 , 4 ,
11 – 14 .
35. Morrison , A . , Lynch , P . and Johns , N . (2004) „ International Tourism Networks ‟
, International Journal of Contemporary Hospitality Management,16, 3, 198 – 204 .
36. . Lynch , P . and Morrison , A . (2007) “The Role of Networks”, in Michael, E. (ed.),
“Micro-Clusters and Networks: The growth of tourism”, Elsevier, London .
37. Lashley, Conrad 2000 “In Search of Hospitality: Towards a Theoretical Framework”.
Hospitality Management, 19: 3-15

37
38. Choy, D. (1995), The quality of tourism employment, in Tourism Management, vol.
16, no. 2, p. 129-137.
39. UNWTO (2012), UNWTO Tourism Highlights. Madrid: UNWTO
40. Sharpley, R., & Telfer, D. (2002). Tourism and development. Clevedon: Channel
View Publications.
41. WTTC (2006) Progress and Priorities 2006/07, Annual Report, The World Travel &
Tourism Council, London.
42. Wall, G., & Mathieson, A. (2006), Tourism: Change, impacts and opportunities.
Essex: Pearson Prentice Hall
43. . Bengtsson, M., Boter, H. & Vanyushyn, V. 2003. “The challenge of building
marketing channels via the Internet”. International Council for Small Business (ICSB)
2003 conference, 15-18th June 2003. Belfast, Northern Ireland.
44. Levitt, Theodor (1969) “Marketing Myopia”. Harvard Business Review, july/august:
3-13
45. Lynch , P . and Morrison , A . (2007) “The Role of Networks”, in Michael, E. (ed.),
“Micro-Clusters and Networks: The growth of tourism”, Elsevier, London .

38
CHAPTER III
TOURISM EMPLOYMENT –AN OVERVIEW
3.00 Introduction
Tourism is a labour intensive industry where service sector dominates. It is
looked upon as a major source of income to the regions which have limited potentials
for other economic activities or where other resources are limited. It employs large
number of people and provides wide range of jobs from the unskilled to highly
specialise. There is a close but not perfect co-relation between income generating
effects of tourism and the creation of employment, i.e; high returns do not correspond
directly into proportionately more jobs.
There is more demand for unskilled local labourers, whose total income will be
less than the income of the few expertise officials. Tourism actually offers part time
seasonal employment to many. The real value to the nations from tourism oriented
jobs is equivalent to any other labour intensive textile or other industry. To some
extent tourism sector is able to provide jobs according to the qualifications of the job
seekers.
3.01 Tourism Industry in Kerala – A preview
The growth rate of tourist arrivals in Kerala is more than six times compared to
the growth rate of World tourist arrival in 2010. The foreign tourist arrival in Kerala in
the year 2010 is 6,59,265 which is 11 per cent of the total foreign tourist arrival of
India and domestic tourist arrival is 85, 95,075. The total earnings from tourism in the
year 2010 are Rs 17348 crores which is 31 per cent more, compared to the previous year
2009 and foreign exchange earnings from tourism are Rs. 3797 crores. However, the
foreign tourist arrival in Kerala in the year 2011 is 7.3 lakhs and domestic tourist arrival

39
is 93 lakhs. The total earnings from tourism in the year 2011 are Rs 19037 crores which
is 9.7 per cent more, compared to the previous year 2010 and foreign exchange earnings
from tourism are Rs. 4221 crores.
Kerala tourism has been gaining global attention in recent years. It is mainly due
to natural beauty of the State. Tourism can be promoted only if a country is blessed with
natural environment. A country’s tourism possibilities are like those of a young woman
competing in a beauty contest. If they have not inherited the right characteristics, are not
born with the right degree of natural beauty their chances of success are limited.
Kerala’s geographical diversity and ecological features are promising for tourism
development. No tourist can experience anywhere in the World, except Kerala such a
geographical diversity within a small piece of land. Every inch of the land of the State is
suitable for tourism development. The distance between destination to destination is
also negligible.
Table 3.01 Month Wise Arrival of Foreign and Domestic Tourists -
The State of Kerala 2013
Sl. No. Month Foreign Domestic
1 January 113627 913203
2 February 115403 771880
3 March 85953 779086
4 April 66371 813247
5 May 32600 986407
6 June 29758 744703
7 July 45786 724122
8 August 64518 842995
9 September 51032 892413
10 October 67702 1115718
11 November 83484 1072124
12 December 101909 1201913
TOTAL 858143 10857811

40
Source: Kerala Tourism Statistics Tourism Dept: Govt. Of Kerala The month wise tourist arrivals as given in Table 3.01 reveals that the highest
number of domestic tourist arrivals to the state (1,20,19,13) was in the month of
December and foreign tourist arrival (1,15,403) was in the month of February 2013.
Table 3.02 EARNINGS FROM TOURISM (2001-2013)
Year
Foreign Total revenue generated
Exchange Percentage from Tourism Percentage
Earnings of Increase (Direct & Indirect) of Increase
(Rs. In Crores) Rs. In Crores 2001 535.00 1.85 4500.00 9.58
2002 705.67 31.90 4931.00 20.42
2003 983.37 39.35 5938.00 12.83
2004 1266.77 28.82 6829.00 15.01
2005 1552.31 22.54 7738.00 13.31
2006 1988.40 28.09 9126.00 17.94
2007 2640.94 32.82 11433.00 25.28
2008 3066.52 16.11 13130.00 14.84
2009 2853.16 -6.96 13231.00 0.77
2010 3797.37 33.09 17348.00 31.12
2011 4221.99 11.18 19037.00 9.74
2012 4571.69 8.28 20430.00 7.32
2013 5560.77 21.63 22926.55 12.22 Source: Kerala Tourism Statistics Tourism Dept: Govt. Of Kerala
Table 3.02 reveals the following facts.
Foreign exchange earning for the year 2013 is Rs: 5560.77 Crores which

41
recorded an increase of 21.63 % over the previous year.
Total Revenue (including direct & indirect) from Tourism during 2013 is
Rs: 22,926.55 Crores, showing an increase of 12.22% over the last year’s
figure.
Table 3.03 TRENDS IN DOMESTIC &FOREIGN TOURIST ARRIVALS INTO
KERALA(1999-2013) YEAR DOMESTIC
TOURISTS
% VAR. FOREIGN
TOURISTS
% VAR.
1999 48,88,287 9.07 2,02,173 6.44
2000 50,13,221 2.56 2,09,933 3.84
2001 52,39,692 4.52 2,08,830 -0.53
2002 55,68,256 6.3 2,32,564 11.3
2003 58,71,228 5.4 2,94,621 26.7
2004 59,72,182 1.7 3,45,546 17.3
2005 59,46,423 -4.3 3,46,499 0.27
2006 62,71,724 5.47 4,28,534 23.7
2007 66,42,941 5.92 5,15,808 20.37
2008 75,91,250 14.28 5,98,929 16.11
2009 79,13,537 4.25 5,57,258 -6.96
2010 85,95,075 8.61 6,59,265 18.31
2011 93,81,455 9.15 7,32,985 11.18
2012 100,76,854 7.41 7,93,696 8.28
2013 108,57,811 7.75 8,58,143 8.12
Source: Kerala Tourism Statistics Tourism Dept: Govt. Of Kerala
Table 3.03 reveals the following facts.

42
Foreign Tourist arrival to Kerala during the year 2013 is 8, 58,143 It shows an
increase of 8.12 % over the previous year’s figure of 7, 93,696.
Domestic Tourist arrival to Kerala during the year 2013 is 108, 57,811. It
shows an increase of 7.75 % over the previous year’s figure 100, 76,854.
When we observe the present situation in the developing world, where there is a
large population with low surplus money for further investment, certainly tourism
seems to be a solution. For instance in India where tourism provides direct job to
about 15 lakhs people and indirect jobs 45 lakhs with variety of jobs from sweeper
and washman to managers, travel agents and translators. One can say that, in India,
tourism will be able to lessen the burden of unemployment, underemployment and
disguised employment.
Tourism generates three types of employment.
1) Direct employment in the hospitality sector such as hotels, resorts,
restaurants, transportation, etc. in the form of front officers, accountants,
housekeepers, waiters, catering staff like cooks, etc.
2) Indirect employment generated on account of consumption of local goods
and services (handicrafts) by tourists give opportunity to street guides,
local transporters, banks, etc.
3) Induced employment generated to meet the specific requirements of
tourists such as porters, chambermaids, gardeners, hawkers, coolies,
brokers, artists, performers, musicians, etc.
3.02 Direct Employment
Accommodation
Hotels are one of the largest sources of employment in tourism. Tourists need

43
accommodation at the place of destinations when they are far away from their
homes. It provides boarding and lodging facilities to the tourists. Hotels and
restaurants provide millions of job directly as front office staff, receptionists,
managers, cooks, waiters, suppliers, laundries, room boys, etc and thousands
indirectly as accountants, clerks, consultants, etc. It requires skilled and unskilled
employees in different areas of operation. Trained manpower is an essential for the
smooth functioning of hotel industry.
Now a day the character of tourist accommodation has changed according to the
demands of customers. Hotels provide accommodation, meals and refreshment for
irregular periods of time. Boarding homes, guest houses and pensions are smaller
units offering services to the residents for regular and longer time. Hotel grains and
apart hotels give bed and breakfast without meals. Camping and Caravan sites are
another form of hotel industry equipped with sanitary services. There are self catering
family units with homely atmosphere to the tourists.
Long Distance Transportation
Tourism cannot be separated from travel. The modes of transport can play
important role in the development of tourism market. Transportation includes surface
transport, waterways and airways. Surface transport consists of road and rail
transport. There are private vehicles and govt. vehicles which provide transportation
facilities to the tourists. It generates employment opportunities in the form drivers,
ticket examiners and helpers. Rail transport is more suitable for long distance and it is
more comfortable. The rail transport creates large number of employment in the form
of station masters, managers, ticket checkers, reservation counter staff, accountants,
technicians, engineers, porters, railway police, catering personnel, plat form sellers,
etc. Airways are the transport used by international tourists. It also provide jobs to

44
many like pilots, air hosts, helpers in the port, shoppers in the air port, customs
officials and assistances, etc. Waterways are not much used by the tourists for long
distances. It mainly helps the tourists in site seeing, boating, etc. It also provides
employment opportunities in the form of engine drivers, helpers, etc.
3.03 Indirect Employment
Street Guides or Touts
Consider the case of a tourist who has not come on a package tour who
disembarks at his destination and is on the lookout of accommodation. Here the street
guides can help him who is not familiar with the locality. It provides employment to
many who have good communication skill and knowledge about the destinations. The
touts know the local language and customs of the destination. The guides offer their
services to the tourists for some earnings. The touts are not professionally qualified.
Language of the tourist is the main problem faced by the street guides.
Life guards
The life guards provide their services in the beach areas. It is another area of
service which provides employments to many people in the beach. They are expert in
swimming and they are ready to take steps when tourists fall in the sea. They provide
services with high risk as their lives are on dangerous stage. They get a very small
amount of wages as provided by the tourists. There is no special rule for the
remuneration of life guards.
Link Transport Needs
Local transport is important for the movement of tourists at the destination
and nearby attractions. The demand first emerges from point where tourists leave
from the main transport, i.e, railway station, air port and bus stand. The local
transport includes taxies, autorikshas, buses, etc. Many numbers of people get

45
employment in this way. The taxi drivers must know the city well, should be polite,
have correct meters, etc. Some luxury hotels operate their transport services to the
nearby destinations.
Tourist Police
This is a new idea to develop tourism. Here the police help the tourists by
guiding them and answering the queries. The nature of work does not include crime
detection and traffic control. He also takes the security needs with special training in
hospitality and communication. It generates a new area of employment opportunities.
Book Shops and Libraries
Another service related with tourism is book shops and libraries. It can provide
employment opportunities to people in the locality. A book stall started in the
destination can provide services to the tourists by making available destination related
publications. The personnel engaged in this area require good knowledge about
different types of books and magazines available in the market.
Travel Agencies and Tour Operators
Travel agency is another form of services which provide employment
opportunities related with tourism. It is their responsibility to organize travel services
for the needy people. The travel agents act as a link between the tourists and suppliers
of various services needed to the tourists. They use the services of receptionists,
drivers, collection agents, etc. They offer business to the suppliers of services while
serving the tourists. It requires the service of specialized persons in the field of air
ticketing, marketing, finance, etc.
A tourist needs many services like transportation, accommodation, escort and so
on. The tour operator is a person who provides all these services to the tourists. It also
requires the services of many skilled and qualified persons. Therefore tour operator

46
provides employment opportunities to many like drivers, route officer, cooks, escorts,
guides, etc. It includes planning, coordination with other allied industries like
accommodation, transportation, etc. All these activities require the services of
specialized persons.
Insurance
Some times the travel agencies may offer insurance coverage for the loss or
damage of baggage. Hence it provides employment opportunities to many in the form
of insurance agents and consultants. These persons must have knowledge about
various insurance policies and its advantages and disadvantages.
Eating Joints and Bars
This is another form of service which gives employment to local people. These
range from restaurants and tea stall to dhabas and fast food counters. It requires less
capital investment and can be started as sole proprietorship business. This type of
business does not require any special knowledge and skill. It provides employment
opportunities to the less educated youths.
Informal Services in Tourism
Informal sector services in tourism generate many job opportunities to the
people at the destinations. One of the spheres of activity in the informal sector is
lodging and boarding provided by the families at the destination (Paying guest). Here
a part of their houses are given to the tourists for rent and they will be provided food
at a normal rate which is an alternative source of livelihood. Souvenir sellers in the
market are another form of informal services. It also makes employment chances for
many job seekers in the destination.

47
3.04 Induced Employment
Photography
Some of the tourists need photography of the destination they visit. There is a
chance for the professional photographers. Certain tourists prefer the costumes of the
region also. Here the dresses can be given on a rental basis. It also provides
employment chances to many of the local people. If tourists have their own cameras,
they need film rolls, batteries, etc.
Entertainment and Recreation
Entertainment is an essential component in tourism. Most of the tourists require
some type of entertainment in the evening or night. This includes dance, theatre,
movie, music, etc. It provides employment to local artists and performers. Many
hotels organize musical nights or dance performances during tourist seasons. There is
a wide chance for professionally qualified artists and performers.
Communication
Tourism involves being away from home and work environment. At that time
the tourist needs to communicate with family members and friends. Hence
communication services like post office, public call office, internet café, etc should be
there at the destination or nearby towns. This will provide employment to the local
people.
Special Features of Services in Tourism Industry
The human resource dimension is one of the most important elements of a
sector like tourism, which is characterized by the high level of human involvement in
the development and delivery of services. Highly successful tourism organizations
place considerable emphasis on the engagement, education and empowerment of their
employees at all levels to deliver services that differentiate the organization in the
48
filed. The role of human resources and its effective management in creating quality
has been recognized as one of the most important element in improving the
organizations competitiveness.
The main features of services in tourism industry are explained as follows.
Tourism service includes a significant intangible component
Most of the services are intangible in that the tourists do not receive physical or
tangible in return for their money. They are buying an experience and the evaluation
of this experience may include a strong subjective element as well as aspects that they
can judge objectively. The human contribution to the delivery of both tangible and
intangible aspects of tourism service is core.
Tourism service can not be inventoried
If left unsold, the sales opportunity for a service is lost. A hotel room left unsold
overnight is lost revenue and can not recoup. In other words service cannot be
inventoried or stored like other non perishable products.
Tourism service is time dependent
Tourism services are frequently prepared or produced, served and consumed
almost simultaneously. The human contribution within this process is critical.
Tourism service are place dependent
Many of the tourism services must be offered to the customers where they are
required. Delivery and production cannot take place remotely or in a centralized
location. Hotels must be located where people want to stay and not where it suits the
hotel company.
Tourism service cannot be quality controlled at factory gate
The tourism services are difficult to standardize because they generally require
a high level of human intervention for their delivery. As a result you cannot return or

49
substitute a service which has been unsatisfactory in the way you can seek to
exchange faulty goods. Once your experience of service is concluded, the provider
can seek to compensate you for a bad experience but cannot replace the experience.
A different concept of marketing is required for tourism services
Most of the staffs in tourism industry have the opportunity to work in direct
contact with the customer. This means that the marketing role is the responsibility of
all tourism staff in the organisation.
3.05 Manpower Management in Tourism – The Components
Manpower management is concerned with training of personnel. It means
training of people at all the levels of organization. The success of an enterprise mainly
depends on the performance of trained personnel. As a labour oriented industry,
tourism needs professionally qualified persons. It is the quality of the service that
determines the image of destination.
There is human role in tourism service delivery which creates uncertainty –
Human behaviour, whether staff or customer is unpredictable. Good management and
effective training should minimize this unpredictability among employees in good
organizations
The process of manpower management includes recruitment, selection, training
and development of employees. It motivates the employees to perform their best. The
effective utilization of employee’s skill and capability is possible only if they are
trained properly. The training and development of employees in tourism is very
important because the customers are experiencing and consuming the quality of
service. The persons involved in providing such services should be equipped with
required knowledge and skill. The activities of manpower management in tourism can
be grouped into two.

50
3.06 Manpower Planning
Manpower planning is the process of determining the number and type of employees
required in an enterprise for a specific period in the future. It involves the process of
analyzing the existing employees, estimating the future demand and coordinating the
available resources with future demand. It also includes planning for the development
of employees through training and education.
Process of Manpower Planning
Forecasting the manpower needs
It is concerned with estimating the number and type of employees required by an
organization for a specified future period. This can be estimated by keeping mind the
expected work load.
In tourism industry requirements of employees depends upon the demand for
services by the tourists. Tourists require different types of services like, guiding,
catering, boarding, lodging, etc. All these requirements are fulfilled by the trained
professionals. The hotels, tour operators, restaurants, and others can estimate the
requirements of personnel on various categories on the basis of previous year’s
experience.
Preparing the Manpower Inventory:
During this second step, a detailed list of existing manpower is prepared first.
Then the number of existing staff is assessed with a view to determine the extent to
which manpower requirement can be met from among the existing staff themselves.
The qualifications, experience, aptitude, etc of every employees are analyzed. The
manpower inventory contains the list of existing staff and the process of preparing
such a list is called Manpower Audit.
In tourism industry, we can prepare a detailed list of employees with different

51
skills and knowledge. This helps to analyze the strength and weakness of existing
employees. It is possible among hotels, restaurants, tour operators, etc. The govt. can
prepare the inventory of tourist polices. It is difficult in the case of street guides and
informal services.
Planning Job requirements and Job descriptions:
After having decided how many persons would be needed, it is necessary to
prepare a job analysis, which records details of training, skill, qualifications, abilities,
experience and responsibilities, etc. which are needed for a job.
In tourism, it is necessary to study in detail the qualifications, training, skills,
experience, etc. required in different jobs. There is no proper system for job analysis
in tourism.
Developing a Human Resource Plan:
After ascertaining the actual manpower requirements of the organization, the
Personnel management formulates programmes for the recruitment, selection,
training, etc. of the prospective employees. The best policy which is followed by most
organizations is to fill up higher vacancies by promotion and lower level positions by
recruitment from labour market.
It is necessary to prepare a human resource plan in every organization involved
in tourism industry. It requires different types of professional like guides,
transportation employees, etc. For this purpose a detailed plan is required to find out
the prospective employees.
3.07 Recruitment and Selection:
It is the process of searching for qualified employees and inspiring them to
apply for the job. Recruitment helps the management in attracting a large number of
qualified candidates. A suitable candidate can be located from different sources like,

52
advertisement, campus interview, employment exchange, etc.
In tourism industry, hotels can approach the hotel management institutes for
selecting qualified candidates. They can also approach employment exchange for new
professionals. The travel agencies can recruit employees through advertisement.
Another source of recruitment is promotion of existing employees.
The process of screening the recruited candidates is called selection. It is the
choosing of suitable person to fill the existing job vacancies. The bio data of the
candidates are put in to scrutiny and those who fulfill the requirements are called for
interview. The organization may conduct written test, group discussions and problems
solving exercises, presentations or interviews for completing the selection process.
3.08 Induction and Training:
Induction is the process of introducing a new employee in the organization. It is
the technique by which an employee is rehabilitated into the changed surroundings
and policies and procedures of the organization. He or she should be properly
welcomed in the organization, introduced to colleagues, given details about the
organisation, made to know his position acquainted with company’s rules, regulations
and working conditions. Information and up gradation of knowledge is the key to
success in tourism sector and all employees must have updated knowledge.
3.09 Motivation:
The quality of service in tourism depends on the job satisfaction of the
employees. It is the manager’s responsibilities to motivate the employees. Besides
rewards and incentives, the employees can be motivated by recognizing their
performance. Employee’s expectations should also be kept in mind and their
achievements or good performance should be duly recognized. This also helps in the
retention of good employees in the organization.

53
3.10 Compensation to Employees
The reward received by an employee for his services is called compensation.
The compensation include direct, indirect and non-monetary.
Direct Compensation
Direct compensation includes the basic wages that an employee receives as
annual salary or hourly wages. It is based on the actual work done by the employee or
time spent by him in the premises. Here the employees are compensated on a
particular scale of pay.
Indirect Compensation
Indirect compensation means the monetary benefits received by an employee
other than the basic wages. It includes retirement programmes, moving expenses,
insurance (health, dental, eye), subsidised housing, paid leave (sick, holiday, personal
days), subsidised utilities, boots and clothing laundry service, use of farm trucks or
machinery, produce, foods, meals, cellular phones, child care, etc.
Non-Monetary Compensation
Any benefit an employee receives from an employer or job that does not
involve any monetary value. This includes career and social rewards such as job
security, flexible hours and opportunity for growth, praise and recognition, task
enjoyment, and friendships.
The following are nine steps in human resource development for tourism in
Indian context:
1) Correctly plan the requisite number of people required at each level of
each category of skill, providing for expansion, attrition, and internal
developmental need Identify the alternative source from where people can
be recruitd, ranging from fully trained and experienced people who could

54
operate directly on the job, to new entrants who requires appropriate
training before commencing work.
2) Set up appropriate cost – effective recruitment systems.
3) Set up effective induction and training systems to cater for every source
of recruitment.
4) Identify and make available the requisite number of trainees to operate
these systems.
5) Install an effective personnel administration system to take care of those
recruitment.
6) Set up a discipline management where by all employees are prepared to
accept basic norms of discipline at work.
7) Create a collaborative climate for industrial peace so that customers are
not in the least aware of unavoidable tensions that are likely to occur in
any management – employee relationship.
8) Set up a team of human resource professionals who have the requisite
professional and personal skills to ensure continuous monitoring and
improvement of the integrated Human Resource Development.

55
END NOTES
[1] Leela Shelley, Tourism Development in India – A study of hospitality Industry,
Pointer Publishers, Jaipur, 1991.
[2] Ravi Bushan Kumar, Coastal Tourism and Environment, APH Publishing
Corporation, New Delhi, 1995.
[3] Gulab Nabi, Socio Economic Impact of Tourism, Pointer Publishers, Jaipur,
2000. Man Power Requirements in Tourism
[4] John Bratton, Jefferey Gold, Human Resource Management, Palgrave
Macmillan, 2003.
[5] Karan Singh, Indian Tourism – Aspects of Great Adventure, Department of
Tourism, 1980.
[6] Holloway, Christopher.K, The business of Tourism, Pitman, London, 1990.
[7] Roscnow, John.E, Tourism – the Good, the Bad and the Ugly, Century
Three Press, Loncoln, Nebraska, 1979.
[8] Clare.A.J Gunn, Taylor, Francis, Tourism Planning, New York, 1988.
[9] Arun Monappa, Mirza Saiyadain, Personnel Management, Tata Mc Graw
Hills Publishing Co. Ltd., New Delhi, 1996.
[10] Mary.L.Tanke, Human Resource Management for Hospitality Industry,
Clemar Publications,
[11] Tourist Statistics 2008, Department of Tourism, Government of Kerala, 2008.
[12] Districts of Kerala – Thiruvananthapuram, Department of Tourism,
Government of Kerala.
[13] Districts of Kerala – Alappuzha, Department of Tourism, Government of
Kerala.
[14] Districts of Kerala – Kollam, Department of Tourism, Government of Kerala.

56
[15] Districts of Kerala – Kottayam, Department of Tourism, Government of
Kerala.
[16] Districts of Kerala – Pathanamthitta, Department of Tourism, Government
of Kerala.
[17] Districts of Kerala – Idukki, Department of Tourism, Government of Kerala.
[18] Districts of Kerala – Ernakulam, Department of Tourism, Government of
Kerala.
[19] Districts of Kerala – Thrissur, Department of Tourism, Government of Kerala.
[20] Districts of Kerala – Palakkad, Department of Tourism, Government of Kerala.
[21] Districts of Kerala – Malappuram, Department of Tourism, Government of
Kerala.
[22] Districts of Kerala – Wayanad, Department of Tourism, Government of Kerala.
[23] Districts of Kerala – Kozhikkode, Department of Tourism, Government of
Kerala.
[24] Districts of Kerala – Kannur, Department of Tourism, Government of Kerala.
[25] Districts of Kerala – Kasargode, Department of Tourism, Government of
Kerala.
[26] The Snake Boat Race of Kerala, Department of Tourism, Government of
Kerala.
[27] The Essential Kerala, Department of Tourism, Government of Kerala.
[28] A Guide Book on The Hill Palace, The Institute of Archaeology Art History,
Conservation and Museology, Thiruvananthapuram, 2002.
[29] P.S.Daver, Personnel Management and Industrial Relations in India, Vikas
Publishing House, New Delhi.

57
[30] L.M.Prasad, Human Resource Management, Sulthan Chand & Sons, New
Delhi, 2003.
[31] Mirza S Saiyadain, Human Resource Management, Tata Mc Graw Hill
Publishing Co. Ltd., New Delhi, 1998.

58
CHAPTER IV
ANALYSIS AND INTERPRETATION
4.00 Introduction
This part of the study deals with the analysis and interpretation of the primary
data. The analysis was made in various phases. In the first phase the profile analysis
of stakeholders in three tourism destinations that is; Beach tourism in Kovalam,
Ecotourism in Thenmala and Backwater tourism in Alleppey was made.
4.01 Personal Profile of Stakeholders
The stakeholders are classified on the basis of their Age, Gender, Marital
status, Education, Occupation, income and tourism activity. This is given in Table 4.
01
Table 4.01
Personal Profile of Stakeholders
Particulars Classification Frequency Per cent
Age
up to 20 71 23.67 21 to 40 85 28.33 41 to 60 93 31.00 above 60 51 17.00
Gender Male 164 54.67 Female 136 45.33
Marital status
Single 104 34.67 Married 103 34.33 Divorcee 51 17.00 Widow 42 14.00
Education
Primary 23 7.67 Secondary 42 14.00 Graduate 51 17.00 Post graduate 133 44.33 Professional 51 17.00

59
Occupation
Professional 51 17.00 Business 77 25.67 Employee 102 34.00 Agriculturist 36 12.00 Others 34 11.33
Income
Below Rs.20000 44 14.67 Rs. 20000 to 30000 62 20.67 Rs. 30000 to 40000 117 39.00 Above Rs. 40000 77 25.67
TOTAL 300 100
Age
Age wise classification reveals that 31 per cent of respondent stakeholders
belong to the age group of 41 to 60 categories. Among the total sample of 300, 28
percent and 23 percent respectively belongs to 21 to 40 and up to 20 age categories.
Gender
Gender wise analysis shows that 55 per cent of the total stakeholders are Male.
The aggregate of female stakeholders from three tourism destinations of Kerala was
45 percent.
Marital status
Regarding the Marital status of the stakeholders, 34.33 per cent come under
married category and 34.67 per cent are single. 17 per cent stakeholders are divorcee
and 14 per cent are widows.
Education
Majority of the stakeholders ie, 44 per cent of the stakeholders are Post
graduates. Regarding the level of education, 17 per cent stakeholders are
professionally qualified. 14 per cent have secondary level education and 8 per cent
have only school level education.

60
Occupation
Occupation wise analysis of the stakeholders reveals that 34 per cent stake
holders are employed in tourism sector. 25 per cent in the field of business activities,
12 per cent agriculturists and 11 percent working in other tourism related activities.
Income
Income wise classification reveals that 39 per cent of stakeholders earn 30000
to 40000 Rupees per month. 25per cent of stake holders have more than rupees 40000
income per month. Around 21 per cent of respondents earn Rupees 20000 to 30000
per month.
Table 4.02
Types of Tourism activities
Tourism activity Frequency %
Beach tourism 84 28.00
Ecotourism 111 37.00
Backwater tourism 105 35.00
Total 300 100.00
Table 4.02 shows that the preference of stakeholders who selected various
tourism products in Kerala. The analysis reveals that 28 per cent of the stake holders
are attracted in Beach Tourism, 37 per cent of the respondents preferred ecotourism
and rest of 35 per cent of stakeholders selected Backwater Tourism.

61
Table 4.03
Types of Tourism products
Tourism products Score %
Ever green forest 111 37.00
Mountaineering 111 37.00
Wild life and bird sanctuaries 129 43.00
Plantation 111 37.00
Hill station 111 37.00
Monsoon 172 57.33
Rivers 117 39.00
Valleys 112 37.33
Backwaters and beaches 194 64.67
Ayurveda 226 75.33
Table 4.03 shows that types of tourism products available in various
destination in Kerala State. 75 per cent of stakeholders engaged in providing services
through Ayurvedic resorts, 64 per cent of respondents each are engaged in providing
Backwater tourism and beach tourism. 57 per cent of stakeholders are engaged in
providing Monsoon tourism related services. 43 per cent of stakeholders preferred
wild life and bird sanctuaries related services.

62
Table 4. 04
Classification of Stakeholders
Stakeholders Score %
Tourist guide 88 36.67
Tour operator 101 42.08
Photographer 56 23.33
Taxi driver 61 25.42
House boat owner 60 25.00
Health care provider 87 36.25
Handicrafts vendor 74 30.83
Head load workers 93 38.75
Home stay facility 91 37.92
Travel agent 90 37.50
Hotelier 30 12.50
any other 65 27.08
Table 4.04 represents the status of respondents in various tourism related
activities. Majority of the stakeholders (42 per cent) are engaged as tour operators,
activities. 38 per cent are engaged in the field of Head load workers, 37 per cent of
respondents each are engaged in providers of home stay facilities and travel agency
services. 37 per cent stakeholders are working as tourist guide and 36 percent as
health care providers

63
Table 4.05
Factors needed for inclusive development of tourism industry
factors
Tourism activity
Beach tourism Ecotourism Backwater
tourism Total
N % N % N % N %
Community participation 47 55.95 45 40.54 77 73.33 169 56.33
Innovative marketing strategies 41 48.81 44 39.64 70 66.67 155 51.67
Government support 60 71.43 84 75.68 55 52.38 199 66.33
NGO support 39 46.43 40 36.04 32 30.48 111 37
Table 4.05 shows the various factors needed for inclusive development of
tourism industry in Kerala. Majority of the stakeholders, 71 per cent are engaged in
Beach tourism, and 75 per cent are in ecotourism. They expressed that Government
support as one among essential factors needed for achieving inclusive development in
tourism industry. 73 per cent of stakeholders engaged in Backwater tourism stated
that community participation is necessary for achieving inclusive development.
The chi-square value (59.392) and its assumed significance (P < 0.05) reveals
that there is significant variation in factors needed for inclusive development aiming
the three tourism segments in Kerala at 5 per cent level of significance.

64
Figure 4.01
Factors needed for inclusive development
Figure 4.01 shows the response of the stakeholders as regards, the factors needed for
inclusive development differs significantly with regard to tourism activity.
Government support is higher in Ecotourism and Beach tourism where as Community
participation is higher in backwater tourism.
Table 4.06
Annual earnings from tourism
Beach tourism Ecotourism Backwater tourism Total
N % N % N % N %
10,000-50,000 49 58.33 77 69.37 43 40.95 169 56.33
50,000-1,00,000 35 41.67 34 30.63 62 59.05 131 43.67
The Stakeholders average annual earnings from Beach tourism, Ecotourism
and Backwater tourism are given in Table 4.06. The highest earnings from Beach
Tourism (58 percent) is in 10000 to 50000 income category. The highest earnings
from ecotourism (69 percent) is higher in 10000 to 50000 income category. The
stakeholders engaged in Backwater tourism (59 per cent) earn 50000 to 100000
annually.

65
The responses collected from stakeholders are analysed here with the help of
chi-square. The result shows that chi-square value as 17.9 at assumed significance (P
< 0.05) that there is significant difference in level of earnings among various stake
holders engaged in different tourism segments.
Figure 4.02
Annual earnings from tourism
Average annual earnings from tourism significantly differ among stakeholders
engaged in different tourism activity as shown in Figure 4.02. It can be observed
from the chart that highest earnings is from backwater tourism
Table 4.07
Status of employment opportunity
Opinion
Tourism activity
Total Beach tourism Ecotourism Backwater tourism
N % N % N % N %
Yes 60 71.43 92 82.88 88 83.81 240 80.00
No 24 28.57 19 17.12 17 16.19 60 20.00
Total 84 100.00 111 100.00 105 100.00 300 100.00
Table 4.07 shows the nature of employment opportunities provided to local people
residing at tourism destinations. The stakeholders expressed 71 per cent of local

66
people are employed in beach tourism, 82 per cent are employed in Ecotourism and
88 per cent, employed in backwater tourism. The result of statistical analysis (p >
0.05) shows that employment opportunity is similar in all tourism activities. Hence
the Chi-square value of 5.386 is accepted at 5 per cent level of significance.
Table 4.08
Status of Tourism industry
Reasons
Tourism activity
Beach tourism Ecotourism Backwater tourism Total
N % N % N % N % Ecologically sustainable 49 63.64 40 38.83 39 38.6
1 128 45.55
Less capital investment and high
return 59 76.62 88 85.44 81 80.2 228 81.14
Pollution free environment 49 63.64 51 49.51 71 70.3 171 60.85
The stakeholders opinion about the reason for success for the development of
tourism industry in their locality is shown in Table 4.08. 76 per cent of sampled
respondent in beach tourism, 85 per cent in ecotourism and 80 per cent in backwater
tourism expressed the reason as less capital investment with high rate of returns.
Figure 4.03
Status of Tourism industry

67
Figure 4.03 graphically presents the results as regards the reasons for the
success of tourism industry in the opinion of the stake holders.
The result shows that chi-square value (25.905) and its assumed significance
(P < 0.05) reveals that there is significant difference in reasons for the success of
tourism industry, in the opinion of stakeholders.
Table 4.09
Mean opinion score of stakeholders about services available at the destination
Services
Total Beach tourism Ecotourism Backwater
tourism F Sig. Mean SD Mean SD Mean SD Mean SD
Local hospitality 3.96 0.69 3.86 0.66 3.86 0.57 4.16 0.79 6.943 0.001 Transport/food 3.81 0.63 3.79 0.68 3.83 0.62 3.82 0.62 0.117 0.890 Travel agents service 3.72 0.64 3.63 0.71 3.73 0.62 3.77 0.61 1.158 0.316 Communication 3.76 0.67 3.73 0.73 3.75 0.64 3.79 0.65 0.231 0.794 Healthcare/beverage 3.78 0.55 3.76 0.59 3.78 0.55 3.79 0.53 0.066 0.936 Drinking water 3.53 0.66 3.58 0.70 3.38 0.63 3.65 0.62 5.062 0.007 Banking/medical services 3.81 0.63 3.79 0.68 3.83 0.62 3.82 0.62 0.117 0.890 Recreation 3.87 0.57 3.83 0.64 3.86 0.55 3.90 0.54 0.276 0.759 Power supply/tourist guides 3.86 0.62 3.81 0.70 3.86 0.58 3.89 0.59 0.367 0.693 Sanitation 3.45 0.56 3.46 0.59 3.30 0.50 3.60 0.55 8.452 0.000 Parking 3.47 0.69 3.62 0.73 3.41 0.67 3.41 0.66 2.788 0.063 Sewage and drainage 3.29 0.57 3.30 0.62 3.28 0.54 3.30 0.57 0.031 0.969 Safety and security measures 3.36 0.66 3.42 0.70 3.35 0.66 3.32 0.63 0.479 0.620 Locker 3.68 0.53 3.73 0.55 3.79 0.45 3.52 0.56 7.794 0.001 Accommodation 3.82 0.63 3.79 0.70 3.82 0.61 3.85 0.60 0.225 0.799
Table 4.09 shows the mean opinion score of stakeholders about the services
available at various tourism destinations in Kerala. The mean score and SD of
transport service is 3.81 and 0.63 respectively, it shows that there no significant
variation in services and tourism products offered to the tourists. Hence the null
hypothesis is accepted here at 5 per cent level of significance (p > 0.05)The services

68
like local hospitality, Drinking water facility, Sanitation and Locker facility shows
difference (P < 0.05) in different sectors as the level of significance is less than 0.05
(p<0.05)
Figure 4.04
Mean opinion score of sample about services available at the destination
Figure 4.04 geographically presents the opinion score about the stakeholders
relating to the quality different services available at the destinations. The result of
analysis shows that (p<0.05), there is significant variations in service quality in local
hospitality, drinking water, sanitation and locker facility. It is found that there is no
significance difference in the opinion of stakeholders engaged in different tourism
segment, as regards the quality of all other services

69
CHAPTER V
HUMAN RESOURCE DEVELOPMENT MODELS
5.00 Introduction
Tourism has emerged as one of the largest and fastest growing industry in
terms of gross domestic products and employment in the world today. As the volume
of employment and income are closely related, the effects of tourism employment
vary by the natural tourist activity.
Figure 5.01
Classification tourist spending
Transportation
Entertainment Recreation
Retail Food & beverage
Accommodation
Tourist have very much interested in incentive trips, a packaged incentive
helps the tourism industry to generate higher revenue through higher sales. In the
TOURIST
SPENDING

70
ordinary course of travel, tourist generally spends their money for transportation,
food, entertainment, purchase, accommodation and beverage. This is given in figure
5.01. The tourist purchases different tourism products from a single tourism
destination; which offers two or more services at the same time. It enables tourist an
opportunity to purchase additional tourism products and services from the same
destination that generate, new employment opportunities.
Tourism has become an instrument for sustainable human development,
employment generation, poverty elimination, environmental regeneration and
advancement of women and other disadvantaged group. Tourism generates three
types of employment i.e., direct employment in the hospitality sector, indirect
employment due to consumption of local goods and services and induced employment
through catering the specific requirements of tourist. Thus tourism industry creates
and develops human resource and the beneficiaries of this sector are stakeholders such
as community members, local people, government officials and tourist.
Enterpreneurship Development Programme (EDP) and Human Resource
Information System (HRIS) channel and transform their enterpreneurial ambitions
and qualities into actions. Tourism enterpreneurship related to creating and operating
a legal tourist enterprise. HRIS designed to supply tourism information necessary for
effective management of tourism industry. It is designed to monitor, control and
influence the movement of people from the time they join the tourism industry till the
time they leaves from the organisation.

71
Figure 5.02
Model for Developing Tourism industry
INPUT PROCESS OUTPUT
Tourism is a mechanism for improving the livelihoods for local people in
tourism destination through employment generation. The generation of employment,
income for locals, revenue and taxes for governments are the major factors that lead
to development of tourism. The model for developing tourism destination, human
resource development, increasing revenue and taxes are inevitable for survival and
T
O
U
R
I
S
M
EMPLOYMENT OPPORTUNITY CREATION
DIRECT
INDIRECT
INDUCED
E
D
P
&
H
R
I
S
COMMUNITY
STAKEHOLDERS
OFFICIALS
DEVELOPMENT OF EMPLOYMENT
DEVELOPMENT OF DESTINATION
I
N
C
O
M
E
&
T
A
X
72
existence of tourism industry as a whole. A system approach to develop human
resources and destination are shown in the figure 5.02.
The model depicts the importance of EDP and HRIS, and employment
opportunities, available to the beneficiaries of tourism industry. The development of
Tourism destination and generating new employment opportunities heavily depends
on effective implementation of EDP and HRIS. The tourism industry that undergoes
through this process leads to the development of tourism destination and human
resource development.
Figure 5.02 which interpret the interrelationship between tourism industries,
destination development can be used as a working model for increase and
employment generation.
5.01 Employment co-efficient model
In order to estimate the volume of employment in the state that can be
generated from tourism due to spending by domestic and foreign tourist, employment
coefficient method was found most appropriate. (The employment coefficient is
computed for all the sectors and subsectors related to tourism to ascertain the volume
of employment in that sector).
Employment coefficient measures the ratio between employment and output
of value added in that sector the term employment coefficient means the number of
persons employed in tourism sector for one crore rupee of value added in that sector.
The aggregate employment coefficient of the tourism sector is the weighted average
of the employment coefficient of the different subsectors that forms the composite
sector or the economy. The estimate of the total volume of employment generated
from tourism sector of the state is the product of the total expenditure in the

73
composite sector derived by the aggregate index of employment coefficient. Thus if
„n‟ is the number of workers employed in tourism sub sectors and „v‟ is the value
added in that sector, the employment coefficient for that sector is,
Assumptions
1. there is no income leakage, due to imports. It is assumed that all goods and services
provided to tourists are produced in India and not imported from elsewhere.
2. The employment coefficient for all firms is equal
3. Expenditure pattern for all tourism sectors remain constant.
5.02 Estimation of employment coefficient
To determine the pattern of expenditure of domestic and foreign tourists in
India, a survey has been conducted in 2003 and 2008 by ministry of tourism
(MOT2006) and NSSO (65TH round, 2008).The share of expenditure of the tourists in
each of the tourism subsector is used as the weight of that subsector used in
estimation of the aggregate employment co-efficient. Employment co-efficient has
eci = ni /vi ………………….1
The aggregate employment coefficient is then
EC = ∑ wi eci …………………2
Or
EC = ∑ wi ni /vi
Where i = 1…m (total number of sub sectors), and wi = weight for sector i
The employment in the economy/composite sector is given by
Employment = EC × GDPc …………………3
74
been calculated separately for domestic, foreign and aggregate tourism, to give more
meaningful insights with regard to different sectors and subsectors and to identify the
capacity to generate additional employment opportunities in those sectors through
direct tourist spending.
Since the data on employment on tourism sector relating to the state of Kerala
is not available, the researcher has used the data base from the all India based study to
determine and project the employment co-efficient and the volume of employment of
the state. For this purpose the national data for the period of seven years i.e., 2002-
2008 has taken into account. The data found missing for the years of 2003and 2009
were interpolated for making the base of estimation. The main purpose of this study is
to forecast the employment generation capacity of the tourism sector for a period of
12 years (2014 to 2025). For this the tourism expenditure up to the year 2025 was
estimated by making use of time series analysis through trend projection method
based on compound annual growth rate of tourism expenditure.
Employment coefficient for the period under the study showed a decreasing
trend. Due to the introduction of automation, technological development and change
in the information communication technology appropriate adjustments were made in
the data base to incorporate the effect of the decline. As a result there was a drastic
decrease in the employment coefficient has seen at all India level and at the state
level. Hence the number of persons employable per crore of rupees value added in
tourism sector has showed a trend negative compound growth rate for the study
period.
Since data on aggregate and sector wise employment was not available, an
indirect method has been applied here by using simple annual growth rate (SAGR) to
estimate the projected employment co-efficient for the period from 2014 to 2025. The

75
analysis reveals that a sharp decline of 18 employment opportunities was seen per
rupee one crore of investment in tourism sector over the projected period of 12 years
commencing from2014 to 2025 used, to project the volume of employment of the
state.
For this period the projected employment in volume showed a threefold
increase. It clearly states the potential employment generation capacity of this sector,
our planners and a policy makes has to stick on here. One should always note the fact
that ,this increase in the potential of volume employment generated here, contrary to
a decrease of 18 employment opportunities (decrease in the employment co-efficient
from 103 to 85 over the projected period)per one crore of additional expenditure in
tourism sector. The projected employment co-efficient is based on the employment
co efficient of the past i.e. for the period of 2001 and 2013.Again these estimates were
based on the assumptions that the compound annual growth rate of income (CAGR)
from tourism between these base period, (2001-13) will similar to that of the growth
rate of income from tourism for the projected period also.
The results of the analysis of the study “Employment generation through
entrepreneurship development in tourism sector: an evaluative study in the state of
Kerala” is given in chapter V table 5.1 .Details regarding the revenue generated from
domestic and foreign tourism for the period of 2001 to 2013,is presented in the
following table.

76
Table 5.01
Income from tourism (2001-13)
Year Foreign
exchange earnings
Percentage of increase
Total revenue generated from tourism (Direct
and indirect) Rs. in crores
Percentage of increase
2001 534.00 1.85 4500.00 9.58 2002 705.67 31.90 4931.00 20.42 2003 983.37 39.35 5938.00 12.83 2004 1266.77 28.82 6829.00 15.01 2005 1552.31 22.54 7738.00 13.31 2006 1988.40 28.09 9126.00 17.97 2007 2640.94 32.82 11433.00 25.28 2008 3066.52 16.11 13130.00 0.77 2009 2853.16 -6.96 13231.00 0.77 2010 3797.37 33.09 17348.00 31.12 2011 4221.99 11.18 19037.00 9.74 2012 4571.69 8.28 20430.00 7.32 2013 5560.77 21.63 22926.55 12.22
Source: Tourism statistics, Govt. of Kerala
The annual growth rate of income from foreign tourism for the
period under review varies from 6.96 percent to 39.35 percent. The growth rate of
income from tourism reveals fluctuating trend that was not uniform for the period of
the study. The maximum growth rate in income was in 2003 (39.35 percent ) and it
showed remarkable increase in the years of 2004,07,10 and 13 to 28.82 percent 32.82
percent 33.09 percent and 21.63 percent respectively. The total revenue generated
from tourism during this period also revealed similar results. The growth in tourism
income was maximum (31.12 percent) in the year 2010 and minimum (0.77 percent)
in 2009.
In this study in order to estimate the volume of employment in tourism sector
of Kerala, employment co-efficient approach was adopted as it was found more
suitable to the state. In an all India based study held by ministry of tourism in 2006,
this method was used to estimate the volume of employment .In order to estimate the
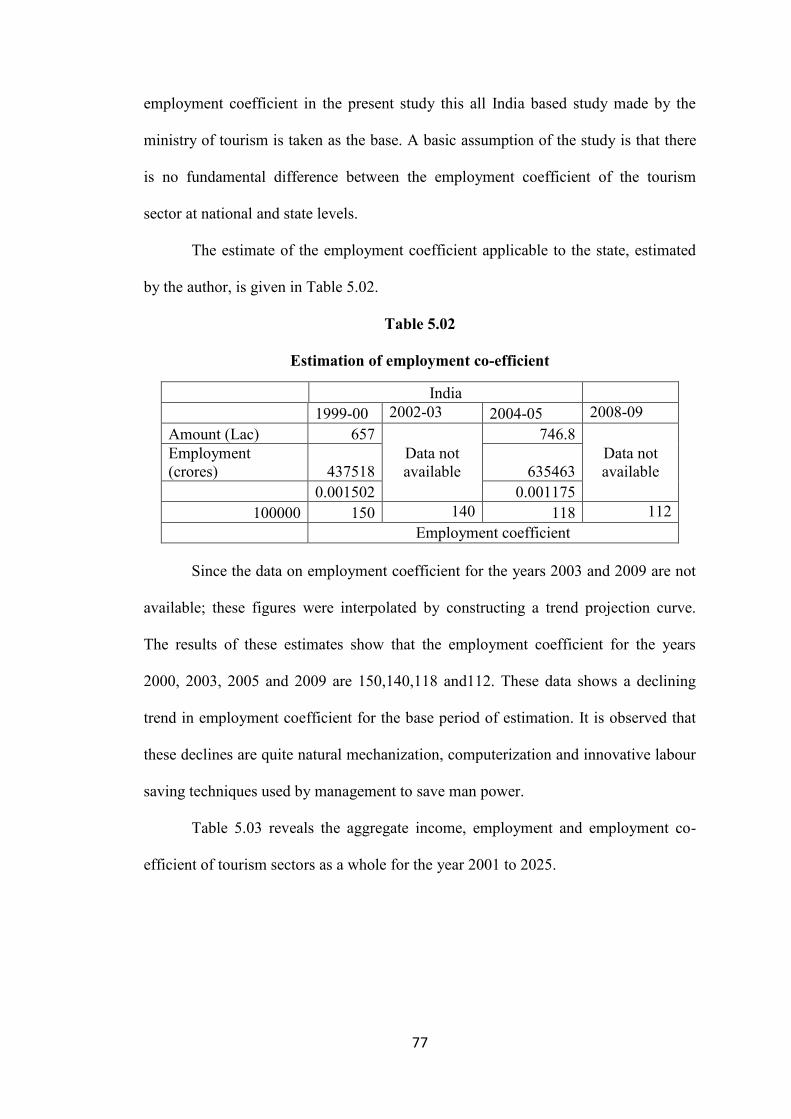
77
employment coefficient in the present study this all India based study made by the
ministry of tourism is taken as the base. A basic assumption of the study is that there
is no fundamental difference between the employment coefficient of the tourism
sector at national and state levels.
The estimate of the employment coefficient applicable to the state, estimated
by the author, is given in Table 5.02.
Table 5.02
Estimation of employment co-efficient
India
1999-00 2002-03 2004-05 2008-09
Amount (Lac) 657 Data not available
746.8 Data not available
Employment (crores) 437518 635463
0.001502 0.001175
100000 150 140 118 112 Employment coefficient
Since the data on employment coefficient for the years 2003 and 2009 are not
available; these figures were interpolated by constructing a trend projection curve.
The results of these estimates show that the employment coefficient for the years
2000, 2003, 2005 and 2009 are 150,140,118 and112. These data shows a declining
trend in employment coefficient for the base period of estimation. It is observed that
these declines are quite natural mechanization, computerization and innovative labour
saving techniques used by management to save man power.
Table 5.03 reveals the aggregate income, employment and employment co-
efficient of tourism sectors as a whole for the year 2001 to 2025.

78
Table 5.03
Aggregate employment co-efficient of tourism sector in Kerala
Total
Year Income Employments Em_coef
2001 4500.0
2002 4931.0 690340 6.90340 140.0
2003 5938.0 766002 7.66002 129.0
2004 6829.0 805822 8.05822 118.0
2005 7738.0 899543 8.99543 116.3
2006 9126.0 1044927 10.44927 114.5
2007 11433.0 1289071 12.89071 112.8
2008 13130.0 1457430 14.57430 111.0
2009 13231.0 1445877 14.45877 109.3
2010 17348.0 1866396 18.66396 107.6
2011 19037.0 2016363 20.16363 105.9
2012 20430.0 2130366 21.30366 104.3
2013 22902.3 2351156 23.51156 102.7
2014 26287.3 2656828 26.56828 101.1
2015 30172.6 3002240 30.02240 99.5
2016 34632.1 3392558 33.92558 98.0
2017 39750.7 3833622 38.33622 96.4
2018 45625.9 4332028 43.32028 94.9
2019 52369.4 4895231 48.95231 93.5
2020 60109.5 5531655 55.31655 92.0
2021 68993.7 6250821 62.50821 90.6
2022 79191.0 7063484 70.63484 89.2
2023 90895.4 7981802 79.81802 87.8
2024 104329.8 9019508 90.19508 86.5
2025 119749.7 10192127 101.92127 85.1 Source: computed by the researcher
During the above mentioned period income from tourism increased from
Rs.4500 crores to Rs.119749.7 crore rupees. The increase in the estimated income
from tourism over a period of 25 years is enormous to a small state like Kerala,

79
compared to growth rate attained by other sectors of the economy. The growth in the
volume of employment for the above period also shows astonishing results. The
decline employment co-efficient is quite natural as the management adopts steps for
cost minimization through labour saving. The employment co-efficient of 140 per
crore of income invested in tourism sector in 2002 was estimated to decline to a level
of 85 in 2025.The volume of employment was estimated for the study period based on
the projected employment co-efficient figures.
Figure 5.2 graphically represents the pattern of growth in income from tourism
sector for the study period. The results of the statistical estimates reveal that tourism
segment grows in a uniform pattern as tourists prefer to travel for leisure and
enjoyment, throughout their life.
Figure 5.03
Income from tourism estimated through trend projection curve method
The uniformity of distribution in the pattern of income reveals the trend of
growth of tourism industry in Kerala.
Table 5.4 presents the nature and pattern of income and employment
from foreign tourism now and in the future.

80
Table 5.04
Estimated volume of employment generated from foreign tourism
Year Inc(Rs.in crore) Employment coef Employment in lac
2001 535
2002 705.67 139 98088
2003 983.37 134 131772
2004 1266.77 129 163413
2005 1552.31 124 192875
2006 1988.4 120 237614
2007 2640.94 115 303048
2008 3066.52 110 337317
2009 2853.16 110 313391
2010 3797.37 110 416496
2011 4221.99 110 462392
2012 4571.69 109 499960
2013 5560.77 109 607236
2014 6758.56 109 736953
2015 8214.354 109 894379
2016 9983.725 109 1085431
2017 12134.22 109 1317291
2018 14747.93 108 1598676
2019 17924.64 108 1940163
2020 21785.6 108 2354588
2021 26478.22 108 2857530
2022 32181.63 108 3467892
2023 39113.55 108 4208618
2024 47538.61 107 5107548
2025 57778.43 107 6198470
Source: secondary data

81
The income generated from tourism due to spending by foreign tourists
Kerala in the year 2002 was Rupees 705.67 crores as against the projected
income of rupees 57778.43 crores in the year 2025.The increase in the volume
of income is 81.88 times over the above period which accounts a higher growth
than the aggregate growth rate of the tourism sector. The luxurious nature of
foreign tourists and low cost of living here when compared to the value of the
currency are the reasons for this. As regards the employment co-efficient of
foreign tourism a declining trend can seen here. The employment coefficient
that was 139 in 2002 declined to107 in 2025.Regarding the volume of
employment that was 98088 in 2002 is estimated to increase to a level of 61.98
lakh in 2025 as per projections made in this study. This growth rate can be
considered as enormous huge as this sector generates huge employment
opportunities in the state from tourism segment. The estimated growth in
volume of employment projected here in Kerala was the result of the normal
growth rate, and not because of making any deliberate attempt to this sector
without any attempt for tourism planning and promotion. Deliberate attempt to
enhance the growth in this segment probably leads to creation of enormous
additional employment opportunities. The main objective of this research is to
develop mathematical models that can be effectively used as tools for
employment generation through tourism development.

82
Figure 5.3 gives a graphical representation of data relating to foreign tourism.
Figure 5.04
Volume of employment in tourism sector
The period under the study is plotted in the X axis and the volume of
employment due to foreign tourism is shown in the Y axis. The trend of the
curve is upward as it is usual that the volume of employment from tourism
sector increases year after year in accordance with the increased requirements
of the industry to cater the needs of increase in the volume of tourists and due
to their increased volume of spending.
Table 5.05 presents the sector wise share of income from foreign
tourism.

83
Table 5.05
Estimated volume of income from foreign tourism in different tourism sub sectors
year
s
inc
Tran
s
Acc
Food
Spot
ent
shop
Hea
lth
othe
r
Tota
l pe
rcen
tage
2001 535 33 31 11 3 4 11 6 1 100
2002 705.67 232.87 218.76 77.62 21.17 28.23 77.62 42.34 7.06 100
2003 983.37 324.51 304.84 108.17 29.50 39.33 108.17 59.00 9.83 100
2004 1266.77 418.03 392.70 139.34 38.00 50.67 139.34 76.01 12.67 100
2005 1552.31 512.26 481.22 170.75 46.57 62.09 170.75 93.14 15.52 100
2006 1988.4 656.17 616.40 218.72 59.65 79.54 218.72 119.30 19.88 100
2007 2640.94 871.51 818.69 290.50 79.23 105.64 290.50 158.46 26.41 100
2008 3066.52 1011.95 950.62 337.32 92.00 122.66 337.32 183.99 30.67 100
2009 2853.16 941.54 884.48 313.85 85.59 114.13 313.85 171.19 28.53 100
2010 3797.37 1253.13 1177.18 417.71 113.92 151.89 417.71 227.84 37.97 100
2011 4221.99 1393.26 1308.82 464.42 126.66 168.88 464.42 253.32 42.22 100
2012 4571.69 1508.66 1417.22 502.89 137.15 182.87 502.89 274.30 45.72 100
2013 5560.77 1835.05 1723.84 611.68 166.82 222.43 611.68 333.65 55.61 100
2014 6758.56 2230.32 2095.15 743.44 202.76 270.34 743.44 405.51 67.59 100
2015 8214.354 2710.74 2546.45 903.58 246.43 328.57 903.58 492.86 82.14 100
2016 9983.725 3294.63 3094.95 1098.21 299.51 399.35 1098.21 599.02 99.84 100
2017 12134.22 4004.29 3761.61 1334.76 364.03 485.37 1334.76 728.05 121.34 100
2018 14747.93 4866.82 4571.86 1622.27 442.44 589.92 1622.27 884.88 147.48 100
2019 17924.64 5915.13 5556.64 1971.71 537.74 716.99 1971.71 1075.48 179.25 100
2020 21785.6 7189.25 6753.54 2396.42 653.57 871.42 2396.42 1307.14 217.86 100
2021 26478.22 8737.81 8208.25 2912.60 794.35 1059.13 2912.60 1588.69 264.78 100
2022 32181.63 10619.94 9976.30 3539.98 965.45 1287.27 3539.98 1930.90 321.82 100
2023 39113.55 12907.47 12125.20 4302.49 1173.41 1564.54 4302.49 2346.81 391.14 100
2024 47538.61 15687.74 14736.97 5229.25 1426.16 1901.54 5229.25 2852.32 475.39 100
2025 57778.43 19066.88 17911.31 6355.63 1733.35 2311.14 6355.63 3466.71 577.78 100
Source: Primary data
Nine sectors were identified in this study as tourism subsectors which
contribute substantial portion of the income from tourism. The aggregate
income from all the subsectors was taken together as the total income from
foreign tourism. Of the total income 33 percent was contributed by transport
sector, 31 percent by accommodation, 11 percent by food, 11 percent from
shopping and the rest from all other sectors. These sub sectored data were

84
relevant in the sense that these figures provide an insight to the stakeholders to
understand the importance of these sectors and to frame appropriate policies to
augment the flow of income from these sectors.
Table 5.06 gives a detailed account of the volume of employment that
can be generated from foreign tourism utilizing the sector wise income.
Table 5.06
Estimated volume of employment in different sub sectors due to foreign tourism
year
s
empl
Tran
s
Acc
food
Spot
ent
shop
Hea
lth
othe
r
2001
33 31 11 3 4 11 6 1 2002 690340 227812.20 214005.40 75937.40 20710.20 27613.60 75937.40 41420.40 6903.40 2003 766002 252780.66 237460.62 84260.22 22980.06 30640.08 84260.22 45960.12 7660.02 2004 805822 265921.26 249804.82 88640.42 24174.66 32232.88 88640.42 48349.32 8058.22 2005 899542.5 296849.03 278858.18 98949.68 26986.28 35981.70 98949.68 53972.55 8995.43 2006 1044927 344825.91 323927.37 114941.97 31347.81 41797.08 114941.97 62695.62 10449.27 2007 1289071 425393.35 399611.93 141797.78 38672.12 51562.83 141797.78 77344.25 12890.71 2008 1457430 480951.90 451803.30 160317.30 43722.90 58297.20 160317.30 87445.80 14574.30 2009 1445877 477139.43 448221.89 159046.48 43376.31 57835.08 159046.48 86752.62 14458.77 2010 1866396 615910.73 578582.81 205303.58 55991.88 74655.85 205303.58 111983.77 18663.96 2011 2016363 665399.68 625072.43 221799.89 60490.88 80654.51 221799.89 120981.76 20163.63 2012 2130366 703020.79 660413.47 234340.26 63910.98 85214.64 234340.26 127821.96 21303.66 2013 2351156 775881.60 728858.48 258627.20 70534.69 94046.25 258627.20 141069.38 23511.56
2014 2656828 876753.27 823616.71 292251.09 79704.84 106273.12 292251.09 159409.69 26568.28 2015 3002240 990739.18 930694.38 330246.39 90067.20 120089.60 330246.39 180134.40 30022.40 2016 3392558 1119544.28 1051693.12 373181.43 101776.75 135702.34 373181.43 203553.51 33925.58 2017 3833622 1265095.23 1188422.79 421698.41 115008.66 153344.88 421698.41 230017.31 38336.22 2018 4332028 1429569.12 1342928.57 476523.04 129960.83 173281.11 476523.04 259921.66 43320.28 2019 4895231 1615426.12 1517521.50 538475.37 146856.92 195809.23 538475.37 293713.84 48952.31 2020 5531655 1825446.21 1714813.11 608482.07 165949.66 221266.21 608482.07 331899.31 55316.55 2021 6250821 2062770.83 1937754.42 687590.28 187524.62 250032.83 687590.28 375049.24 62508.21 2022 7063484 2330949.81 2189680.13 776983.27 211904.53 282539.37 776983.27 423809.06 70634.84 2023 7981802 2633994.50 2474358.47 877998.17 239454.05 319272.06 877998.17 478908.09 79818.02
2024 9019508 2976437.75 2796047.59 992145.92 270585.25 360780.33 992145.92 541170.50 90195.08 2025 10192127 3363401.75 3159559.22 1121133.92 305763.80 407685.06 1121133.92 611527.59 101921.27
Source: primary data

85
This analysis gives an insight to the service providers and the relative
importance about the different subsectors. In this analysis it is found that the
transport services provides a maximum share of income of 33 percent followed
by accommodation 31 percent ,food 28 percent and shopping11 percent. Since
the estimation of the figures of total income and employment was projected
through trend projection method, the weights given to different subsectors was
identical. Hence, there is the possibility in obtaining the same results on sub
sectoral figures relating to income and employment. It can be justifiable on the
ground that this error in distribution on sub sectoral income does not reflects
in the total income as it is compensated there.
Table 5.07 shows the details regarding increase in employment and
employment co-efficient from domestic tourism for the period of study.
Table 5.07
Estimated volume of income and employment from domestic tourism
Domestic Year inc Emp_coef Empl 2001 3965 2002 4225.33 141 595771.5 2003 4954.63 124 614374.1 2004 5562.23 107 595158.6 2005 6185.69 109 671147.4 2006 7137.6 110 785136 2007 8792.06 112 980314.7 2008 10063.48 113 1137173 2009 10377.84 113 1172488 2010 13550.63 113 1530679 2011 14815.01 113 1673207 2012 15858.31 113 1790720 2013 17365.78 113 1960597 2014 19640.7 113 2217042 2015 22213.63 113 2507030

86
It reveals that in 2002 income from domestic tourism was 4225.33
crore whereas in 2025 it will be rupees 76075.63 crores. The result of the
comparative analysis regarding the number of times increase in the level of
income from domestic tourism, it clearly specifies a 17.88 times increase,
which is no doubt remarkable figure for the state. Regarding the volume of
employment from domestic tourism for the above period, it projects an increase
85.71 lakh employment opportunities in 2025, compared to 59.58 lakh
employment opportunities of 2002.the data on employment revealed a
compared annual growth rate of 13.1 percent from 2001 to 2013.the projection
on employment was done on the basis of the employment co-efficient
ascertained through trend projection method.
The volume of employment that can be generated from domestic
tourism is graphically presented in figure 50.4 as a curve.
2016 25123.61 113 2834949 2017 28414.81 113 3205759 2018 32137.15 113 3625070 2019 36347.11 113 4099227 2020 41108.59 113 4635404 2021 46493.81 113 5241712 2022 52584.5 113 5927325 2023 59473.07 113 6702615 2024 67264.04 113 7579312 2025 76075.63 113 8570680

87
Figure 5.05
Graphical representation of volume of employment from domestic tourism
The upward movement of the curve clearly shows the incremental
nature in the volume of employment up to the period of 2013, for the period
2014 to 2025. Estimates were made based on trend projection method to
forecast the volume of employment from domestic tourism for this period
based on exponential growth rate. As discussed earlier the employment
opportunities from domestic tourism during the period increased to 85.71 lakh
when compared to the employment opportunities of 59.58 lakh in 2002.
Table 5.08 shows the sub sector wise contribution of income from
domestic tourism

88
Table .5.08 Distribution of income among different tourism subsectors
year
inc
Tran
s
Acc
Food
spot
ent
shop
Hea
lth
othe
r
2001 3965 26 33 15 3 5 13 2 3 2002 4225.33 1098.59 1394.36 633.80 126.76 211.27 549.29 84.51 126.76 2003 4954.63 1288.20 1635.03 743.19 148.64 247.73 644.10 99.09 148.64 2004 5562.23 1446.18 1835.54 834.33 166.87 278.11 723.09 111.24 166.87 2005 6185.69 1608.28 2041.28 927.85 185.57 309.28 804.14 123.71 185.57 2006 7137.6 1855.78 2355.41 1070.64 214.13 356.88 927.89 142.75 214.13 2007 8792.06 2285.94 2901.38 1318.81 263.76 439.60 1142.97 175.84 263.76 2008 10063.48 2616.50 3320.95 1509.52 301.90 503.17 1308.25 201.27 301.90 2009 10377.84 2698.24 3424.69 1556.68 311.34 518.89 1349.12 207.56 311.34 2010 13550.63 3523.16 4471.71 2032.59 406.52 677.53 1761.58 271.01 406.52 2011 14815.01 3851.90 4888.95 2222.25 444.45 740.75 1925.95 296.30 444.45 2012 15858.31 4123.16 5233.24 2378.75 475.75 792.92 2061.58 317.17 475.75 2013 17365.78 4515.10 5730.71 2604.87 520.97 868.29 2257.55 347.32 520.97 2014 19640.7 5106.58 6481.43 2946.10 589.22 982.03 2553.29 392.81 589.22 2015 22213.63 5775.54 7330.50 3332.04 666.41 1110.68 2887.77 444.27 666.41 2016 25123.61 6532.14 8290.79 3768.54 753.71 1256.18 3266.07 502.47 753.71 2017 28414.81 7387.85 9376.89 4262.22 852.44 1420.74 3693.92 568.30 852.44 2018 32137.15 8355.66 10605.26 4820.57 964.11 1606.86 4177.83 642.74 964.11 2019 36347.11 9450.25 11994.55 5452.07 1090.41 1817.36 4725.12 726.94 1090.41 2020 41108.59 10688.23 13565.83 6166.29 1233.26 2055.43 5344.12 822.17 1233.26 2021 46493.81 12088.39 15342.96 6974.07 1394.81 2324.69 6044.20 929.88 1394.81 2022 52584.5 13671.97 17352.88 7887.67 1577.53 2629.22 6835.98 1051.69 1577.53 2023 59473.07 15463.00 19626.11 8920.96 1784.19 2973.65 7731.50 1189.46 1784.19 2024 67264.04 17488.65 22197.13 10089.61 2017.92 3363.20 8744.33 1345.28 2017.92 2025 76075.63 19779.66 25104.96 11411.34 2282.27 3803.78 9889.83 1521.51 2282.27
As regards, the data shown above accommodation ranks first with 33
percent contribution followed by transport 26% food 15% and from shopping
13 percent. The total contribution from sport health and other sectors taken
together comes 13 percent. This sub sectoral analysis reveals about the relative
importance of these sectors and reminds the stake holders about the strategies
to be designed to augment income from these sectors. Table 5.09 reveals the
volume of employment that can be generated from domestic tourism and the
distribution of income among different tourism subsectors.

89
Table 5.09 Distribution of employment in different tourism subsectors
year
Empl
Tran
s
Acc
food
spot
ent
Shop
Hea
lth
othe
r
2001 3965 26 33 15 3 5 13 2 3
2002 595771.5 154900.60 196604.60 89365.73 17873.15 29788.58 77450.30 11915.43 17873.15
2003 614374.1 159737.27 202743.46 92156.12 18431.22 30718.71 79868.64 12287.48 18431.22
2004 595158.6 154741.24 196402.34 89273.79 17854.76 29757.93 77370.62 11903.17 17854.76
2005 671147.4 174498.31 221478.63 100672.10 20134.42 33557.37 87249.16 13422.95 20134.42
2006 785136 204135.36 259094.88 117770.40 23554.08 39256.80 102067.68 15702.72 23554.08
2007 980314.7 254881.82 323503.85 147047.20 29409.44 49015.73 127440.91 19606.29 29409.44
2008 1137173 295665.04 375267.17 170575.99 34115.20 56858.66 147832.52 22743.46 34115.20
2009 1172488 304846.97 386921.16 175873.25 35174.65 58624.42 152423.49 23449.77 35174.65
2010 1530679 397976.58 505124.12 229601.87 45920.37 76533.96 198988.29 30613.58 45920.37
2011 1673207 435033.88 552158.39 250981.08 50196.22 83660.36 217516.94 33464.14 50196.22
2012 1790720 465587.29 590937.72 268608.05 53721.61 89536.02 232793.65 35814.41 53721.61
2013 1960597 509755.11 646996.87 294089.48 58817.90 98029.83 254877.55 39211.93 58817.90
2014 2217042 576430.89 731623.83 332556.28 66511.26 110852.09 288215.45 44340.84 66511.26
2015 2507030 651827.83 827319.94 376054.52 75210.90 125351.51 325913.91 50140.60 75210.90
2016 2834949 737086.63 935533.03 425242.29 85048.46 141747.43 368543.32 56698.97 85048.46
2017 3205759 833497.22 1057900.32 480863.78 96172.76 160287.93 416748.61 64115.17 96172.76
2018 3625070 942518.25 1196273.16 543760.53 108752.11 181253.51 471259.12 72501.40 108752.11
2019 4099227 1065799.13 1352745.05 614884.12 122976.82 204961.37 532899.57 81984.55 122976.82
2020 4635404 1205205.05 1529683.34 695310.61 139062.12 231770.20 602602.53 92708.08 139062.12
2021 5241712 1362845.15 1729765.00 786256.82 157251.36 262085.61 681422.57 104834.24 157251.36
2022 5927325 1541104.42 1956017.15 889098.71 177819.74 296366.24 770552.21 118546.49 177819.74
2023 6702615 1742679.84 2211862.88 1005392.22 201078.44 335130.74 871339.92 134052.30 201078.44
2024 7579312 1970621.13 2501172.97 1136896.81 227379.36 378965.60 985310.57 151586.24 227379.36
2025 8570680 2228376.91 2828324.53 1285602.06 257120.41 428534.02 1114188.45 171413.61 257120.41
Source: secondary data
Since the term employment is directly correlated to income, the distribution
of sector wise employment in percentage reveals similar results. (employment co-
efficient is taken as the base to predict the volume of employment in relation to
income applicable to all tourism sub sectors).the sectoral analysis in relation to
employment reveals that the major sector which provides maximum volume of
employment is accommodation industry 33 percent followed by transport 26percent

90
food 15percent shopping 13percentand the other sectors like sports&health altogether
13 percent.
The volume of employment generated by investing the income from domestic
tourism in the year 2002 was 5.96 lakh and it is expected to rise to the level of 85.71
lakhs in 2025at the normal growth. Any deliberate effort to enhance this normal
growth rate will augment these figures to much higher levels as desired by the
planners. Any attempts to make further investment in tourism sector will generate 85
additional employment opportunities per one crore rupees of additional investment in
tourismsector.In other words in order to create 1000 additional employment
opportunities in tourism sector 11.751 crores rupees of additional investment is
required as per the estimate made in this study. In order to generate a desired level of
employment opportunities in tourism sector in future. These figures can be effectively
used as a base to estimate the level of total investment outlay required to fulfill the
requirements. Therefore the employment co-efficient model can be effectively used as
a tool for tourism planning and employment generation in the state of Kerala now and
in the future.

91
CHAPTER VI
SUMMARY AND FINDINGS
6.00 INTRODUCTION
Tourism as an instrument for economic development and employment
generation, particularly in remote and backward areas, that has been well recognized
all over the world. It is the largest service sector industry, globally in terms of
revenue as well as foreign exchange earnings. Tourism plays an important and
effective role in achieving the social objectives of growth with equity. Tourism is an
economic sector that has the potential to grow at a higher rate and can generate lot of
employment opportunities at the destinations. It has the capacity to capitalize on the
country’s success in the service sector and provide sustainable models of economic
growth.
As a seasonal industry it provides alternative and off-seasonal employment
opportunities to the labour force of Kerala. It is true to state that by promoting young
entrepreneurs, enormous employment opportunities can be generated from tourism
sector through entrepreneurship development programmes. Enterpreneurship
Development Programme (EDP) and Human Resource Information System (HRIS)
can transform enterpreneurial ambitions as income and employment. Tourism
entrepreneurship is related to creating an operatinal and legal tourist environment.
HRIS was designed in such a manner to supply necessary tourism information for
effective management and administration of tourism industry. It is designed to
monitor, control and influence the movement of people from the time they join the
tourism industry till the time they leaves the organisation.
Employment co-efficient method is used in this study to predict the capacity to
generate employment opportunities of this sector. Employment co-efficient is the
index computed on the basis of interrelationship between the volume of income and
92
employment. The primary objective of the study is to formulate development models
to estimate the volume of employment in the state. It consists of the employment
opportunities that can be generated from spending cash by domestic and foreign
tourist. The study is designed in the present format, by taking into consideration the
following objectives
1. To identify the present volume of employment generated in the State through
different sectors of tourism.
2. To promote Entrepreneurship Development Programme as a tool for
employment generation in tourism sector
3. To identify other promotional activities required in tourism sector to generate
more employment.
4. To forecast the volume of employment that can be generated from tourism in
future.
Employment coefficient index is that unit or quantity of income required to
produce one unit of employment. The employment coefficient is computed for all the
sectors and subsectors related to tourism to ascertain the volume of employment in
each of these sectors. Employment coefficient measures the ratio between
employment and output of value added in that sector. The term employment
coefficient can again be described as the number of persons employed in tourism
sector for one crore rupee of value added, in that sector. The aggregate employment
coefficient of the tourism sector is the weighted average of the employment
coefficient of the different subsectors that forms the composite sector or the economy.
6.01 Summary
The present study is exploratory in nature based on survey method.
Quantitative as well as qualitative information from primary and secondary sources
were gathered for the study. The methodology of the study is designed in such a
manner to arrive at inferences based on collection and analysis of quantitative

93
information through interview schedules and qualitative information through
responses gathered from knowledgeable persons through interactive sessions.
The report of this study is presented in a well structured format consisting of
six chapters.
The first chapter deals with objectives of the study, statement of the problem,
scope of the study, methodology and hypothesis.
The second chapter gives the details of an extensive literature survey
specifying quotations from various books, articles, thesis, bulletins and websites. To
have an indepth knowledge in the subject matter a detailed analysis of the available
literature has been done, inferences arrived from the analysis of the secondary data
reveals a clear cut picture about subject matter related to the study.
The third chapter gave an idea about the nature of tourism, employment
opportunity in different sectors of tourism, Entrepreneurship Development
Programmes etc in tourism sectors. Different strategies were adopted in the study for
estimation of man power, human resources development, employment and
generation.
The fourth chapter deals with the analysis and interpretation. The profile
of stake holders were reviewed and analysed here extensively. Statistical test like
percentages, chi-square and F test were used in the study for data analysis to arrive at
inferences.
The fifth chapter describes details regarding analysis of income and
employment generation models for tourism development and human resource
development. The employment co-efficient model and the input output models were
developed to measure and project the future to measure employment potential of the
state. Employment coefficient is computed for all tourism sectors and subsectors to
ascertain the volume of employment in that sector and in the tourism sector as a
whole.

94
6.02 Findings
The researcher has ascertained the following findings as the outcome of the study.
1. Age wise classification revealed that 31% of the stake holders belong to the
category of 41-60 years of age of group.
2. 55 percent of the total stake holders engaged tourism sector are males.
3. 34% of stake holders belongs to married category.
4. Regarding the level of education 44 percent of the stake holders are post
graduates.
5. 34 percent of the stake holders are fully employed in tourism sector.
6. 39 percent of the stake holders earns from tourism, thirty to forty thousand
rupees per month on an average.
7. 37 percent respondents prefers eco-tourism where as 35 percent prefers
backwater tourism as the most attractive tourism activity.
8. 75 percent of stakeholders are providers of ayurvedic resorts service, 64
percent are provides backwater tourism service and 57 percent are providers of
mansoon tourism related service.
9. 42 percent of the stakeholders are employed in tourism industry as tour
operators, 39 percent as head load workers and 37 percent as providers of
home stay facility.
10. 66 percent of stake holders are of opinion that Governtment support is needed
for inclusive development in tourism industry and 56 percent states that
tourism industry can only be developed with community participation.
11. Among the stakeholders, 69 percent from eco tourism, 56 percent from
backwater tourism and 58 percent from beach tourism earns an income of Rs
10, 000 to Rs 50, 000 annually.

95
12. Regarding volume of employment 71 percent of the local people said that they
are employed in beach tourism, 82 percent in eco tourism and 88 percent in
back water tourism.
13. Regarding the reason for success of tourism industry 76 percent stake holders
in beach tourism, 85 percent in ecotourism and 80 percent in backwater
tourism expressed it as low capital investment with high returns.
14. The volume of employment opportunity from different sectors of tourism was
found uniform.
15. The volume of total income generated from tourism in Kerala in 2013
increased to 22, 927 crores rupees from Rs 4500 crores in 2001.
16. The income from tourism for the period under review revealed a fluctuating
trend of 7 percent to 40 percent. This variation was due to variation in the
volume of tourist inflow to the state due to regional, national and international
factors.
17. The volume of domestic tourists arrival to the state in the year 2013 was
108.58 lakhs as against 50.13 lakhs in 2000. Over a period of 14 years, there
was a two fold increase in the volume of domestic tourist inflow.
18. The volume of foreign tourist inflow to the state for the period increased in
2013 to 8.58 lakhs as against 2.09 lakhs in the year 2000. The growth in the
inflow of foreign tourists during the period was fourfold as against the two
fold increase in the volume of domestic tourists inflow.
19. Tourism is a seasonal activity; the tourist season of the state extends from
September to June every year and the maximum number of foreign tourists
prefers to visit the state during Christmas and New Year vacation period.
20. The projection on income and employment in this study was made for a period
of 12 years extending from 2014 to 2025.During this period the estimated
volume of income from tourism was 1, 19, 750 crores rupees where as it was

96
only 26, 287 crores in 2014, which reveals a four and a half times increase
(450%).
21. Employment co-efficient index was used to predict the future employment
potential of tourism industry of the state. It showed a declining trend. This was
due to the cost reduction and labour saving techniques adopted by the stake
holders. This index declined to 85 in 2025 as against 140 in 2002. The overall
decrease in the employment coefficient for the study period was estimated as
55 persons per rupees one crores of value added.
22. The projection reveals that tourism industry will make tremendous growth rate
for the projected period of 24 years. By 2025 the volume of employment
opportunities in tourism sector of the state will be 101.92 lakhs as against 6.90
lakhs in 2002 .This increases will be to the tune of 14.77 times for the
projected period.
23. Two models were developed in the study to project the employment potential
from tourism industry of the state. The graphical model is the first one that
describes the input output relationship at the macro level and the second the
mathematical model i.e. the employment co-efficient model that describes the
correlation between income and employment. These two models having equal
importance, were used as tools for projection of employment potential from
tourism industry of the State.
24. All the existing stakeholders were perceived as entrepreneurs of tourism
industry. Hence all efforts on the part of entrepreneurs to develop their
business are treated as entrepreneurship Development Programmes.
25. Employment and income effect are closely, but not perfectly correlated,
26. The effects of tourism employment between different tourism activities are
found to be uniform.
27. Many stakeholders are self employed, particularly in destinations where
tourism enterprises are small.

97
28. Destination development leads to increased tourist inflows which in turn
results in generation of additional income and employment opportunities to the
State.
29. Entrepreneurship Development Programmes leads to tourism development and
employment generation.
30. Tourism employment were found as low-wage occupations, part-time and
casual,
31. Tourism employment requires low skill levels and low entry requirements. In
areas were specific skills are required, particularly in poorly developed
destinations, the industry often turns to outside expertise rather than provide
training for local people.
32. Tourism employment is strongly seasonal
33. People migrate from other sectors in offseasons to tourism segment in search
of employment.
34. Tourism employment is structured by gender; the majority of jobs in most
tourism tasks are held by women, particularly the low-paid, part-time and
seasonal positions
35. Tourism facilitates to improve the livelihood and standard of living of the
locals at destinations
Tourism as a major social and economic activity of the day leads the state to attain
rapid economic growth. High level of human involvement leads to man power
development and delivery of services in this smokeless industry. The efficacy of
Manpower Planning and Management are the basic elements which determines the
success behind any type of human activity. In tourism sector, the scope and potential
of economic development and employment generation is unpredictable. In the state of
Kerala manpower planning is an effective tool which can be deliberately used by
planners and policy makers to solve the crucial problem of unemployment. The

98
present study was an effort on the part of the researcher to develop a tool to be used as
a model for manpower planning. The effort was succeeded and the researcher has
developed graphical and mathematical model to address these issues. As such the
potential of growth in employment generating capacity of the tourism segment was
predicted by the researcher on the topic of employment generation through
Entrepreneurship Development in tourism sector an evaluative study in the state of
Kerala.

99
CHAPTER-VII
PROPOSED ACTION PLAN FOR TOURISM
DEVELOPMENT IN THE STATE
Proposals for employment generation through entrepreneurship development in
tourism sector
Project ideas:
1. Establishment of ethnic cusinies at Kovalam , Varkala, Bekal and
Payyambalam.
Objectives: to provide Kerala style traditional food at affordable rate to tourist both
domestic and foreign.
Projected Operational areas: Kovalam, Varkala, Kappadu at Kozhikodu,
Payyambalam at Kannore and Muzhuppilangad at Thalasseri.
Mode of operation: public private partnership, joint ventures or projects associated
with NGO’S, Kudumbasree units etc.
Two such ethnic food corners were successfully operating in Kerala at present
as part of responsible tourism, one at Edakkal caves and the other at the premises of
Pookkot Lake, with the active involvement of the tribal community. Ethnic,
indigenous and delicious foods and snacks are served to the tourists, there. These
projects are operationally successful in these two localities. Here the modalities of
these projects can be copied to other destinations also.
Benefits-
1. Provides employment opportunities to the local people
2. Serves the tourist in the traditional style

100
3. Tourist can experience the taste of traditional Kerala dishes in its original form
4. Share the benefit of tourism with the local people
5. Leads to entrepreneurship development,
6. Leads to women empowerment
Scope and potential
There is ample scope to start two to five units of each such projects in the proposed
destinations.
Material requirement: Provide landed property owned by local bodies; Corporations
and Municipalities on rental basis to start these units.
Required man power: 10 to 20 persons per unit
Employment generation capacity: 20 to 100 persons per destination
Nature of employment opportunities:
1. Direct employment: Cooks, hotel boys, cleaners, waiters, accountants,
administrative staff.
2. Indirect employment: Fish vendors, vegetable sellers, head load workers, taxi
drivers, construction workers, plumbers, painters etc.
3. Induced employment: Agriculturist, fruit growers, fisher man, farm workers,
manufacturers of fertilizers and pesticides.
Financing: Arrange or provide financial assistance to these units by the state or
through financial institutions on government guarantee.
2. Training and Quality enrichment programme to the employees of tourism
destinations

101
The quality of the personnel services associated with hospitality industry in
Kerala is not up to the standard. Tourist both domestic and international often
complaints about the attitude, approach and behavior of the service personnel in
tourism sector .Schemes for providing proper training programmes to enrich their soft
skills and quality up gradation can do a lot to increase the level of tourists satisfaction
and thereby increase the volume of tourist inflow. Soft skill development programmes
is a must to taxi drivers, autoriksha drivers and head load workers of Kerala. In
addition to that programmes to develop multilevel skills to personnel associated with
this industry can make a lot of developments in this segment. If proper training is
given to a taxi driver to act in the role a tourist guide will empower and enhance his
skills at multilevel.
The service of trainers from tourism department can be sought in this regard.
Programmes should be chalked out to provide destination based monthly training
programmes to stakeholders, on a permanent basis. The responsibility to organize
these programmes shall be entrusted to a tourism related agency or to a Govt. agency.
Procedure for registration of members, issue of identity cards, and giving certificates
and accreditations to them, describing their skills with Govt. approval will improve
the skill and quality of tourism related personnel.
At least 100 persons per destination should be selected as beneficiaries of this
programme and training should also be provided to them. By selecting at least 200
such destinations under this scheme, twenty thousand persons (200x100=20 000)
beneficiaries will get benefit of this programme all over the state. All the operations
related to this programme should co-ordinate and evaluated under a state level
agency. The financial aspects of this scheme should be provided by the state Govt.,
either by making available the required fund through budgetary allocations, or
through private firms or sponsors.
4. Formation of ancient model of a traditional Kerala village
Tourists both domestic and foreign and younger generations are not familiar
with the old and traditional life style of Keralites. Equipments and household

102
appliances like ancient weighing machines, household equipments, agricultural
equipments and a lot of other instruments used in houses of Kerala are not familiar to
them. Kerala model traditional houses like Nalukettu and Ettukettu are no where there
in the state now a day. Besides, the dress code of the different communities of Kerala
is not familiar to the new generations which will also attract the curiosity of the
tourists. A project to reconstruct an ancient Kerala model village, will be highly
informative and attractive the tourists. This type of projects will increase the inflow of
tourist to the destinations, and create more employment opportunities to the locals and
more revenue to the state.
Operationally, such ideas will be more viable and such schemes can be
implemented with the help of private promoters or through joint ventures. The
material requirement for such model village can be met with the help of heritage
museums .The estimated manpower requirement for each such a village is around 100
persons. As the first step, the tourism department can launch programmes to start one
such model villages each in the fourteen districts of Kerala, so that 1400 new
employment opportunities can be generated in this segment. The Govt., tourism
department or Govt. sponsored financial institutions or private promoters can
undertake the responsibility of implementing such projects.
5. Rope way system at hill stations and pilgrimages
Taking ride in a cable car is the best way to see and experience the virgin beauty of a
forest, a pilgrim centre or a historical monument. As most of the pilgrim centres and
hill stations in Kerala are located in hill tops cable car systems can be used as a better
system of transportation for site seeing and pilgrimage. It neither destroys the
environment, nor obstructs the land scape at the destinations. The rope car system
operating successfully at Palani temple for the benefit of the devotees can be adopted
as a model which can be implemented at lot of destinations in Kerala like Sabarimala,
Munnar, Agasthyarkootam etc. In India this facility is available at a lot of destinations
like Raigad in Maharashtra (Shivaji’s capital) Manali in Himachal Pradesh and
Chanda devi temple in North India.

103
Employment opportunities
Direct: equipment manufacturering companies, operators, station managers, security
staff etc.
Indirect: local residents, street vendors, tourist guides, taxi drivers, snack bar owners,
hoteliers.
Induced: power supply companies, painters, head load workers, plumbers,
maintenance staff etc.
6. Introduction of caravan services to the tourists at destinations
Caravan is a unique tourism product, which promotes family oriented tours in
destinations not having adequate hotel accommodation and transport facilities. Built-
in vehicles are used for the purpose of travel, leisure and accommodation .The
essential pre-requisites for Caravan tourism is the presence of sufficient Caravan
Parks in the identified circuits. A Caravan Park is a place where Caravans can stay
overnight in allotted spaces providing basic or advanced amenities and facilities.
The vastness and multitude of landscapes in India, Caravans and Caravan
Parks can add an exciting new facet to tourism. The initial demand in this niche
segment is expected to come from domestic tourists and then from the inbound
tourists. The growing demand for eco, adventure, wildlife and pilgrimage tourism,
necessitates the need for visiting and staying in remote areas like forests, deserts and
riversides. There is already acute shortage of accommodation at tourist destinations,
especially in remote areas and at places where a permanent construction may neither
be permissible nor feasible. In such areas, Caravan Tourism can effectively meet
the growing demand, by ensuring adherence to quality standards and safety
norms. Caravan Tourism would attract a wide range of customer segments including
young people, families, senior citizens and international tourists.

104
The Operational requirements for the Caravan parks
i. Caravan Parks should be made operational round the clock (24 x 7) during
tourist seasons
ii. Caravan Parks has to be connected by fair-weather road from the main road
iii. Caravan Parks has to avail all necessary trading licenses from concerned
authorities
iv. Standardization of electricity, water and sewage connections to ensure total
compatibility with Caravan specifications in India.
v. The parks could be standalone or hybrid. In case of hybrid parks, the caravan
parking facilities and related services should be physically separated and be
away from other services like wayside amenities, restaurants, general vehicle
parking or accommodation .
In most European countries caravan facilities on rental basis is available to the
tourists at most of the destinations. There is ample scope for the introduction of such
innovative ideas at tourists’ destinations of Kerala too. It can solve the twin issues of
lack of accommodation and transportation problem to tourists at destinations. To
make this idea operationally feasible, Govt. can initiate financial institutions to grant
the required funds to local entrepreneurs at subsidized rates. It will result in
enhancement the employment opportunities to the locals and income to the Govt. and
increased inflow of tourists to the destinations.
Type of employment opportunities generated from the project
Direct: Drivers, cleaning staff, guards, tourist guides, cooks etc.
Indirect: Banks, internet cafes, garment manufacturers, artisans etc.
Induced: Farmers, mechanics, photographers, spare part dealers, locals etc.
7. Tram car service at hill stations

105
A lot of hill stations are there spread all over the western ghat of Kerala
situated at high altitudes. Many of pilgrims centres of Kerala are located at hill
stations .Eg:Sabarimala, Agasthiakoodam, Anamudi, Jatayu para etc. Travelling in
tram car should be an adventurous experience to both domestic and foreign tourists.
This facility can also be introduced at the dense forests areas and eco-tourism centers
of Kerala. Tourist can experience and enjoy the natural beauty of the evergreen forest
of Kerala by travelling in tram cars through these areas without damaging the
environment. There is also an element of adventure in this type of tourism activity.
The equipments and facilities can be rendered to promoters by associating with
agencies of international repute on BOT or BOOT basis. A lot of employment
opportunities can be generated to the locals and revenue to the state through this
project without any capital commitment on the part of the state or tourism department.
8. Home stays facilities at destinations
It is ascertained from discussion with the stakeholders that sufficient number of
home stay facilities are not available at peak seasons to tourists near eco-tourism and
backwater destinations. It is found that most of the tourists prefer to use home stay
facilities mainly because are interested to interact with the locals and to experience
about, their way of life and the family system prevailing here.
Objectives
1. To provide cheap and homely accommodation to tourists(a home away from
home)
2. To provide opportunity to the tourist to know and understand the life style of
the locals.
3. To know about the family system prevailing here.
Required steps to be taken by the authorities
1. Renovate Grihasthali units sponsored by government and tourism department.

106
2. Train the locals to communicate and interact with the tourist on diplomatic
level.
3. Adapt steps to ensure the safety and quality of the home stays through
certification or grading process administered by government agency or
tourism department.
4. Provide technical and financial assistance by tourism or government agencies
to the providers of home stay facilities to enrich and modernize their services.
Benefits
1. It will enhance the standard of living of the people at the locality and leads
to their economic empowerment.
2. Leakage of income from destination to outside regions can be restricted to a
certain extend.
3. Increases the employment opportunity of the local people.
4. Increases the demand for the local products which leads to multiplier effect
of income at the destination.
5. Empowerment of local tradition through interaction and cultural exchange.
6. Attraction of more tourists to the destination due to improvement in
infrastructure and related other service facilities.
9.Project to enhance water sports facility at destinations
There is ample scope for providing water sports recreation facilities to tourists
at the beaches and backwater destinations of Kerala .At present these facilities are
provided to tourists by private promoters and individuals at a limited scale. During
peak seasons sufficient number of equipment for surfing, speed boats, water bikes
and kettuvallams are not available in destinations in accordance with the
requirements. Arranging facilities to enhance the supply of such equipments by way

107
of promoting private individuals more employment opportunities can be generated to
locals and at the same time more water sports facilities to tourists. On an average 20-
30 people can get employment per destination for these activities in the state. Broadly
2000 to 3000 employment opportunities can be generated annually in this segment
through identifying a minimum number of one hundred (100) such water based
destinations in the state.
The following water sports projects can be made operational at suggested
destinations of the state based on the facilities and environmental peculiarities of that
region. Some of such activities operationally viable to the state are the following.
Beach related sports: wind surfing, dinghy sailing, scuba diving, water sking, para
sailing, water scooter and swimming.(destinations-Kovalam, Varkala, Kappadu and
Muzhuppilangadi)
Back water based sport items: rowing, canoeing, kayaking, boating, pedal boating,
coracling.(destinations-Kumarakom, Poovar, Ashtamudi, Pookkottu, and Alappuzha)
Kayacking and Coracling are very popular in the backwaters of Thungabhadra and
Kaveri at South India.
Employment opportunities likely to arise
Direct: crews in boats, service providers, operating staff, cleaners, servers of food
and beverage etc.
Indirect: carpenters, equipment manufacturers, painters, mechanics, spareparts
manufacturers
Induced: banks, financial institutions, local vendors, arts and art fact dealers, service
of local people for infrastructure development etc.
Govt or tourism department can take initiative to supply these equipments to young
entrepreneurs on subsidized rates or on rental basis.
10. Schemes to develop specialized entrepreneurs to promote pilgrim tourism

108
There is ample scope to develop tourism packages based on pilgrimage. Lakhs
of devotees visits sabarimala,Guruvayur , Maramon, Thrissur pooram and Theyyam
festivals every year. The tourism department can take initiatives to launch this type of
programmes on its own behalf or as joint ventures in PPP model. This programme has
to be planned in such a manner to serve the needs of at least one lakh tourists
annually. Funding of this project can be done with the help of private entrepreneurs or
through the help of Govt. sponsored financial agencies.
Employment opportunities
Direct: travel agents, tour operators, hoteliers, home stays, cleaners , cooks, helpers ,
administrative personnels, artisans, textile dealers, tourist guides, taxi drivers.
Indirect: farmers, masons, mechanics, plumbers, painters, weavers, doctors, banks,
net cafes, street vendors
Induced: local residents, financial institutions, local traders, manufacturers of all
types of consumer durables, sports associations, professional artists, educational
institutions, state etc.
11.Cultural events promotion programme Art, artifacts, souvenirs and
performing arts like Kathakali, Theyyam, Yoga, Sooryanamaskaram, Kalaripayattu,
Boat race, Folklores, and a lot of other types of events and health tourism products
like ayurveda, marmachikithsa etc. are here in plenty in the state, as part of
traditional lifestyle of the people. There is not a proper promotional programme or an
agency here till now, competent enough to market these products effectively. A group
of persons or firms can be empowered in this regard by imparting proper training and
motivation to them. If properly advertised these products can be marketed as tourism
packages to both foreign and domestic tourists.
10 entrepreneurs or firms destination wise shall be selected and trained in this regard.
An action plan to regenerate these cultural items and events can provide employment
opportunities for a minimum number of 100 artists or employees per destinations
representing different, art forms and cultural events. By inaugurating this programme

109
in 100 such properly identified destinations, ten thousand (10000) employment
opportunities can be generated in the state, annually.
Employment opportunities
Direct: Folklore artists, trainers of martial arts, performers of cultural events,
hotliers, home stays, helpers, taxi drivers, head load workers.
Indirect: Manufacturers of artistic items, ayurvedic resorts, hospitals, financial
institutions, local vendors, suppliers of agricultural products etc.
Induced: Mechanics, painters, locals, workers for infrastructure development,
manufacturers of food articles, manufacturers of items of comforts, electricians,
painters etc.
It is to be noted here that as the service of the private entrepreneurs are
superior in all types of tourism related activities, it is better to initiate and launch these
programmes as joint ventures or in PPP model rather than promoting these
programmes sponsored by tourism department or Government alone.
12. Development of micro and marginal enterprises at tourism destinations
To promote local participation at tourism destinations, especially at eco-tourism
centres of Kerala, the idea of promoting marginal and micro level enterprises can be
introduced in a successful manner. It may result in economic empowerment of the
local through entrepreneurship development. Micro level units can sell the items of
art, artifacts and crafts manufactured by the traditional craftsmen of the locality and
as well the traditional products of the state at tourism destinations resulting in
generating a lot of employment opportunities . A lot of micro and marginal enterprises
are there at destinations like Kovalam, Varkala and Kappadu, presently run by
residents of other states .It leads to a lot of leakages of income from the destinations
to outside regions. By promoting local entrepreneurs to start such micro business
units, with the help of financial institutions, this issue can be successfully resolved.
Employment opportunities

110
Direct: Promoters, their family members, local artisans, helpers, cleaners, head load
workers, taxi drivers and hoteliers.
Indirect: Building owners, carpenters, painters, cooks, tailors, local food vendors,
snack bar etc.
Induced: Locals, banks, financial institutions, IT parks, postal services, hospitals,
educational institutions etc.
13. Project to provide toilet and other basic amenities to the tourist at
destinations
There is a not sufficient facility to the tourists to fulfill their basic amenities at
most of the destinations in Kerala. To provide such facilities the service of
Kudumbasree mission or other type of NGO’s can be sought, that can be
administered in PPP mode. It will enhance the employment opportunity of the local
people and satisfaction level of tourist which will induce them to visit the locality
again. Mobile toilet units can be tried in this regard.
In Kovalam, where thousands of internal tourists visits daily, two toilets are
there, which is located at very far and at a remote area. It creates a lot of
inconvenience to the tourists especially to females. At present one mobile toilet unit is
there which provides inadequate and irregular service at pay and use method. There is
ample scope for such units, mobile or permanent, in all tourism destinations of Kerala.
Employment opportunities
Direct: Drivers, cleaning staff, facilitator.
Indirect: As the cleanliness of the area improves new micro snack or handicraft units
can be started in that area which would otherwise not possible because of the usage of
that area as informal toilet by the tourists.

111
Appendix-I
BIBLIOGRAPHY
1. A Guide Book on The Hill Palace, The Institute of Archaeology Art History,
Conservation and Museology, Thiruvananthapuram, 2002.
2. Alonso-Almedia, M. D., 2012. Water and waste management in the Moroccan tourism
industry: The case of three women entrepreneurs. Women Studies International
Forum, 35, pp. 343-353.
3. ANON. 1998. A Gallery of how the world works. http:// studsys.
mscs.mu.edu/~cheung /Page. dir/pg.metaworld1.html
4. Anurag Fadia, (2009), International Trends in Nature Based Tourism, Cyber Tech
Publications, New Delhi, pp.3,4 & 254.
5. Arun Monappa, Mirza Saiyadain, Personnel Management, Tata Mc Graw Hills
Publishing Co. Ltd., New Delhi, 1996.
6. Bansal.S.P., Prashant Gautam Sonia, Sushama & Chander Mohan, (2007), (Eds),
Cutting Edge Research in Tourism New Directions, Abhishek Publications,
Chandigarh, pp.3-5.
7. Bengtsson, M., Boter, H. & Vanyushyn, V. 2003. “The challenge of building
marketing channels via the Internet”. International Council for Small Business
(ICSB) 2003 conference, 15-18th June 2003. Belfast, Northern Ireland.
8. Buhalis, D. (2000). Marketing the competitive destination of the future. Tourism
Management, 21, 97-116.
9. Choy, D. (1995), The quality of tourism employment, in Tourism Management, vol.
16, no. 2, p. 129-137.
10. Clare.A.J Gunn, Taylor, Francis, Tourism Planning, New York, 1988.

112
11. Districts of Kerala – Alappuzha, Department of Tourism, Government of Kerala.
12. Districts of Kerala – Ernakulam, Department of Tourism, Government of Kerala.
13. Districts of Kerala – Idukki, Department of Tourism, Government of Kerala.
14. Districts of Kerala – Kannur, Department of Tourism, Government of Kerala.
15. Districts of Kerala – Kasargode, Department of Tourism, Government of Kerala.
16. Districts of Kerala – Kollam, Department of Tourism, Government of Kerala.
17. Districts of Kerala – Kottayam, Department of Tourism, Government of Kerala.
18. Districts of Kerala – Kozhikkode, Department of Tourism, Government of Kerala.
19. Districts of Kerala – Malappuram, Department of Tourism, Government of Kerala.
20. Districts of Kerala – Palakkad, Department of Tourism, Government of Kerala.
21. Districts of Kerala – Pathanamthitta, Department of Tourism, Government of
Kerala.
22. Districts of Kerala – Thiruvananthapuram, Department of Tourism, Government of
Kerala.
23. Districts of Kerala – Thrissur, Department of Tourism, Government of Kerala.
24. Districts of Kerala – Wayanad, Department of Tourism, Government of Kerala.
25. Evans, M. R., Fox, J. B., & Johnson, R. B. (1995). Identifying competitive strategies
for successful tourism destination development. Journal of Hospitality and Leisure
Marketing, 3(1), 37-45.
26. FAYOS-SOLá, E. 1996. Tourism Policy: a midsummer night’s dream? Tourism
Management. 17:6, pp 405-412. Britain: Elsiever Science Ltd.
27. Gulab Nabi, Socio Economic Impact of Tourism, Pointer Publishers, Jaipur, 2000.
Man Power Requirements in Tourism

113
28. Gunn, C. A. (1994). Tourism Planning (3rd ed.). New York: Taylor and Francis.,
Pearce, D. (1997). Competitive destination analysis in South east Asia. Journal of
Travel Research, 35 (4), 16-24.
29. Gupta, V., MacMillan, I.C. & Surie, G. 2004. “Entrepreneurial leadership:
Developing and measuring a cross-cultural construct”, Journal of Business
Venturing, 19: 241-260
30. Hart, C., Doherty, N. & Ellis-Chadwick, F. 2000. “Retailer adoption of the Internet -
Implications for retail marketing”, European Journal of Marketing.
31. Hassan, S. S. (2000). Determinants of market competitiveness in an environmentally
sustainable tourism industry. Journal of Travel Research, 38 (February), 239-245.
32. Hjalager, Anne-Mette ( 2009) “A Review of Innovation Research in Tourism”.
Forthcoming in Tourism Management
33. Holland, Jenny; Burian, Michael; Dixey, Louise (2003). Tourism in Poor Rural
Areas: Diversifying the product and expanding the benefits in rural Uganda and the
Czech Republic. Economic and Social Research Unit (ESCOR) of the UK Department
for International Development (DFID).
34. Holloway, Christopher.K, The business of Tourism, Pitman, London, 1990.
35. Hu, Y., & Ritchie, J. R. B. (1993). Measuring destination attractiveness: A contextual
approach. Journal of Travel Research, 32(2), 25-34.
36. Inkeep, E. (1991). Tourism planning: An integrated and sustainable development
approach. New York: Van Nostrand Reinhold., Go, F. M., & Govers, R. (2000).
Integrated quality management for tourist destinations: A European perspective on
achieving competitiveness. Tourism Management, 21, 79-88.
37. John Bratton, Jefferey Gold, Human Resource Management, Palgrave Macmillan,
2003.

114
38. Karan Singh, Indian Tourism – Aspects of Great Adventure, Department of
Tourism, 1980.
39. KELLER, P. and KOCH, K. 1995. Die globalisierung des toursimus. Eine
Herausforderung für die schweiz als traditionelles tourismusland. Die Volkswirtschaft
(68):5.
40. L.M.Prasad, Human Resource Management, Sulthan Chand & Sons, New Delhi,
2003.
41. Lashley, Conrad 2000 “In Search of Hospitality: Towards a Theoretical
Framework”. Hospitality Management, 19: 3-15
42. Leela Shelley, Tourism Development in India – A study of hospitality Industry,
Pointer Publishers, Jaipur, 1991.
43. Levitt, Theodor (1969) “Marketing Myopia”. Harvard Business Review, july/august:
3-13
44. Lynch , P . and Morrison , A . (2007) “The Role of Networks”, in Michael, E. (ed.),
“Micro-Clusters and Networks: The growth of tourism”, Elsevier, London .
45. Lynch , P . and Morrison , A . (2007) “The Role of Networks”, in Michael, E. (ed.),
“Micro-Clusters and Networks: The growth of tourism”, Elsevier, London .
46. MANSOURIFAR, Mohammad(2010). Investigate Tourism Industry Development
Barriers in MAZANDARAN. MAZANDARAN, SARI: SHELPHIN Press, 2010, 978-
600-100-103-1.
47. Mary.L.Tanke, Human Resource Management for Hospitality Industry, Clemar
Publications,
48. Mirza S Saiyadain, Human Resource Management, Tata Mc Graw Hill Publishing
Co. Ltd., New Delhi, 1998.

115
49. Morrison , A . , Lynch , P . and Johns , N . (2004) „ International Tourism Networks ‟
, International Journal of Contemporary Hospitality Management,16, 3, 198 – 204 .
50. Murphy, P. E. (1985), Tourism: A community approach. NewYork: Methuen.
51. NCAER (2006) Tourism Satellite Account for India, National Council for Applied
EconomicResearch, New Delhi
52. Newall, J. E. (1992). The challenge of competitiveness. Business Quarterly, 56, 94-
100.
53. P.S.Daver, Personnel Management and Industrial Relations in India, Vikas
Publishing House, New Delhi.
54. Parra Lopéz, Eduardo; Buhalis, Dimitrios; Fyall, Alan (2009).Entrepreneurship and
Innovation in Tourism.PASOS.Revista de Turismo y Patrimonio Cultural.ISSN 1695-
7121.
55. Ravi Bushan Kumar, Coastal Tourism and Environment, APH Publishing
Corporation, New Delhi, 1995.
56. Ritchie, J. R. B.,& Crouch, G. I. (2000). Are destination stars born or made: Must a
competitive destination have star genes? In 2000 TTRA Annual Conference
Proceedings (pp. 306- 315).
57. Roscnow, John.E, Tourism – the Good, the Bad and the Ugly, Century Three Press,
Loncoln, Nebraska, 1979.
58. SAAYMAN, A. & SAAYMAN, M. Tourism and the South African economy: growing
opportunities for entrepreneurs. 10th annual SAESBA conference, Victoria Falls,
Zimbabwe. 27-29 April 1997.
59. Saayman, M &Saayman, A. 1998. Tourism and the South African Economy: Growing
Opportunities for Entrepreneurs. African Journal for Health, Physical Education,
Recreation and Dance.Vol5:1.

116
60. SAAYMAN, M. 1998. The impact of globalisation on tourism in Africa. Paper
presented at the World Leisure and Recreation Conference. Sao Paulo, Brazil. 26-30
October 1998.
61. Schumpeter, Joseph 1934 The Theory of Economic Development. Oxford: Oxford
University Press
62. Sharpley, R., & Telfer, D. (2002). Tourism and development. Clevedon: Channel View
Publications.
63. Shaw, Gareth & Williams, Allan M. 1998 “Entrepreneurship, Small Business Culture
and Tourism Development”. In Ioannides, Dimitri & Debbage, Keith (Eds):
Economic Geography of the Tourist Industry: A Supply Side Analysis (235-255).
London: Routhledge
64. Skokic, Vlatka& Morrison, Alison (2010). Tourism and hospitality entrepreneurship,
social setting and research methodology: movinginto the beyond. Guildford:
University of Surrey, School of Management
65. Sundbo, Jon 2009“Innovation in the Experience Economy: A Taxonomy of Innovation
Organizations”. The Service Industries Journal, 29(4): 431-455
66. The Essential Kerala, Department of Tourism, Government of Kerala.
67. The Snake Boat Race of Kerala, Department of Tourism, Government of Kerala.
68. Tinsley , R . and Lynch , P . (2001) “Small Tourism Business Networks and
Destination Development”, International Journal of Hospitality Management , 20 , 4 ,
11 – 14 .
69. Tourist Statistics 2008, Department of Tourism, Government of Kerala, 2008.
70. UNWTO (2012), UNWTO Tourism Highlights. Madrid: UNWTO
71. Vinay chauhan and Savidha Khanna, (2007), “Tourism Infrastructure Vis-à-vis
Tourist satisfaction- A Case of Jammu and Kashmir”, In Bansal.S.P, Prashant

117
Gautam Sonia and Others, (Eds), Cutting Edge Research in Tourism New Directions,
Abhishek Publications, Chandigarh, p 456.
72. Wall, G., & Mathieson, A. (2006), Tourism: Change, impacts and opportunities.
Essex: Pearson Prentice Hall
73. Wennekers, S. and Thurik, R., 1999. Linking entrepreneurship and economic growth.
Small business economics, 13 (1), 27_55.
74. Wickham, Philip A. 2004 Strategic Entrepreneurship. 3rd Edition. Essex: Pearson
Yin, Robert K.
75. WTTC (2006) Progress and Priorities 2006/07, Annual Report, The World Travel &
Tourism Council, London.. NCAER (2006) Tourism Satellite Account for India,
National Council for Applied Economic Research, New Delhi
76. WTTC (2006) Progress and Priorities 2006/07, Annual Report, The World Travel &
Tourism Council, London.