
Project Name : Yangon River Survey Project Borehole No....
30
Pasundaung Creek Bago River Near Monkey Point Upstream of Yangon River Thilawa Area ~ ~ ~ ~ ~ Moisture Content w % 81.36 73.28 25.74 28.98 24.52 Bulk Density r t g/cm 3 - - - - - Atterberg's Liquid Limit WL % 52.70 45.80 - - - Limit Plastic Limit WP % 24.76 23.55 - - - Plasticity Index IP 27.94 22.25 - - - Grain Gravel, (76.20 ~ 4.75) mm % - - 2.31 0.55 - Size Sand, (4.75 ~ 0.075) mm % 9.38 2.28 92.42 97.17 98.10 Analysis Silt, (0.075 ~ 0.005) mm % 64.63 71.73 Clay, (< 0.005 mm) % 26.00 26.00 Specific Gravity of Soil Gs (20˚C) 2.715 2.699 2.669 2.668 2.672 - - - - - - - - - - Unconfined - - - - - Compression - - - - - - - - - - - - - - - Sensitivity Ratio - - - - - Cohesion C UU kN/m 2 - - - - - Phi Angle f UU Degree - - - - - Cohesion C UU kN/m 2 - - - - - Phi Angle f UU Degree - - - - - Cohesion C' kN/m 2 - - - - - Phi Angle f' Degree - - - - - Cohesion C kN/m 2 - - - - - Phi Angle f Degree - - - - - Initial Void Ratio e 0 - - - - - Conso. Yield Stress P y kN/m 2 - - - - - Compression Index C c - - - - - NOTE Data used for reference are shown by red color. SUMMARY OF SOIL TEST RESULTS kN/m 2 Failure Strain % Project Name : Yangon River Survey Project Lean clay Fat clay Poorly graded sand with silt (or) Poorly graded sand with clay (or silty clay) q u SP-SM (or) SP-SC SP Group Symbol Poorly graded sand kN/m 2 Consolidated Undrained Triaxial Compression Test ( Measurement of Pore Pressure) Unconsolidated Undrained Triaxial Compression Test Direct Shear Test Soil Classification ( ASTM D 2487 - 06 ) Borehole No. Poorly graded sand Location : Consolidation Depth (m) Group Name 1.90 2.28 Sample No. CL Unconfined Compressive Strength CH e f 5.27 E 50 SP
Transcript of Project Name : Yangon River Survey Project Borehole No....

Pasundaung
CreekBago River
Near Monkey
Point
Upstream of
Yangon RiverThilawa Area
~ ~ ~ ~ ~
Moisture Content w % 81.36 73.28 25.74 28.98 24.52
Bulk Density r t g/cm3 - - - - -
Atterberg's Liquid Limit WL % 52.70 45.80 - - -
Limit Plastic Limit WP % 24.76 23.55 - - -
Plasticity Index IP 27.94 22.25 - - -
Grain Gravel, (76.20 ~ 4.75) mm % - - 2.31 0.55 -
Size Sand, (4.75 ~ 0.075) mm % 9.38 2.28 92.42 97.17 98.10
Analysis Silt, (0.075 ~ 0.005) mm % 64.63 71.73
Clay, (< 0.005 mm) % 26.00 26.00
Specific Gravity of Soil Gs (20˚C) 2.715 2.699 2.669 2.668 2.672
- - - - -
- - - - -
Unconfined - - - - -
Compression - - - - -
- - - - -
- - - - -
Sensitivity Ratio - - - - -
Cohesion CUU kN/m2 - - - - -
Phi Angle fUU Degree - - - - -
Cohesion CUU kN/m2 - - - - -
Phi Angle fUU Degree - - - - -
Cohesion C' kN/m2 - - - - -
Phi Angle f' Degree - - - - -
Cohesion C kN/m2 - - - - -
Phi Angle f Degree - - - - -
Initial Void Ratio e 0 - - - - -
Conso. Yield Stress Py kN/m2 - - - - -
Compression Index Cc - - - - -
NOTE
Data used for reference are shown by red color.
SUMMARY OF SOIL TEST RESULTS
kN/m2
Failure Strain %
Project Name : Yangon River Survey Project
Lean clayFat clay
Poorly graded
sand with silt
(or)
Poorly graded
sand with clay
(or silty clay)
qu
SP-SM
(or)
SP-SC
SPGroup Symbol
Poorly graded
sand
kN/m2
Consolidated
Undrained Triaxial
Compression Test
( Measurement of
Pore Pressure)
Unconsolidated
Undrained Triaxial
Compression Test
Direct Shear
Test
Soil Classification ( ASTM D 2487 - 06 )
Borehole No.
Poorly graded
sand
Location :
Consolidation
Depth (m)
Group Name
1.902.28
Sample No.
CL
Unconfined Compressive
Strength
CH
e f
5.27
E50
SP
Elephant PointElephant Point
Upper
( 10 km ) ( 4.80 km )
~ ~ ~ ~ ~
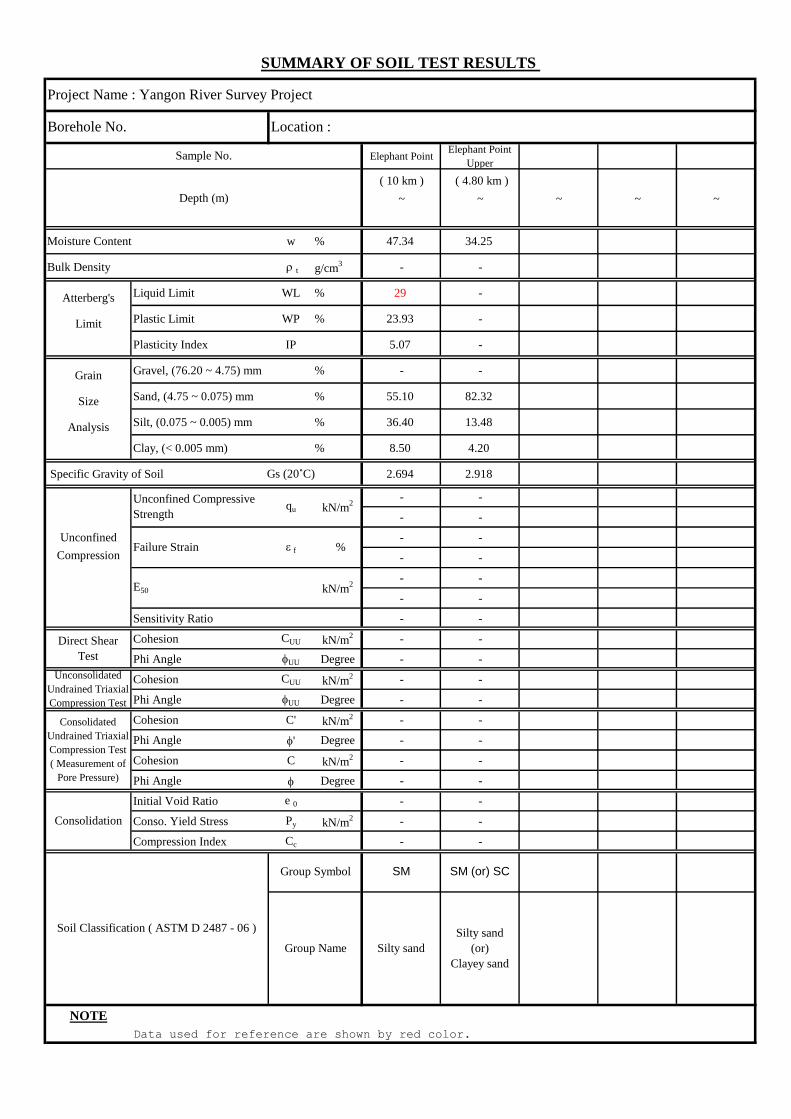
Moisture Content w % 47.34 34.25
Bulk Density r t g/cm3 - -
Atterberg's Liquid Limit WL % 29 -
Limit Plastic Limit WP % 23.93 -
Plasticity Index IP 5.07 -
Grain Gravel, (76.20 ~ 4.75) mm % - -
Size Sand, (4.75 ~ 0.075) mm % 55.10 82.32
Analysis Silt, (0.075 ~ 0.005) mm % 36.40 13.48
Clay, (< 0.005 mm) % 8.50 4.20
Specific Gravity of Soil Gs (20˚C) 2.694 2.918
- -
- -
Unconfined - -
Compression - -
- -
- -
Sensitivity Ratio - -
Cohesion CUU kN/m2 - -
Phi Angle fUU Degree - -
Cohesion CUU kN/m2 - -
Phi Angle fUU Degree - -
Cohesion C' kN/m2 - -
Phi Angle f' Degree - -
Cohesion C kN/m2 - -
Phi Angle f Degree - -
Initial Void Ratio e 0 - -
Conso. Yield Stress Py kN/m2 - -
Compression Index Cc - -
NOTE
Data used for reference are shown by red color.
Group Symbol SM SM (or) SC
Direct Shear
Test
Unconsolidated
Undrained Triaxial
Compression Test
Consolidated
Undrained Triaxial
Compression Test
( Measurement of
Pore Pressure)
Consolidation
Soil Classification ( ASTM D 2487 - 06 )
Group Name Silty sand
Silty sand
(or)
Clayey sand
qu kN/m2
Failure Strain e f %
E50 kN/m2
Unconfined Compressive
Strength
SUMMARY OF SOIL TEST RESULTS
Project Name : Yangon River Survey Project
Borehole No. Location :
Sample No.
Depth (m)

Project Name: Sheet No. 1 of 1 Date 21.08.15
Location: Classified by P P
Check by P P
Gravel (75.00 ~ 4.75) mm (%) - - 2.31 0.55 - - -
Sand (4.75 ~ 0.075) mm (%) 9.38 2.28 92.42 97.17 98.10 55.10 82.32
Silt (0.075 ~ 0.005) mm (%) 64.63 71.73 36.40 13.48
Clay < 0.005 mm (%) 26.00 26.00 8.50 4.20
Maximum Particle Diameter (mm) 2.00 2.00 19.00 9.50 4.75 2.00 2.00
Coefficient of Uniformity ( Cu ) - - 2.77 2.38 1.94 - -
Coefficient of Curvature ( Cc ) - - 1.56 1.20 1.24 - -
Liquid Limit (WL) (%) 52.70 45.80 - - - 29 -
Plastic Limit (WP) (%) 24.76 23.55 - - - 23.93 -
Plasticity Index (IP) 27.94 22.25 - - - 5.07 -
CH CL SP-SM (or) SP-SC SP SP SM SM (or) SC
2.28
Classified symbol (Group Symbol)
Silty sandClassified Soil Name (Group Name) Fat clay
Silty sand
(or)
Clayey sand
Unified Soil Classification
Poorly graded
sand
Pasundaung
Creek
Upstream of
Yangon River
Poorly graded
sand
Poorly graded
sand with silt
(or)
Poorly graded
sand with clay
(or silty clay)
Lean clay
Thilawa AreaElephant Point
( 10 km )
Elephant Point
Upper (4.80 km)
5.27 1.90
SOIL CLASSIFICATION
System of ASTM D 2487 - 06Borehole No.
Soil Classification System
Sample No. & Depth
Yangon River Survey Project
Bago RiverNear Monkey
Point
0
10
20
30
40
50
60
70
80
90
100
0.001 0.010 0.100 1.000 10.000 100.000
Per
cen
tage
Pas
sin
g (
%)
Particle Size D (mm)
GRADING CURVE
PasundaungCreek
Bago River
Near MonkeyPoint
Upstream ofYangon River
Thilawa Area
Elephant Point( 10 km )
Elephant Point Upper(4.80 km)
0
10
20
30
40
50
60
70
80
90
100
110
120
130
0 10 20 30 40 50 60 70 80 90 100 110 120 130 140 150 160 170 180 190 200
Pla
sticity
Index (
IP)
Liquid Limit (WL)
PasundaungCreek
Bago River
Elephant Point( 10 km )
CL-ML
ML OR OL
MH OR OH
PLASTICITY CHART
Equation of "A"-lineHorizontal at IP=4 to WL=25.5,then IP=0.73(WL-20)Equation of "U"-lineVertical at WL=16 to IP=7,then IP=0.9(WL-8)
47
16
Project Name Date
Location Operator
Borehole No.
I Calibration of Pycnometer
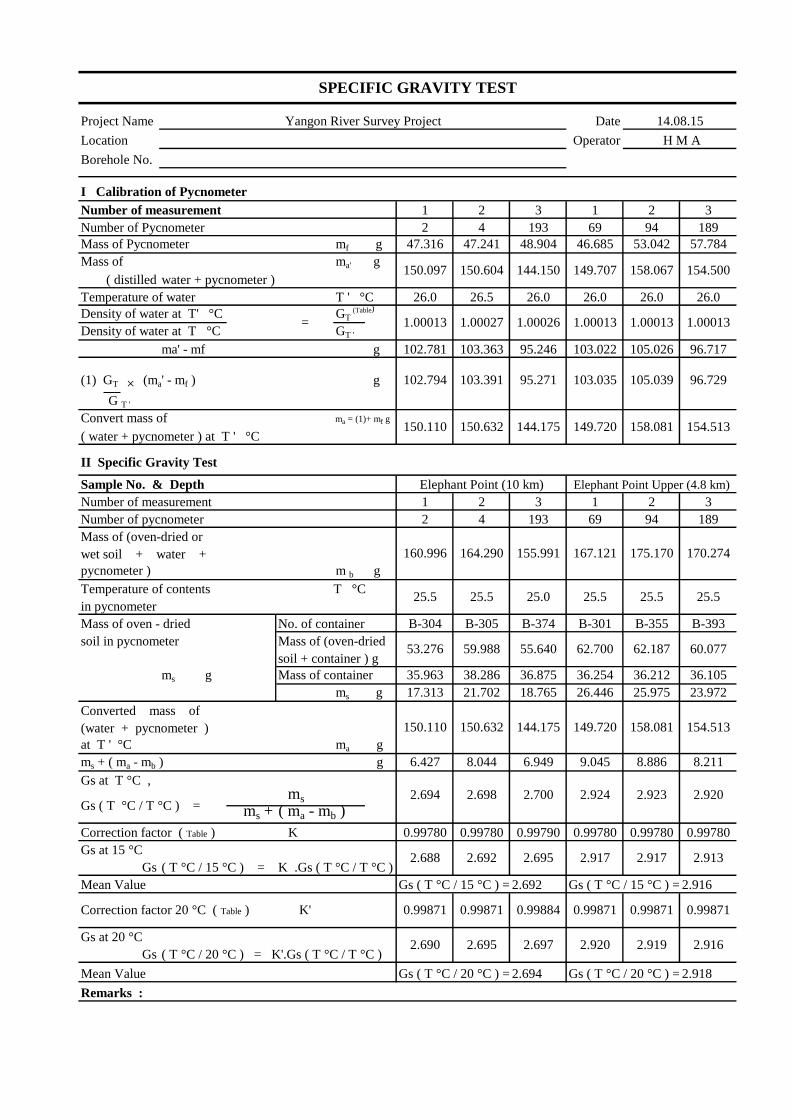
Number of measurement 1 2 3 1 2 3
Number of Pycnometer 2 4 193 69 94 189
Mass of Pycnometer mf g 47.316 47.241 48.904 46.685 53.042 57.784
Mass of ma' g
( distilled water + pycnometer )
Temperature of water T ' °C 26.0 26.5 26.0 26.0 26.0 26.0
Density of water at T' °C GT (Table)
Density of water at T °C GT '
ma' - mf g 102.781 103.363 95.246 103.022 105.026 96.717
(1) GT × (ma' - mf ) g 102.794 103.391 95.271 103.035 105.039 96.729
G T '
Convert mass of ma = (1)+ mf g
( water + pycnometer ) at T ' °C
II Specific Gravity Test
Sample No. & Depth
Number of measurement 1 2 3 1 2 3
Number of pycnometer 2 4 193 69 94 189
Mass of (oven-dried or
wet soil + water +
pycnometer ) m b g
Temperature of contents T °C
in pycnometer
Mass of oven - dried No. of container B-304 B-305 B-374 B-301 B-355 B-393
soil in pycnometer Mass of (oven-dried
soil + container ) g
ms g Mass of container 35.963 38.286 36.875 36.254 36.212 36.105
ms g 17.313 21.702 18.765 26.446 25.975 23.972
Converted mass of
(water + pycnometer )
at T ' °C ma g
ms + ( ma - mb ) g 6.427 8.044 6.949 9.045 8.886 8.211
Gs at T °C ,2.694 2.698 2.700 2.924 2.923 2.920
ms + ( ma - mb )
Correction factor ( Table ) K 0.99780 0.99780 0.99790 0.99780 0.99780 0.99780
Gs at 15 °C
Gs ( T °C / 15 °C ) = K .Gs ( T °C / T °C )
Mean Value Gs ( T °C / 15 °C ) = 2.692 Gs ( T °C / 15 °C ) = 2.916
Gs at 20 °C
Gs ( T °C / 20 °C ) = K'.Gs ( T °C / T °C )
Mean Value Gs ( T °C / 20 °C ) = 2.694 Gs ( T °C / 20 °C ) = 2.918
Remarks :
SPECIFIC GRAVITY TEST
14.08.15
H M A
Yangon River Survey Project
150.097 150.604 144.150 149.707 158.067 154.500
= 1.00013 1.00027 1.00026 1.00013 1.00013 1.00013
150.110 150.632 144.175 149.720 158.081 154.513
Elephant Point (10 km) Elephant Point Upper (4.8 km)
160.996 164.290 155.991 167.121 175.170 170.274
25.5 25.5 25.0 25.5 25.5 25.5
53.276 59.988 55.640 62.700 62.187 60.077
150.110 150.632 144.175 149.720 158.081 154.513
Gs ( T °C / T °C ) =ms
2.688 2.692 2.695 2.917 2.917 2.913
Correction factor 20 °C ( Table ) K' 0.99871 0.99871 0.99884 0.99871 0.99871 0.99871
2.690 2.695 2.697 2.920 2.919 2.916

Project Name Date
Location Operator
Borehole No.
I Calibration of Pycnometer
Number of measurement 1 2 3 1 2 3
Number of Pycnometer 198 199 200 80 112 113
Mass of Pycnometer mf g 42.792 56.970 48.673 46.477 50.093 48.473
Mass of ma' g
( distilled water + pycnometer )
Temperature of water T ' °C 26.0 26.0 26.0 26.0 26.0 26.0
Density of water at T' °C GT (Table)
Density of water at T °C GT '
ma' - mf g 93.909 97.066 100.513 102.718 105.391 102.055
(1) GT × (ma' - mf ) g 93.909 97.066 100.513 102.718 105.391 102.055
G T '
Convert mass of ma = (1)+ mf g
( water + pycnometer ) at T ' °C
II Specific Gravity Test
Sample No. & Depth
Number of measurement 1 2 3 1 2 3
Number of pycnometer 198 199 200 80 112 113
Mass of (oven-dried or
wet soil + water +
pycnometer ) m b g
Temperature of contents T °C
in pycnometer
Mass of oven - dried No. of container B-326 B-337 B-349 B-308 B-348 B-359
soil in pycnometer Mass of (oven-dried
soil + container ) g
ms g Mass of container 36.910 38.056 37.527 37.830 37.931 36.852
ms g 26.157 26.268 26.451 27.001 26.710 29.224
Converted mass of
(water + pycnometer )
at T ' °C ma g
ms + ( ma - mb ) g 9.787 9.827 9.898 10.113 9.992 10.931
Gs at T °C ,2.672 2.673 2.672 2.670 2.673 2.673
ms + ( ma - mb )
Correction factor ( Table ) K 0.99770 0.99770 0.99770 0.99770 0.99770 0.99770
Gs at 15 °C
Gs ( T °C / 15 °C ) = K .Gs ( T °C / T °C )
Mean Value Gs ( T °C / 15 °C ) = 2.666 Gs ( T °C / 15 °C ) = 2.666
Gs at 20 °C
Gs ( T °C / 20 °C ) = K'.Gs ( T °C / T °C )
Mean Value Gs ( T °C / 20 °C ) = 2.669 Gs ( T °C / 20 °C ) = 2.668
Remarks :
2.669 2.669 2.669 2.666 2.669 2.670
2.667 2.667
Correction factor 20 °C ( Table ) K' 0.99858 0.99858 0.99858 0.99858 0.99858 0.99858
Gs ( T °C / T °C ) =ms
2.666 2.667 2.666 2.664
136.701 154.035 149.185 149.195 155.484 150.528
63.067 64.324 63.978 64.831 64.641 66.076
26.0 26.0 26.0 26.0 26.0 26.0
Near Monkey Point Upstream of Yangon River
153.070 170.476 165.738 166.083 172.202 168.821
1.00000
136.701 154.035 149.185 149.195 155.484 150.528
= 1.00000 1.00000 1.00000 1.00000 1.00000
136.701 154.035 149.185 149.195 155.484 150.528
SPECIFIC GRAVITY TEST
14.08.15
H M A
Yangon River Survey Project

Project Name Date
Location Operator
Borehole No.
I Calibration of Pycnometer
Number of measurement 1 2 3 1 2 3
Number of Pycnometer 1 3 5 90 103 119
Mass of Pycnometer mf g 45.785 46.403 45.594 53.487 43.238 44.505
Mass of ma' g
( distilled water + pycnometer )
Temperature of water T ' °C 27.0 27.0 27.0 27.0 27.0 27.0
Density of water at T' °C GT (Table)
Density of water at T °C GT '
ma' - mf g 103.254 103.899 95.450 104.225 102.948 104.674
(1) GT × (ma' - mf ) g 103.281 103.927 95.488 104.253 102.976 104.702
G T '
Convert mass of ma = (1)+ mf g
( water + pycnometer ) at T ' °C
II Specific Gravity Test
Sample No. & Depth
Number of measurement 1 2 3 1 2 3
Number of pycnometer 1 3 5 90 103 119
Mass of (oven-dried or
wet soil + water +
pycnometer ) m b g
Temperature of contents T °C
in pycnometer
Mass of oven - dried No. of container B-331 B-370 B-371 B-322 B-324 B-354
soil in pycnometer Mass of (oven-dried
soil + container ) g
ms g Mass of container 36.363 36.296 36.463 36.808 36.940 36.964
ms g 12.465 14.225 14.865 15.141 15.881 15.311
Converted mass of
(water + pycnometer )
at T ' °C ma g
ms + ( ma - mb ) g 4.585 5.235 5.467 5.605 5.874 5.665
Gs at T °C ,2.719 2.717 2.719 2.701 2.703 2.703
ms + ( ma - mb )
Correction factor ( Table ) K 0.99770 0.99770 0.99780 0.99770 0.99770 0.99770
Gs at 15 °C
Gs ( T °C / 15 °C ) = K .Gs ( T °C / T °C )
Mean Value Gs ( T °C / 15 °C ) = 2.712 Gs ( T °C / 15 °C ) = 2.696
Gs at 20 °C
Gs ( T °C / 20 °C ) = K'.Gs ( T °C / T °C )
Mean Value Gs ( T °C / 20 °C ) = 2.715 Gs ( T °C / 20 °C ) = 2.699
Remarks :
SPECIFIC GRAVITY TEST
14.08.15
H M A
Yangon River Survey Project
149.038 150.302 141.043 157.712 146.186 149.179
= 1.00027 1.00027 1.00040 1.00027 1.00027 1.00027
149.066 150.330 141.081 157.740 146.213 149.207
Pasundaung Creek Bago River
156.946 159.320 150.479 167.276 156.220 158.853
26.0 26.0 25.5 26.0 26.0 26.0
48.828 50.521 51.328 51.949 52.821 52.275
149.066 150.330 141.081 157.740 146.213 149.207
Gs ( T °C / T °C ) =ms
2.712 2.711 2.713 2.695 2.697 2.696
Correction factor 20 °C ( Table ) K' 0.99858 0.99858 0.99871 0.99858 0.99858 0.99858
2.715 2.714 2.715 2.698 2.700 2.699

Project Name Date
Location Operator
Borehole No.
I Calibration of Pycnometer
Number of measurement 1 2 3 1 2 3
Number of Pycnometer 109 110 111
Mass of Pycnometer mf g 47.520 46.471 47.681
Mass of ma' g
( distilled water + pycnometer )
Temperature of water T ' °C 26.0 26.0 26.0
Density of water at T' °C GT (Table)
Density of water at T °C GT '
ma' - mf g 103.676 101.723 101.389
(1) GT × (ma' - mf ) g 103.676 101.723 101.389
G T '
Convert mass of ma = (1)+ mf g
( water + pycnometer ) at T ' °C
II Specific Gravity Test
Sample No. & Depth
Number of measurement 1 2 3 1 2 3
Number of pycnometer 109 110 111
Mass of (oven-dried or
wet soil + water +
pycnometer ) m b g
Temperature of contents T °C
in pycnometer
Mass of oven - dried No. of container B-380 B-394 B-399
soil in pycnometer Mass of (oven-dried
soil + container ) g
ms g Mass of container 37.047 37.456 36.242
ms g 25.339 26.206 25.700
Converted mass of
(water + pycnometer )
at T ' °C ma g
ms + ( ma - mb ) g 9.479 9.783 9.603
Gs at T °C ,2.673 2.679 2.676
ms + ( ma - mb )
Correction factor ( Table ) K 0.99770 0.99770 0.99770
Gs at 15 °C
Gs ( T °C / 15 °C ) = K .Gs ( T °C / T °C )
Mean Value Gs ( T °C / 15 °C ) = 2.670 Gs ( T °C / 15 °C ) =
Gs at 20 °C
Gs ( T °C / 20 °C ) = K'.Gs ( T °C / T °C )
Mean Value Gs ( T °C / 20 °C ) = 2.672 Gs ( T °C / 20 °C ) =
Remarks :
2.669 2.675 2.673
Correction factor 20 °C ( Table ) K' 0.99858 0.99858 0.99858
Gs ( T °C / T °C ) =ms
2.667 2.672 2.670
151.196 148.194 149.070
62.386 63.662 61.942
26.0 26.0 26.0
Thilawa Area
167.056 164.616 165.167
151.196 148.194 149.070
= 1.00000 1.00000 1.00000
151.196 148.194 149.070
SPECIFIC GRAVITY TEST
14.08.15
H M A
Yangon River Survey Project

Location
Borehole No.
Sample No.
& Depth
Pasundaung ma mb ma mb ma mb
Creek mb mc mb mc mb mc
mw ms mw ms mw ms 81.36 %
Bago ma mb ma mb ma mb
River mb mc mb mc mb mc
mw ms mw ms mw ms 73.28 %
Near ma mb ma mb ma mb
Monkey mb mc mb mc mb mc
mw ms mw ms mw ms w = 25.74 %
Point
Upstream of ma mb ma mb ma mb
Yangon mb mc mb mc mb mc
mw ms mw ms mw ms w = 28.98 %
River
Thilawa ma mb ma mb ma mb
Area mb mc mb mc mb mc
mw ms mw ms mw ms w = 24.52 %
Elephant ma mb ma mb ma mb
Point mb mc mb mc mb mc
mw ms mw ms mw ms w = 47.34 %
( 10km )
Elephant ma mb ma mb ma mb
Point mb mc mb mc mb mc
mw ms mw ms mw ms w = 34.25 %
Upper (4.8km)
No. ma mb ma mb ma mb
m mb mc mb mc mb mc
mw ms mw ms mw ms w = %
~ m
mw
ms
mass of moist soil and container (g)
mass of dried soil and container (g)
mass of container (g)
mass of moisture in soil (g)
mass of dried soil (g)
L-171 L-178 L-271
L-78 L-166 L-24983.39
L-52 L-173 L-179
L-177 L-175 L-247
No.
No.
65.29 52.54
L-54
L-224 L-243 L-31
L-47 L-5 L-115
45.61No.
w =
Operator
Yangon River Survey Project
9.36
29.63 62.74
w =24.29
34.59
101.73
47.23
No. No.
8.5835.85 33.22
9.97 72.10
%
72.10
24.80
34.79 33.65 34.30
47.3547.43
18.53 55.07
64.49
No.
8.77
51.66 43.08
28.87%
43.08 8.49
No.44.73 41.71
52.54 8.37
w =
12.75 44.17
14.80 57.88
25.57
81.75 66.95
66.95 9.07
w = %
57.26
65.61
14.64
25.57
No.w = %
52.92
53.25
13.09
53.50
44.73
29.46
44.44
w = %No.
8.81
49.78
w = %28.61
44.35
79.25
64.54
14.71
66.34
26.09
53.25
56.38
No.w = %
46.46
46.13 9.16 46.46 9.58
Measurement of Moisture ContentMean
moisturecontent
TEST FOR MOISTURE CONTENT OF SOIL
Project Name 13.08.15
E E W, Y L L M
Date
No No. No.74.35 44.84 76.04 46.13 76.54
L-168 L-134
29.51 36.16 29.91 36.97 30.08 36.88
44.84 8.68
w =
w = % w = % %81.61 80.90 81.56
74.79 46.51No.No.
46.51 7.90
73.74 46.65
46.65 9.68 45.61 9.51
72.08
w = %73.28
%
28.28 38.61
73.25
27.09 36.97
No.w = %
73.32 w =
w =
26.47 36.10
9.19
64.54 66.4581.09
66.45
No.No.
8.5752.92
12.69
8.16
63.33 8.26
63.33
No.% w =
w = % w = %No.
w = %
Remark: Moisture Content w = x 100 = x 100 (%)
w = %
68.59
61.39
71.36
%
No. No.
19.35 55.62
w = %
81.86
55.10
w =
8.49
No.68.59 71.36100.43
ms=
ma=
mb=
mc=
mw=
64.48
41.71
8.07
24.46
97.07
8.88
8.86
No.
29.07
8.54
28.48
w = % w = %
83.83 64.48
60.05
ma - mb
mb - mc
18.90
w = %
w = %
9.39
64.49
Project Name
Location
Sample No.
Mass of (Air-Dried Soil + Cont:) = g Gs =
Mass of Container No. ( ) = g Ip =
Mass of Air - Dried Soil m s = g Dispersing Agent
m 2
m o
No. No.
ma mb ma ma mb
mb mc mb mb mc
mw ms mw mw ms w = %
2. Hydrometer Test Container No. Hydrometer No.No.
1
2
5
15
30
1 cm3/g
m so /V (Gs - 1)
mso / V : Mass of dry soil per 1 ml of suspension Meniscus correction Cm
3. Sieve Analysis
(mm)(g) (%)
Corrected Pr' + F
12
PARTICLE SIZE ANALYSIS TEST ( For Hydrometer Test )
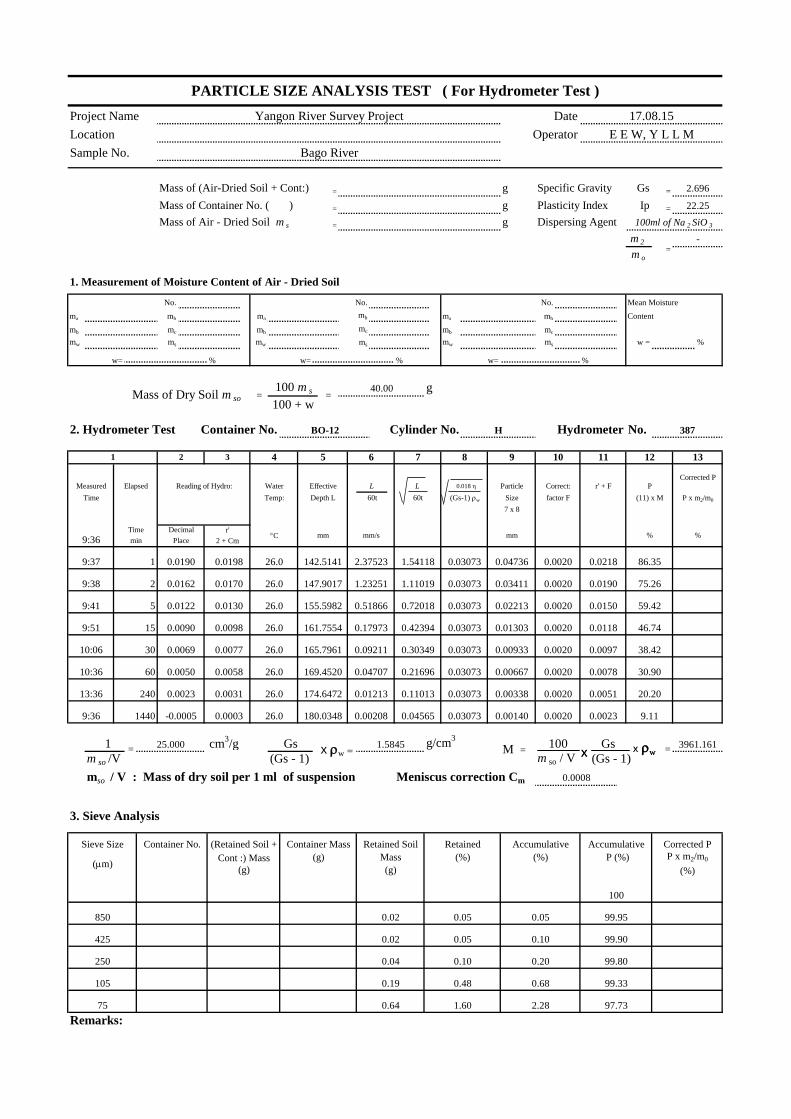
17.08.15Yangon River Survey Project
Bago River
E E W, Y L L MOperator
Date
40.00 g
mb
% w= % w= %
Elapsed Reading of Hydro: Water
BO-12 Cylinder No.
8
H
4 51 2 3 10 1196
factor F (Gs-1) rw
7
PEffective L L 0.018 h Particle Correct:
60tTime Temp: Depth L 60t Size
%
Measured
9:36Time Decimal r'
(11) x M
7 x 8
mm/s mm %min Place 2 + Cm
C mm
0.0218 86.35142.5141 2.37523 1.54118 0.03073 0.04736 0.0020
9:38 0.0162 0.0170 26.0
9:37 0.0190 0.0198 26.0
0.03411 0.0020 0.0190 75.26147.9017 1.23251 1.11019 0.03073
0.0150 59.42155.5982 0.51866 0.72018 0.03073 0.02213 0.0020
9:51 0.0090 0.0098 26.0
9:41 0.0122 0.0130 26.0
0.01303 0.0020 0.0118 46.74161.7554 0.17973 0.42394 0.03073
26.0 0.0097 38.42165.7961 0.09211 0.30349 0.03073 0.00933 0.0020
10:36 60 0.0050 0.0058
10:06 0.0069 0.0077
0.0020 0.007826.0 169.4520 0.04707 0.21696 30.90
13:36 240 0.0023 0.0031 26.0 174.6472 0.01213
0.03073 0.00667
26.0 180.0348 0.00208 0.04565 0.03073
0.0051
9:36 1440 -0.0005 0.0003 0.0023
0.00338 0.00200.11013 0.03073
0.0020
25.000 Gs x rw =1.5845 g/cm
3
M =
Sieve Size Container No. (Retained Soil + Container Mass Retained Soil Retained
Cont :) Mass (g) Mass (%) (%) P (%)
0.05 0.10
(g)
100
850 0.02 0.05 0.05 99.95
99.90
99.33
250 0.04 0.10 0.20
0.68
99.80
425 0.02
97.73
105 0.19
75 0.64 1.60 2.28
0.48
=
2.696
22.25
100ml of Na 2 SiO 3
-
Specific Gravity
Plasticity Index
1. Measurement of Moisture Content of Air - Dried Soil
100 + w
100 m s
w=
=Mass of Dry Soil m so =
ms
No.
mc
Mean Moisture
Content
Corrected P
13
Accumulative Accumulative
100
m so / V (Gs - 1)
0.0008
Gs
0.00140 9.11
20.20
Remarks:
3961.161==
387
P x m2/m0
P x m2/m0
X rwx X rwx

DATE:
Remarks: Gravel(%)= - Silt(%) = 71.73
Sand(%) = 2.28 Clay(%) = 26.00
TEST BY: E E W, Y L L M
CHECK BY: T H
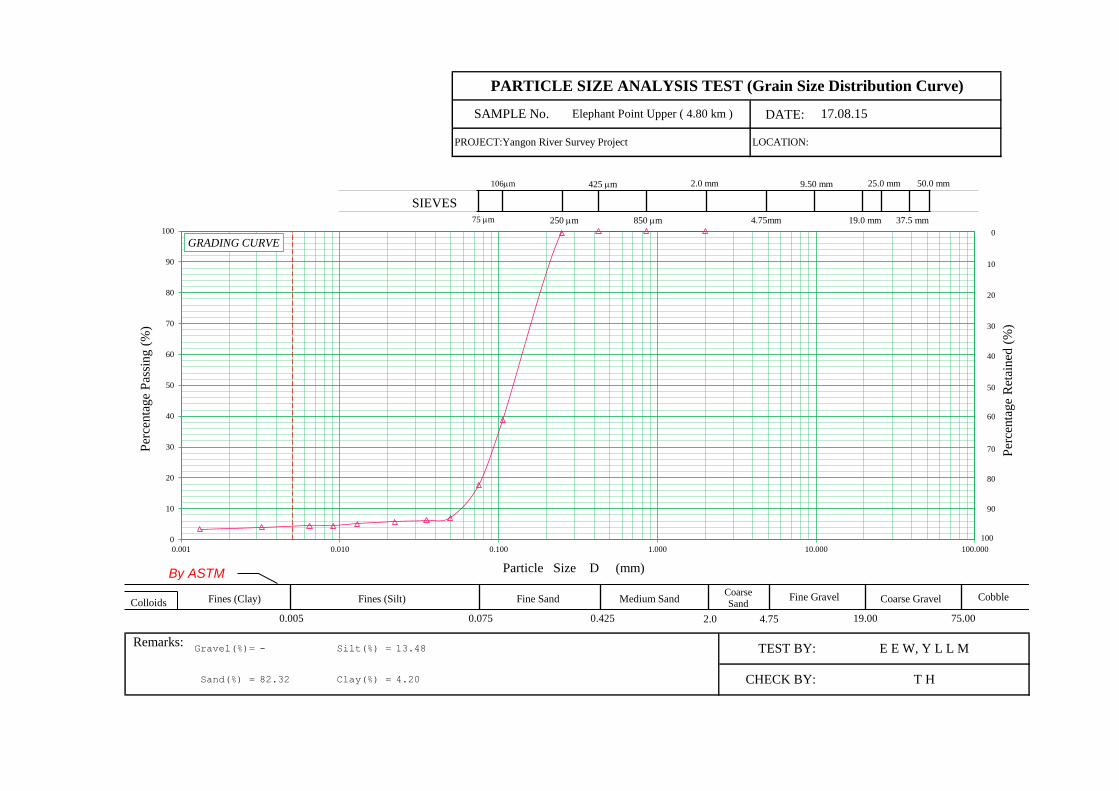
PARTICLE SIZE ANALYSIS TEST (Grain Size Distribution Curve)
SAMPLE No. Bago River 17.08.15
PROJECT:Yangon River Survey Project LOCATION:
0
10
20
30
40
50
60
70
80
90
100
0.001 0.010 0.100 1.000 10.000 100.000
Per
centa
ge
Pas
sing (
%)
Particle Size D (mm)
GRADING CURVE
75 mm
106mm
250 mm
425 mm
850 mm
2.0 mm
4.75mm 19.0 mm
25.0 mm
37.5 mm
50.0 mm9.50 mm
SIEVES
0
10
Per
centa
ge
Ret
ained
(%
)
20
30
40
50
60
70
80
90
100
0.005 0.075 0.425 2.0 4.75 75.00
Colloids Fines (Clay) Fines (Silt) Fine Sand Medium SandCoarse
SandFine Gravel Cobble
By ASTM
Coarse Gravel
19.00

Project Name
Location
Sample No.
Mass of (Air-Dried Soil + Cont:) = g Gs =
Mass of Container No. ( ) = g Ip =
Mass of Air - Dried Soil m s = g Dispersing Agent
m 2
m o
No. No.
ma mb ma ma mb
mb mc mb mb mc
mw ms mw mw ms w = %
2. Hydrometer Test Container No. Hydrometer No.No.
1
2
5
15
30
1 cm3/g
m so /V (Gs - 1)
mso / V : Mass of dry soil per 1 ml of suspension Meniscus correction Cm
3. Sieve Analysis
Remarks:
3172.184==
297
P x m2/m0
P x m2/m0
6.66
8.25
m so / V (Gs - 1)
0.0008
Gs
0.00139
Mean Moisture
Content
Corrected P
13
Accumulative Accumulative
100
ms
No.
mc
1. Measurement of Moisture Content of Air - Dried Soil
100 + w
100 m s
w=
=Mass of Dry Soil m so =
=
2.692
5.07
100ml of Na 2 SiO 3
-
Specific Gravity
Plasticity Index
425 0.06
44.90
105 14.55
75 12.50 25.00 55.10
29.10 69.90
250 0.42 0.84 1.00
30.10
99.00
0.12 0.16
(g)
100
850 0.02 0.04 0.04 99.96
99.84
Cont :) Mass (g) Mass (%) (%) P (%)
Sieve Size Container No. (Retained Soil + Container Mass Retained Soil Retained
20.000 Gs x rw =1.5861 g/cm
3
M =
9:36 1440 -0.0007 0.0001 0.0021
0.00340 0.00200.11057 0.03077
0.002026.0 177.0218 0.00205 0.04526 0.03077
0.0026
8.88
13:36 240 -0.0002 0.0006 26.0 176.0428 0.01223
0.03077 0.00680 0.0020 0.002826.0 175.6512 0.04879 0.2208910:36 60 0.0000 0.0008
10:06 0.0010 0.0018 26.0 0.0038 12.05173.6932 0.09650 0.31064 0.03077 0.00956 0.0020
0.01344 0.0020 0.0048 15.23171.7352 0.19082 0.43683 0.030779:51 0.0020 0.0028 26.0
9:41 0.0028 0.0036 26.0 0.0056 17.76170.1688 0.56723 0.75315 0.03077 0.02318 0.0020
0.03658 0.0020 0.0059 18.72169.5814 1.41318 1.18877 0.030779:38 0.0031 0.0039 26.0
9:37 0.0065 0.0073 26.0 0.0093 29.50162.9242 2.71540 1.64785 0.03077 0.05071 0.0020
%min Place 2 + Cm
C mm %
Measured
9:36Time Decimal r'
(11) x M
7 x 8
mm/s mm
60tTime Temp: Depth L 60t Size factor F (Gs-1) rw
7
PEffective L L 0.018 h Particle Correct:
2 3 10 1196
Elapsed Reading of Hydro: Water
BO-19 Cylinder No.
8
N
4 51
w= %
50.00 g
mb
% w= %
PARTICLE SIZE ANALYSIS TEST ( For Hydrometer Test )
17.08.15Yangon River Survey Project
Elephant Point ( 10 km )
E E W, Y L L MOperator
Date
(mm)(g) (%)
Corrected Pr' + F
12
X rwx X rwx

DATE:
Remarks: Gravel(%)= - Silt(%) = 36.40
Sand(%) = 55.10 Clay(%) = 8.50
TEST BY: E E W, Y L L M
CHECK BY: T H
PARTICLE SIZE ANALYSIS TEST (Grain Size Distribution Curve)
SAMPLE No. Elephant Point ( 10 km ) 17.08.15
PROJECT:Yangon River Survey Project LOCATION:
0
10
20
30
40
50
60
70
80
90
100
0.001 0.010 0.100 1.000 10.000 100.000
Per
centa
ge
Pas
sing (
%)
Particle Size D (mm)
GRADING CURVE
75 mm
106mm
250 mm
425 mm
850 mm
2.0 mm
4.75mm 19.0 mm
25.0 mm
37.5 mm
50.0 mm9.50 mm
SIEVES
0
10
Per
centa
ge
Ret
ained
(%
)
20
30
40
50
60
70
80
90
100
0.005 0.075 0.425 2.0 4.75 75.00
Colloids Fines (Clay) Fines (Silt) Fine Sand Medium SandCoarse
SandFine Gravel Cobble
By ASTM
Coarse Gravel
19.00

Project Name
Location
Sample No.
Mass of (Air-Dried Soil + Cont:) = g Gs =
Mass of Container No. ( ) = g Ip =
Mass of Air - Dried Soil m s = g Dispersing Agent
m 2
m o
No. No.
ma mb ma ma mb
mb mc mb mb mc
mw ms mw mw ms w = %
2. Hydrometer Test Container No. Hydrometer No.No.
1
2
5
15
30
1 cm3/g
m so /V (Gs - 1)
mso / V : Mass of dry soil per 1 ml of suspension Meniscus correction Cm
3. Sieve Analysis
Remarks:
2528.571==
297
P x m2/m0
P x m2/m0
3.29
4.05
m so / V (Gs - 1)
0.0008
Gs
0.00131
Mean Moisture
Content
Corrected P
13
Accumulative Accumulative
100
ms
No.
mc
1. Measurement of Moisture Content of Air - Dried Soil
100 + w
100 m s
w=
=Mass of Dry Soil m so =
=
2.916
-
50ml of Na 2 SiO 3
-
Specific Gravity
Plasticity Index
425 0.06
17.68
105 36.41
75 12.61 21.02 82.32
60.68 38.70
250 0.30 0.50 0.62
61.30
99.38
0.10 0.12
(g)
100
850 0.01 0.02 0.02 99.98
99.88
Cont :) Mass (g) Mass (%) (%) P (%)
Sieve Size Container No. (Retained Soil + Container Mass Retained Soil Retained
16.667 Gs x rw =1.5171 g/cm
3
M =
9:42 1440 -0.0015 -0.0007 0.0013
0.00322 0.00200.11120 0.02891
0.002026.0 178.6641 0.00207 0.04547 0.02891
0.0016
4.55
13:42 240 -0.0012 -0.0004 26.0 178.0767 0.01237
0.02891 0.00642 0.0020 0.001826.0 177.6851 0.04936 0.2221610:42 60 -0.0010 -0.0002
10:12 -0.0010 -0.0002 26.0 0.0018 4.55177.6851 0.09871 0.31419 0.02891 0.00908 0.0020
0.01283 0.0020 0.0020 5.06177.2935 0.19699 0.44384 0.028919:57 -0.0008 0.0000 26.0
9:47 -0.0005 0.0003 26.0 0.0023 5.82176.7061 0.58902 0.76748 0.02891 0.02219 0.0020
0.03505 0.0020 0.0025 6.32176.3145 1.46929 1.21214 0.028919:44 -0.0003 0.0005 26.0
9:43 0.0000 0.0008 26.0 0.0028 7.08175.7271 2.92879 1.71137 0.02891 0.04948 0.0020
%min Place 2 + Cm
C mm %
Measured
9:42Time Decimal r'
(11) x M
7 x 8
mm/s mm
60tTime Temp: Depth L 60t Size factor F (Gs-1) rw
7
PEffective L L 0.018 h Particle Correct:
2 3 10 1196
Elapsed Reading of Hydro: Water
BO-20 Cylinder No.
8
O
4 51
w= %
60.00 g
mb
% w= %
PARTICLE SIZE ANALYSIS TEST ( For Hydrometer Test )
17.08.15Yangon River Survey Project
Elephant Point Upper ( 4.80 km )
E E W, Y L L MOperator
Date
(mm)(g) (%)
Corrected Pr' + F
12
X rwx X rwx
DATE:
Remarks: Gravel(%)= - Silt(%) = 13.48
Sand(%) = 82.32 Clay(%) = 4.20
TEST BY: E E W, Y L L M
CHECK BY: T H
PARTICLE SIZE ANALYSIS TEST (Grain Size Distribution Curve)
SAMPLE No. Elephant Point Upper ( 4.80 km ) 17.08.15
PROJECT:Yangon River Survey Project LOCATION:
0
10
20
30
40
50
60
70
80
90
100
0.001 0.010 0.100 1.000 10.000 100.000
Per
centa
ge
Pas
sing (
%)
Particle Size D (mm)
GRADING CURVE
75 mm
106mm
250 mm
425 mm
850 mm
2.0 mm
4.75mm 19.0 mm
25.0 mm
37.5 mm
50.0 mm9.50 mm
SIEVES
0
10
Per
centa
ge
Ret
ained
(%
)
20
30
40
50
60
70
80
90
100
0.005 0.075 0.425 2.0 4.75 75.00
Colloids Fines (Clay) Fines (Silt) Fine Sand Medium SandCoarse
SandFine Gravel Cobble
By ASTM
Coarse Gravel
19.00

Project Name
Location
Sample No.
Dry mass after washing on 2000 mm Sieve m 1
Mass of (Air - Dried Soil + Cont:) = g Mass of (m 1 + container) = g
= g Mass of container No. ( ) = g
= g Dry mass after washing on = g
Mass of air-dried sample passing 2.0 mm : m-m 1 = g 2000 m Sieve m 1
Measurement of Moisture content of Air - Dried Soil
No.
ma ma mb
mb mb mc
mw mw ms %
g
g
g
Sieve analysis of sample retained on 2000 mm sieve
(mm)
Sieve analysis of sample passing 2000 mm sieve
75
106
250
425
850
(g) (g) (g) (%)
Corrected P
(mm) Cont:) Mass Mass Mass (%) (%) P (%) P x m2/m0
5.23 94.77
Sieve size Container No. (Retained soil + Container Retained soil Retained Accumulative Accumulative
2.00 5.00 2.92
1.42 98.58
4.75 1.54 0.90 2.31 97.69
9.50 2.43 1.42
19.00 100.00
26.50
37.50
(g) (g) (g)
53.00
Retain Accumulative Accumulative
Cont:) Mass Mass Mass (%) (%) P (%)
m 0 Total mass of dry sample
Sieve Size Container No. (Retain Soil + Container Retain soil
Total mass of dry sample m o = m 1 + m 2 =171.52
m 2=
Mass of dry sample passing 2000 mm sieve=
0.948
%w=
%
Mass of dry sample passing 2000 mm Sieve m 2 =100 (m - m 1 )
=162.55
100 + w
msw=
w=%
w=
mc
ms mw
mc mb
Mean Moisture Content
mb ma mb
No. No.
Mass of Container No. ( ) Mass of Air - Dried Soil m
Yangon River Survey Project
Near Monkey Point
Remarks:
PARTICLE SIZE ANALYSIS TEST ( For Sieve Analysis Test )
Date 17.08.15
Operator E E W, Y L L M
Total mass of air-dried sample m

Project Name
Location
Sample No.
Mass of (Air-Dried Soil + Cont:) = g Gs =
Mass of Container No. ( ) = g Ip =
Mass of Air - Dried Soil m s = g Dispersing Agent
m 2
m o
No. No.
ma mb ma ma mb
mb mc mb mb mc
mw ms mw mw ms w = %
2. Hydrometer Test Container No. Hydrometer No.
1
2
5
15
30
1 cm3/g
m so /V (Gs - 1)
mso / V : Mass of dry soil per 1 ml of suspension Meniscus correction Cm
3. Sieve Analysis
Remarks: Dispersing Agent Correction - -
(mm)(g) (%)
Corrected P
PARTICLE SIZE ANALYSIS TEST ( For Hydrometer Test )
17.08.15Yangon River Survey Project
Near Monkey Point
E E W, Y L L MOperator
Date
mb
% w=
Cylinder No.
w= %
70.00 g
%
8
BO-2
125 10 1196 7
Measured Elapsed Reading of Hydro: Water
2 31 4
PEffective L L 0.018 h Particle Correct: r' + F
Time Temp: Depth L 60t Size factor F (Gs-1) rw
Time Decimal r'
(11) x M
7 x 8
mm/s mm
60t
min Place 2 + CmC mm %
60
240
1440
Gs x rw =g/cm
3
M =
Sieve Size Container No. (Retained Soil + Container Mass Retained Soil Retained
Cont :) Mass (g) Mass (%) (%) P (%)
21.50 23.57
(g)
850 1.45 2.07 2.07 97.93
76.43
7.81 7.41
250 33.69 48.13 71.70
92.19
28.30 26.82
425 15.05
5.56
106 14.34
75 1.58 2.26 94.44
20.49
=
-
-
-
0.948
Specific Gravity
Plasticity Index
1. Measurement of Moisture Content of Air - Dried Soil
100 + w
100 m s
w=
=Mass of Dry Soil m so =
ms
No.
mc
Mean Moisture
Content
Corrected P
13
Accumulative Accumulative
100
m so / V (Gs - 1)
Gs
92.81
5.27
==
P x m2/m0
P x m2/m0
72.43
%
X rwx X rwx

DATE:
Remarks: Gravel(%)= 2.31 Silt(%) =
Sand(%) = 92.42 Clay(%) =
LOCATION:
5.27
TEST BY: E E W, Y L L M
CHECK BY: T H
PARTICLE SIZE ANALYSIS TEST (Grain Size Distribution Curve)
SAMPLE No. Near Monkey Point 17.08.15
PROJECT:Yangon River Survey Project
0
10
20
30
40
50
60
70
80
90
100
0.001 0.010 0.100 1.000 10.000 100.000
Per
centa
ge
Pas
sing (
%)
Particle Size D (mm)
GRADING CURVE
75 mm
106mm
250 mm
425 mm
850 mm
2.0 mm
4.75mm 19.0 mm
25.0 mm
37.5 mm
50.0 mm9.50 mm
SIEVES
0
10
Per
centa
ge
Ret
ained
(%
)
20
30
40
50
60
70
80
90
100
0.005 0.075 0.425 2.0 4.75 75.00
Colloids Fines (Clay) Fines (Silt) Fine Sand Medium SandCoarse
SandFine Gravel Cobble
By ASTM
Coarse Gravel
19.00

Project Name
Location
Sample No.
Mass of (Air-Dried Soil + Cont:) = g Gs =
Mass of Container No. ( ) = g Ip =
Mass of Air - Dried Soil m s = g Dispersing Agent
m 2
m o
No. No.
ma mb ma ma mb
mb mc mb mb mc
mw ms mw mw ms w = %
2. Hydrometer Test Container No. Hydrometer No.No.
1
2
5
15
30
1 cm3/g
m so /V (Gs - 1)
mso / V : Mass of dry soil per 1 ml of suspension Meniscus correction Cm
3. Sieve Analysis
Remarks:
3947.519==
387
P x m2/m0
P x m2/m0
9.87
20.13
m so / V (Gs - 1)
0.0008
Gs
0.00139
Mean Moisture
Content
Corrected P
13
Accumulative Accumulative
100
ms
No.
mc
1. Measurement of Moisture Content of Air - Dried Soil
100 + w
100 m s
w=
=Mass of Dry Soil m so =
=
2.712
27.94
100ml of Na 2 SiO 3
-
Specific Gravity
Plasticity Index
425 2.05
90.63
105 0.25
75 0.13 0.33 9.38
0.63 90.95
250 0.52 1.30 8.43
9.05
91.58
5.13 7.13
(g)
100
850 0.80 2.00 2.00 98.00
92.88
Cont :) Mass (g) Mass (%) (%) P (%)
Sieve Size Container No. (Retained Soil + Container Mass Retained Soil Retained
25.000 Gs x rw =1.5790 g/cm
3
M =
9:30 1440 -0.0003 0.0005 0.0025
0.00337 0.00200.11011 0.03059
0.002026.0 179.5859 0.00208 0.04559 0.03059
0.0051
30.79
13:30 240 0.0023 0.0031 26.0 174.5832 0.01212
0.03059 0.00663 0.0020 0.007826.0 169.3880 0.04705 0.2169210:30 60 0.0050 0.0058
10:00 0.0065 0.0073 26.0 0.0093 36.71166.5018 0.09250 0.30414 0.03059 0.00930 0.0020
0.01296 0.0020 0.0118 46.58161.6914 0.17966 0.42386 0.030599:45 0.0090 0.0098 26.0
9:35 0.0130 0.0138 26.0 0.0158 62.37153.9949 0.51332 0.71646 0.03059 0.02191 0.0020
0.03355 0.0020 0.0208 82.11144.3742 1.20312 1.09687 0.030599:32 0.0180 0.0188 26.0
9:31 0.0198 0.0206 26.0 0.0226 89.21140.9108 2.34851 1.53249 0.03059 0.04687 0.0020
%min Place 2 + Cm
C mm %
Measured
9:30Time Decimal r'
(11) x M
7 x 8
mm/s mm
60tTime Temp: Depth L 60t Size factor F (Gs-1) rw
7
PEffective L L 0.018 h Particle Correct:
2 3 10 1196
Elapsed Reading of Hydro: Water
BO-15 Cylinder No.
8
G
4 51
w= %
40.00 g
mb
% w= %
PARTICLE SIZE ANALYSIS TEST ( For Hydrometer Test )
17.08.15Yangon River Survey Project
Pasundaung Creek
E E W, Y L L MOperator
Date
(mm)(g) (%)
Corrected Pr' + F
12
X rwx X rwx

DATE:
Remarks: Gravel(%)= - Silt(%) = 64.63
Sand(%) = 9.38 Clay(%) = 26.00
TEST BY: E E W, Y L L M
CHECK BY: T H
PARTICLE SIZE ANALYSIS TEST (Grain Size Distribution Curve)
SAMPLE No. Pasundaung Creek 17.08.15
PROJECT:Yangon River Survey Project LOCATION:
0
10
20
30
40
50
60
70
80
90
100
0.001 0.010 0.100 1.000 10.000 100.000
Per
centa
ge
Pas
sing (
%)
Particle Size D (mm)
GRADING CURVE
75 mm
106mm
250 mm
425 mm
850 mm
2.0 mm
4.75mm 19.0 mm
25.0 mm
37.5 mm
50.0 mm9.50 mm
SIEVES
0
10
Per
centa
ge
Ret
ained
(%
)
20
30
40
50
60
70
80
90
100
0.005 0.075 0.425 2.0 4.75 75.00
Colloids Fines (Clay) Fines (Silt) Fine Sand Medium SandCoarse
SandFine Gravel Cobble
By ASTM
Coarse Gravel
19.00

Project Name
Location
Sample No.
Dry mass after washing on 2000 mm Sieve m 1
Mass of (Air - Dried Soil + Cont:) = g Mass of (m 1 + container) = g
= g Mass of container No. ( ) = g
= g Dry mass after washing on = g
Mass of air-dried sample passing 2.0 mm : m-m 1 = g 2000 m Sieve m 1
Measurement of Moisture content of Air - Dried Soil
No.
ma ma mb
mb mb mc
mw mw ms %
g
g
g
Sieve analysis of sample retained on 2000 mm sieve
(mm)
Sieve analysis of sample passing 2000 mm sieve
75
106
250
425
850
(g) (g) (g) (%)
Corrected P
(mm) Cont:) Mass Mass Mass (%) (%) P (%) P x m2/m0
0.92 99.08
Sieve size Container No. (Retained soil + Container Retained soil Retained Accumulative Accumulative
2.00 0.95 0.92
4.75 100.00
9.50
19.00
26.50
37.50
(g) (g) (g)
53.00
Retain Accumulative Accumulative
Cont:) Mass Mass Mass (%) (%) P (%)
m 0 Total mass of dry sample
Sieve Size Container No. (Retain Soil + Container Retain soil
Total mass of dry sample m o = m 1 + m 2 =103.66
m 2=
Mass of dry sample passing 2000 mm sieve=
0.991
%w=
%
Mass of dry sample passing 2000 mm Sieve m 2 =100 (m - m 1 )
=102.71
100 + w
msw=
w=%
w=
mc
ms mw
mc mb
Mean Moisture Content
mb ma mb
No. No.
Mass of Container No. ( ) Mass of Air - Dried Soil m
Yangon River Survey Project
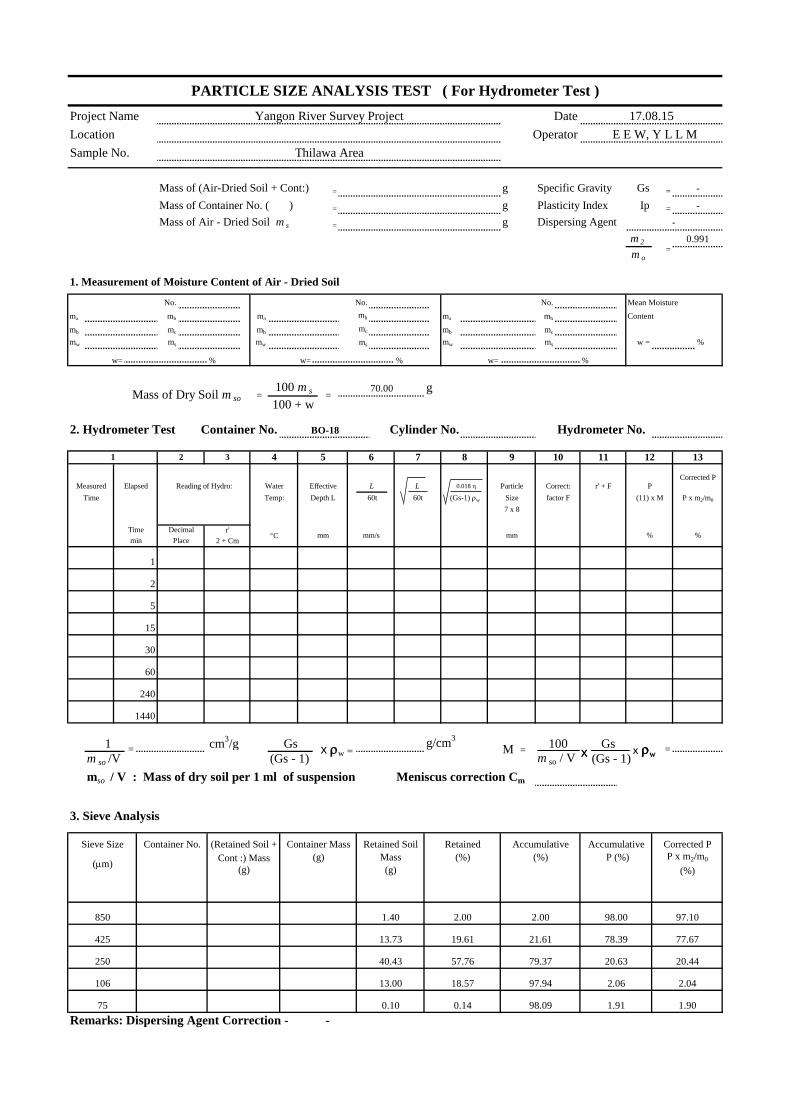
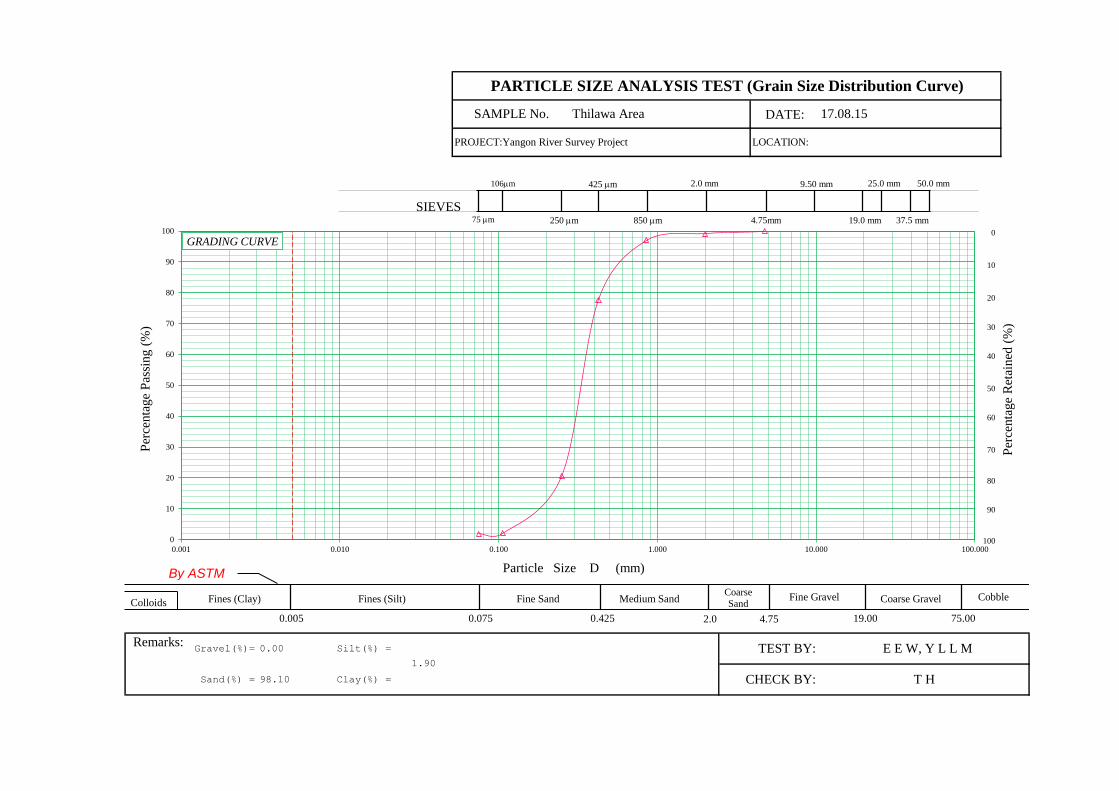
Thilawa Area
Remarks:
PARTICLE SIZE ANALYSIS TEST ( For Sieve Analysis Test )
Date 17.08.15
Operator E E W, Y L L M
Total mass of air-dried sample m
Project Name
Location
Sample No.
Mass of (Air-Dried Soil + Cont:) = g Gs =
Mass of Container No. ( ) = g Ip =
Mass of Air - Dried Soil m s = g Dispersing Agent
m 2
m o
No. No.
ma mb ma ma mb
mb mc mb mb mc
mw ms mw mw ms w = %
2. Hydrometer Test Container No. Hydrometer No.
1
2
5
15
30
1 cm3/g
m so /V (Gs - 1)
mso / V : Mass of dry soil per 1 ml of suspension Meniscus correction Cm
3. Sieve Analysis
Remarks: Dispersing Agent Correction - -
(mm)(g) (%)
Corrected P
PARTICLE SIZE ANALYSIS TEST ( For Hydrometer Test )
17.08.15Yangon River Survey Project
Thilawa Area
E E W, Y L L MOperator
Date
mb
% w=
Cylinder No.
w= %
70.00 g
%
8
BO-18
125 10 1196 7
Measured Elapsed Reading of Hydro: Water
2 31 4
PEffective L L 0.018 h Particle Correct: r' + F
Time Temp: Depth L 60t Size factor F (Gs-1) rw
Time Decimal r'
(11) x M
7 x 8
mm/s mm
60t
min Place 2 + CmC mm %
60
240
1440
Gs x rw =g/cm
3
M =
Sieve Size Container No. (Retained Soil + Container Mass Retained Soil Retained
Cont :) Mass (g) Mass (%) (%) P (%)
19.61 21.61
(g)
850 1.40 2.00 2.00 98.00
78.39
2.06 2.04
250 40.43 57.76 79.37
97.94
20.63 20.44
425 13.73
1.91
106 13.00
75 0.10 0.14 98.09
18.57
=
-
-
-
0.991
Specific Gravity
Plasticity Index
1. Measurement of Moisture Content of Air - Dried Soil
100 + w
100 m s
w=
=Mass of Dry Soil m so =
ms
No.
mc
Mean Moisture
Content
Corrected P
13
Accumulative Accumulative
100
m so / V (Gs - 1)
Gs
97.10
1.90
==
P x m2/m0
P x m2/m0
77.67
%
X rwx X rwx
DATE:
Remarks: Gravel(%)= 0.00 Silt(%) =
Sand(%) = 98.10 Clay(%) =
LOCATION:
1.90
TEST BY: E E W, Y L L M
CHECK BY: T H
PARTICLE SIZE ANALYSIS TEST (Grain Size Distribution Curve)
SAMPLE No. Thilawa Area 17.08.15
PROJECT:Yangon River Survey Project
0
10
20
30
40
50
60
70
80
90
100
0.001 0.010 0.100 1.000 10.000 100.000
Per
centa
ge
Pas
sing (
%)
Particle Size D (mm)
GRADING CURVE
75 mm
106mm
250 mm
425 mm
850 mm
2.0 mm
4.75mm 19.0 mm
25.0 mm
37.5 mm
50.0 mm9.50 mm
SIEVES
0
10
Per
centa
ge
Ret
ained
(%
)
20
30
40
50
60
70
80
90
100
0.005 0.075 0.425 2.0 4.75 75.00
Colloids Fines (Clay) Fines (Silt) Fine Sand Medium SandCoarse
SandFine Gravel Cobble
By ASTM
Coarse Gravel
19.00

Project Name
Location
Sample No.
Dry mass after washing on 2000 mm Sieve m 1
Mass of (Air - Dried Soil + Cont:) = g Mass of (m 1 + container) = g
= g Mass of container No. ( ) = g
= g Dry mass after washing on = g
Mass of air-dried sample passing 2.0 mm : m-m 1 = g 2000 m Sieve m 1
Measurement of Moisture content of Air - Dried Soil
No.
ma ma mb
mb mb mc
mw mw ms %
g
g
g
Sieve analysis of sample retained on 2000 mm sieve
(mm)
Sieve analysis of sample passing 2000 mm sieve
75
106
250
425
850
(g) (g) (g) (%)
Corrected P
(mm) Cont:) Mass Mass Mass (%) (%) P (%) P x m2/m0
0.75 99.25
Sieve size Container No. (Retained soil + Container Retained soil Retained Accumulative Accumulative
2.00 0.27 0.20
100.00
4.75 0.73 0.55 0.55 99.45
9.50
19.00
26.50
37.50
(g) (g) (g)
53.00
Retain Accumulative Accumulative
Cont:) Mass Mass Mass (%) (%) P (%)
m 0 Total mass of dry sample
Sieve Size Container No. (Retain Soil + Container Retain soil
Total mass of dry sample m o = m 1 + m 2 =132.96
m 2=
Mass of dry sample passing 2000 mm sieve=
0.992
%w=
%
Mass of dry sample passing 2000 mm Sieve m 2 =100 (m - m 1 )
=131.96
100 + w
msw=
w=%
w=
mc
ms mw
mc mb
Mean Moisture Content
mb ma mb
No. No.
Mass of Container No. ( ) Mass of Air - Dried Soil m
Yangon River Survey Project
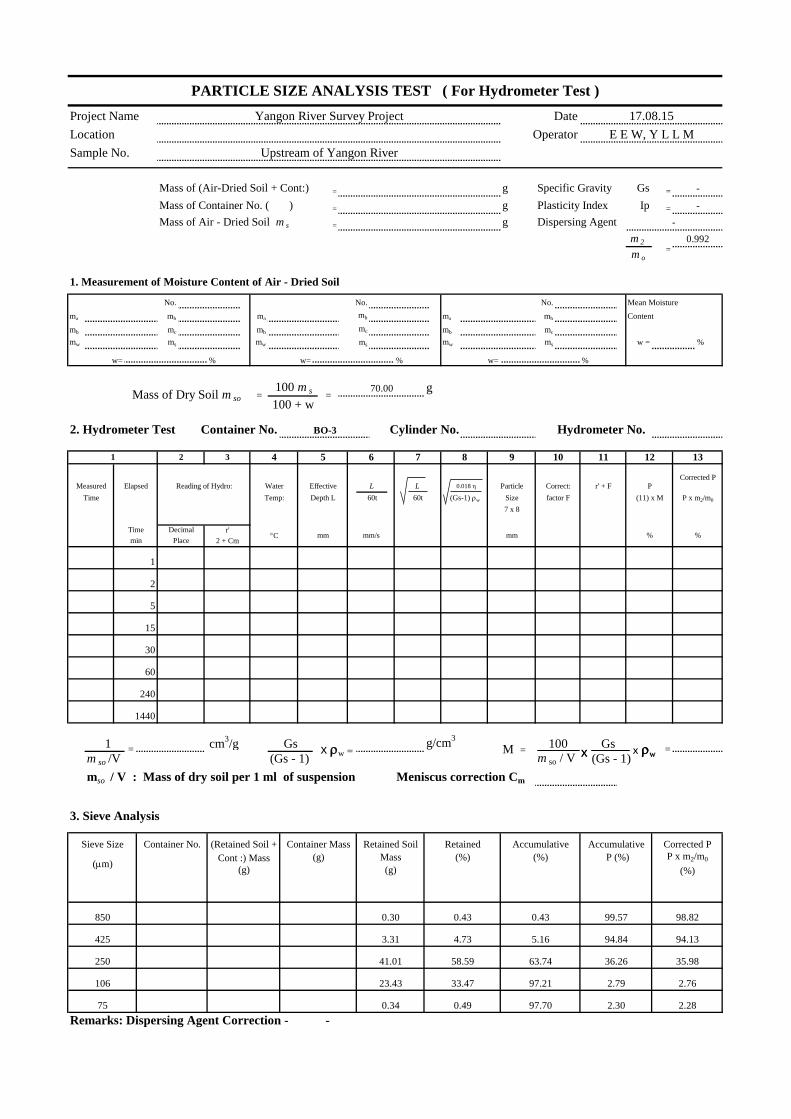
Upstream of Yangon River
Remarks:
PARTICLE SIZE ANALYSIS TEST ( For Sieve Analysis Test )
Date 17.08.15
Operator E E W, Y L L M
Total mass of air-dried sample m
Project Name
Location
Sample No.
Mass of (Air-Dried Soil + Cont:) = g Gs =
Mass of Container No. ( ) = g Ip =
Mass of Air - Dried Soil m s = g Dispersing Agent
m 2
m o
No. No.
ma mb ma ma mb
mb mc mb mb mc
mw ms mw mw ms w = %
2. Hydrometer Test Container No. Hydrometer No.
1
2
5
15
30
1 cm3/g
m so /V (Gs - 1)
mso / V : Mass of dry soil per 1 ml of suspension Meniscus correction Cm
3. Sieve Analysis
Remarks: Dispersing Agent Correction - -
(mm)(g) (%)
Corrected P
PARTICLE SIZE ANALYSIS TEST ( For Hydrometer Test )
17.08.15Yangon River Survey Project
Upstream of Yangon River
E E W, Y L L MOperator
Date
mb
% w=
Cylinder No.
w= %
70.00 g
%
8
BO-3
125 10 1196 7
Measured Elapsed Reading of Hydro: Water
2 31 4
PEffective L L 0.018 h Particle Correct: r' + F
Time Temp: Depth L 60t Size factor F (Gs-1) rw
Time Decimal r'
(11) x M
7 x 8
mm/s mm
60t
min Place 2 + CmC mm %
60
240
1440
Gs x rw =g/cm
3
M =
Sieve Size Container No. (Retained Soil + Container Mass Retained Soil Retained
Cont :) Mass (g) Mass (%) (%) P (%)
4.73 5.16
(g)
850 0.30 0.43 0.43 99.57
94.84
2.79 2.76
250 41.01 58.59 63.74
97.21
36.26 35.98
425 3.31
2.30
106 23.43
75 0.34 0.49 97.70
33.47
=
-
-
-
0.992
Specific Gravity
Plasticity Index
1. Measurement of Moisture Content of Air - Dried Soil
100 + w
100 m s
w=
=Mass of Dry Soil m so =
ms
No.
mc
Mean Moisture
Content
Corrected P
13
Accumulative Accumulative
100
m so / V (Gs - 1)
Gs
98.82
2.28
==
P x m2/m0
P x m2/m0
94.13
%
X rwx X rwx

DATE:
Remarks: Gravel(%)= 0.55 Silt(%) =
Sand(%) = 97.17 Clay(%) =
LOCATION:
2.28
TEST BY: E E W, Y L L M
CHECK BY: T H
PARTICLE SIZE ANALYSIS TEST (Grain Size Distribution Curve)
SAMPLE No. Upstream of Yangon River 17.08.15
PROJECT:Yangon River Survey Project
0
10
20
30
40
50
60
70
80
90
100
0.001 0.010 0.100 1.000 10.000 100.000
Per
centa
ge
Pas
sing (
%)
Particle Size D (mm)
GRADING CURVE
75 mm
106mm
250 mm
425 mm
850 mm
2.0 mm
4.75mm 19.0 mm
25.0 mm
37.5 mm
50.0 mm9.50 mm
SIEVES
0
10
Per
centa
ge
Ret
ained
(%
)
20
30
40
50
60
70
80
90
100
0.005 0.075 0.425 2.0 4.75 75.00
Colloids Fines (Clay) Fines (Silt) Fine Sand Medium SandCoarse
SandFine Gravel Cobble
By ASTM
Coarse Gravel
19.00
Date
Operator
No. No.
ma mb ma mb ma mb
mb mc mb mc mb mc
mw ms mw ms mw ms
No. No.
ma mb ma mb ma mb
mb mc mb mc mb mc
mw ms mw ms mw ms
No. No. No.
ma mb ma mb ma mb
mb mc mb mc mb mc
mw ms mw ms mw ms
Liquid limit WL Plastic limit WP Plasticity index IP Remarks:
No. No.
ma mb ma mb ma mb
mb mc mb mc mb mc
mw ms mw ms mw ms
No. No. No.
ma mb ma mb ma mb
mb mc mb mc mb mc
mw ms mw ms mw ms
No. No. No.
ma mb ma mb ma mb
mb mc mb mc mb mc
mw ms mw ms mw ms
Liquid limit WL Plastic limit WP Plasticity index IP Remarks:
8.02
28.20
20.80
7.40
w=
Pasundaung Creek
35.22
25.16
19.62
19.62
w=
Number of blows of blows
w=
% w=
26.25
8.83
34.42
25.57
8.85
31.74
23.64
8.10
18.56
of blows
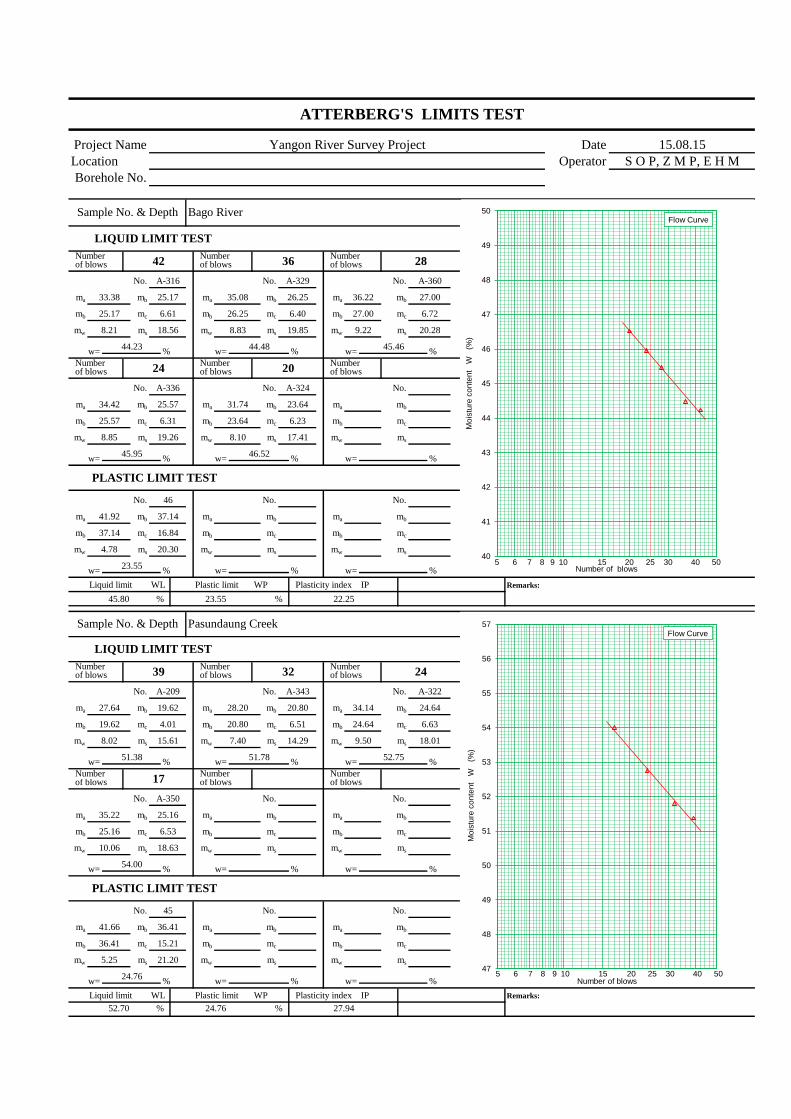
ATTERBERG'S LIMITS TEST
Project Name 15.08.15
Sample No. & Depth Bago River
Location
Borehole No.
S O P, Z M P, E H M
Yangon River Survey Project
of blows of blows
LIQUID LIMIT TEST
Number 42
Number of blows
25.17
A-316 A-329 No. A-360
36 Number
28
35.08 36.2226.25
9.22
33.38
25.17
27.00
6.61 6.40 27.00 6.72
20.28
w=45.46
of blows Number
20 Number
%44.48
19.85
44.23%
8.21
27.64
24
41.92
37.14
4.78
%w= w=
23.64
A-336 A-324
of blows Number
6.31 6.23
25.57
No.
46.52% w= %
PLASTIC LIMIT TEST
46
17.41
w=45.95
%
19.26
w=
37.14
16.84
%
20.30
w=
A-209
22.25
23.55%
45.80 % 23.55 %
Sample No. & Depth
of blows of blows of blows
LIQUID LIMIT TEST
Number 39
Number
No. A-322
34.14 24.64
32 Number
24
20.80
A-343
4.01
15.61 14.29
6.51 6.63
9.50
24.64
52.75
18.01
Number
51.38%
51.78% w=
A-350
of blows
%
25.16
17 Number
6.53
% w=w=
PLASTIC LIMIT TEST
18.63
%54.00
w=
10.06
41.66
36.41
%
36.41
15.21
5.25 21.20
w=
52.70 % 24.76 %
%
27.94
% w=
45
24.76% w=
40
41
42
43
44
45
46
47
48
49
50
Mo
istu
re c
on
ten
t
W (
%)
Flow Curve
65 7 8 9 10 15 20 25 30 40 50Number of blows
47
48
49
50
51
52
53
54
55
56
57
Mo
istu
re c
on
ten
t
W (
%)
Flow Curve
5 6 7 8 9 10 15 20 25 30 40 50Number of blows
Date
Operator
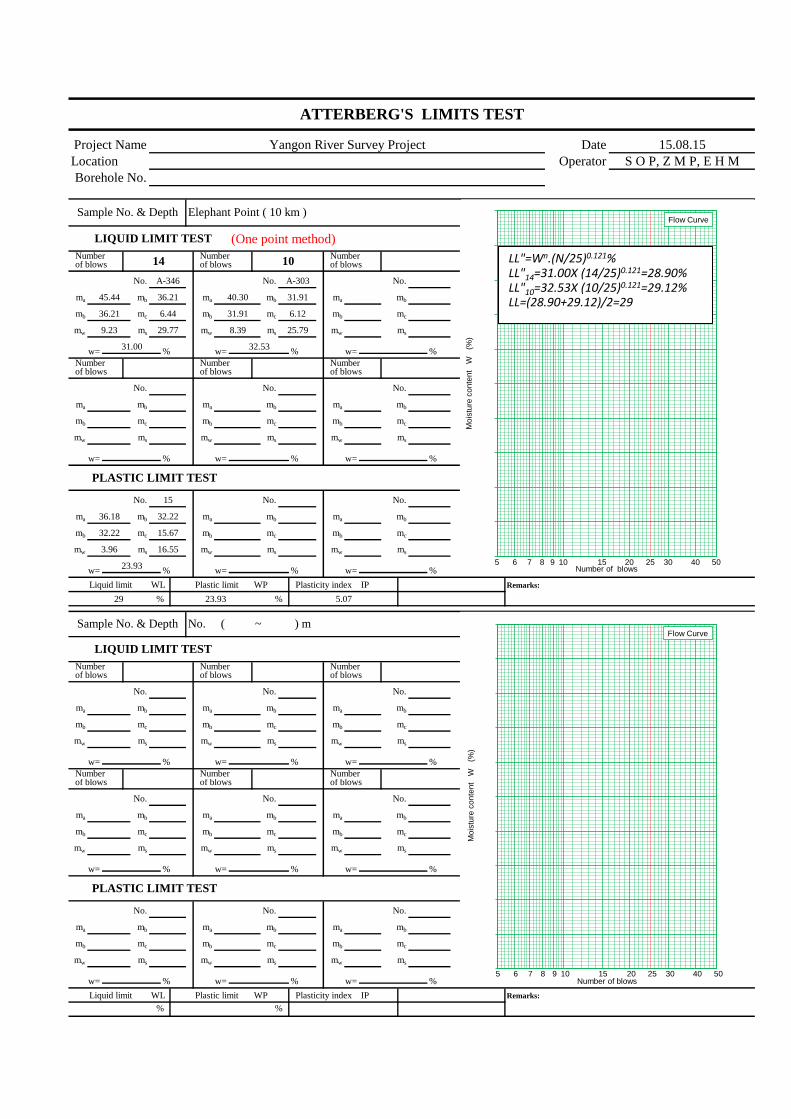
(One point method)
No. No.
ma mb ma mb ma mb
mb mc mb mc mb mc
mw ms mw ms mw ms
No. No.
ma mb ma mb ma mb
mb mc mb mc mb mc
mw ms mw ms mw ms
No. No. No.
ma mb ma mb ma mb
mb mc mb mc mb mc
mw ms mw ms mw ms
Liquid limit WL Plastic limit WP Plasticity index IP Remarks:
No. No.
ma mb ma mb ma mb
mb mc mb mc mb mc
mw ms mw ms mw ms
No. No. No.
ma mb ma mb ma mb
mb mc mb mc mb mc
mw ms mw ms mw ms
No. No. No.
ma mb ma mb ma mb
mb mc mb mc mb mc
mw ms mw ms mw ms
Liquid limit WL Plastic limit WP Plasticity index IP Remarks:
w=
No. ( ~ ) m
w=
Number of blows of blows
w=
% w=
31.91
8.3929.77
of blows
ATTERBERG'S LIMITS TEST
Project Name 15.08.15
Sample No. & Depth Elephant Point ( 10 km )
Location
Borehole No.
S O P, Z M P, E H M
Yangon River Survey Project
of blows of blows
LIQUID LIMIT TEST
Number 14
Number of blows
36.21
A-346 A-303 No.
10 Number
40.30 31.9145.44
36.21 6.44 6.12
w=
of blows Number Number
%32.53
25.79
31.00%
9.23
36.18
32.22
3.96
%w= w=
of blows Number
No.
% w= %
PLASTIC LIMIT TEST
15
w= % w=
32.22
15.67
%
16.55
w=
5.07
23.93%
29 % 23.93 %
Sample No. & Depth
of blows of blows of blows
LIQUID LIMIT TEST
Number Number
No.
Number
Number
%% w=
of blows
%
Number
% w=w=
PLASTIC LIMIT TEST
%w= %
w=
% %
%% w=% w=
62
63
64
65
66
67
68
69
70
71
72
Mo
istu
re c
on
ten
t
W (
%)
Flow Curve
65 7 8 9 10 15 20 25 30 40 50Number of blows
34
35
36
37
38
39
40
41
42
43
44
Mo
istu
re c
on
ten
t
W (
%)
Flow Curve
5 6 7 8 9 10 15 20 25 30 40 50Number of blows
LL"=Wn.(N/25)0.121%LL"14=31.00X (14/25)0.121=28.90%LL"10=32.53X (10/25)0.121=29.12%LL=(28.90+29.12)/2=29

Pauzundaung Creek (a) Pauzundaung Creek (b)
Bago River (a) Bago River (b)
Near Monkey Point (a) Near Monkey Point (b)
YANGON RIVER SURVEY PACKAGE 2
River Bed and Sea Bed Material Survey
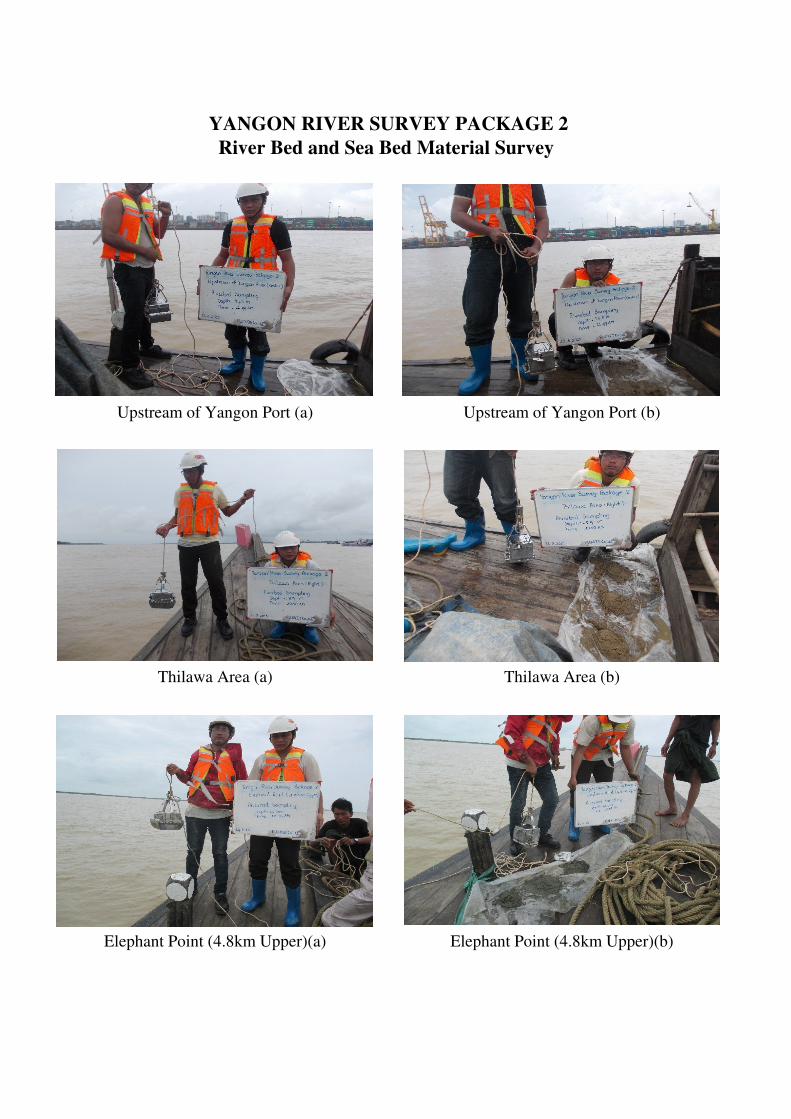
Upstream of Yangon Port (a) Upstream of Yangon Port (b)
Thilawa Area (a) Thilawa Area (b)
Elephant Point (4.8km Upper)(a) Elephant Point (4.8km Upper)(b)
YANGON RIVER SURVEY PACKAGE 2
River Bed and Sea Bed Material Survey

10km from Elephant Point 10km from Elephant Point
YANGON RIVER SURVEY PACKAGE 2
River Bed and Sea Bed Material Survey


![UU PAPER-1 UU Roll No. AA UU...1-AA ] [ 3 ] [ P.T.O. UU UU UU UU UU UU UU UU UU UU UU UU UU 003. The trajectory of a projectile in a vertical plane is y x x=a b-2 where a band are](https://static.fdocuments.net/doc/165x107/5f67099c83705d66d477d4c0/uu-paper-1-uu-roll-no-aa-uu-1-aa-3-pto-uu-uu-uu-uu-uu-uu-uu-uu-uu.jpg)


![UU PAPER-2 PCB Roll No. BA · 2-BA ] [ 3 ] [ P.T.O. UU UU UU UU UU UU UU UU UU UU UU UU UU 002. Two children Ramesh (on path ARB) and Sohan (on path ASB), travel down slides of identical](https://static.fdocuments.net/doc/165x107/5e1483c6a3dd674c594e381f/uu-paper-2-pcb-roll-no-ba-2-ba-3-pto-uu-uu-uu-uu-uu-uu-uu-uu-uu-uu-uu.jpg)
