PROJECT DELIVERABLE 3.1 REPORT ON LABORATORY TESTING - Home | Project … · 2018-02-07 · PROJECT...
97
Project FUTURA WORK PACKAGE 3 (WP3) Laboratory testing and UIC standard compliance PROJECT DELIVERABLE 3.1 REPORT ON LABORATORY TESTING FUTUre RAil freight transport: cost-effective, safe, quiet and green! – FUTURA The FUTURA project has received funding from the European Union`s Horizon 2020 research and innovation programme under grant agreement No.700985 January 2018
Transcript of PROJECT DELIVERABLE 3.1 REPORT ON LABORATORY TESTING - Home | Project … · 2018-02-07 · PROJECT...
Project FUTURA
WORK PACKAGE 3 (WP3)
Laboratory testing and UIC standard compliance
PROJECT DELIVERABLE 3.1
REPORT ON LABORATORY TESTING
FUTUre RAil freight transport: cost-effective, safe, quiet and green! – FUTURA
The FUTURA project has received funding from the European Union`s Horizon 2020 research and innovation programme under grant agreement No.700985
January 2018
Project FUTURA Page: I / X
TABLE OF CONTENTS
TABLE OF CONTENTS ............................................................................................................................. I
DOCUMENT AUTHORS AND REVIEWERS ............................................................................................ VI
LIST OF FIGURES ................................................................................................................................. VII
LIST OF TABLES .................................................................................................................................... IX
INDEX OF ABBREVIATIONS ................................................................................................................... X
1 INTRODUCTION ...................................................................................................................... 1
2 TECHNICAL REQUIREMENTS .................................................................................................. 3
2.1 Environmental requirement .................................................................................................. 3
2.2 Operational requirements ..................................................................................................... 3
2.3 Characteristics of DRFB disc ................................................................................................... 4
2.4 Brake pads .............................................................................................................................. 4
2.5 Wear limit .............................................................................................................................. 4
2.6 Unbalance .............................................................................................................................. 4
2.7 Oscillation (runout) ................................................................................................................ 5
2.8 Marking .................................................................................................................................. 5
2.8.1 DRFB disc Crown .................................................................................................................... 5
2.8.2 DRFB disc Hub ........................................................................................................................ 5
2.8.3 DRFB disc ................................................................................................................................ 6
2.9 Surface roughness .................................................................................................................. 6
2.10 Mounting ............................................................................................................................... 6
2.11 Requirements concerning the materials of DRFB disc crown ............................................... 6
2.12 Requirements concerning the materials of DRFB disc hub ................................................... 6
2.13 Complete disc ........................................................................................................................ 7
2.13.1 Visual and dimensional inspection ........................................................................................ 7
2.13.2 Balancing test ......................................................................................................................... 7
2.13.3 Runout test ............................................................................................................................ 8
2.14 Preservation ........................................................................................................................... 8
3 MECHANICAL TESTS OF PROTOTYPES ................................................................................... 8
Project FUTURA Page: II / X
4 PREPARATION OF SAMPLES ................................................................................................... 8
4.1 Tensile test samples ............................................................................................................. 10
4.2 Charpy test samples ............................................................................................................. 11
4.3 Hardness test samples ......................................................................................................... 12
4.4 Fracture toughness samples ................................................................................................ 13
4.4.1 Samples for fatigue material tests ....................................................................................... 13
4.5 Requirements ....................................................................................................................... 14
5 1ST PROTOTYPE LABORATORY TESTS ................................................................................... 14
5.1 1st prototype mechanical tests ............................................................................................ 14
5.1.1 Tensile test ........................................................................................................................... 14
5.1.2 Hardness test ....................................................................................................................... 16
5.1.3 Fatigue material test ............................................................................................................ 17
5.1.4 Charpy test ........................................................................................................................... 19
5.1.5 Fracture toughness test ....................................................................................................... 21
5.2 1st prototype dynamical tests .............................................................................................. 23
5.2.1 Local noise measurements during braking .......................................................................... 24
5.2.2 Local noise measurements (unbraked disc) ........................................................................ 24
5.2.3 Temperature measurements at different positions on DRFB disc crown and hub during
single and multiple braking ................................................................................................................ 25
5.2.4 Vibrations measurements .................................................................................................... 28
5.2.5 Coefficient of friction measurements between the DRFB disc and braking pads at different
velocities and material degradation (corrosion, humidity, wet conditions) ..................................... 29
5.2.6 Ventilation test (power losses) ............................................................................................ 30
5.2.7 Measurement of the wear of material (determining the mass and the volume of used
material) ............................................................................................................................................. 31
6 2ND PROTOTYPE LABORATORY TESTS .................................................................................. 32
6.1 2nd prototype mechanical tests ........................................................................................... 32
6.1.1 Tensile test ........................................................................................................................... 32
6.1.2 Hardness test ....................................................................................................................... 34
6.1.3 Fatigue material test ............................................................................................................ 34
Project FUTURA Page: III / X
6.1.4 Charpy test ........................................................................................................................... 35
6.1.5 Fracture toughness test ....................................................................................................... 36
6.2 2nd prototype dynamical tests ............................................................................................. 38
6.2.1 Local noise measurements during braking .......................................................................... 39
6.2.2 Local noise measurements (unbraked disc) ........................................................................ 40
6.2.3 Temperature measurements at different positions on DRFB disc crown and hub during
single and multiple braking ................................................................................................................ 41
6.2.4 Vibrations measurements .................................................................................................... 44
6.2.5 Coefficient of friction measurements between the DRFB disc and braking pads at different
velocities and material degradation (corrosion, humidity, wet conditions) ..................................... 44
6.2.6 Ventilation test (power losses) ............................................................................................ 45
6.2.7 Measurement of the wear of material (determining the mass and the volume of used
material) ............................................................................................................................................. 46
7 3RD PROTOTYPE LABORATORY TESTS ................................................................................... 46
7.1 3rd prototype mechanical tests ............................................................................................ 46
7.1.1 Tensile test ........................................................................................................................... 46
7.1.2 Hardness test ....................................................................................................................... 48
7.1.3 Fatigue material test ............................................................................................................ 48
7.1.4 Charpy test ........................................................................................................................... 49
7.1.5 Fracture toughness test ....................................................................................................... 50
7.2 3rd prototype dynamical tests .............................................................................................. 51
7.2.1 Local noise measurements during braking .......................................................................... 52
7.2.2 Local noise measurements (unbraked disc) ........................................................................ 53
7.2.3 Temperature measurements at different positions on DRFB disc crown and hub during
single and multiple braking ................................................................................................................ 53
7.2.4 Vibrations measurements .................................................................................................... 57
7.2.5 Coefficient of friction measurements between the DRFB disc and braking pads at different
velocities and material degradation (corrosion, humidity, wet conditions) ..................................... 57
7.2.6 Ventilation test (power losses) ............................................................................................ 58
Project FUTURA Page: IV / X
7.2.7 Measurement of the wear of material (determining the mass and the volume of used
material) ............................................................................................................................................. 59
8 4TH PROTOTYPE LABORATORY TESTS ................................................................................... 60
8.1 4th prototype mechanical tests ............................................................................................ 60
8.1.1 Tensile test ........................................................................................................................... 60
8.1.2 Hardness test ....................................................................................................................... 61
8.1.3 Fatigue material test ............................................................................................................ 61
8.1.4 Charpy test ........................................................................................................................... 62
8.1.5 Fracture toughness test ....................................................................................................... 63
8.2 4th prototype dynamical tests .............................................................................................. 65
8.2.1 Local noise measurements during braking .......................................................................... 66
8.2.2 Local noise measurements (unbraked disc) ........................................................................ 66
8.2.3 Temperature measurements at different positions on DRFB disc crown and hub during
single and multiple braking ................................................................................................................ 67
8.2.4 Vibrations measurements .................................................................................................... 70
8.2.5 Coefficient of friction measurements between the DRFB disc and braking pads at different
velocities and material degradation (corrosion, humidity, wet conditions) ..................................... 70
8.2.6 Ventilation test (power losses) ............................................................................................ 71
8.2.7 Measurement of the wear of material (determining the mass and the volume of used
material) ............................................................................................................................................. 72
9 5TH PROTOTYPE LABORATORY TESTS ................................................................................... 73
9.1 5th prototype mechanical tests ............................................................................................ 73
9.1.1 Tensile test ........................................................................................................................... 73
9.1.2 Hardness test ....................................................................................................................... 74
9.1.3 Fatigue material test ............................................................................................................ 74
9.1.4 Charpy test ........................................................................................................................... 74
9.1.5 Fracture toughness test ....................................................................................................... 74
9.2 5th prototype dynamical tests .............................................................................................. 75
9.2.1 Local noise measurements during braking .......................................................................... 76
9.2.2 Local noise measurements (unbraked disc) ........................................................................ 77
Project FUTURA Page: V / X
9.2.3 Temperature measurements at different positions on DRFB disc crown and hub during
single and multiple braking ................................................................................................................ 77
9.2.4 Vibrations measurements .................................................................................................... 81
9.2.5 Coefficient of friction measurements between the DRFB disc and braking pads at different
velocities and material degradation (corrosion, humidity, wet conditions) ..................................... 81
9.2.6 Ventilation test (power losses) ............................................................................................ 82
9.2.7 Measurement of the wear of material (determining the mass and the volume of used
material) ............................................................................................................................................. 83
10 CONCLUSION ON LABORATORY TEST RESULTS ................................................................... 84
11 REFERENCES ......................................................................................................................... 86
Project FUTURA Page: VI / X
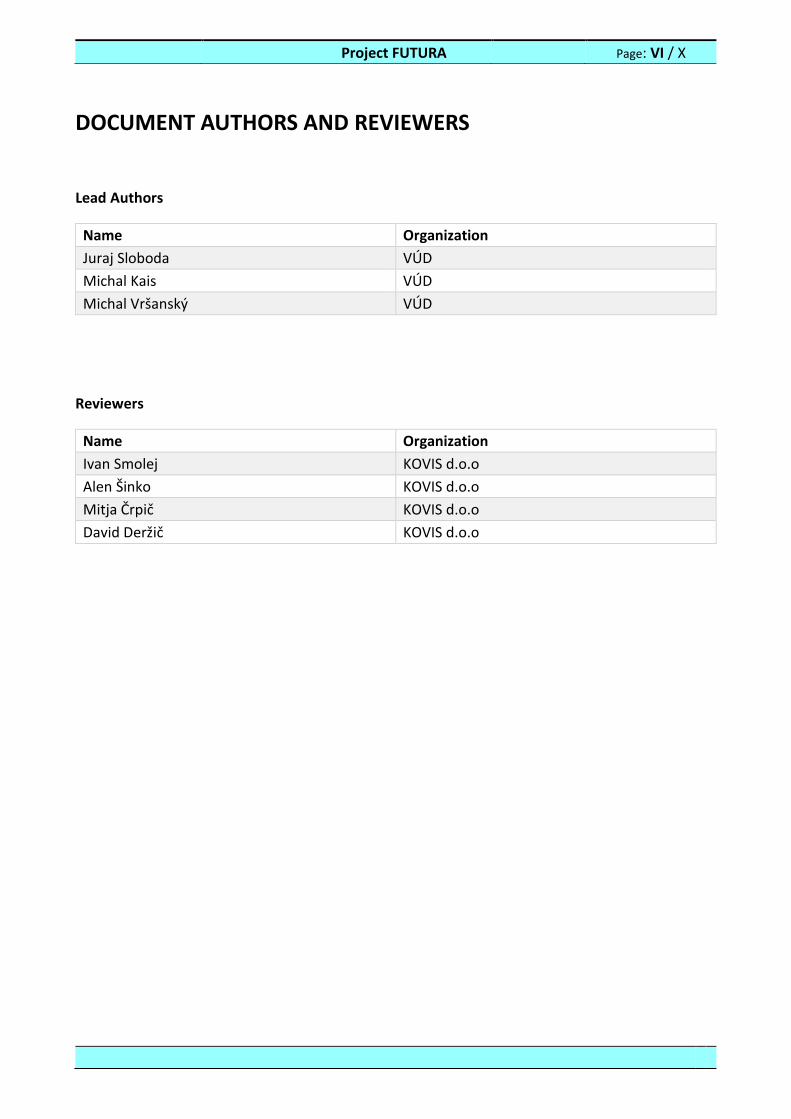
DOCUMENT AUTHORS AND REVIEWERS
Lead Authors
Name Organization
Juraj Sloboda VÚD
Michal Kais VÚD
Michal Vršanský VÚD
Reviewers
Name Organization
Ivan Smolej KOVIS d.o.o
Alen Šinko KOVIS d.o.o
Mitja Črpič KOVIS d.o.o
David Deržič KOVIS d.o.o
Project FUTURA Page: VII / X
LIST OF FIGURES
Figure 1: Samples of DRFB disc and hub .............................................................................................. 9
Figure 2: Cut samples of DRFB disc hub ............................................................................................... 9
Figure 3: Cut samples of DRFB disc crown ......................................................................................... 10
Figure 4: Shape and dimensions of tensile test samples ................................................................... 11
Figure 5: Shape and dimensions of Charpy test samples .................................................................. 12
Figure 6: Shape and dimensions of fracture toughness samples ...................................................... 13
Figure 7: Tensile test machined samples ........................................................................................... 14
Figure 8: Tensile test procedure ........................................................................................................ 15
Figure 9: Graphic progress of 1st prototype DRFB disc crown tensile test ........................................ 15
Figure 10: Graphic progress of 1st prototype DRFB disc hub tensile test .......................................... 16
Figure 11: Hardness test process ....................................................................................................... 17
Figure 12: Fatigue material test sample ............................................................................................ 18
Figure 13: Fatigue test process .......................................................................................................... 18
Figure 14: Graph of cyclic loading force............................................................................................. 18
Figure 15: Charpy test samples .......................................................................................................... 19
Figure 16: Charpy test machine ......................................................................................................... 20
Figure 17: Fracture toughness test samples ...................................................................................... 21
Figure 18: Fracture toughness test process ....................................................................................... 21
Figure 19: DRFB disc hub graphic fracture toughness progress ........................................................ 22
Figure 20: DRFB disc crown graphic fracture toughness progress .................................................... 22
Figure 21: DRFB disc test bench ......................................................................................................... 23
Figure 22: Position of microphone on test bench ............................................................................. 24
Figure 23: Position of temperature sensors ...................................................................................... 25
Figure 24: DRFB disc during the test .................................................................................................. 26
Figure 25: Temperatures of disc during 2A2 test program ................................................................ 26
Figure 26: Temperatures of disc during heat dissipation test ........................................................... 27
Figure 27: Temperatures of disc during DB-175 test ......................................................................... 28
Figure 28: Disc after DB-175 program ............................................................................................... 28
Figure 29: Special balancing machine ................................................................................................ 29
Figure 30: Wetting device .................................................................................................................. 30
Figure 31: Friction coefficient of 1st prototype (Program 2A2) ......................................................... 30
Figure 32: Ventilation losses for 1st prototype .................................................................................. 31
Figure 33: Brake pads after 2A2 test.................................................................................................. 32
Figure 34: Graphic progress of 2nd prototype DRFB disc crown tensile test ..................................... 33
Figure 35: Graphic progress of 2nd prototype DRFB disc hub tensile test ......................................... 33
Figure 36: Charpy test ........................................................................................................................ 36
Figure 37: Fracture toughness test samples ...................................................................................... 36
Figure 38: DRFB disc hub graphic fracture toughness test progress ................................................. 37
Figure 39: DRFB disc crown graphic fracture toughness progress .................................................... 38
Figure 40: 2nd prototype DRFB disc test ............................................................................................. 39
Figure 41: Noise test .......................................................................................................................... 40
Project FUTURA Page: VIII / X
Figure 42: Temperatures of DRFB disc during 2A2 test program ...................................................... 42
Figure 43: Temperatures of disc during heat dissipation test ........................................................... 42
Figure 44: Temperatures of DRFB disc during DB-175 test ............................................................... 43
Figure 45: 2nd prototype after DB-175 program ................................................................................ 43
Figure 46: 2nd prototype vibration measurement ............................................................................. 44
Figure 47: 2nd prototype friction coefficient (Program 2A2) ............................................................. 45
Figure 48: 2nd prototype ventilation losses ........................................................................................ 45
Figure 49: Graphic progress of 3rd prototype DRFB disc crown tensile test ...................................... 47
Figure 50: Graphic progress of 3rd prototype DRFB disc hub tensile test.......................................... 47
Figure 51: DRFB disc hub graphic fracture toughness test progress ................................................. 50
Figure 52: DRFB disc crown graphic fracture toughness progress .................................................... 51
Figure 53: 3rd prototype DRFB disc .................................................................................................... 52
Figure 54: Temperatures of DRFB disc during 2A2 test program ...................................................... 54
Figure 55: Temperatures of disc during heat dissipation test ........................................................... 55
Figure 56: Temperatures of DRFB disc during DB-175 test ............................................................... 56
Figure 57: 3rd prototype after DB-175 program................................................................................. 56
Figure 58: 3rd prototype vibration measurement .............................................................................. 57
Figure 59: 3rd prototype friction coefficient (Program 2A2) .............................................................. 58
Figure 60: 3rd prototype ventilation losses ........................................................................................ 59
Figure 61: Graphic progress of 4th prototype DRFB disc crown tensile test ...................................... 60
Figure 62: Graphic progress of 4th prototype DRFB disc hub tensile test .......................................... 60
Figure 63: DRFB disc hub graphic fracture toughness test progress ................................................. 64
Figure 64: DRFB disc crown graphic fracture toughness progress .................................................... 64
Figure 65: 4th prototype DRFB disc .................................................................................................... 65
Figure 66: Temperatures of DRFB disc during 2A2 test program ...................................................... 67
Figure 67: Temperatures of disc during heat dissipation test ........................................................... 68
Figure 68: Temperatures of DRFB disc during DB-175 test ............................................................... 69
Figure 69: 4th prototype after DB-175 program ................................................................................. 69
Figure 70: 4th prototype vibration measurement .............................................................................. 70
Figure 71: 4th prototype friction coefficient (Program 2A2) .............................................................. 71
Figure 72: 4th prototype ventilation losses ........................................................................................ 72
Figure 73: Graphic progress of 5th prototype DRFB disc crown tensile test ...................................... 73
Figure 74: DRFB disc crown graphic fracture toughness progress .................................................... 75
Figure 75: 5th prototype DRFB disc .................................................................................................... 76
Figure 76: Temperatures of DRFB disc during 2A2 test program ...................................................... 78
Figure 77: Temperatures of disc during heat dissipation test ........................................................... 79
Figure 78: Temperatures of DRFB disc during DB-175 test ............................................................... 80
Figure 79: 5th prototype after DB-175 program ................................................................................. 80
Figure 80: 5th prototype vibration measurement .............................................................................. 81
Figure 81: 5th prototype friction coefficient (Program 2A2) .............................................................. 82
Figure 82: 5th prototype ventilation losses ........................................................................................ 83
Project FUTURA Page: IX / X
LIST OF TABLES
Table 1: Reference standards .............................................................................................................. 2
Table 2: Operational condition ............................................................................................................ 3
Table 3: Characteristics of DRFB disc ................................................................................................... 4
Table 4: Characteristics of DRFB disc pads .......................................................................................... 4
Table 5: Dimensions of samples ......................................................................................................... 13
Table 6: Required values .................................................................................................................... 14
Table 7: 1st prototype tensile test results .......................................................................................... 16
Table 8: 1st prototype hardness test results ...................................................................................... 17
Table 9: 1st prototype fatigue test results.......................................................................................... 19
Table 10: 1st prototype Charpy test results ....................................................................................... 20
Table 11: 1st prototype fracture toughness test results .................................................................... 21
Table 12: 1st prototype fracture toughness test results .................................................................... 22
Table 13: 1st prototype noise level at braking ................................................................................... 24
Table 14: 1st prototype noise test results .......................................................................................... 25
Table 15: Vibration measurements.................................................................................................... 29
Table 16: 1st prototype pad wear ....................................................................................................... 32
Table 17: 2nd prototype tensile test results ....................................................................................... 34
Table 18: 2nd prototype hardness test results ................................................................................... 34
Table 19: 2nd prototype fatigue test results ....................................................................................... 35
Table 20: 2nd prototype Charpy test results ....................................................................................... 35
Table 21: 2nd prototype hub fracture toughness test results ............................................................ 37
Table 22: 2nd prototype crown fracture toughness test results ........................................................ 38
Table 23: 2nd prototype noise level at braking .................................................................................. 40
Table 24: 2nd prototype noise test results ......................................................................................... 41
Table 25: Vibration measurements.................................................................................................... 44
Table 26: 2nd prototype pad wear ...................................................................................................... 46
Table 27: 3rd prototype tensile test results ........................................................................................ 48
Table 28: 3rd prototype hardness test results .................................................................................... 48
Table 29: 3rd prototype fatigue test results ....................................................................................... 49
Table 30: 3rd prototype Charpy test results ....................................................................................... 49
Table 31: 3rd prototype hub fracture toughness test results ............................................................. 50
Table 32: 3rd prototype crown fracture toughness test results ......................................................... 51
Table 33: 3rd prototype noise level at braking ................................................................................... 53
Table 34: 3rd prototype noise test results .......................................................................................... 53
Table 35: Vibration measurements.................................................................................................... 57
Table 36: 3rd prototype pad wear ...................................................................................................... 59
Table 37: 4th prototype tensile test results ........................................................................................ 61
Table 38: 4th prototype hardness test results .................................................................................... 61
Table 39: 4th prototype fatigue test results ....................................................................................... 62
Table 40: 4th prototype Charpy test results ....................................................................................... 63
Table 41: 4th prototype hub fracture toughness test results ............................................................. 63
Project FUTURA Page: X / X
Table 42: 4th prototype crown fracture toughness test results ......................................................... 64
Table 43: 4th prototype noise level at braking ................................................................................... 66
Table 44: 4th prototype noise test results .......................................................................................... 67
Table 45: Vibration measurements.................................................................................................... 70
Table 46: 4th prototype pad wear ...................................................................................................... 72
Table 47: 5th prototype tensile test results ........................................................................................ 74
Table 48: 5th prototype hardness test results .................................................................................... 74
Table 49: 5th prototype crown fracture toughness test results ......................................................... 75
Table 50: 5th prototype noise level at braking ................................................................................... 77
Table 51: 5th prototype noise test results .......................................................................................... 77
Table 52: Vibration measurements.................................................................................................... 81
Table 53: 5th prototype pad wear ...................................................................................................... 83
Table 54: Overview and comparison of test results .......................................................................... 85
INDEX OF ABBREVIATIONS
DRFB Divided rail freight brake
UIC International Union of Railways
TSI Technical Specification for Interoperability
EN European Norm
ISO International Organization for Standardization
DB Deutsche Bahn
VT Visual Testing
MT Magnetic particle Testing
UT Ultrasonic testing
RT Radiographic examination
CFD Computational fluid dynamics
FEM Finite Element Method
CAD Computer Aided Design
HTC Heat transfer coefficient
MS Material Specification
Project FUTURA Page: 1 / 86
1 INTRODUCTION
The scope of the document is to present the laboratory testing of DRFB disc prototypes, and
compare their compliance against requirements defined in report D1.1.
The purpose of laboratory tests was to check frictional, thermal and another mechanical
characteristic of DRFB disc. The scope of tests were carefully chosen by VUD, as an expert in
laboratory testing, and Kovis, as an expert in the field of designing brake discs. These tests were
absolutely needed to confirm computer numerical calculations, and to compare the results to
requirements.
Within this work package, the following mechanical and dynamical tests were conducted in the
laboratory:
Tensile tests (sigma-epsylon diagrams),
Hardness tests (Vickers),
Fatigue material tests (S-N curves),
Charpy tests (ISO-V notch),
Fracture toughness
Local noise measurements during braking
Local noise measurements (while rotating the DRFB disc at certain speeds)
Temperature measurements by PT100 and PT1000 thermocouples at different positions on
DRFB disc crown and hub during single and multiple braking
Vibrations measurements (Imbalance measurements)
Coefficient of friction measurements between the DRFB disc and braking pads at different
velocities
Coefficient of friction measurements between the DRFB disc and braking pads at material
degradation (corrosion, dust, humidity, wet conditions)
Ventilation tests (power losses)
Measuring the wear and volume of material at single and multiple braking, determining the
mass (grams) and the volume of used material (cm3/MJ)
Project FUTURA Page: 2 / 86
Reference standards:
Table 1: Reference standards
Document Nr. Revision Title
ISO 6892-1 2016-07 Metallic materials -- Tensile testing -- Part 1: Method of test at room temperature
ISO 148-1 2016-10 Metallic materials -- Charpy pendulum impact test -- Part 1: Test method
ISO 6507-1 2005-12 Metallic materials -- Vickers hardness test -- Part 1: Test method
ISO 15653 2010-04 Metallic materials -- Method of test for the determination of quasistatic fracture toughness
UIC 541-3 2010-07 Brakes – Disc brakes and their application – General conditions for the approval of brake pads
STN 42 0363 1986-10 Metal testing. Fatigue testing of metals. Methodology of testing
ISO 12107 2012-08 Metallic materials -- Fatigue testing -- Statistical planning and analysis of data
TSI 2008/861/EC
2013-03 Technical specification for interoperability relating to the subsystem ‘rolling stock freight wagons’ of the rail system in the European Union
TSI 2011/291/EU
2011-04 Technical specification for interoperability relating to the ‘Rolling stock’ subsystem for conventional rail ‘Locomotives and passenger rolling stock’
EN 14535-1 2005-12 Railway applications – Brake discs for railway rolling stock– Part 1
EN 14535-3 2012-07 Railway applications – Brake discs for railway rolling stock– Part 3
EN ISO 17025 2005-05 General requirements for the competence of testing and calibration laboratories
EN 1561 2011-12 Founding – Grey cast irons
UIC 813 2003-12 Technical specification for the supply of wheelsets for tractive and trailing stock - Tolerances and assembly
EN 1370 2012-02 Founding – Examination of surface conditions
ISO 2768-1 1999-03 General tolerances – Part 1: Tolerances for linear and angular dimensions without individual tolerance indications
DIN 27205-2 2008-12 State of railway vehicles – brake – Part 2: Disc brake, mechanical part
DIN 27205-3 2010-11 State of railway vehicles – brake – Part 3: Ventilated axle mounted brake discs
Project FUTURA Page: 3 / 86
2 TECHNICAL REQUIREMENTS
2.1 Environmental requirement
The DRFB disc will be used for freight wagon bogies during normal European weather conditions.
The following conditions broadly apply:
Ambient temperature: -25ºC to 70ºC.
Occurring operation temperature corresponding to heat calculations brake disc.
Relative humidity: 30 to 100%.
Rain, snow, ice, ozone, smog, direct sunlight.
Sand, braking and iron oxide dust (abrasion wheel / rail) and sandstorms.
High water up to 50mm upper side track.
Snow up to 150mm upper side track.
Precipitation: hail, sleet, snow also frost and thaw alternating.
Fog.
Pollution by:
o Grease and oily substances.
o Toilet waste.
o Brake dust.
o Cleaners, detergents, etc.
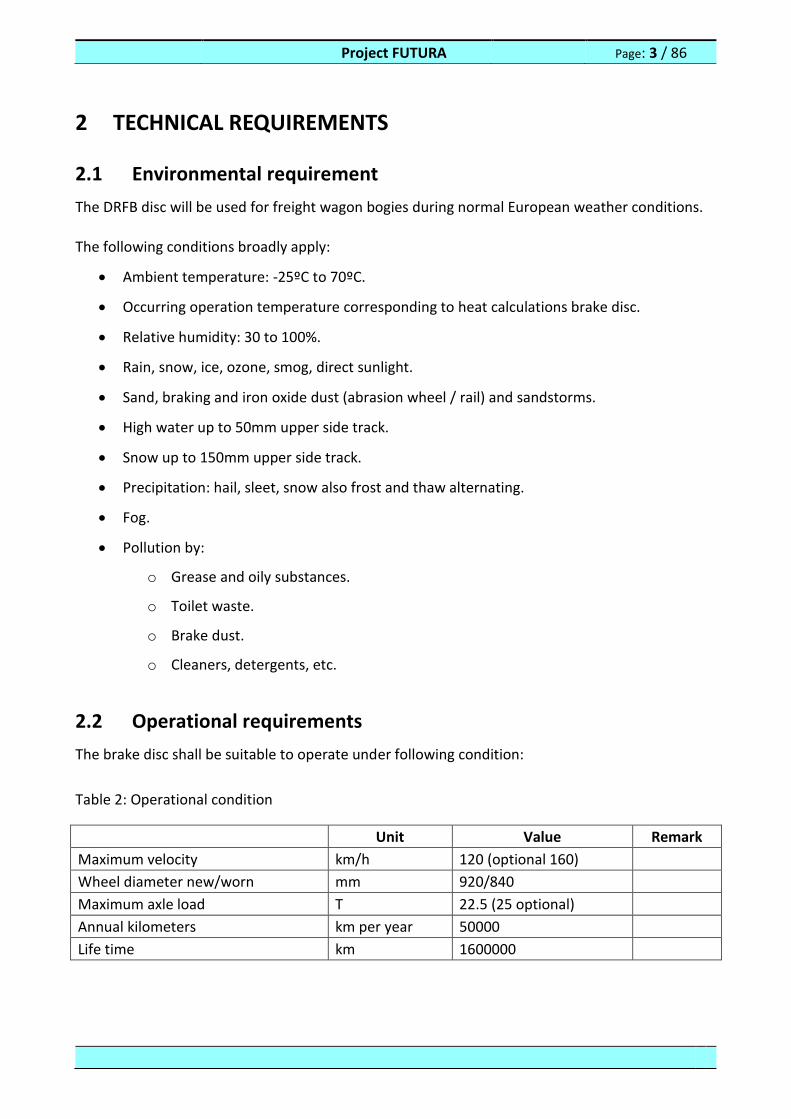
2.2 Operational requirements
The brake disc shall be suitable to operate under following condition:
Table 2: Operational condition
Unit Value Remark
Maximum velocity km/h 120 (optional 160)
Wheel diameter new/worn mm 920/840
Maximum axle load T 22.5 (25 optional)
Annual kilometers km per year 50000
Life time km 1600000
Project FUTURA Page: 4 / 86
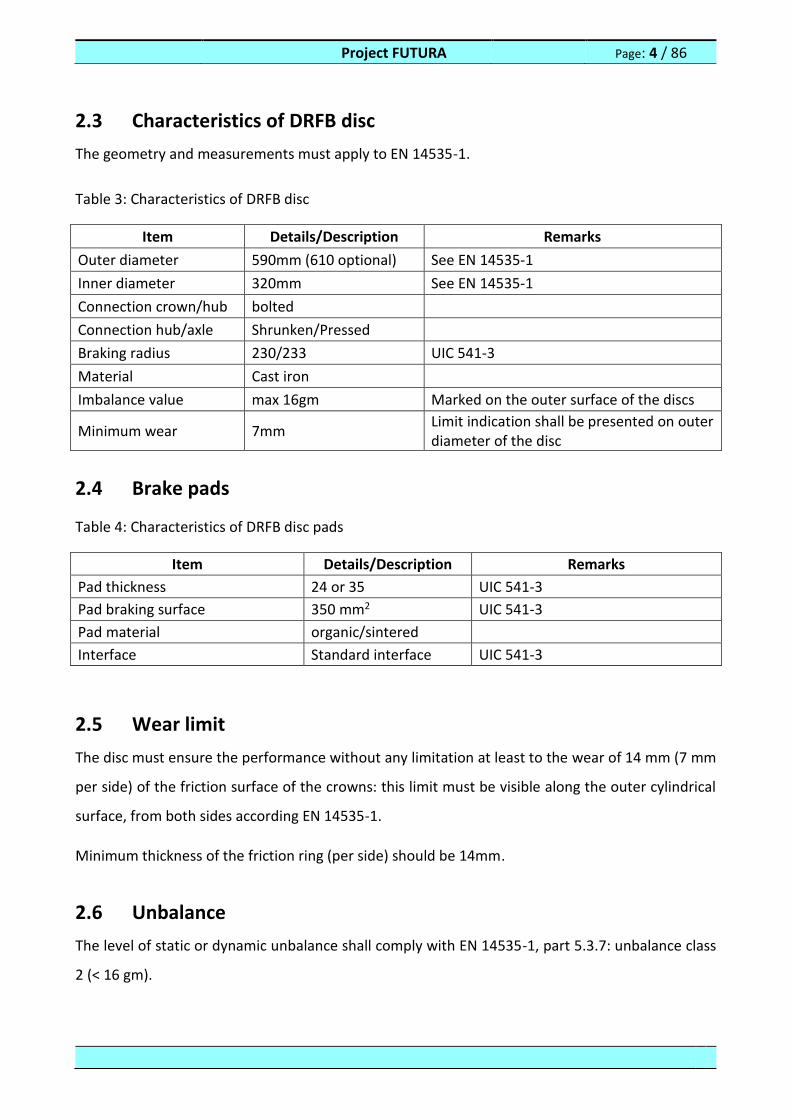
2.3 Characteristics of DRFB disc
The geometry and measurements must apply to EN 14535-1.
Table 3: Characteristics of DRFB disc
Item Details/Description Remarks
Outer diameter 590mm (610 optional) See EN 14535-1
Inner diameter 320mm See EN 14535-1
Connection crown/hub bolted
Connection hub/axle Shrunken/Pressed
Braking radius 230/233 UIC 541-3
Material Cast iron
Imbalance value max 16gm Marked on the outer surface of the discs
Minimum wear 7mm Limit indication shall be presented on outer diameter of the disc
2.4 Brake pads
Table 4: Characteristics of DRFB disc pads
Item Details/Description Remarks
Pad thickness 24 or 35 UIC 541-3
Pad braking surface 350 mm2 UIC 541-3
Pad material organic/sintered
Interface Standard interface UIC 541-3
2.5 Wear limit
The disc must ensure the performance without any limitation at least to the wear of 14 mm (7 mm
per side) of the friction surface of the crowns: this limit must be visible along the outer cylindrical
surface, from both sides according EN 14535-1.
Minimum thickness of the friction ring (per side) should be 14mm.
2.6 Unbalance
The level of static or dynamic unbalance shall comply with EN 14535-1, part 5.3.7: unbalance class
2 (< 16 gm).
Project FUTURA Page: 5 / 86
2.7 Oscillation (runout)
Every complete brake disc, and disc itself, shall be checked for oscillation (squareness, runout) and
must comply with the drawing indicated values.
2.8 Marking
2.8.1 DRFB disc Crown
The marking of the DRFB disc crown must be compliant with the reference drawings. Every DRFB
disc crown has a unique serial number. With this serial number, it must be possible to track the
brake disc from cast process until final product. The serial number must be printed on the test
reports.
The location of the unbalance, the value of the unbalance must be marked on the brake disc in gm.
On one of the rough surfaces of the braking of the crown or in the field, immediately after the
pouring, there must be following markings:
Batch number.
Coding of the supplier.
Month and year of manufacture.
2.8.2 DRFB disc Hub
The marking of the DRFB disc hub must be compliant with the reference drawings. Every DRFB disc
hub has a unique serial number. It must be possible with this serial number to track the brake disc
hub from forging process until final product. The serial number must be printed on the test reports.
The location must be marked on the brake disc hub.
On one of the overhead surfaces of the braking of the disc hub, immediately after the forging –
during trimming process, there must be following markings:
Type of disc hub.
Coding of the supplier.
Number of drawing.
Month and year of manufacture.
Batch code.
Project FUTURA Page: 6 / 86
2.8.3 DRFB disc
On the finished brake disc there must be following marking:
Brake disc dimension.
Brake disc serial number.
Month of production.
Year of production.
Quality control stamp.
2.9 Surface roughness
The surface roughness should be such that unacceptable stress during assembly is prevented.
The surface roughness for the wear surface and hub is:
Friction wear surface: Rz ≤ 3,2.
Hub hole: Ra <= 1,6.
2.10 Mounting
A complete brake disc (disc + hub) will be mounted by press force or by shrunk method. The
mounting process shall be executed according to the proper manual (information how to mount the
brake disc correctly (pressure, press liquid) and which tools should be used for mounting and
demounting).
2.11 Requirements concerning the materials of DRFB disc crown
The material for DRFB disc crown construction shall have chemical composition and mechanical
properties that fall within the tolerance provided for the design. The used materials may be:
Gray (lamellar) cast iron.
Ductile cast iron.
2.12 Requirements concerning the materials of DRFB disc hub
The material for DRFB disc hub construction shall have chemical composition and mechanical
properties that fall within the tolerance provided for the design. The used materials may be:
Project FUTURA Page: 7 / 86
Steel for quenching and tempering.(for example, according standards EN 10083-2, EN10083-
3 or EN 10293)
2.13 Complete disc
The tests and examinations to which the complete disks are to be submitted are as follows:
Visual and dimensional inspection.
Balancing test.
Runout test.
2.13.1 Visual and dimensional inspection
It aims to verify the completeness and correctness of the assembly and of all the constituent parts
of the disc according to the related drawings.
2.13.2 Balancing test
The balancing of the entire disc may be done either with static or dynamic balancing machines that
the sensitivity of the apparatus is such as to allow the transaction to be completed with the required
accuracy. After locating the diametrical plane on which it manifests the imbalance of the disc, we
will proceed with the operation of balancing. For it must be observed the following:
The imbalance in excess of the allowable limit must be eliminated only by removal of metal
from cold areas provided for in the design and preferably on the outer cylindrical surface of
the crowns or cooling fins.
A complete disc will be considered balanced when the residual unbalance will be contained below
the values predicted by the design of the disc itself.
In any case, the residual unbalance of the disc brake shall not exceed that provided for Class 2 in
section 5.3.7 of EN 14535-1.
The rest imbalance of the disc must be clearly marked on the place of highest imbalance value.
Project FUTURA Page: 8 / 86
2.13.3 Runout test
The maximum runout of the braking surfaces of the crown must be verified by mounting the disc on
a cylindrical pin with a pressure sufficient to avoid any mutual sliding and resting, in correspondence
to the two flow rates of the pin, on two supports such as to allow complete rotation of the disc in a
perfectly vertical plane.
The detected value must not exceed the limit imposed by the design of the disc.
2.14 Preservation
The surfaces, which are to be protected, are indicated on the reference drawing.
Unless otherwise agreed the protection is:
DRFB disc crown – outside: ANTICORIT DFW 330 IP.
Hub – outside: ANTICORIT DFW 330 IP.
3 MECHANICAL TESTS OF PROTOTYPES
From each prototype of DRFB disc and hub, samples of basic raw material were taken for different
mechanical tests. Followed by this, samples were machined according to the test standard, for
which they were used. Samples were prepared for following tests:
Tensile tests (sigma-epsilon diagrams),
Hardness tests (Vickers),
Fatigue material tests (S-N curves),
Charpy tests (ISO-V notch),
Fracture toughness
4 PREPARATION OF SAMPLES
At first, samples of different prototypes of DRB disc and hub were delivered to the laboratory.
Followed by this, samples were marked and sent for mechanical machining, where they were
machined on the final shape, suitable for mechanical testing.
Project FUTURA Page: 9 / 86
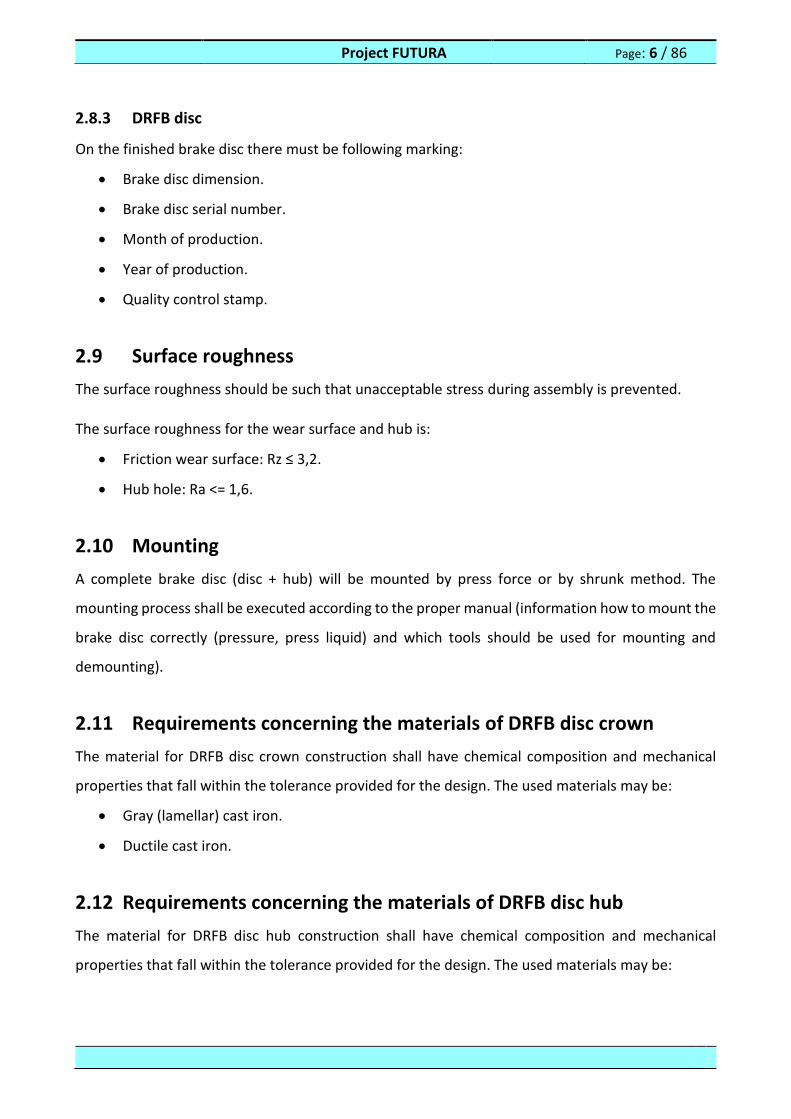
Figure 1: Samples of DRFB disc and hub
From raw material, samples were taken for material tests. Samples were taken from discs and hubs
in such way that all the critical places of the finished products were covered.
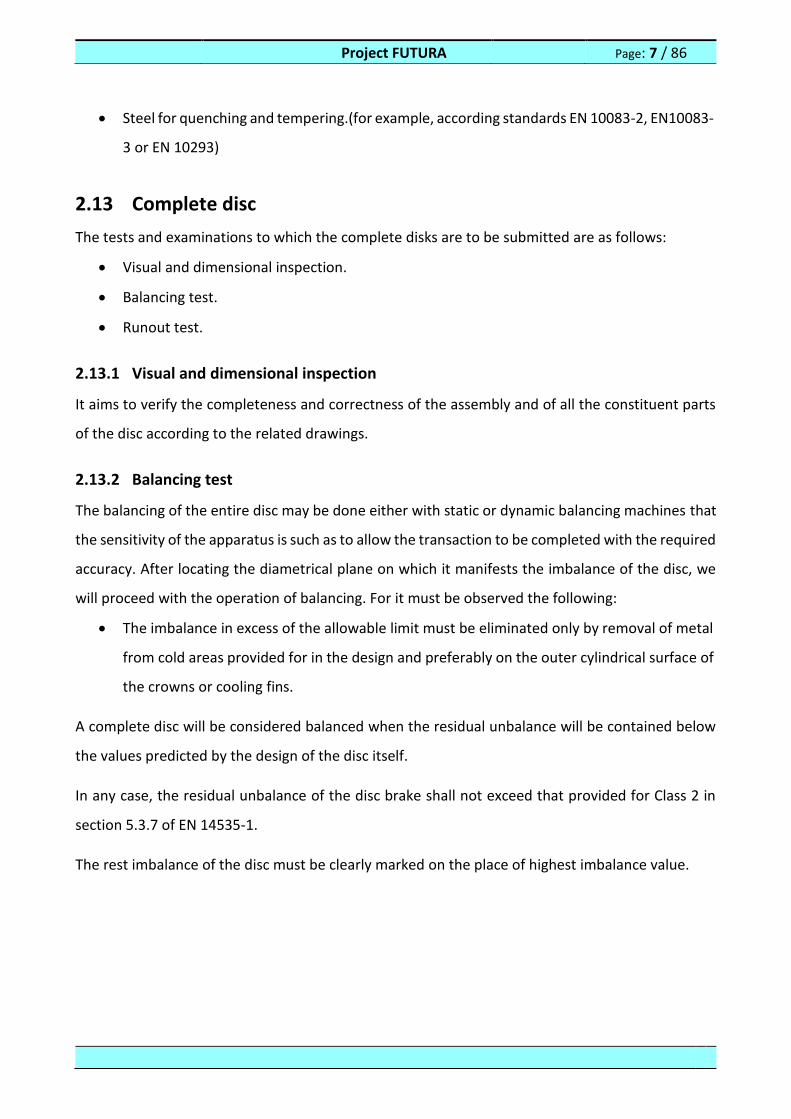
For this reason, the samples were deployed throughout the whole discs and hubs, both in vertical
and horizontal planes (see figures 2-3). Additionally, there were multiple samples taken from the
same locations, the number of which was given by space options.
It was from 3 to 15 samples from one location. The samples were then machined according to the
requirements of the relevant standards. For each prototype, samples were taken from the same
sides.
Figure 2: Cut samples of DRFB disc hub

Project FUTURA Page: 10 / 86
Figure 3: Cut samples of DRFB disc crown
4.1 Tensile test samples
Samples were machined in accordance with standard EN ISO 6892-1 “Metallic materials — Tensile
testing - Part 1: Method of test at room temperature”, article 6.
Preferred test pieces have a direct relationship between the original gauge length, Lo, and the
original cross-sectional area, So, expressed by the equation Lo = k √So , where k is a coefficient of
proportionality, and are called proportional test pieces. The internationally adopted value for k is
5,65. The original gauge length shall be not less than 15 mm. When the cross-sectional area of the
test piece is too small for this requirement to be met with, k = 5,65, a higher value (preferably 11,3)
or a non-proportional test piece may be used.
Machined test pieces shall incorporate a transition radius between the gripped ends and the parallel
length if these have different dimensions. The gripped ends may be of any shape to suit the grips of
the testing machine. The axis of the test piece shall coincide with the axis of application of the force.
The parallel length, Lc, or, in the case where the test piece has no transition radii, the free length
between the grips, shall always be greater than the original gauge length, Lo.
Project FUTURA Page: 11 / 86
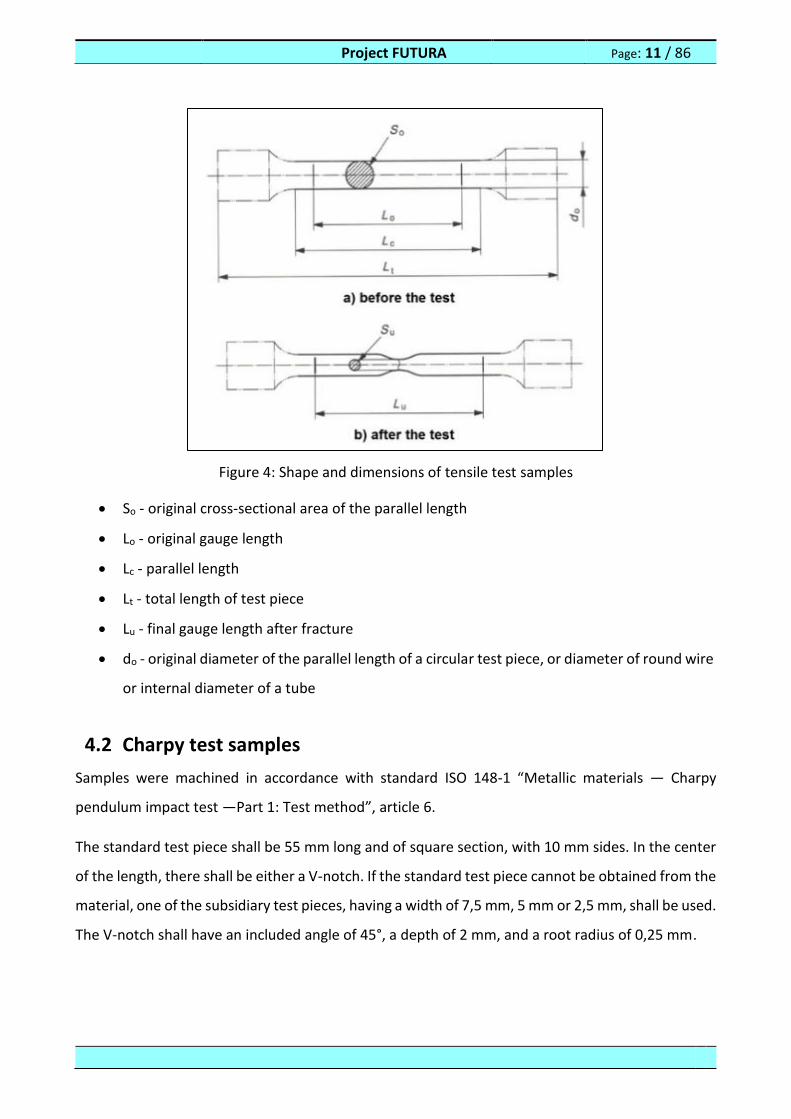
Figure 4: Shape and dimensions of tensile test samples
So - original cross-sectional area of the parallel length
Lo - original gauge length
Lc - parallel length
Lt - total length of test piece
Lu - final gauge length after fracture
do - original diameter of the parallel length of a circular test piece, or diameter of round wire
or internal diameter of a tube
4.2 Charpy test samples
Samples were machined in accordance with standard ISO 148-1 “Metallic materials — Charpy
pendulum impact test —Part 1: Test method”, article 6.
The standard test piece shall be 55 mm long and of square section, with 10 mm sides. In the center
of the length, there shall be either a V-notch. If the standard test piece cannot be obtained from the
material, one of the subsidiary test pieces, having a width of 7,5 mm, 5 mm or 2,5 mm, shall be used.
The V-notch shall have an included angle of 45°, a depth of 2 mm, and a root radius of 0,25 mm.

Project FUTURA Page: 12 / 86
Figure 5: Shape and dimensions of Charpy test samples
4.3 Hardness test samples
Samples were machined in accordance with standard ISO 6507-1 “Metallic materials -- Vickers
hardness test -- Part 1: Test method”, article 6.
The test shall be carried out on a surface which is smooth and even, free from oxide scale, foreign
matter and, in particular, completely free from lubricants, unless otherwise specified in product
standards. The finish of the surface shall permit accurate determination of the diagonal length of
the indentation.
Preparation shall be carried out in such a way that any alteration of the surface hardness, due to
excessive heating or cold-working, for example, is minimized.
Due to the small depth of Vickers micro hardness indentations, it is essential that special precautions
are taken during preparation. It is recommended to use a polishing/electro polishing process which
is suitable for the material parameters.
The thickness of the test piece, or of the layer under test, shall be at least 1,5 times the diagonal
length of the indentation. No deformation shall be visible at the back of the test piece after the test.

Project FUTURA Page: 13 / 86
4.4 Fracture toughness samples
Samples were machined in accordance with standard ISO 15653 “Metallic materials - Method of test
for the determination of quasistatic fracture toughness”.
The samples were machined so that the body surface material is not affected by technological
operations.
Figure 6: Shape and dimensions of fracture toughness samples
Table 5: Dimensions of samples
4.4.1 Samples for fatigue material tests
Samples for fatigue material test were machined in the same way as samples for tensile test (Figure
4).
Dimension B W amax an emax L L1min
10 10 20 13 8 2,5 80 90
25 25 50 30 24 3,0 200 210
50 50 100 60 48 4,0 400 420
75 75 150 90 72 4,0 600 630
100 100 200 120 97 5,0 800 840
In general 0,5 W W (0,45-0,65) 0,48 W 0,025 W 4 W 4,2 W
Tolerance ±0,01 W ±0,005 W - - - ±0,2 W -

Project FUTURA Page: 14 / 86
4.5 Requirements
Prior to start of dynamic and braking tests, one DRFB disc, from each prototype, was randomly
chosen for taking samples for destructive material tests, and test samples were made from this disc
according to particular standards.
Results of these tests were then compared to required values stated on material certificates in
production documentation for material EN-GJL-250 of DRFB disc crown, and C45E+QT for material
of DRFB disc hub.
Table 6: Required values
5 1ST PROTOTYPE LABORATORY TESTS
5.1 1st prototype mechanical tests
5.1.1 Tensile test
Three samples for destructive tests were prepared. Test samples were made according to standard
EN ISO 6892-1 Metallic materials - Tensile testing - Part 1: Method of test at room temperature.
Results of these tests were compared with values stated on material certificates and material norms
of production documentation for material EN-GJL-250 and C45E+QT.
Figure 7: Tensile test machined samples
Product Material Rp0,2 Rm A Kv Hardness test
[MPa] [MPa] [%] [J] [HBW]
disc EN-GJL-250 - 250-350 - - 190-240
hub C45E+QT min. 370 630-780 min. 17 32 187-235
Project FUTURA Page: 15 / 86
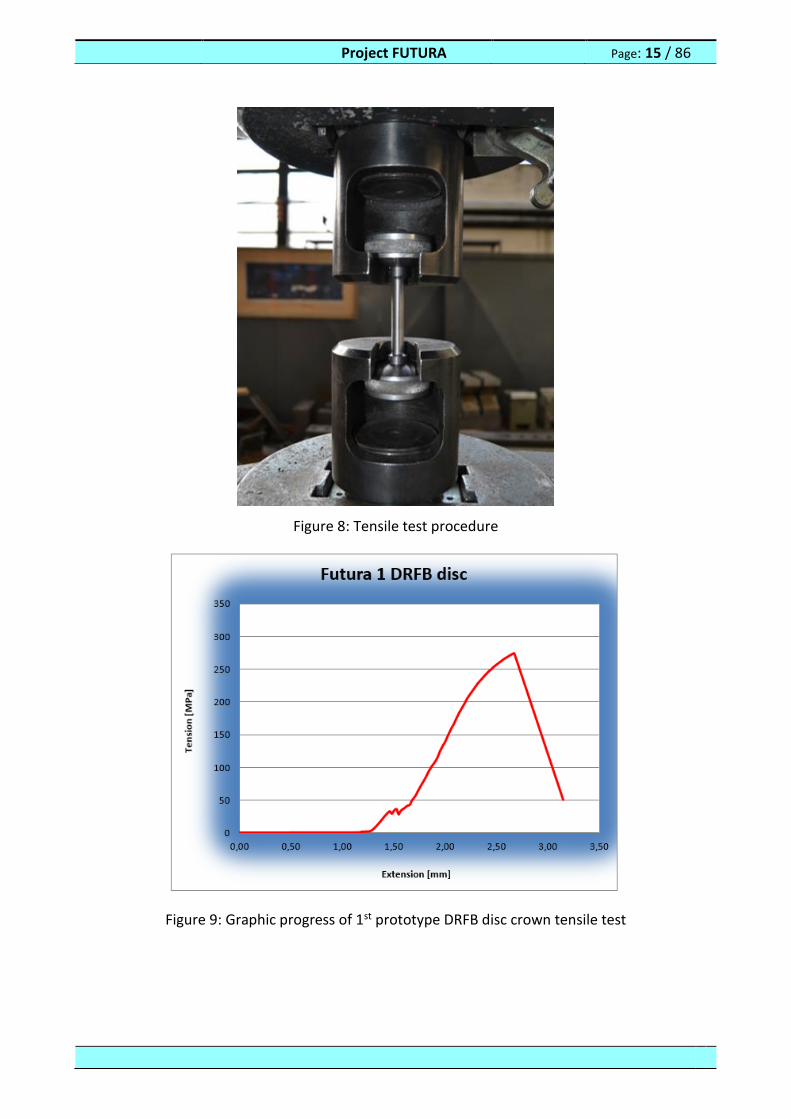
Figure 8: Tensile test procedure
Figure 9: Graphic progress of 1st prototype DRFB disc crown tensile test
Project FUTURA Page: 16 / 86
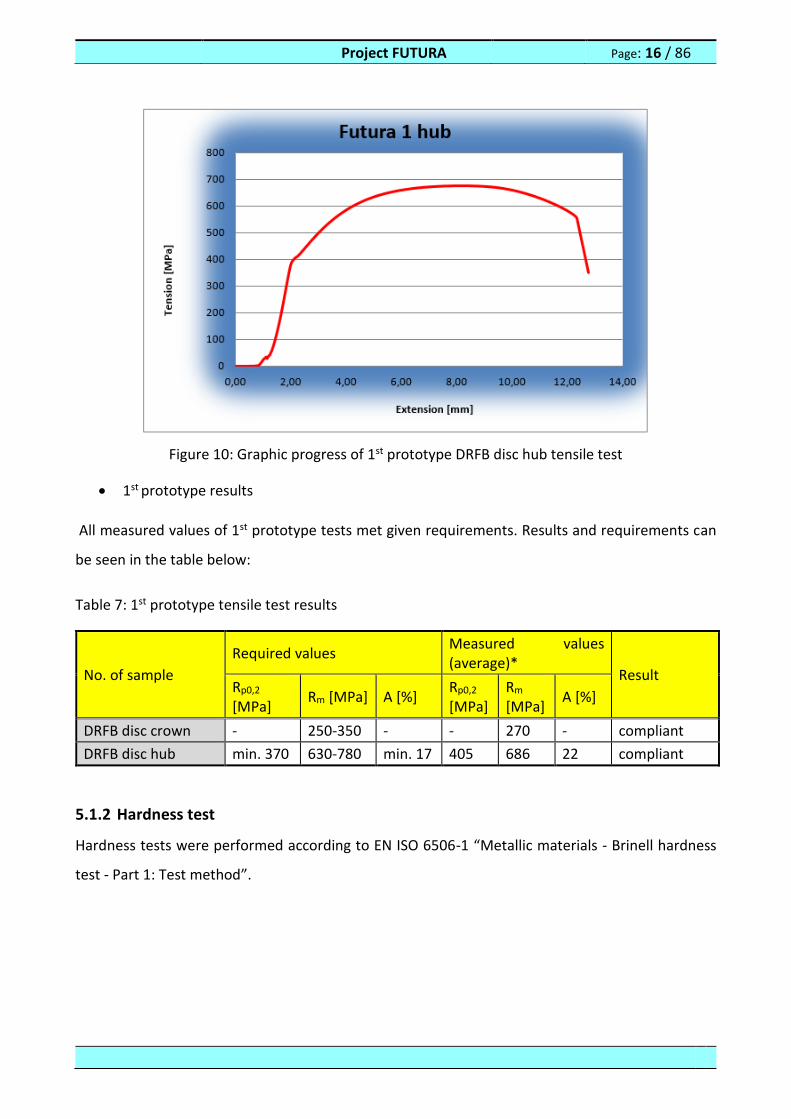
Figure 10: Graphic progress of 1st prototype DRFB disc hub tensile test
1st prototype results
All measured values of 1st prototype tests met given requirements. Results and requirements can
be seen in the table below:
Table 7: 1st prototype tensile test results
No. of sample
Required values Measured values (average)*
Result Rp0,2
[MPa] Rm [MPa] A [%]
Rp0,2
[MPa] Rm [MPa]
A [%]
DRFB disc crown - 250-350 - - 270 - compliant
DRFB disc hub min. 370 630-780 min. 17 405 686 22 compliant
5.1.2 Hardness test
Hardness tests were performed according to EN ISO 6506-1 “Metallic materials - Brinell hardness
test - Part 1: Test method”.

Project FUTURA Page: 17 / 86
Figure 11: Hardness test process
1st prototype results
All measured values of 1st prototype tests met given requirements. Results and requirements can
be seen in the table below:
Table 8: 1st prototype hardness test results
No. of sample
Required values Measured values (average)*
Result Hardness
[HBW]
Hardness
[HBW]
DRFB disc crown 190-240 199 satisfied
DRFB disc hub 187-235 200 satisfied
5.1.3 Fatigue material test
Fatigue material tests were performed according to STN 42 0363 “Metal testing. Fatigue testing of
metals. Methodology of testing”, and ISO 12107 “Metallic materials - Fatigue testing - Statistical
planning and analysis of data”.
The objective of the test was to prove endurance strength at sample with non-modified (not
grinded) surface of sample at level of stress δu= 114 MPa. Sample of material was loaded with cyclic
loading force with sinusoidal course, and maximum amplitude which loads sample with stress above
114 MPa.
Project FUTURA Page: 18 / 86
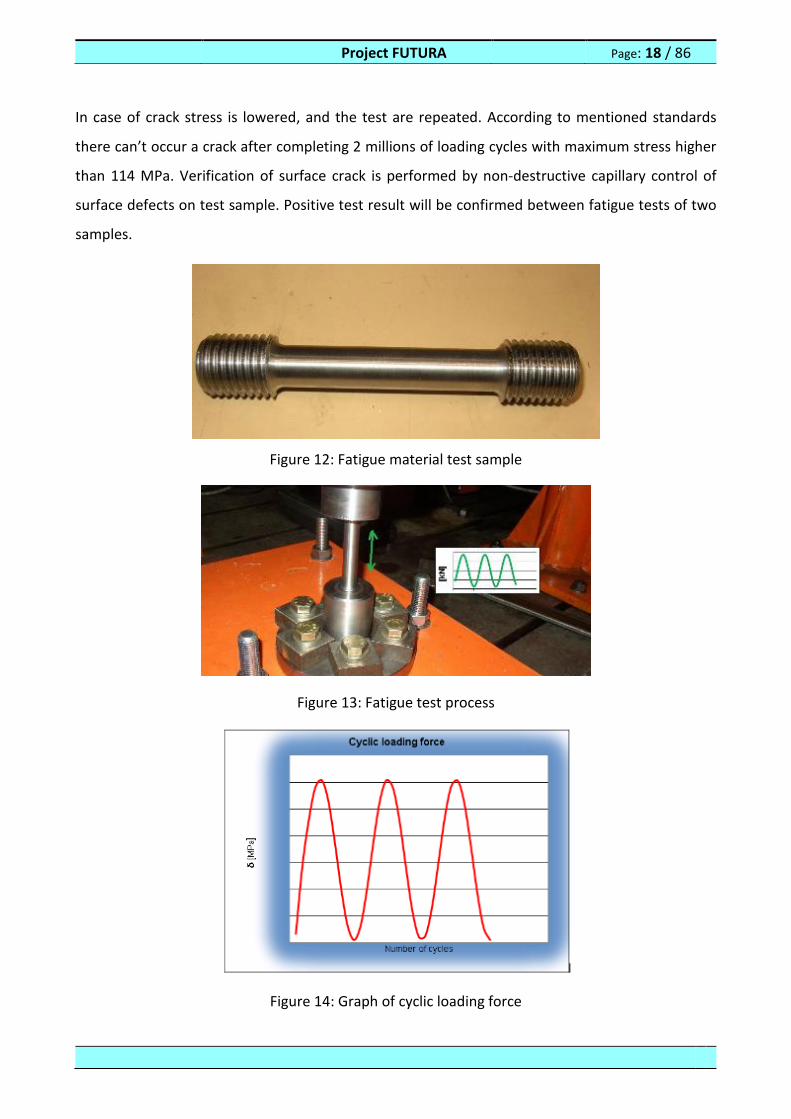
In case of crack stress is lowered, and the test are repeated. According to mentioned standards
there can’t occur a crack after completing 2 millions of loading cycles with maximum stress higher
than 114 MPa. Verification of surface crack is performed by non-destructive capillary control of
surface defects on test sample. Positive test result will be confirmed between fatigue tests of two
samples.
Figure 12: Fatigue material test sample
Figure 13: Fatigue test process
Figure 14: Graph of cyclic loading force
Project FUTURA Page: 19 / 86
1st prototype results
All measured values of 1st prototype tests met given requirements. Results and requirements can
be seen in the table below:
Table 9: 1st prototype fatigue test results
No. of sample Material Required level of fatigue stress δu
[MPa]
Level of stress without cracks 2 samples
[MPa]
DRFB disc hub C45E+QT min. 114 220
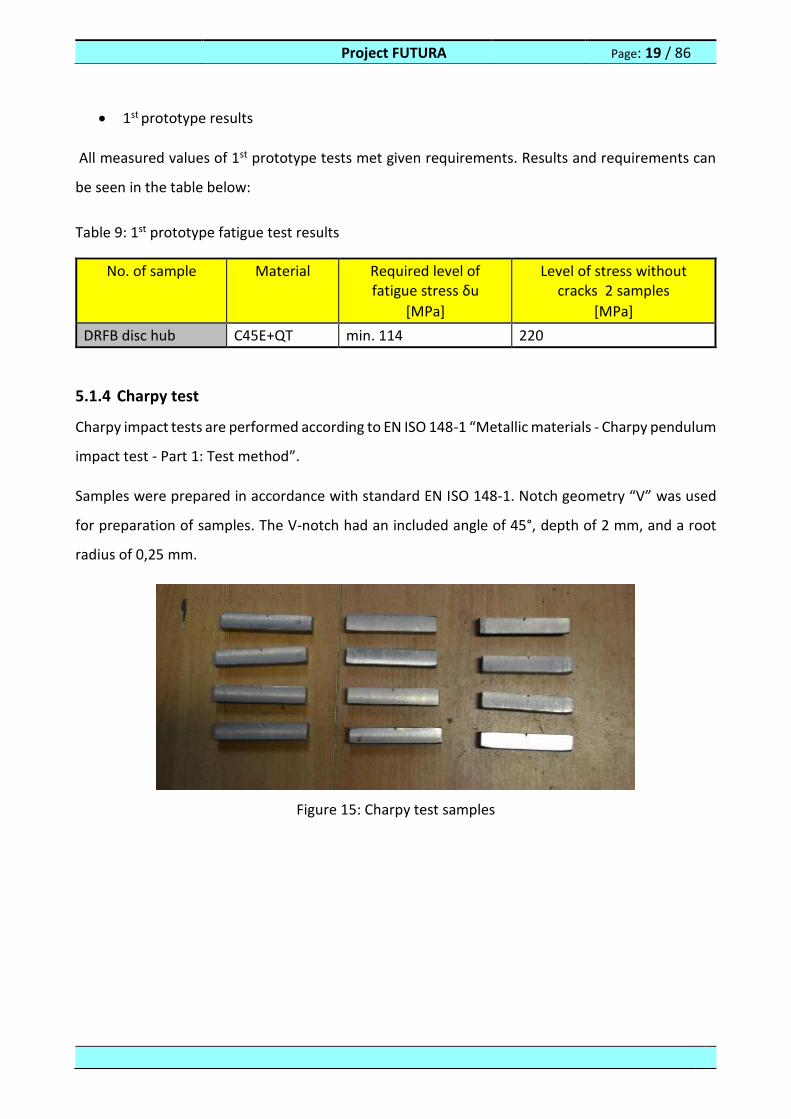
5.1.4 Charpy test
Charpy impact tests are performed according to EN ISO 148-1 “Metallic materials - Charpy pendulum
impact test - Part 1: Test method”.
Samples were prepared in accordance with standard EN ISO 148-1. Notch geometry “V” was used
for preparation of samples. The V-notch had an included angle of 45°, depth of 2 mm, and a root
radius of 0,25 mm.
Figure 15: Charpy test samples
Project FUTURA Page: 20 / 86
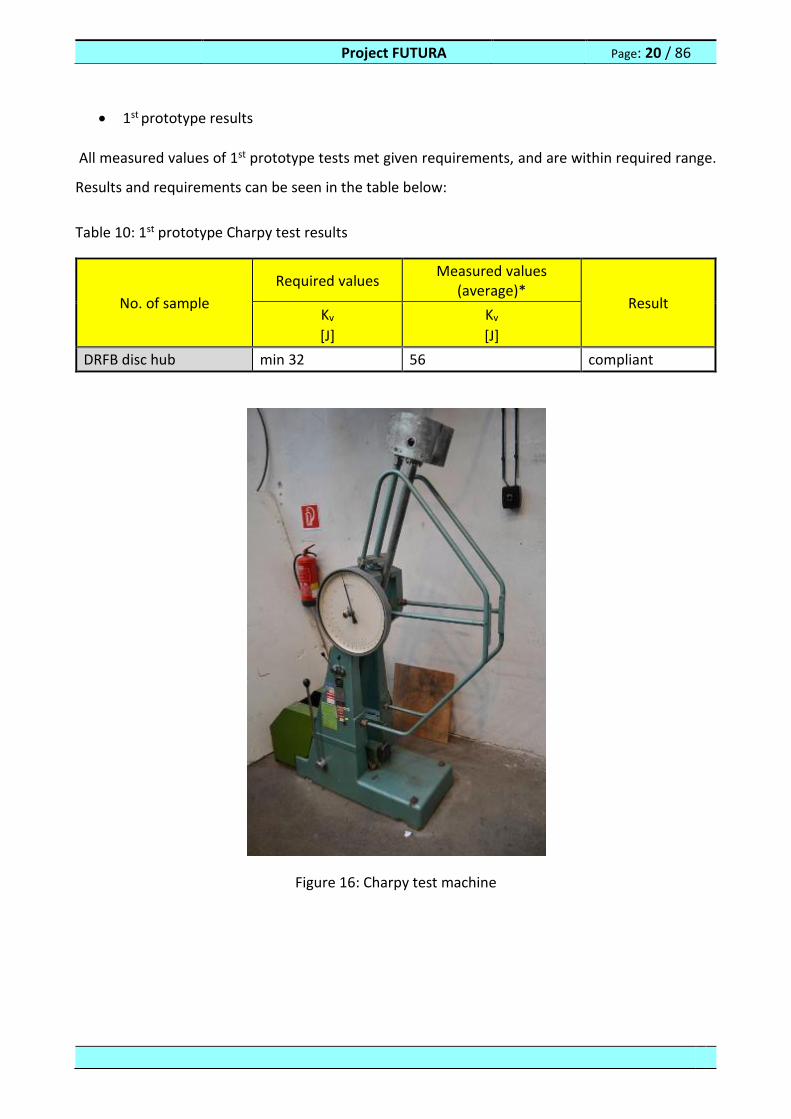
1st prototype results
All measured values of 1st prototype tests met given requirements, and are within required range.
Results and requirements can be seen in the table below:
Table 10: 1st prototype Charpy test results
No. of sample
Required values Measured values
(average)* Result
Kv
[J]
Kv
[J]
DRFB disc hub min 32 56 compliant
Figure 16: Charpy test machine
Project FUTURA Page: 21 / 86
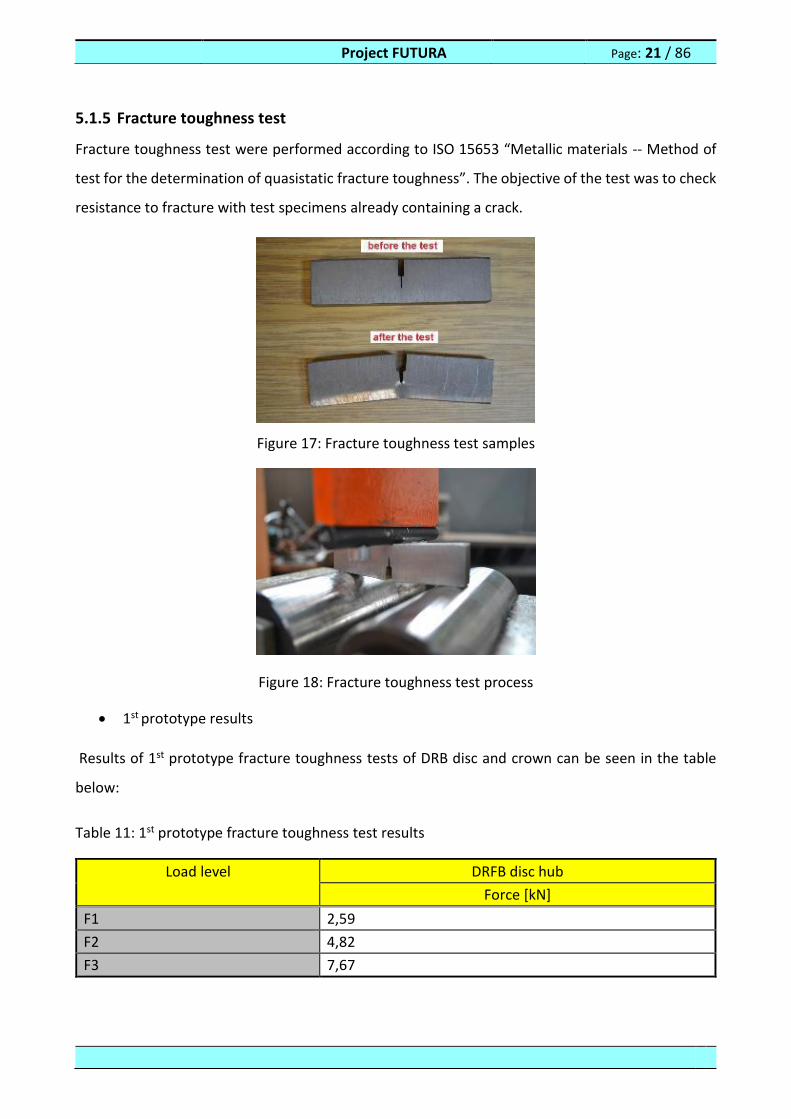
5.1.5 Fracture toughness test
Fracture toughness test were performed according to ISO 15653 “Metallic materials -- Method of
test for the determination of quasistatic fracture toughness”. The objective of the test was to check
resistance to fracture with test specimens already containing a crack.
Figure 17: Fracture toughness test samples
Figure 18: Fracture toughness test process
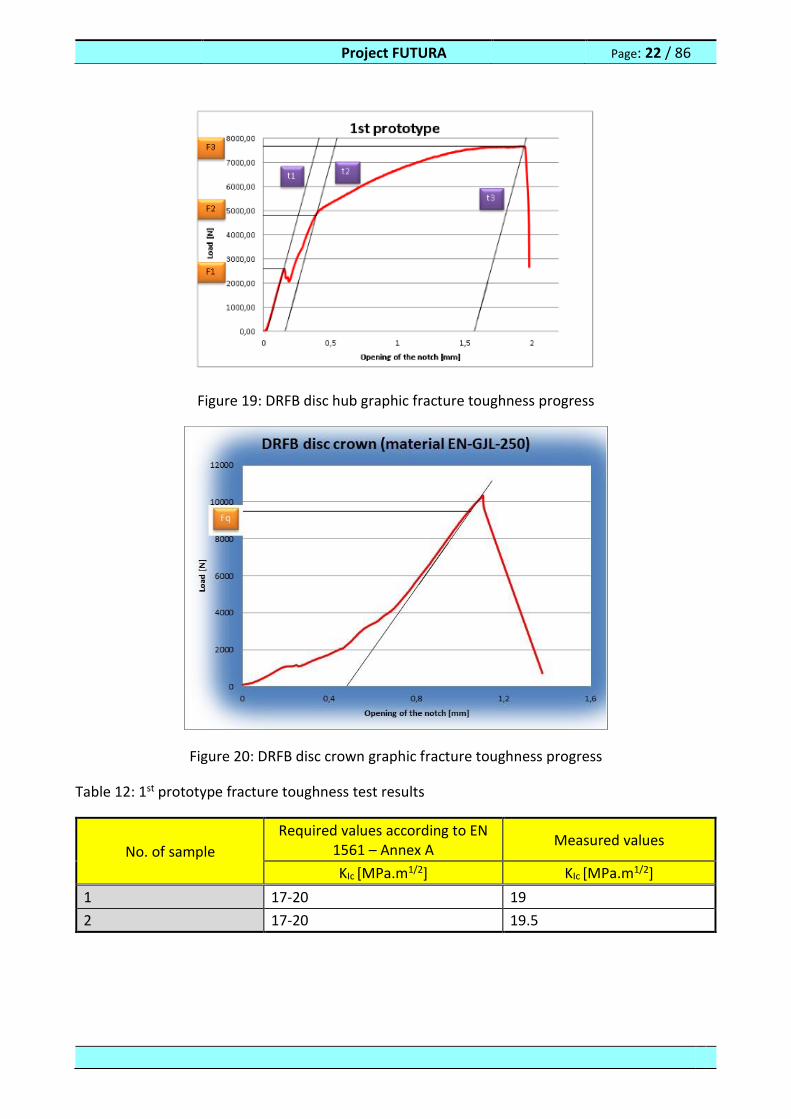
1st prototype results
Results of 1st prototype fracture toughness tests of DRB disc and crown can be seen in the table
below:
Table 11: 1st prototype fracture toughness test results
Load level DRFB disc hub
Force [kN]
F1 2,59
F2 4,82
F3 7,67
Project FUTURA Page: 22 / 86
Figure 19: DRFB disc hub graphic fracture toughness progress
Figure 20: DRFB disc crown graphic fracture toughness progress
Table 12: 1st prototype fracture toughness test results
No. of sample
Required values according to EN 1561 – Annex A
Measured values
KIc [MPa.m1/2] KIc [MPa.m1/2]
1 17-20 19
2 17-20 19.5
Project FUTURA Page: 23 / 86
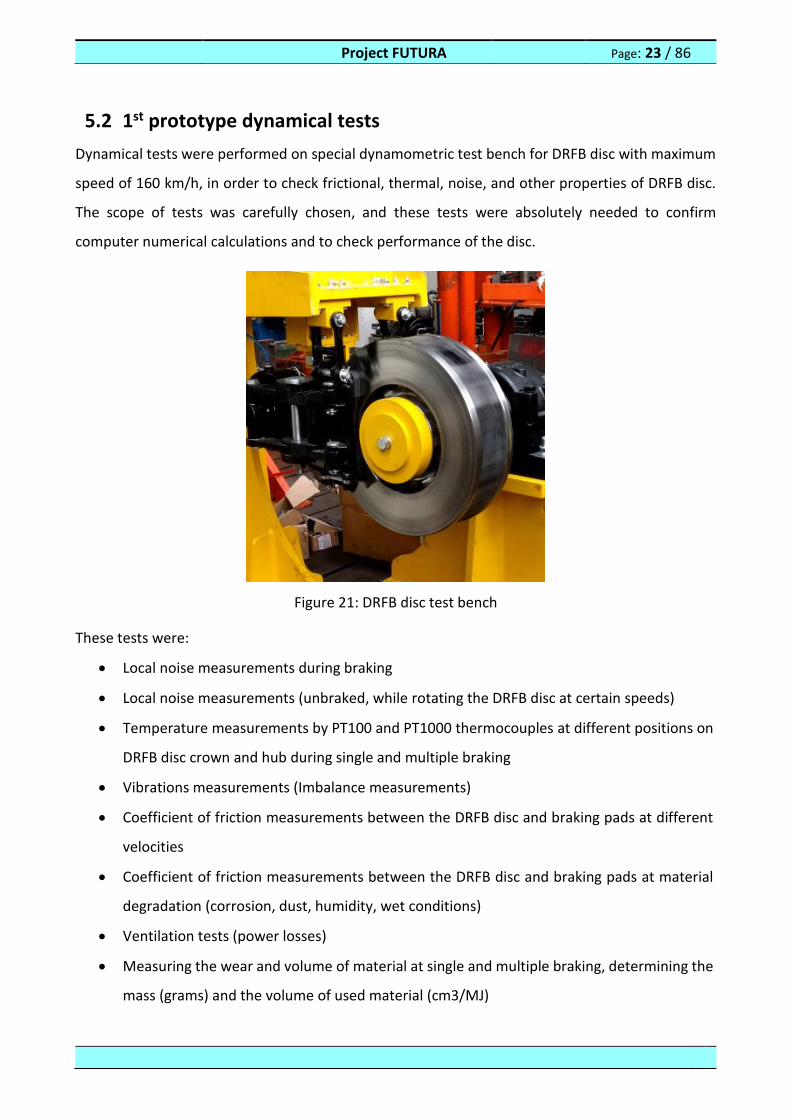
5.2 1st prototype dynamical tests
Dynamical tests were performed on special dynamometric test bench for DRFB disc with maximum
speed of 160 km/h, in order to check frictional, thermal, noise, and other properties of DRFB disc.
The scope of tests was carefully chosen, and these tests were absolutely needed to confirm
computer numerical calculations and to check performance of the disc.
Figure 21: DRFB disc test bench
These tests were:
Local noise measurements during braking
Local noise measurements (unbraked, while rotating the DRFB disc at certain speeds)
Temperature measurements by PT100 and PT1000 thermocouples at different positions on
DRFB disc crown and hub during single and multiple braking
Vibrations measurements (Imbalance measurements)
Coefficient of friction measurements between the DRFB disc and braking pads at different
velocities
Coefficient of friction measurements between the DRFB disc and braking pads at material
degradation (corrosion, dust, humidity, wet conditions)
Ventilation tests (power losses)
Measuring the wear and volume of material at single and multiple braking, determining the
mass (grams) and the volume of used material (cm3/MJ)
Project FUTURA Page: 24 / 86
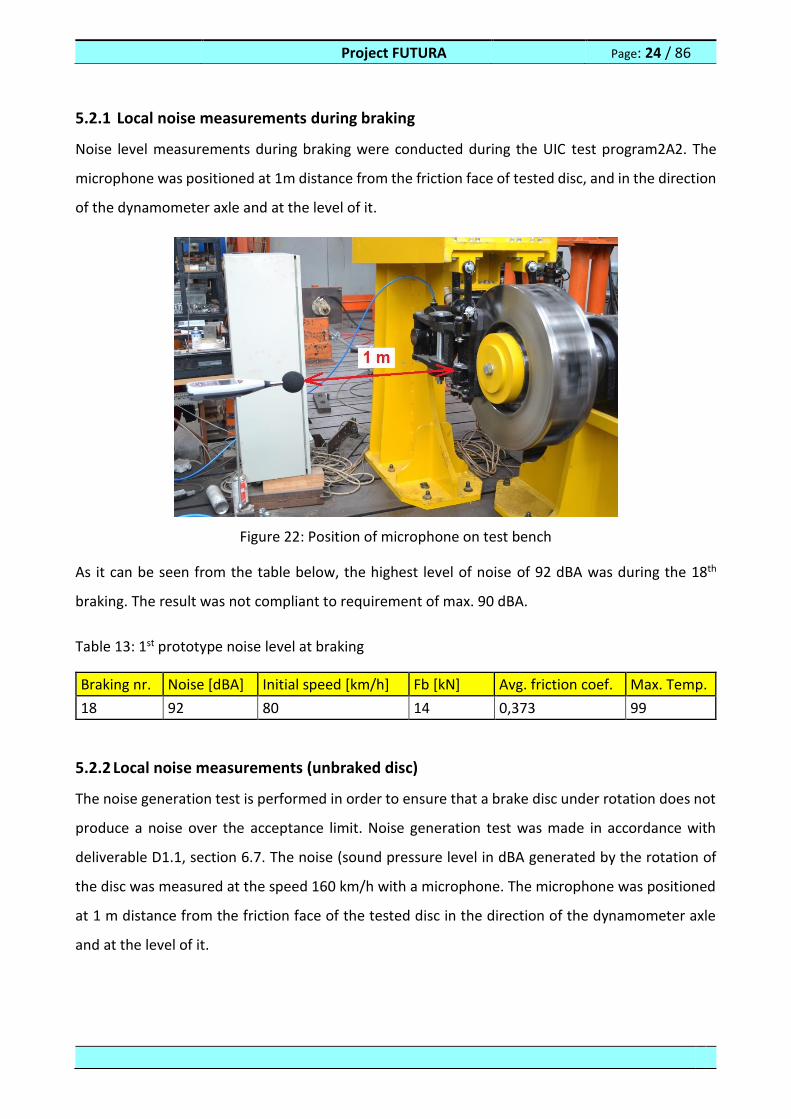
5.2.1 Local noise measurements during braking
Noise level measurements during braking were conducted during the UIC test program2A2. The
microphone was positioned at 1m distance from the friction face of tested disc, and in the direction
of the dynamometer axle and at the level of it.
Figure 22: Position of microphone on test bench
As it can be seen from the table below, the highest level of noise of 92 dBA was during the 18th
braking. The result was not compliant to requirement of max. 90 dBA.
Table 13: 1st prototype noise level at braking
Braking nr. Noise [dBA] Initial speed [km/h] Fb [kN] Avg. friction coef. Max. Temp.
18 92 80 14 0,373 99
5.2.2 Local noise measurements (unbraked disc)
The noise generation test is performed in order to ensure that a brake disc under rotation does not
produce a noise over the acceptance limit. Noise generation test was made in accordance with
deliverable D1.1, section 6.7. The noise (sound pressure level in dBA generated by the rotation of
the disc was measured at the speed 160 km/h with a microphone. The microphone was positioned
at 1 m distance from the friction face of the tested disc in the direction of the dynamometer axle
and at the level of it.
Project FUTURA Page: 25 / 86
The measurement of noise was conducted at maximum speed of 160 km/h until a steady state of
speed was reached. Then the noise was recorded for two minutes.
As a result of noise measurement, first prototype had value of 52 dBA, which is the lower value than
prescribed in D1.1, section 6.7.1.
Table 14: 1st prototype noise test results
Measured value Requirement
dBA dBA
1st prototype 52 60
5.2.3 Temperature measurements at different positions on DRFB disc crown and hub during single and multiple braking
Temperature measurements were conducted for several tests for all DRFB discs prototypes. These
tests were performed according requirement described in D1.1. The scope of tests was:
Test of frictional characteristic (Test program 2A2 from UIC 541‐3 with modified speed to
160 km/h).
Heat dissipation test (Drag brake)
DB – 175 Regulated braking (Thermal shock resistance)
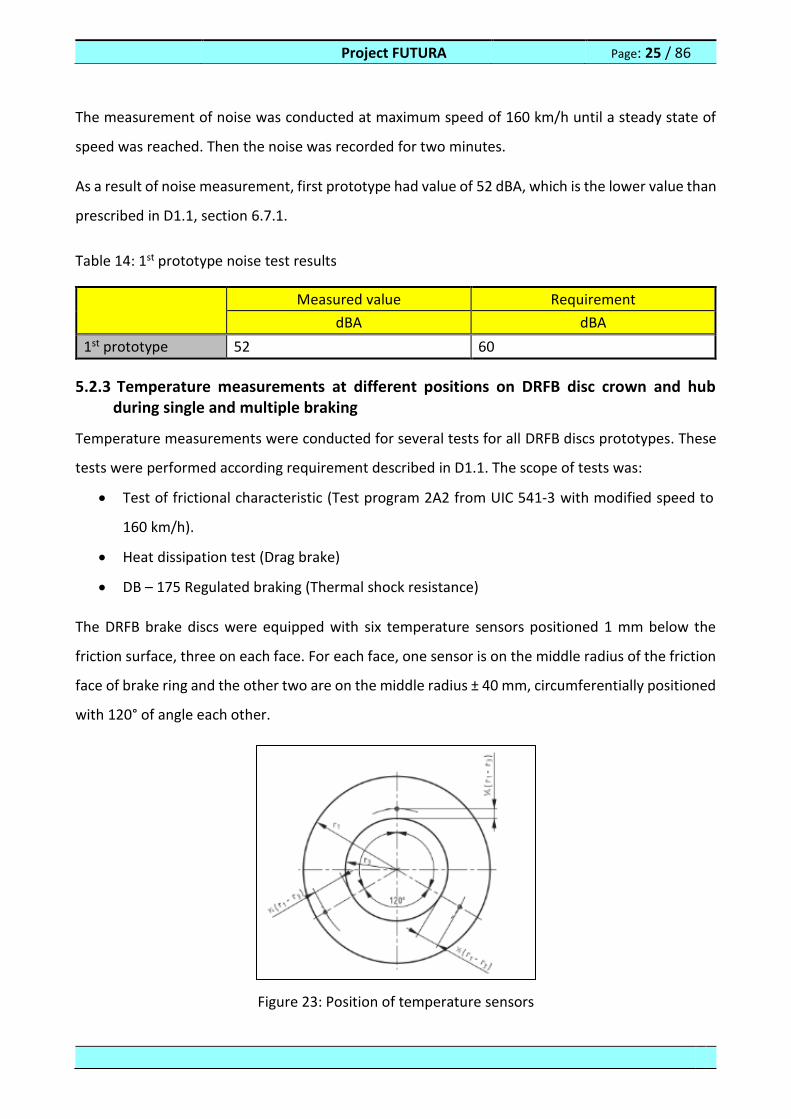
The DRFB brake discs were equipped with six temperature sensors positioned 1 mm below the
friction surface, three on each face. For each face, one sensor is on the middle radius of the friction
face of brake ring and the other two are on the middle radius ± 40 mm, circumferentially positioned
with 120° of angle each other.
Figure 23: Position of temperature sensors
Project FUTURA Page: 26 / 86
Figure 24: DRFB disc during the test
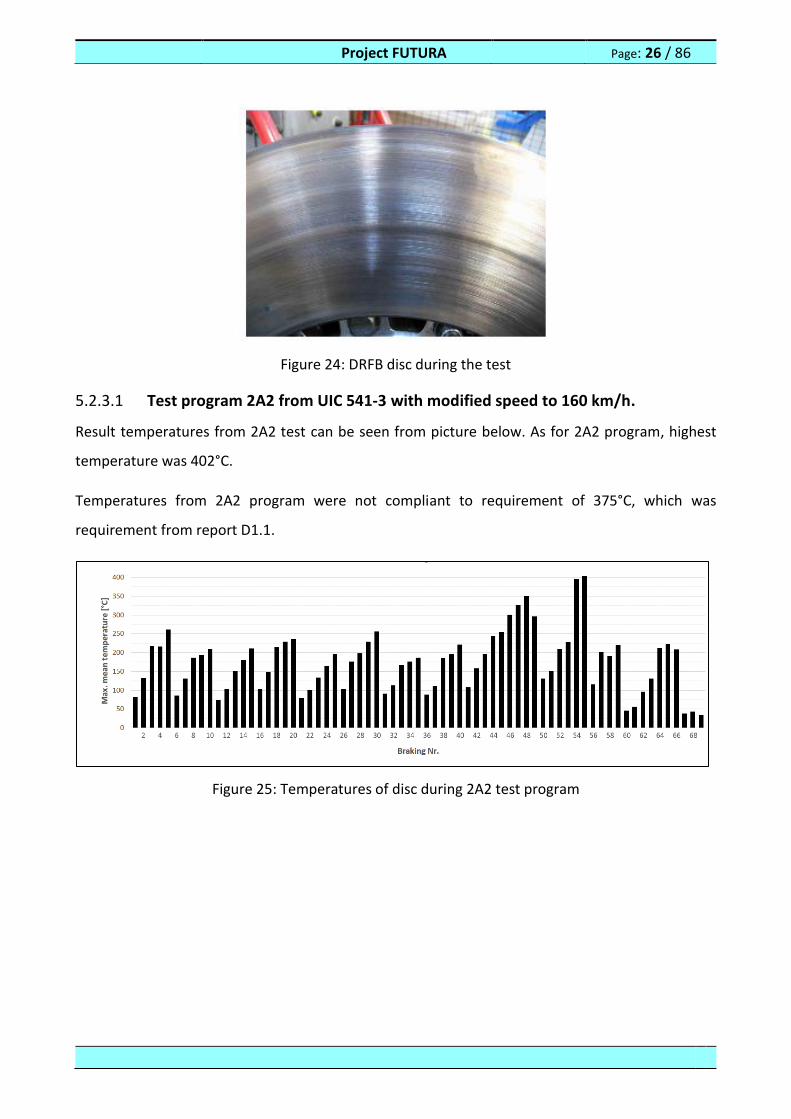
5.2.3.1 Test program 2A2 from UIC 541‐3 with modified speed to 160 km/h.
Result temperatures from 2A2 test can be seen from picture below. As for 2A2 program, highest
temperature was 402°C.
Temperatures from 2A2 program were not compliant to requirement of 375°C, which was
requirement from report D1.1.
Figure 25: Temperatures of disc during 2A2 test program
Project FUTURA Page: 27 / 86
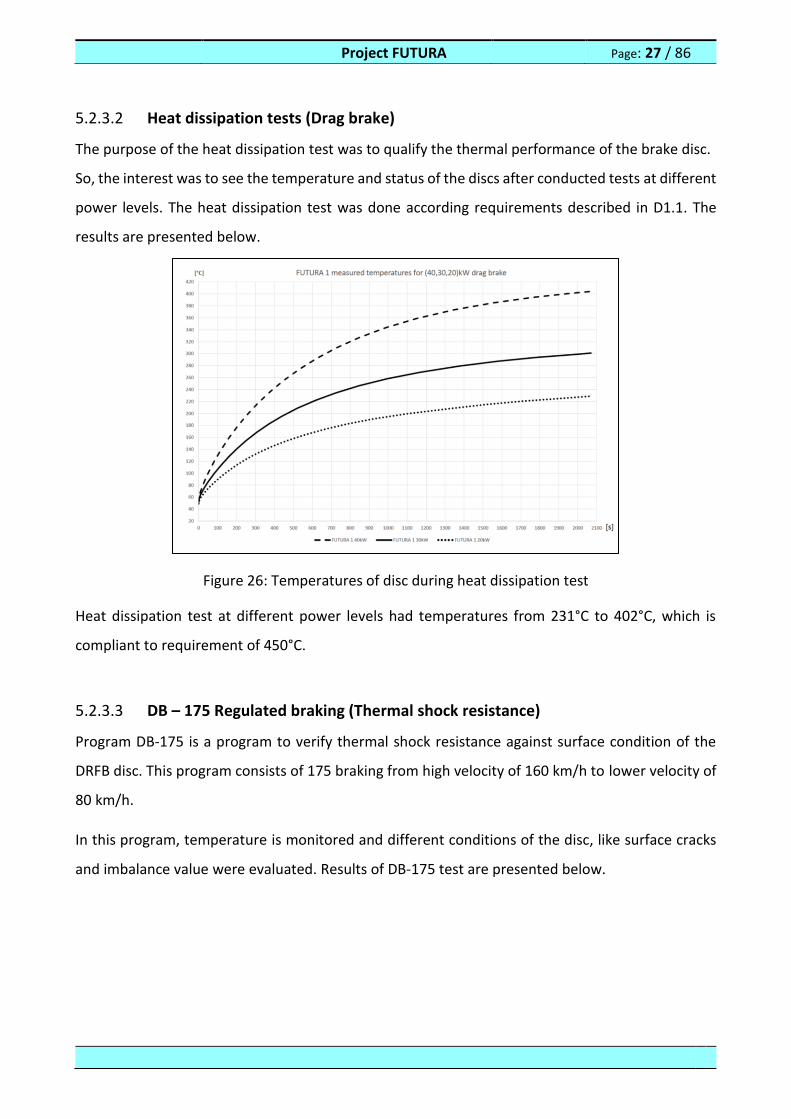
5.2.3.2 Heat dissipation tests (Drag brake)
The purpose of the heat dissipation test was to qualify the thermal performance of the brake disc.
So, the interest was to see the temperature and status of the discs after conducted tests at different
power levels. The heat dissipation test was done according requirements described in D1.1. The
results are presented below.
Figure 26: Temperatures of disc during heat dissipation test
Heat dissipation test at different power levels had temperatures from 231°C to 402°C, which is
compliant to requirement of 450°C.
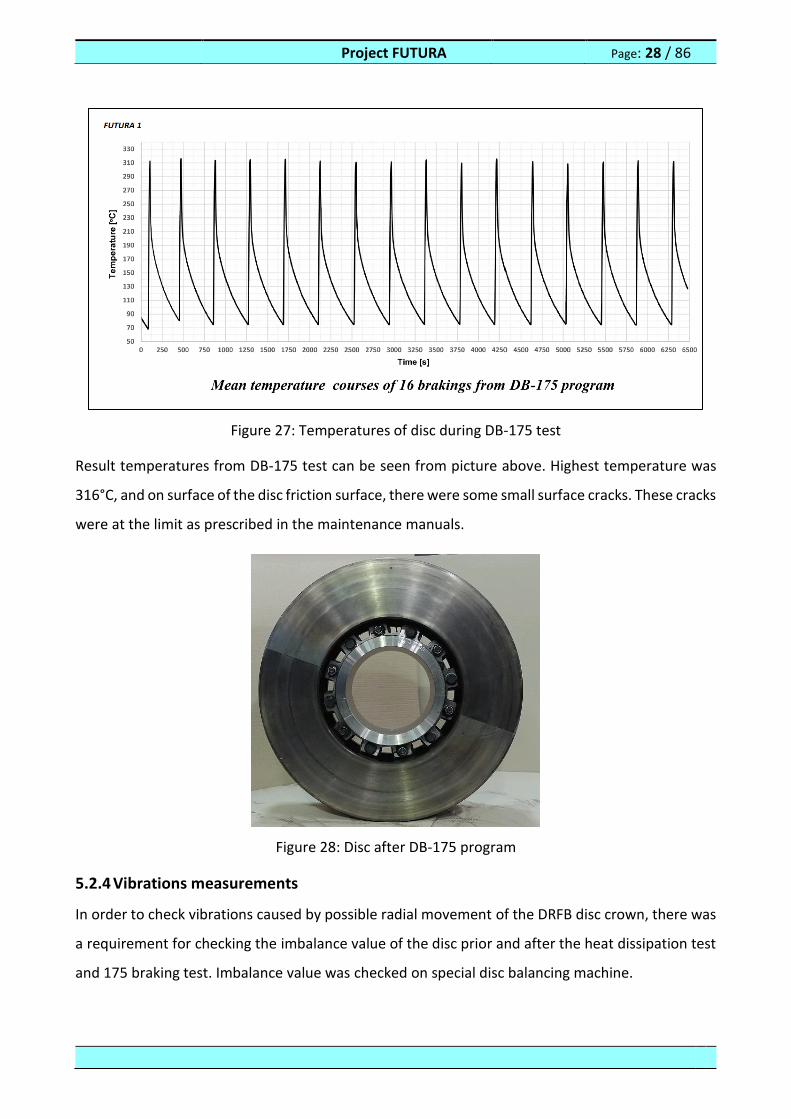
5.2.3.3 DB – 175 Regulated braking (Thermal shock resistance)
Program DB-175 is a program to verify thermal shock resistance against surface condition of the
DRFB disc. This program consists of 175 braking from high velocity of 160 km/h to lower velocity of
80 km/h.
In this program, temperature is monitored and different conditions of the disc, like surface cracks
and imbalance value were evaluated. Results of DB-175 test are presented below.
Project FUTURA Page: 28 / 86
Figure 27: Temperatures of disc during DB-175 test
Result temperatures from DB-175 test can be seen from picture above. Highest temperature was
316°C, and on surface of the disc friction surface, there were some small surface cracks. These cracks
were at the limit as prescribed in the maintenance manuals.
Figure 28: Disc after DB-175 program
5.2.4 Vibrations measurements
In order to check vibrations caused by possible radial movement of the DRFB disc crown, there was
a requirement for checking the imbalance value of the disc prior and after the heat dissipation test
and 175 braking test. Imbalance value was checked on special disc balancing machine.

Project FUTURA Page: 29 / 86
Figure 29: Special balancing machine
According to requirements, the imbalance value after test cannot exceed the value measured before
test by more than 20%. As a result, after tests, first prototype had unallowable imbalance value.
Result is presented in the table below:
Table 15: Vibration measurements
Measured value Value before test Allowable value
[gm] [gm] 20%
1st prototype 38 15 250%
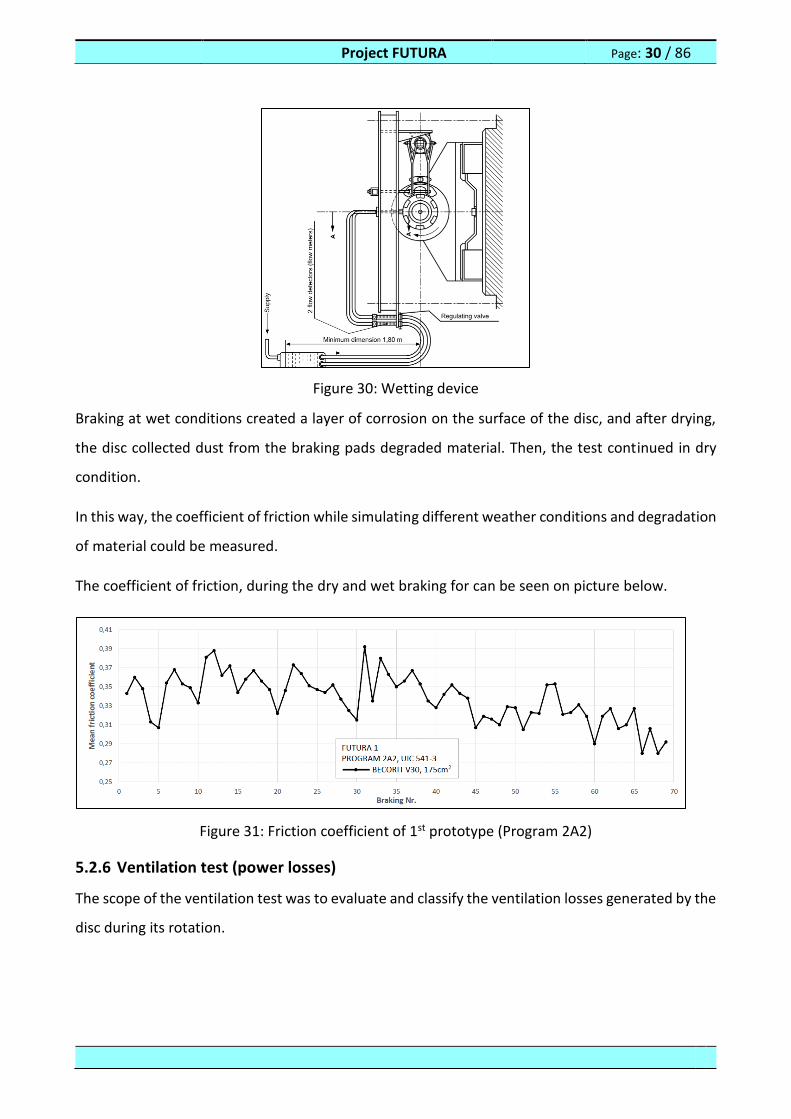
5.2.5 Coefficient of friction measurements between the DRFB disc and braking pads at different velocities and material degradation (corrosion, humidity, wet conditions)
Measurements of friction coefficient at different velocities, while simulating different weather
condition, such as dry and wet condition at temperatures between 10°C and 30°C, as well as material
degradation (corrosion, dust) were conducted within UIC program 2A2.
The coefficient of friction was measured throughout all program 2A2 for both dry and wet condition.
The wet conditions were simulated with wetting device mounted on the test bench. The quantity of
water during the wet braking was 21 litter per hour.
Project FUTURA Page: 30 / 86
Figure 30: Wetting device
Braking at wet conditions created a layer of corrosion on the surface of the disc, and after drying,
the disc collected dust from the braking pads degraded material. Then, the test continued in dry
condition.
In this way, the coefficient of friction while simulating different weather conditions and degradation
of material could be measured.
The coefficient of friction, during the dry and wet braking for can be seen on picture below.
Figure 31: Friction coefficient of 1st prototype (Program 2A2)
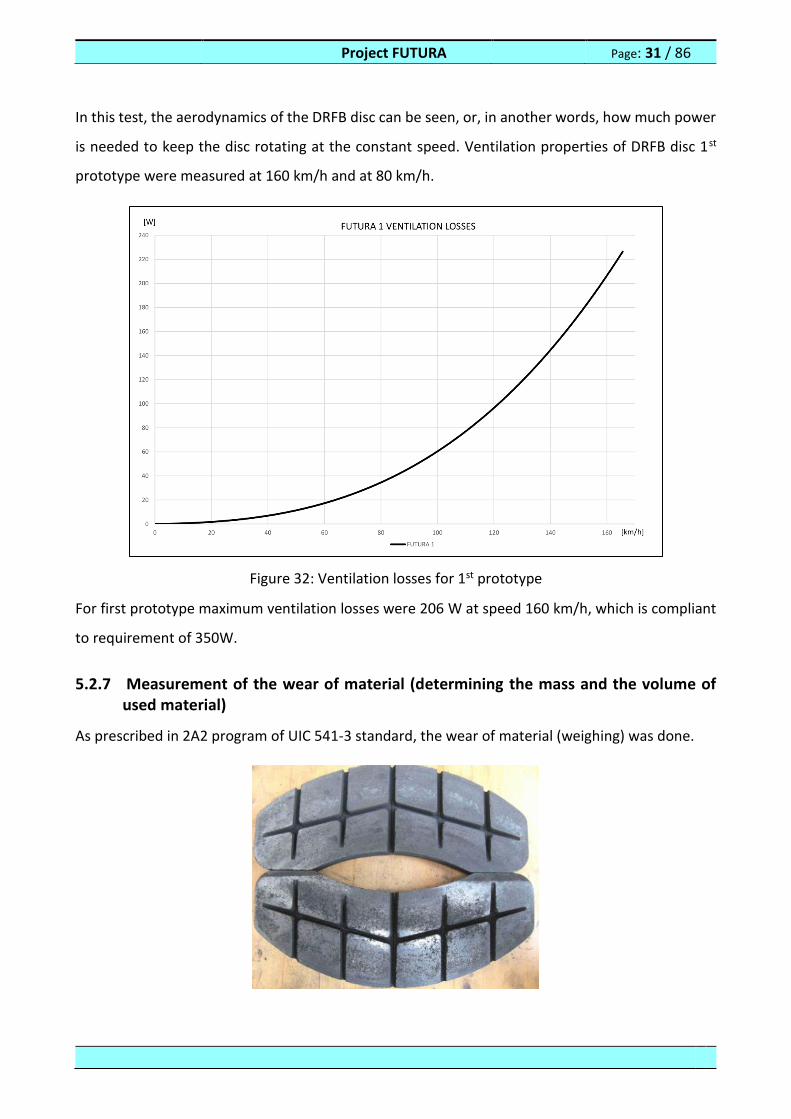
5.2.6 Ventilation test (power losses)
The scope of the ventilation test was to evaluate and classify the ventilation losses generated by the
disc during its rotation.
Project FUTURA Page: 31 / 86
In this test, the aerodynamics of the DRFB disc can be seen, or, in another words, how much power
is needed to keep the disc rotating at the constant speed. Ventilation properties of DRFB disc 1st
prototype were measured at 160 km/h and at 80 km/h.
Figure 32: Ventilation losses for 1st prototype
For first prototype maximum ventilation losses were 206 W at speed 160 km/h, which is compliant
to requirement of 350W.
5.2.7 Measurement of the wear of material (determining the mass and the volume of used material)
As prescribed in 2A2 program of UIC 541-3 standard, the wear of material (weighing) was done.
Project FUTURA Page: 32 / 86
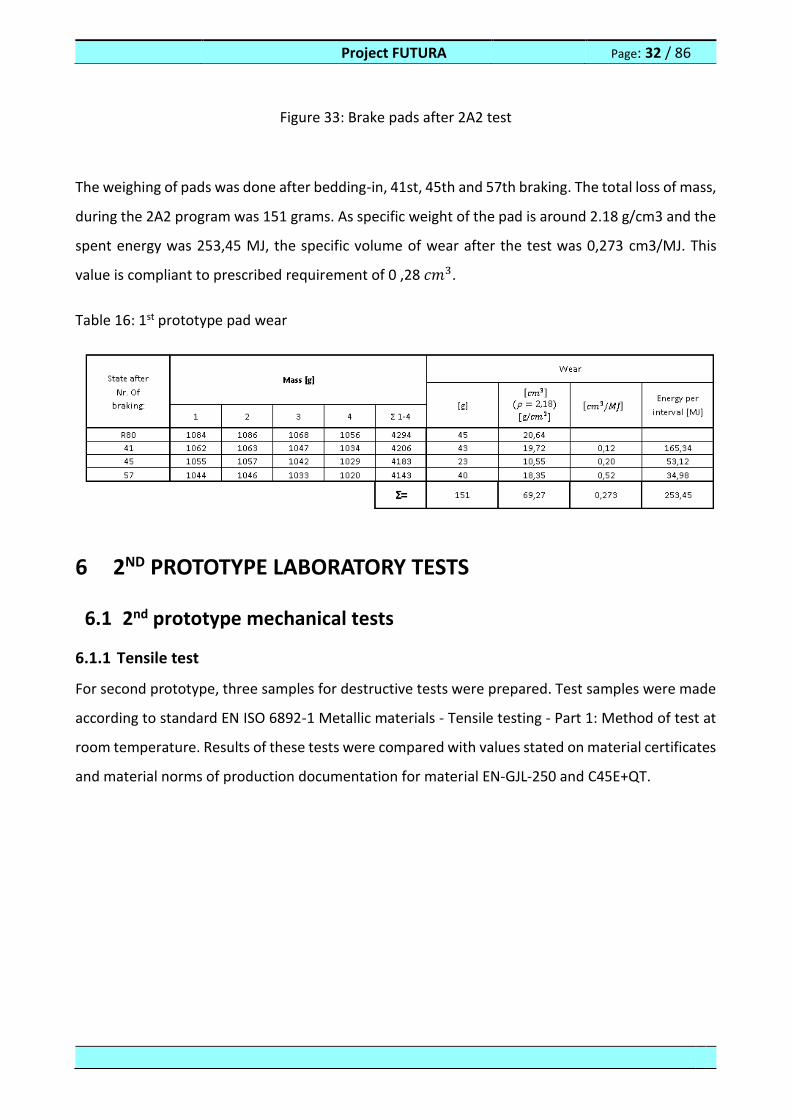
Figure 33: Brake pads after 2A2 test
The weighing of pads was done after bedding-in, 41st, 45th and 57th braking. The total loss of mass,
during the 2A2 program was 151 grams. As specific weight of the pad is around 2.18 g/cm3 and the
spent energy was 253,45 MJ, the specific volume of wear after the test was 0,273 cm3/MJ. This
value is compliant to prescribed requirement of 0 ,28 𝑐𝑚3.
Table 16: 1st prototype pad wear
6 2ND PROTOTYPE LABORATORY TESTS
6.1 2nd prototype mechanical tests
6.1.1 Tensile test
For second prototype, three samples for destructive tests were prepared. Test samples were made
according to standard EN ISO 6892-1 Metallic materials - Tensile testing - Part 1: Method of test at
room temperature. Results of these tests were compared with values stated on material certificates
and material norms of production documentation for material EN-GJL-250 and C45E+QT.
Project FUTURA Page: 33 / 86
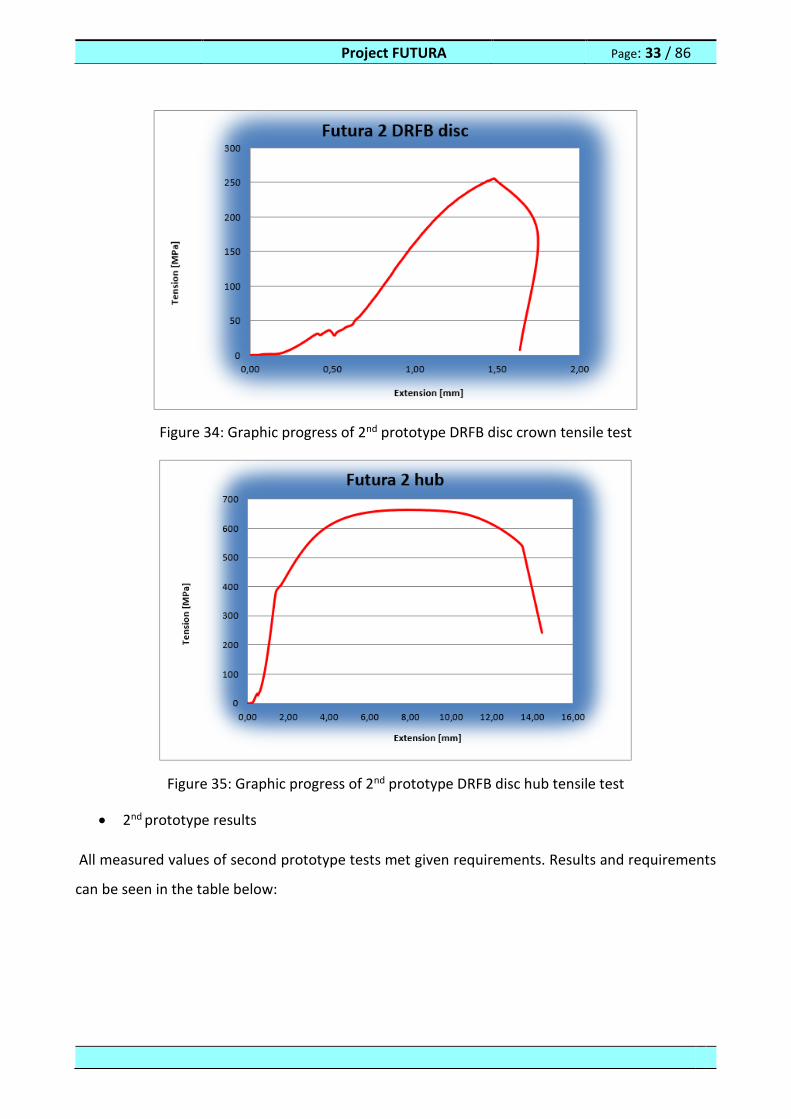
Figure 34: Graphic progress of 2nd prototype DRFB disc crown tensile test
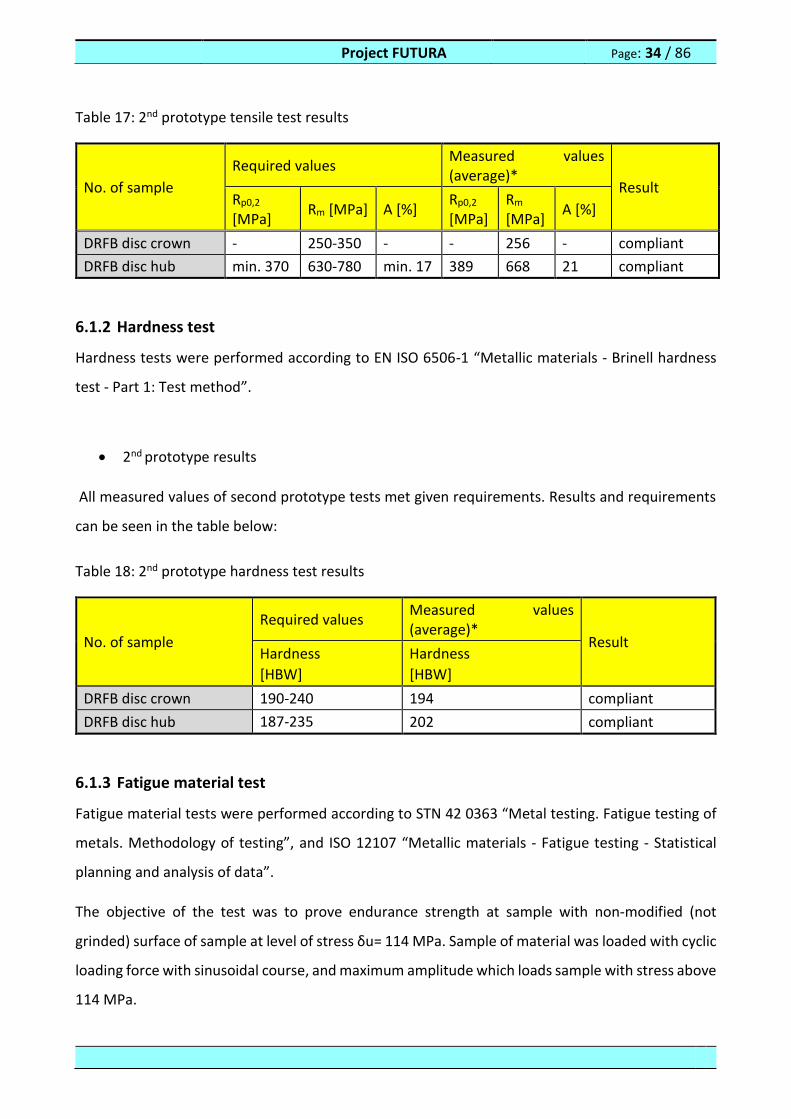
Figure 35: Graphic progress of 2nd prototype DRFB disc hub tensile test
2nd prototype results
All measured values of second prototype tests met given requirements. Results and requirements
can be seen in the table below:
Project FUTURA Page: 34 / 86
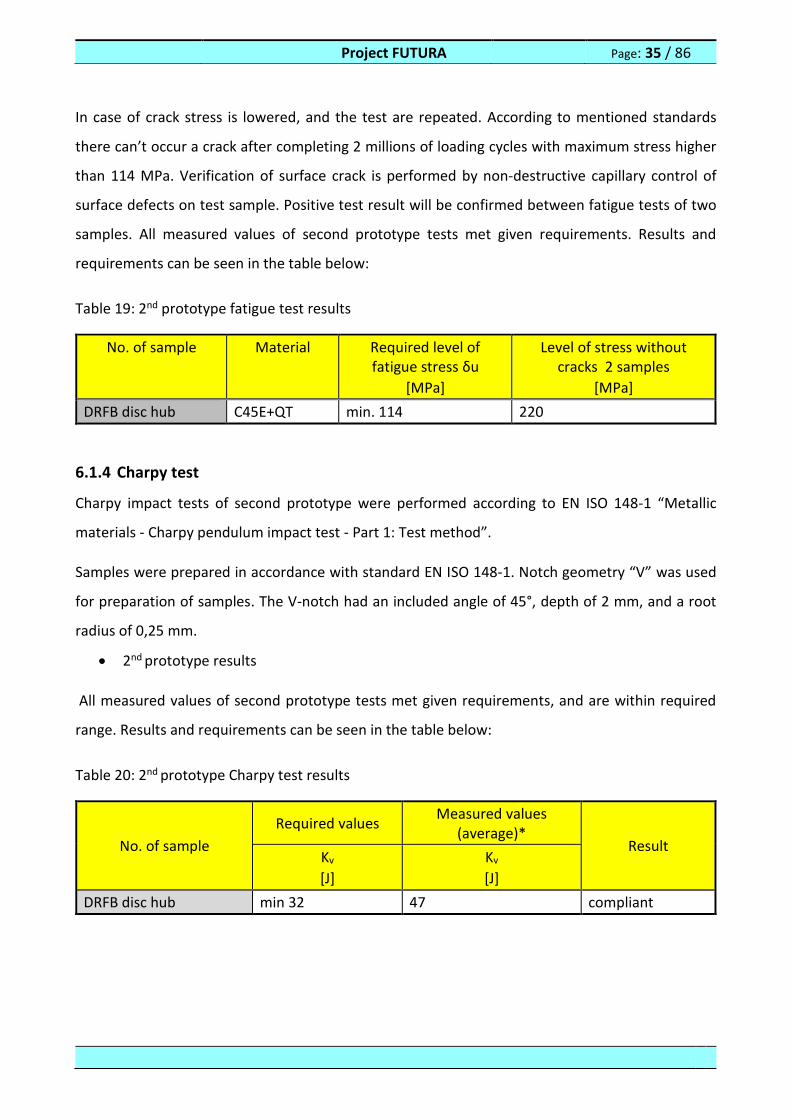
Table 17: 2nd prototype tensile test results
No. of sample
Required values Measured values (average)*
Result Rp0,2
[MPa] Rm [MPa] A [%]
Rp0,2
[MPa] Rm [MPa]
A [%]
DRFB disc crown - 250-350 - - 256 - compliant
DRFB disc hub min. 370 630-780 min. 17 389 668 21 compliant
6.1.2 Hardness test
Hardness tests were performed according to EN ISO 6506-1 “Metallic materials - Brinell hardness
test - Part 1: Test method”.
2nd prototype results
All measured values of second prototype tests met given requirements. Results and requirements
can be seen in the table below:
Table 18: 2nd prototype hardness test results
No. of sample
Required values Measured values (average)*
Result Hardness
[HBW]
Hardness
[HBW]
DRFB disc crown 190-240 194 compliant
DRFB disc hub 187-235 202 compliant
6.1.3 Fatigue material test
Fatigue material tests were performed according to STN 42 0363 “Metal testing. Fatigue testing of
metals. Methodology of testing”, and ISO 12107 “Metallic materials - Fatigue testing - Statistical
planning and analysis of data”.
The objective of the test was to prove endurance strength at sample with non-modified (not
grinded) surface of sample at level of stress δu= 114 MPa. Sample of material was loaded with cyclic
loading force with sinusoidal course, and maximum amplitude which loads sample with stress above
114 MPa.
Project FUTURA Page: 35 / 86
In case of crack stress is lowered, and the test are repeated. According to mentioned standards
there can’t occur a crack after completing 2 millions of loading cycles with maximum stress higher
than 114 MPa. Verification of surface crack is performed by non-destructive capillary control of
surface defects on test sample. Positive test result will be confirmed between fatigue tests of two
samples. All measured values of second prototype tests met given requirements. Results and
requirements can be seen in the table below:
Table 19: 2nd prototype fatigue test results
No. of sample Material Required level of fatigue stress δu
[MPa]
Level of stress without cracks 2 samples
[MPa]
DRFB disc hub C45E+QT min. 114 220
6.1.4 Charpy test
Charpy impact tests of second prototype were performed according to EN ISO 148-1 “Metallic
materials - Charpy pendulum impact test - Part 1: Test method”.
Samples were prepared in accordance with standard EN ISO 148-1. Notch geometry “V” was used
for preparation of samples. The V-notch had an included angle of 45°, depth of 2 mm, and a root
radius of 0,25 mm.
2nd prototype results
All measured values of second prototype tests met given requirements, and are within required
range. Results and requirements can be seen in the table below:
Table 20: 2nd prototype Charpy test results
No. of sample
Required values Measured values
(average)* Result
Kv
[J]
Kv
[J]
DRFB disc hub min 32 47 compliant

Project FUTURA Page: 36 / 86
Figure 36: Charpy test
6.1.5 Fracture toughness test
Fracture toughness test for second prototype were performed according to ISO 15653 “Metallic
materials -- Method of test for the determination of quasistatic fracture toughness”. The objective
of the test was to check resistance to fracture with test specimens already containing a crack.
Figure 37: Fracture toughness test samples
2nd prototype results
Project FUTURA Page: 37 / 86
Results of second prototype fracture toughness tests of DRB disc and crown can be seen in the table
below:
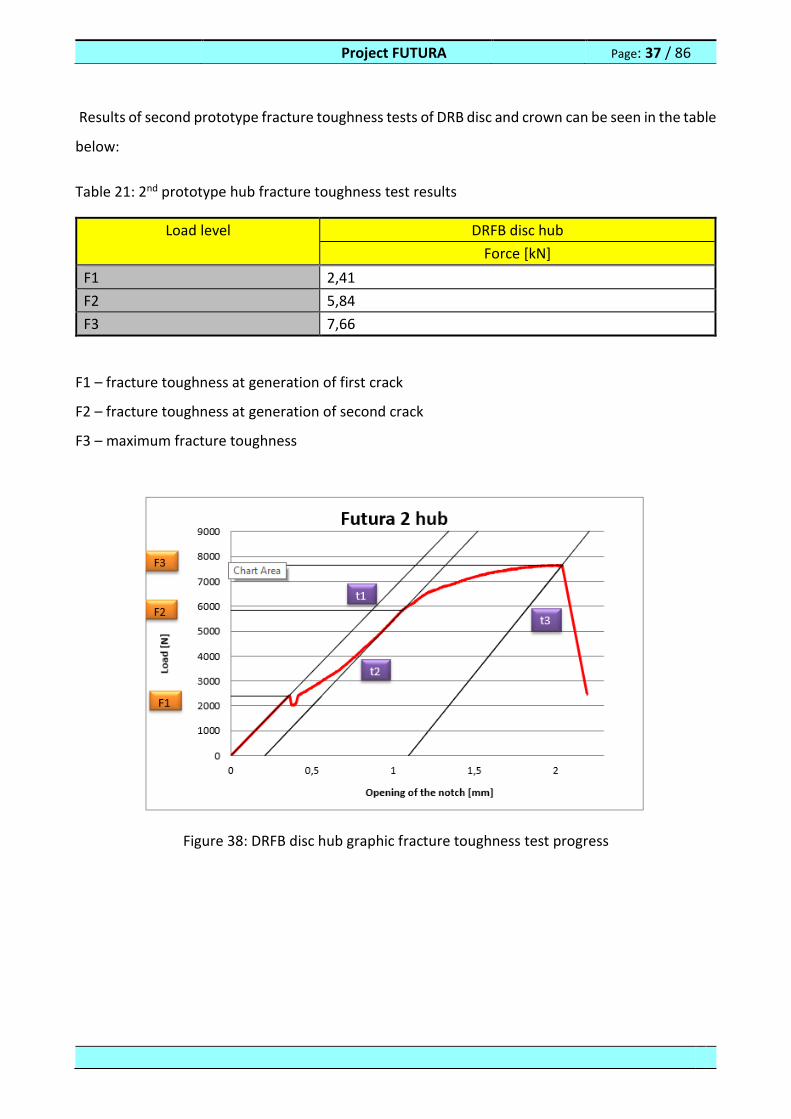
Table 21: 2nd prototype hub fracture toughness test results
Load level DRFB disc hub
Force [kN]
F1 2,41
F2 5,84
F3 7,66
F1 – fracture toughness at generation of first crack
F2 – fracture toughness at generation of second crack
F3 – maximum fracture toughness
Figure 38: DRFB disc hub graphic fracture toughness test progress
Project FUTURA Page: 38 / 86
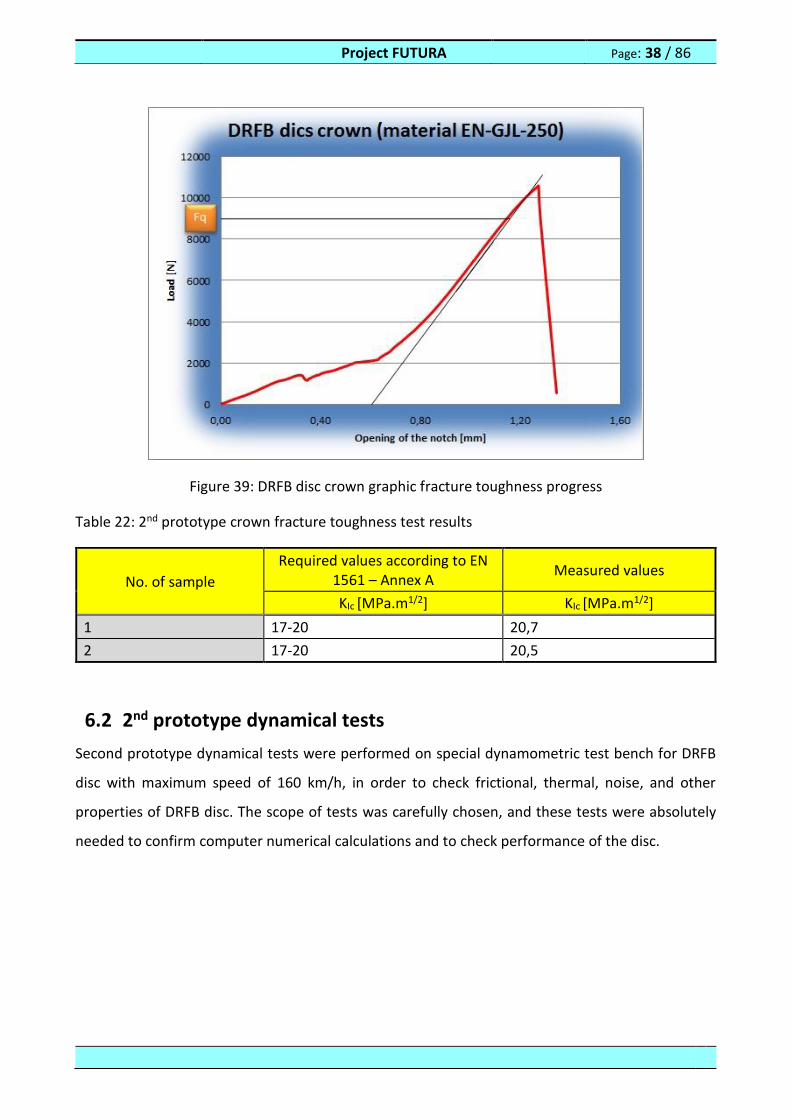
Figure 39: DRFB disc crown graphic fracture toughness progress
Table 22: 2nd prototype crown fracture toughness test results
No. of sample
Required values according to EN 1561 – Annex A
Measured values
KIc [MPa.m1/2] KIc [MPa.m1/2]
1 17-20 20,7
2 17-20 20,5
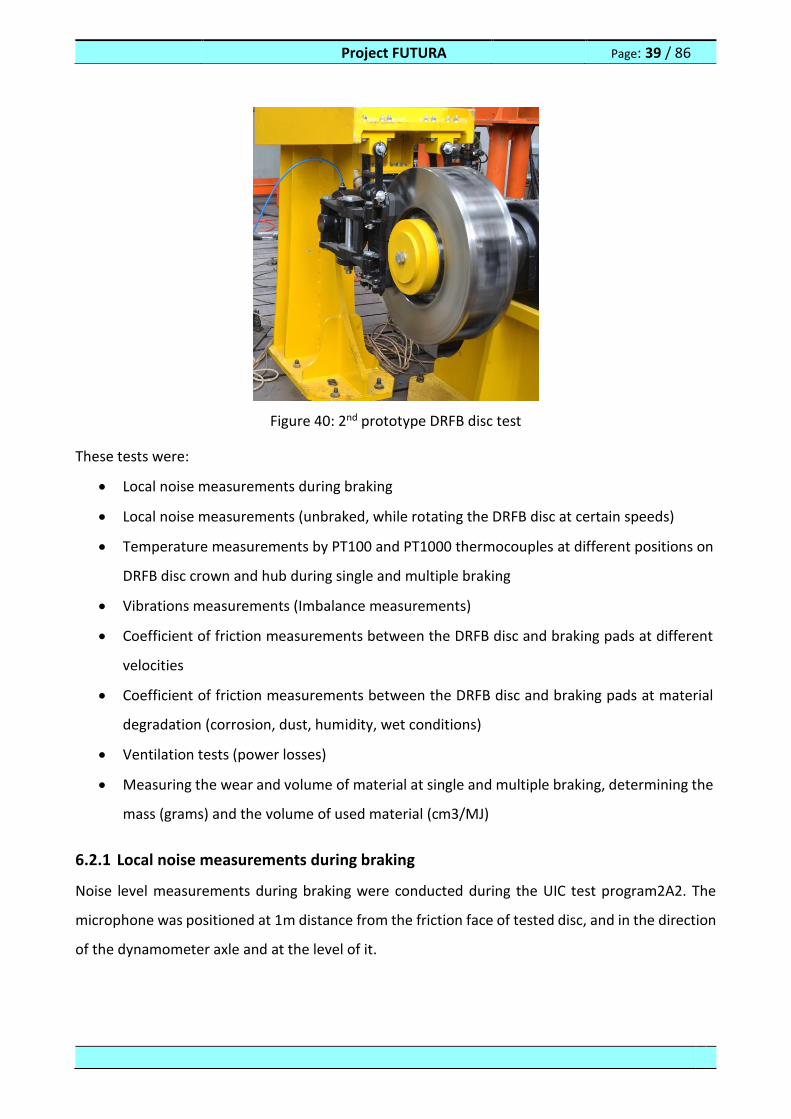
6.2 2nd prototype dynamical tests
Second prototype dynamical tests were performed on special dynamometric test bench for DRFB
disc with maximum speed of 160 km/h, in order to check frictional, thermal, noise, and other
properties of DRFB disc. The scope of tests was carefully chosen, and these tests were absolutely
needed to confirm computer numerical calculations and to check performance of the disc.
Project FUTURA Page: 39 / 86
Figure 40: 2nd prototype DRFB disc test
These tests were:
Local noise measurements during braking
Local noise measurements (unbraked, while rotating the DRFB disc at certain speeds)
Temperature measurements by PT100 and PT1000 thermocouples at different positions on
DRFB disc crown and hub during single and multiple braking
Vibrations measurements (Imbalance measurements)
Coefficient of friction measurements between the DRFB disc and braking pads at different
velocities
Coefficient of friction measurements between the DRFB disc and braking pads at material
degradation (corrosion, dust, humidity, wet conditions)
Ventilation tests (power losses)
Measuring the wear and volume of material at single and multiple braking, determining the
mass (grams) and the volume of used material (cm3/MJ)
6.2.1 Local noise measurements during braking
Noise level measurements during braking were conducted during the UIC test program2A2. The
microphone was positioned at 1m distance from the friction face of tested disc, and in the direction
of the dynamometer axle and at the level of it.
Project FUTURA Page: 40 / 86
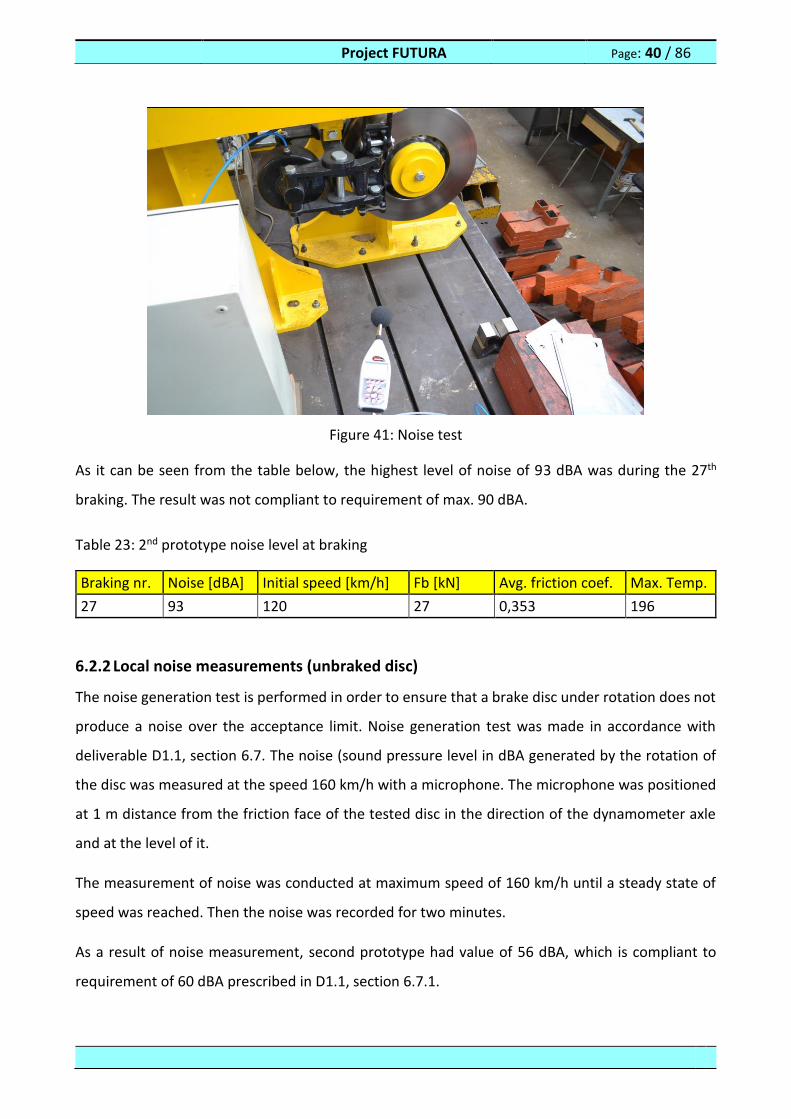
Figure 41: Noise test
As it can be seen from the table below, the highest level of noise of 93 dBA was during the 27th
braking. The result was not compliant to requirement of max. 90 dBA.
Table 23: 2nd prototype noise level at braking
Braking nr. Noise [dBA] Initial speed [km/h] Fb [kN] Avg. friction coef. Max. Temp.
27 93 120 27 0,353 196
6.2.2 Local noise measurements (unbraked disc)
The noise generation test is performed in order to ensure that a brake disc under rotation does not
produce a noise over the acceptance limit. Noise generation test was made in accordance with
deliverable D1.1, section 6.7. The noise (sound pressure level in dBA generated by the rotation of
the disc was measured at the speed 160 km/h with a microphone. The microphone was positioned
at 1 m distance from the friction face of the tested disc in the direction of the dynamometer axle
and at the level of it.
The measurement of noise was conducted at maximum speed of 160 km/h until a steady state of
speed was reached. Then the noise was recorded for two minutes.
As a result of noise measurement, second prototype had value of 56 dBA, which is compliant to
requirement of 60 dBA prescribed in D1.1, section 6.7.1.
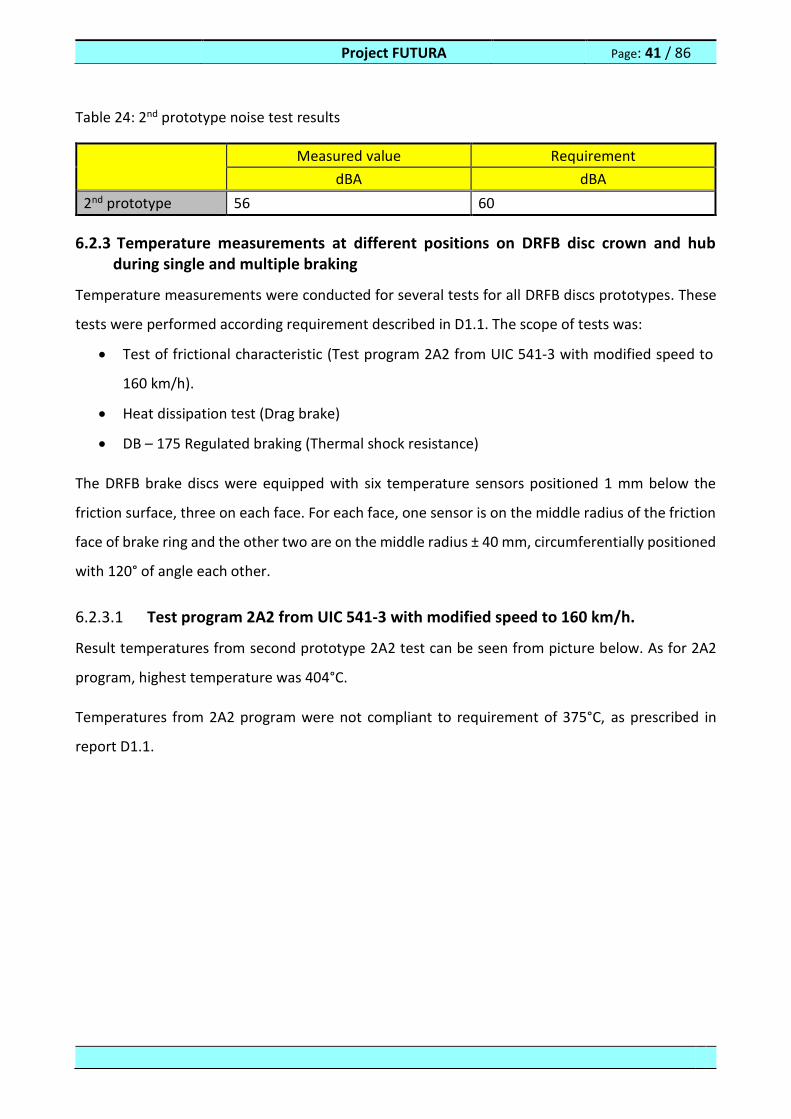
Project FUTURA Page: 41 / 86
Table 24: 2nd prototype noise test results
Measured value Requirement
dBA dBA
2nd prototype 56 60
6.2.3 Temperature measurements at different positions on DRFB disc crown and hub during single and multiple braking
Temperature measurements were conducted for several tests for all DRFB discs prototypes. These
tests were performed according requirement described in D1.1. The scope of tests was:
Test of frictional characteristic (Test program 2A2 from UIC 541‐3 with modified speed to
160 km/h).
Heat dissipation test (Drag brake)
DB – 175 Regulated braking (Thermal shock resistance)
The DRFB brake discs were equipped with six temperature sensors positioned 1 mm below the
friction surface, three on each face. For each face, one sensor is on the middle radius of the friction
face of brake ring and the other two are on the middle radius ± 40 mm, circumferentially positioned
with 120° of angle each other.
6.2.3.1 Test program 2A2 from UIC 541‐3 with modified speed to 160 km/h.
Result temperatures from second prototype 2A2 test can be seen from picture below. As for 2A2
program, highest temperature was 404°C.
Temperatures from 2A2 program were not compliant to requirement of 375°C, as prescribed in
report D1.1.
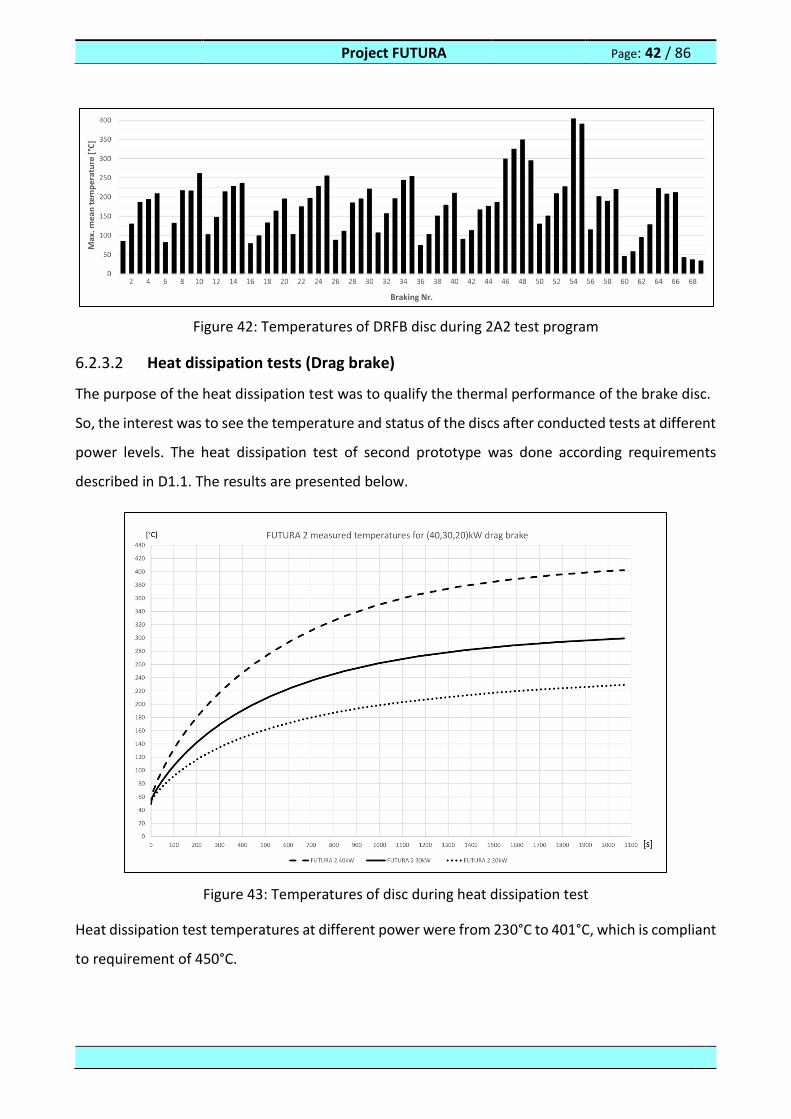
Project FUTURA Page: 42 / 86
Figure 42: Temperatures of DRFB disc during 2A2 test program
6.2.3.2 Heat dissipation tests (Drag brake)
The purpose of the heat dissipation test was to qualify the thermal performance of the brake disc.
So, the interest was to see the temperature and status of the discs after conducted tests at different
power levels. The heat dissipation test of second prototype was done according requirements
described in D1.1. The results are presented below.
Figure 43: Temperatures of disc during heat dissipation test
Heat dissipation test temperatures at different power were from 230°C to 401°C, which is compliant
to requirement of 450°C.
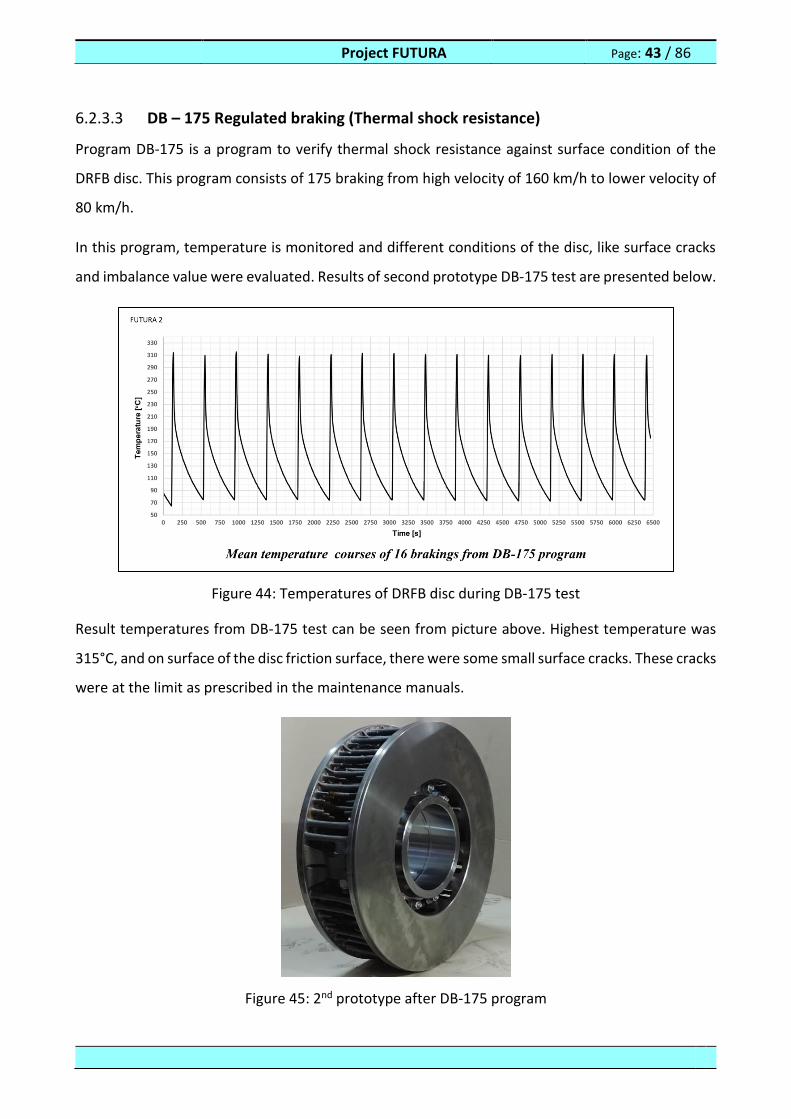
Project FUTURA Page: 43 / 86
6.2.3.3 DB – 175 Regulated braking (Thermal shock resistance)
Program DB-175 is a program to verify thermal shock resistance against surface condition of the
DRFB disc. This program consists of 175 braking from high velocity of 160 km/h to lower velocity of
80 km/h.
In this program, temperature is monitored and different conditions of the disc, like surface cracks
and imbalance value were evaluated. Results of second prototype DB-175 test are presented below.
Figure 44: Temperatures of DRFB disc during DB-175 test
Result temperatures from DB-175 test can be seen from picture above. Highest temperature was
315°C, and on surface of the disc friction surface, there were some small surface cracks. These cracks
were at the limit as prescribed in the maintenance manuals.
Figure 45: 2nd prototype after DB-175 program
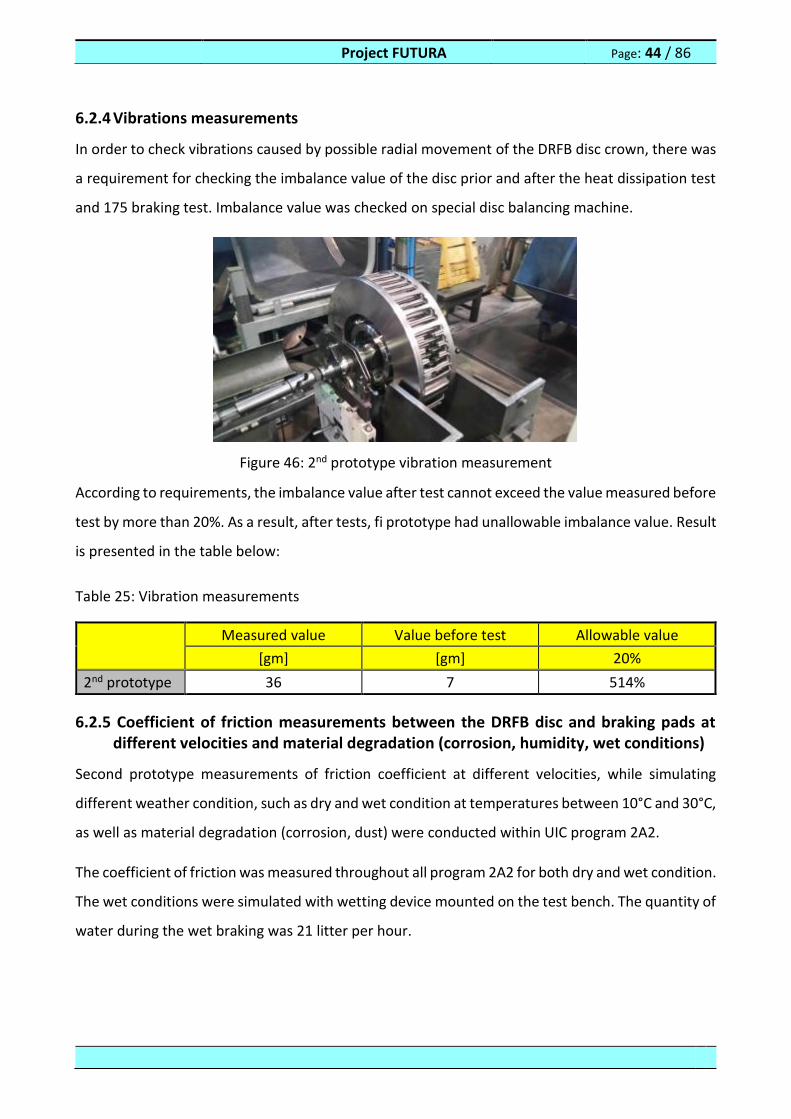
Project FUTURA Page: 44 / 86
6.2.4 Vibrations measurements
In order to check vibrations caused by possible radial movement of the DRFB disc crown, there was
a requirement for checking the imbalance value of the disc prior and after the heat dissipation test
and 175 braking test. Imbalance value was checked on special disc balancing machine.
Figure 46: 2nd prototype vibration measurement
According to requirements, the imbalance value after test cannot exceed the value measured before
test by more than 20%. As a result, after tests, fi prototype had unallowable imbalance value. Result
is presented in the table below:
Table 25: Vibration measurements
Measured value Value before test Allowable value
[gm] [gm] 20%
2nd prototype 36 7 514%
6.2.5 Coefficient of friction measurements between the DRFB disc and braking pads at different velocities and material degradation (corrosion, humidity, wet conditions)
Second prototype measurements of friction coefficient at different velocities, while simulating
different weather condition, such as dry and wet condition at temperatures between 10°C and 30°C,
as well as material degradation (corrosion, dust) were conducted within UIC program 2A2.
The coefficient of friction was measured throughout all program 2A2 for both dry and wet condition.
The wet conditions were simulated with wetting device mounted on the test bench. The quantity of
water during the wet braking was 21 litter per hour.
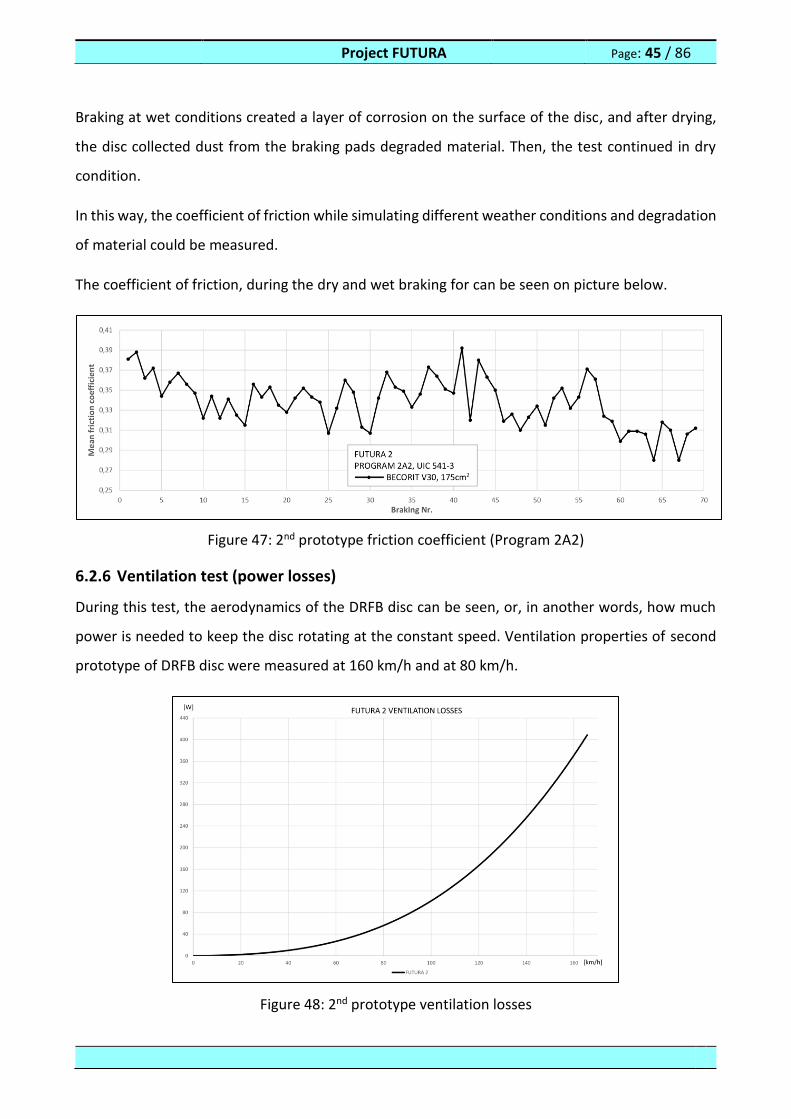
Project FUTURA Page: 45 / 86
Braking at wet conditions created a layer of corrosion on the surface of the disc, and after drying,
the disc collected dust from the braking pads degraded material. Then, the test continued in dry
condition.
In this way, the coefficient of friction while simulating different weather conditions and degradation
of material could be measured.
The coefficient of friction, during the dry and wet braking for can be seen on picture below.
Figure 47: 2nd prototype friction coefficient (Program 2A2)
6.2.6 Ventilation test (power losses)
During this test, the aerodynamics of the DRFB disc can be seen, or, in another words, how much
power is needed to keep the disc rotating at the constant speed. Ventilation properties of second
prototype of DRFB disc were measured at 160 km/h and at 80 km/h.
Figure 48: 2nd prototype ventilation losses
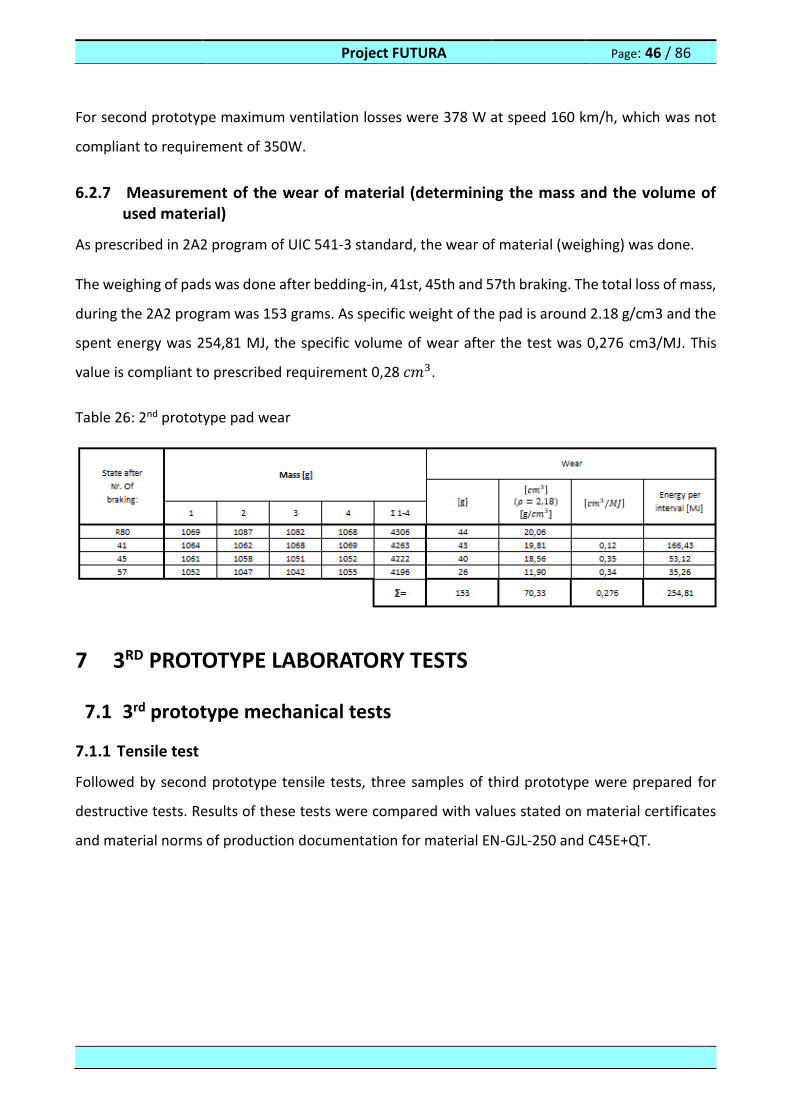
Project FUTURA Page: 46 / 86
For second prototype maximum ventilation losses were 378 W at speed 160 km/h, which was not
compliant to requirement of 350W.
6.2.7 Measurement of the wear of material (determining the mass and the volume of used material)
As prescribed in 2A2 program of UIC 541-3 standard, the wear of material (weighing) was done.
The weighing of pads was done after bedding-in, 41st, 45th and 57th braking. The total loss of mass,
during the 2A2 program was 153 grams. As specific weight of the pad is around 2.18 g/cm3 and the
spent energy was 254,81 MJ, the specific volume of wear after the test was 0,276 cm3/MJ. This
value is compliant to prescribed requirement 0,28 𝑐𝑚3.
Table 26: 2nd prototype pad wear
7 3RD PROTOTYPE LABORATORY TESTS
7.1 3rd prototype mechanical tests
7.1.1 Tensile test
Followed by second prototype tensile tests, three samples of third prototype were prepared for
destructive tests. Results of these tests were compared with values stated on material certificates
and material norms of production documentation for material EN-GJL-250 and C45E+QT.
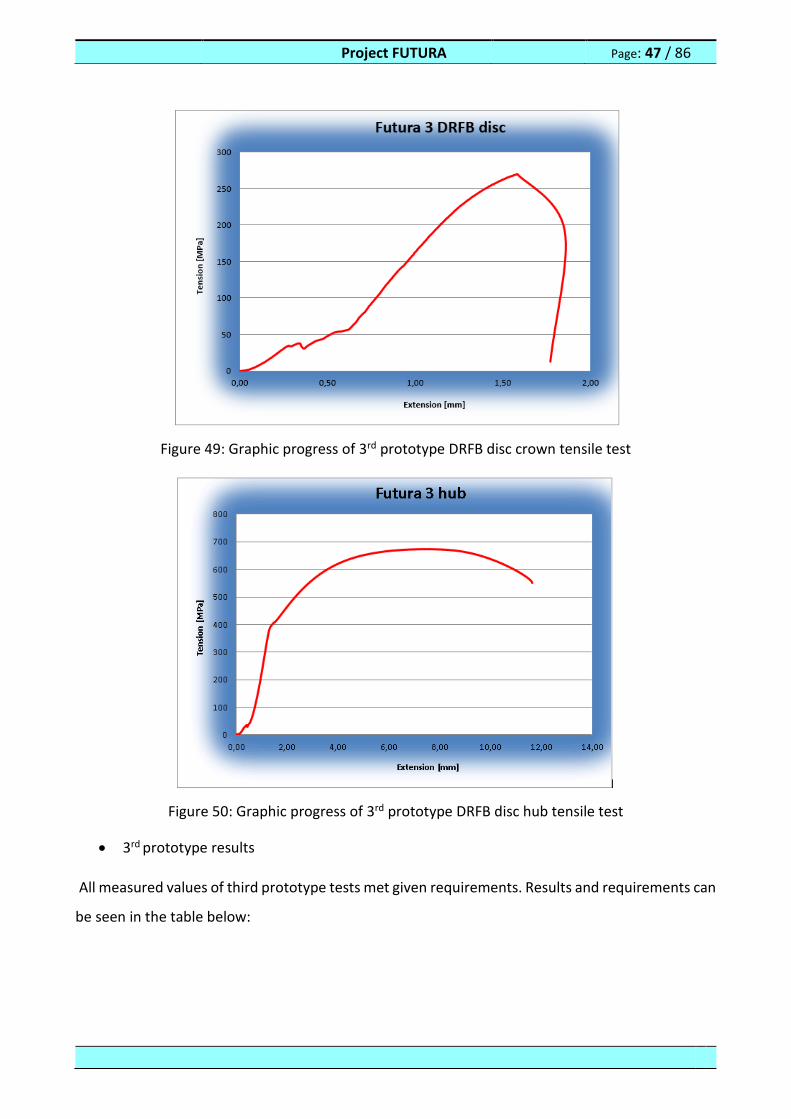
Project FUTURA Page: 47 / 86
Figure 49: Graphic progress of 3rd prototype DRFB disc crown tensile test
Figure 50: Graphic progress of 3rd prototype DRFB disc hub tensile test
3rd prototype results
All measured values of third prototype tests met given requirements. Results and requirements can
be seen in the table below:
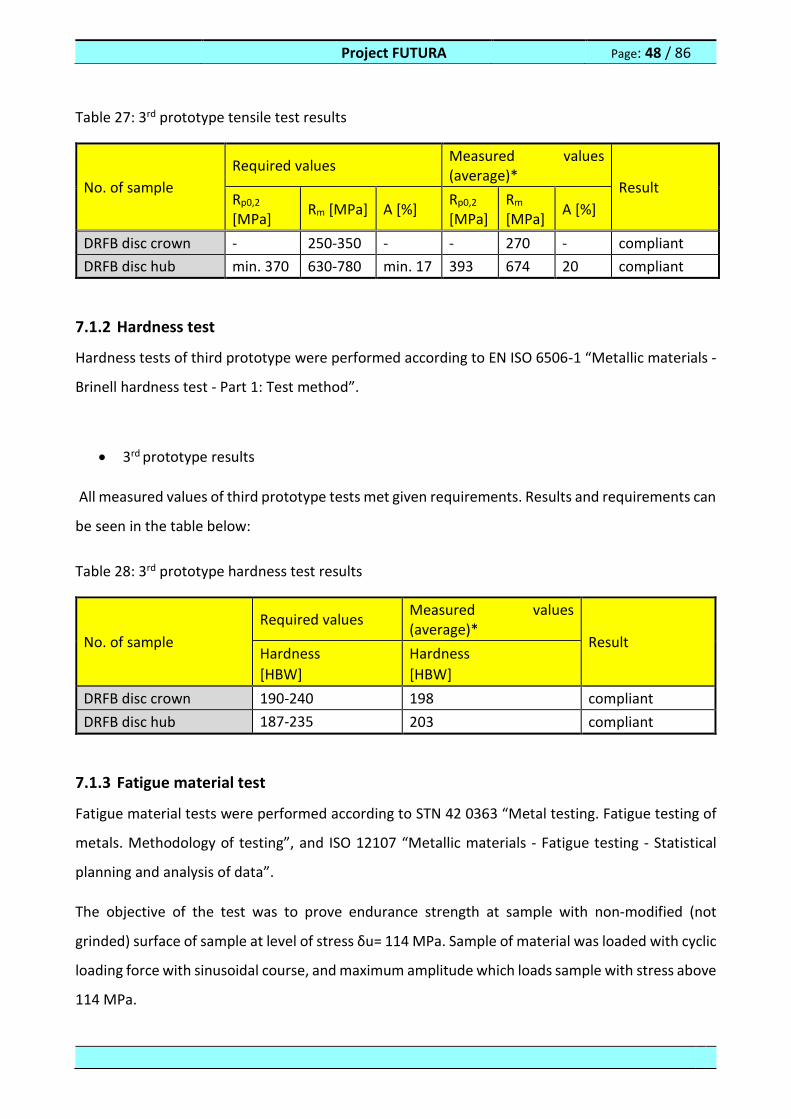
Project FUTURA Page: 48 / 86
Table 27: 3rd prototype tensile test results
No. of sample
Required values Measured values (average)*
Result Rp0,2
[MPa] Rm [MPa] A [%]
Rp0,2
[MPa] Rm [MPa]
A [%]
DRFB disc crown - 250-350 - - 270 - compliant
DRFB disc hub min. 370 630-780 min. 17 393 674 20 compliant
7.1.2 Hardness test
Hardness tests of third prototype were performed according to EN ISO 6506-1 “Metallic materials -
Brinell hardness test - Part 1: Test method”.
3rd prototype results
All measured values of third prototype tests met given requirements. Results and requirements can
be seen in the table below:
Table 28: 3rd prototype hardness test results
No. of sample
Required values Measured values (average)*
Result Hardness
[HBW]
Hardness
[HBW]
DRFB disc crown 190-240 198 compliant
DRFB disc hub 187-235 203 compliant
7.1.3 Fatigue material test
Fatigue material tests were performed according to STN 42 0363 “Metal testing. Fatigue testing of
metals. Methodology of testing”, and ISO 12107 “Metallic materials - Fatigue testing - Statistical
planning and analysis of data”.
The objective of the test was to prove endurance strength at sample with non-modified (not
grinded) surface of sample at level of stress δu= 114 MPa. Sample of material was loaded with cyclic
loading force with sinusoidal course, and maximum amplitude which loads sample with stress above
114 MPa.

Project FUTURA Page: 49 / 86
In case of crack stress is lowered, and the test are repeated. According to mentioned standards
there can’t occur a crack after completing 2 million of loading cycles with maximum stress higher
than 114 MPa. Verification of surface crack is performed by non-destructive capillary control of
surface defects on test sample. Positive test result will be confirmed between fatigue tests of two
samples. All measured values of third prototype tests met given requirements. Results and
requirements can be seen in the table below:
Table 29: 3rd prototype fatigue test results
No. of sample Material Required level of fatigue stress δu
[MPa]
Level of stress without cracks 2 samples
[MPa]
DRFB disc hub C45E+QT min. 114 218
7.1.4 Charpy test
Charpy impact tests of third prototype were performed according to EN ISO 148-1 “Metallic
materials - Charpy pendulum impact test - Part 1: Test method”.
Samples were prepared in accordance with standard EN ISO 148-1. Notch geometry “V” was used
for preparation of samples. The V-notch had an included angle of 45°, depth of 2 mm, and a root
radius of 0,25 mm.
3rd prototype results
All measured values of third prototype tests met given requirements, and are within required range.
Results and requirements can be seen in the table below:
Table 30: 3rd prototype Charpy test results
No. of sample
Required values Measured values
(average)* Result
Kv
[J]
Kv
[J]
DRFB disc hub min 32 43 compliant
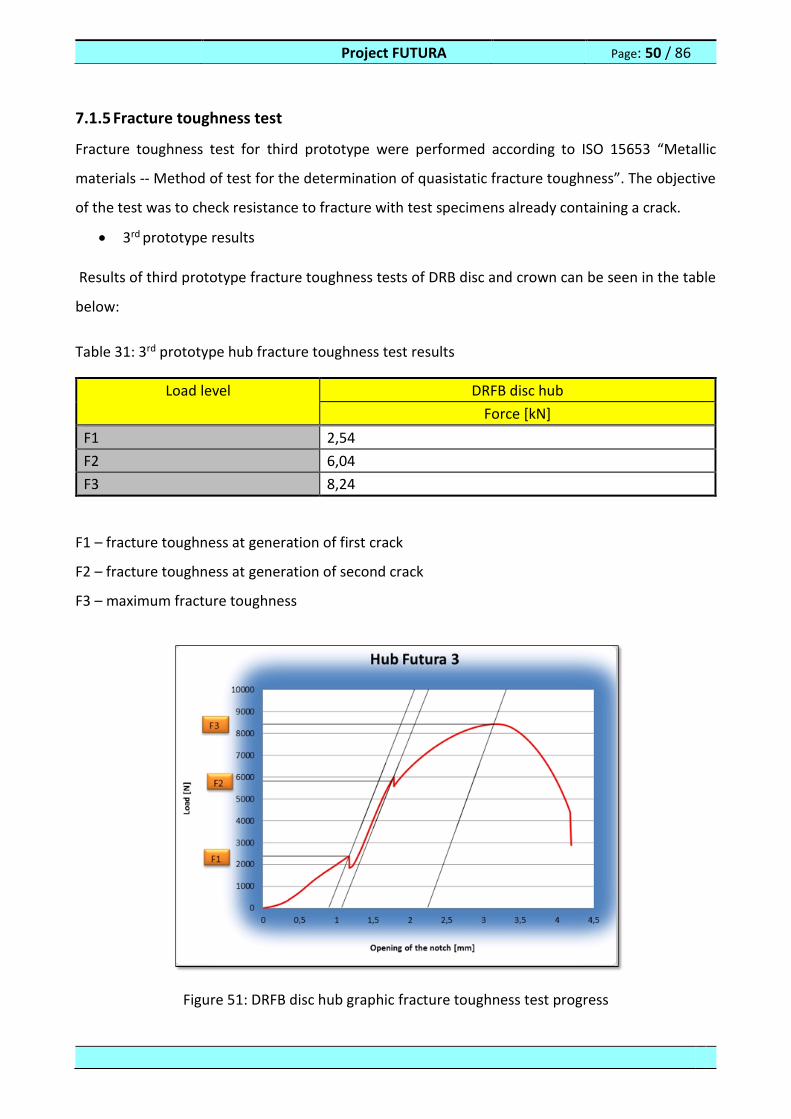
Project FUTURA Page: 50 / 86
7.1.5 Fracture toughness test
Fracture toughness test for third prototype were performed according to ISO 15653 “Metallic
materials -- Method of test for the determination of quasistatic fracture toughness”. The objective
of the test was to check resistance to fracture with test specimens already containing a crack.
3rd prototype results
Results of third prototype fracture toughness tests of DRB disc and crown can be seen in the table
below:
Table 31: 3rd prototype hub fracture toughness test results
Load level DRFB disc hub
Force [kN]
F1 2,54
F2 6,04
F3 8,24
F1 – fracture toughness at generation of first crack
F2 – fracture toughness at generation of second crack
F3 – maximum fracture toughness
Figure 51: DRFB disc hub graphic fracture toughness test progress
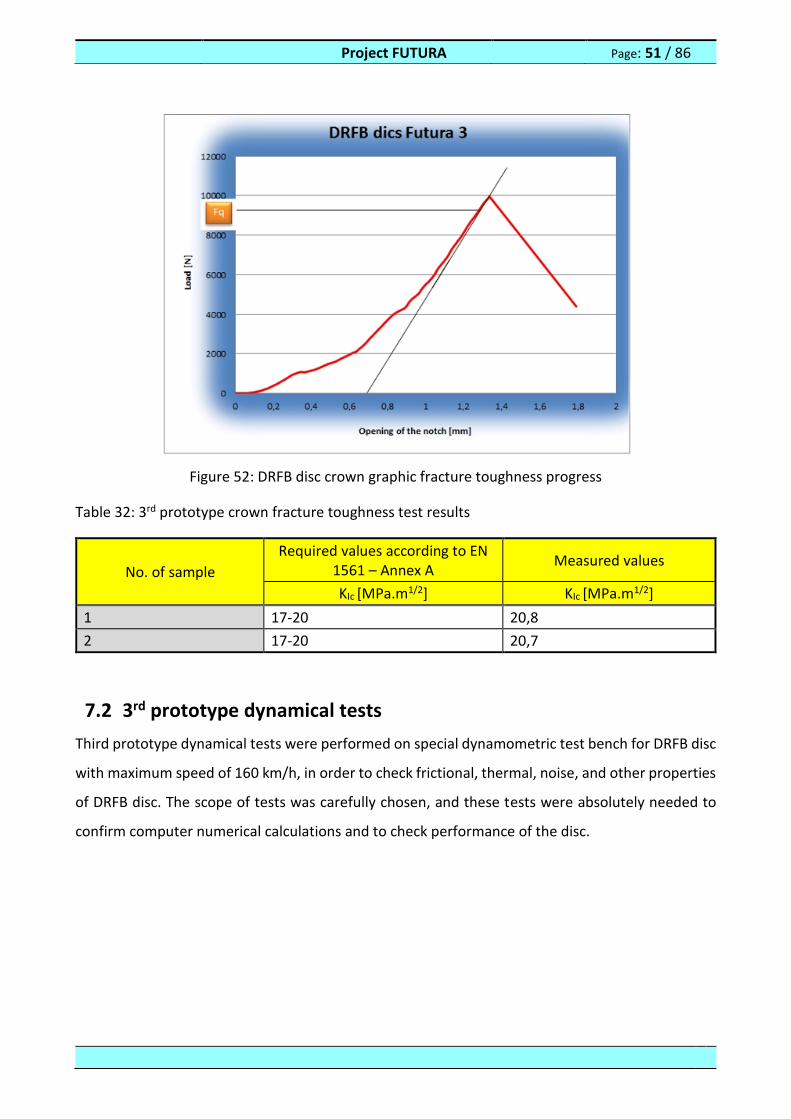
Project FUTURA Page: 51 / 86
Figure 52: DRFB disc crown graphic fracture toughness progress
Table 32: 3rd prototype crown fracture toughness test results
No. of sample
Required values according to EN 1561 – Annex A
Measured values
KIc [MPa.m1/2] KIc [MPa.m1/2]
1 17-20 20,8
2 17-20 20,7
7.2 3rd prototype dynamical tests
Third prototype dynamical tests were performed on special dynamometric test bench for DRFB disc
with maximum speed of 160 km/h, in order to check frictional, thermal, noise, and other properties
of DRFB disc. The scope of tests was carefully chosen, and these tests were absolutely needed to
confirm computer numerical calculations and to check performance of the disc.
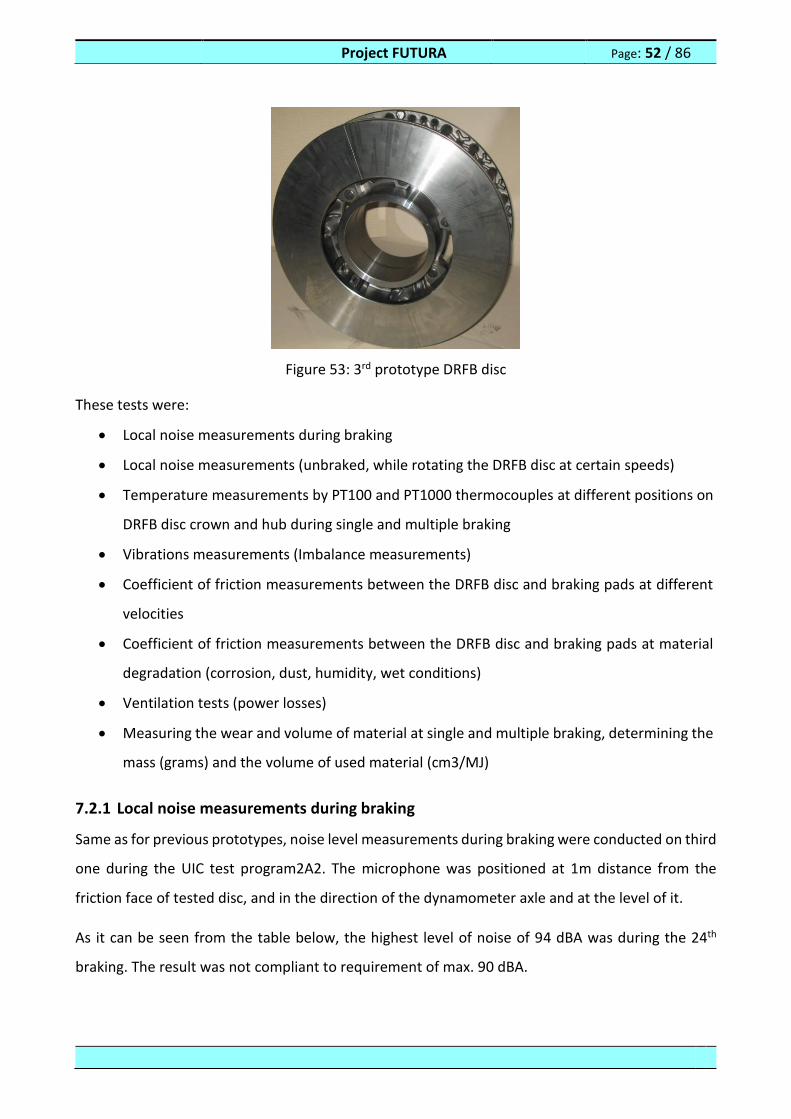
Project FUTURA Page: 52 / 86
Figure 53: 3rd prototype DRFB disc
These tests were:
Local noise measurements during braking
Local noise measurements (unbraked, while rotating the DRFB disc at certain speeds)
Temperature measurements by PT100 and PT1000 thermocouples at different positions on
DRFB disc crown and hub during single and multiple braking
Vibrations measurements (Imbalance measurements)
Coefficient of friction measurements between the DRFB disc and braking pads at different
velocities
Coefficient of friction measurements between the DRFB disc and braking pads at material
degradation (corrosion, dust, humidity, wet conditions)
Ventilation tests (power losses)
Measuring the wear and volume of material at single and multiple braking, determining the
mass (grams) and the volume of used material (cm3/MJ)
7.2.1 Local noise measurements during braking
Same as for previous prototypes, noise level measurements during braking were conducted on third
one during the UIC test program2A2. The microphone was positioned at 1m distance from the
friction face of tested disc, and in the direction of the dynamometer axle and at the level of it.
As it can be seen from the table below, the highest level of noise of 94 dBA was during the 24th
braking. The result was not compliant to requirement of max. 90 dBA.
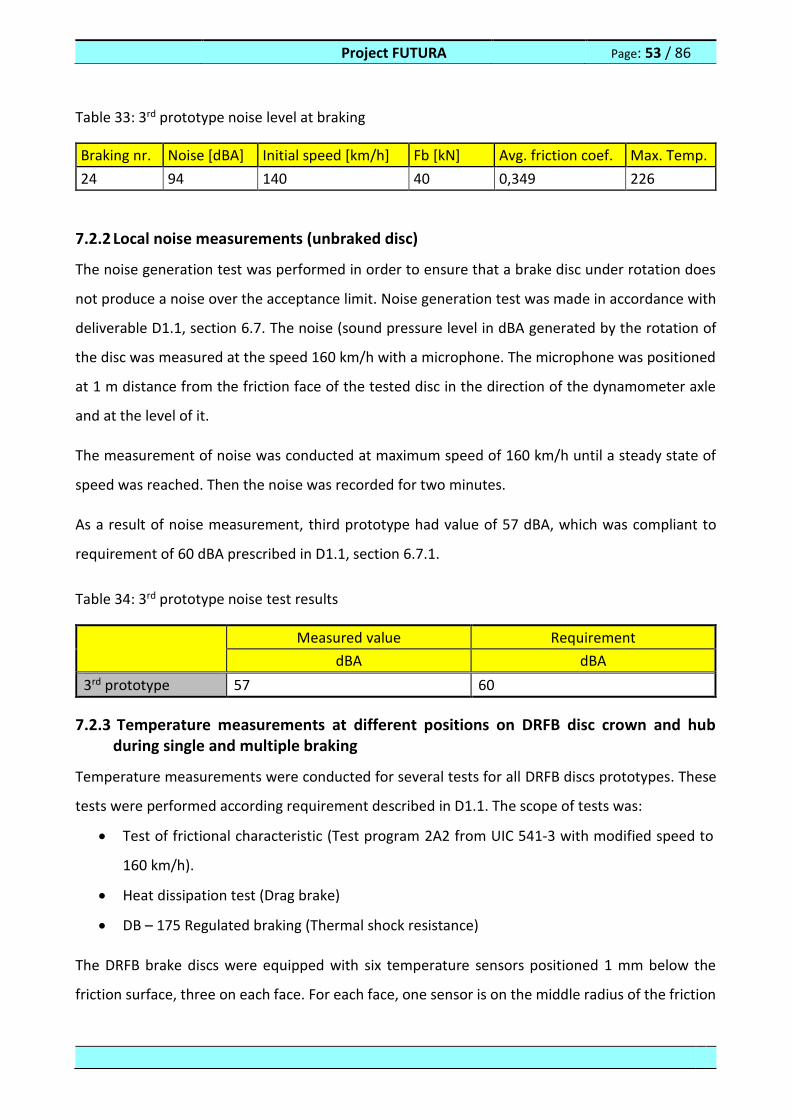
Project FUTURA Page: 53 / 86
Table 33: 3rd prototype noise level at braking
Braking nr. Noise [dBA] Initial speed [km/h] Fb [kN] Avg. friction coef. Max. Temp.
24 94 140 40 0,349 226
7.2.2 Local noise measurements (unbraked disc)
The noise generation test was performed in order to ensure that a brake disc under rotation does
not produce a noise over the acceptance limit. Noise generation test was made in accordance with
deliverable D1.1, section 6.7. The noise (sound pressure level in dBA generated by the rotation of
the disc was measured at the speed 160 km/h with a microphone. The microphone was positioned
at 1 m distance from the friction face of the tested disc in the direction of the dynamometer axle
and at the level of it.
The measurement of noise was conducted at maximum speed of 160 km/h until a steady state of
speed was reached. Then the noise was recorded for two minutes.
As a result of noise measurement, third prototype had value of 57 dBA, which was compliant to
requirement of 60 dBA prescribed in D1.1, section 6.7.1.
Table 34: 3rd prototype noise test results
Measured value Requirement
dBA dBA
3rd prototype 57 60
7.2.3 Temperature measurements at different positions on DRFB disc crown and hub during single and multiple braking
Temperature measurements were conducted for several tests for all DRFB discs prototypes. These
tests were performed according requirement described in D1.1. The scope of tests was:
Test of frictional characteristic (Test program 2A2 from UIC 541‐3 with modified speed to
160 km/h).
Heat dissipation test (Drag brake)
DB – 175 Regulated braking (Thermal shock resistance)
The DRFB brake discs were equipped with six temperature sensors positioned 1 mm below the
friction surface, three on each face. For each face, one sensor is on the middle radius of the friction
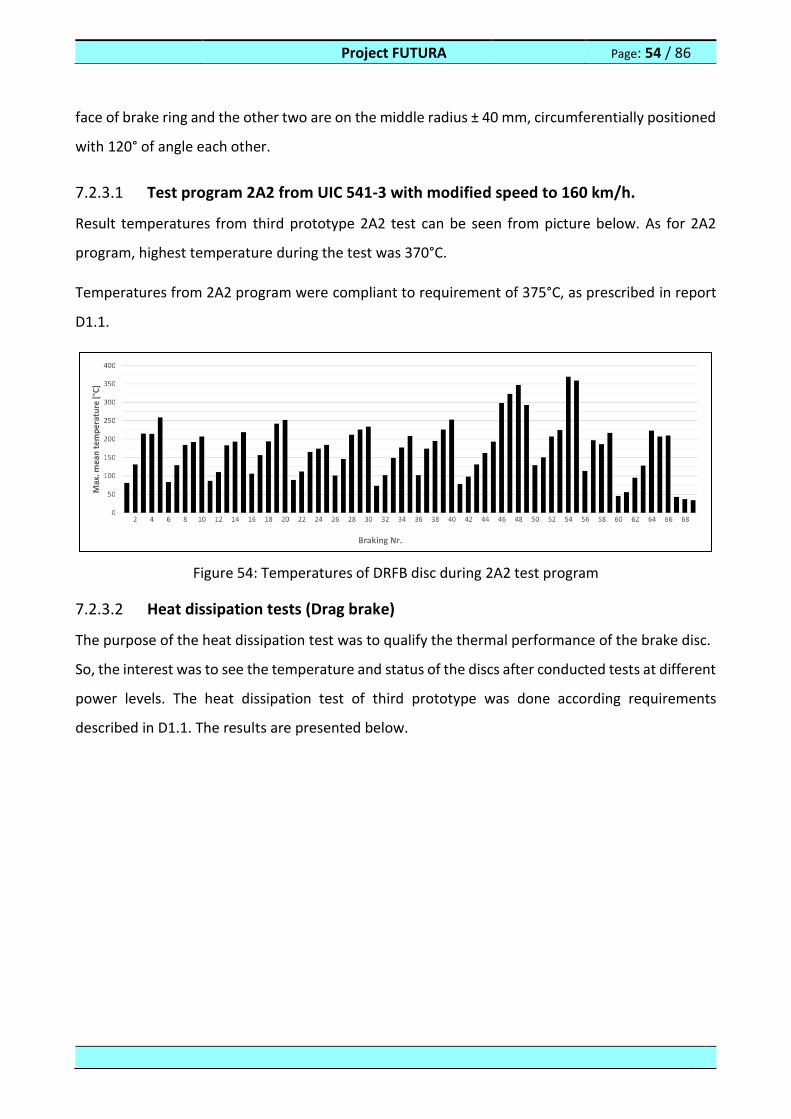
Project FUTURA Page: 54 / 86
face of brake ring and the other two are on the middle radius ± 40 mm, circumferentially positioned
with 120° of angle each other.
7.2.3.1 Test program 2A2 from UIC 541‐3 with modified speed to 160 km/h.
Result temperatures from third prototype 2A2 test can be seen from picture below. As for 2A2
program, highest temperature during the test was 370°C.
Temperatures from 2A2 program were compliant to requirement of 375°C, as prescribed in report
D1.1.
Figure 54: Temperatures of DRFB disc during 2A2 test program
7.2.3.2 Heat dissipation tests (Drag brake)
The purpose of the heat dissipation test was to qualify the thermal performance of the brake disc.
So, the interest was to see the temperature and status of the discs after conducted tests at different
power levels. The heat dissipation test of third prototype was done according requirements
described in D1.1. The results are presented below.
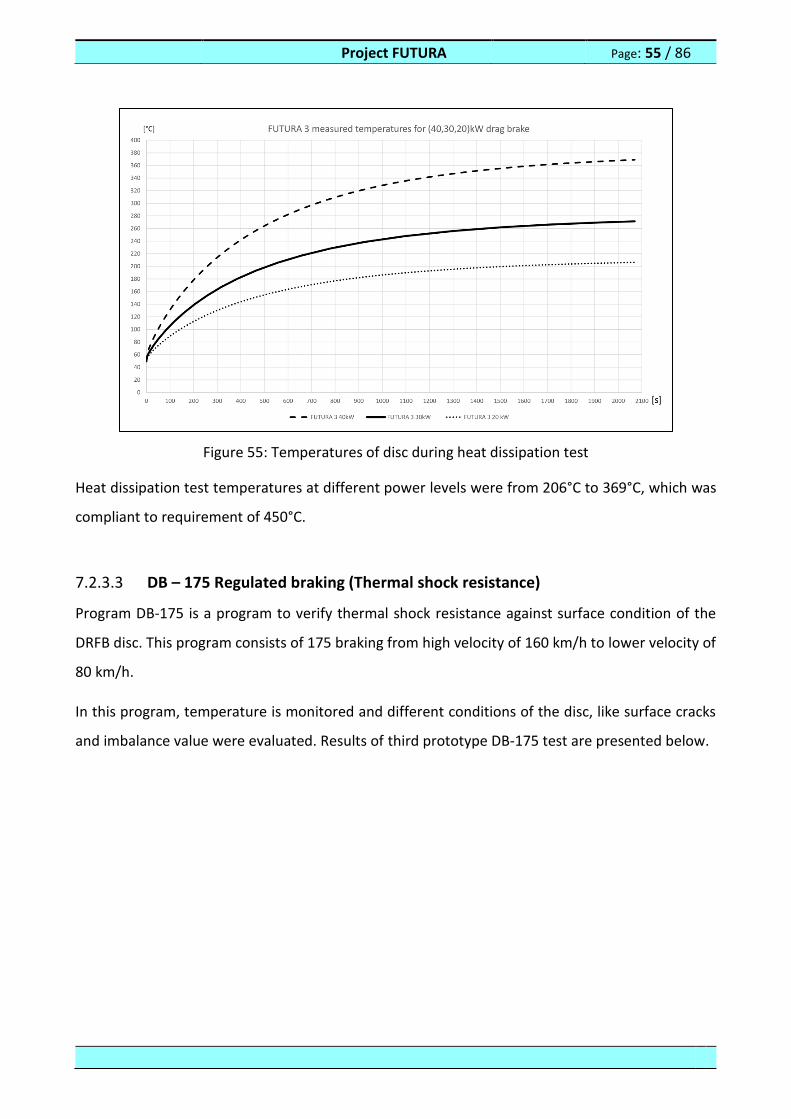
Project FUTURA Page: 55 / 86
Figure 55: Temperatures of disc during heat dissipation test
Heat dissipation test temperatures at different power levels were from 206°C to 369°C, which was
compliant to requirement of 450°C.
7.2.3.3 DB – 175 Regulated braking (Thermal shock resistance)
Program DB-175 is a program to verify thermal shock resistance against surface condition of the
DRFB disc. This program consists of 175 braking from high velocity of 160 km/h to lower velocity of
80 km/h.
In this program, temperature is monitored and different conditions of the disc, like surface cracks
and imbalance value were evaluated. Results of third prototype DB-175 test are presented below.
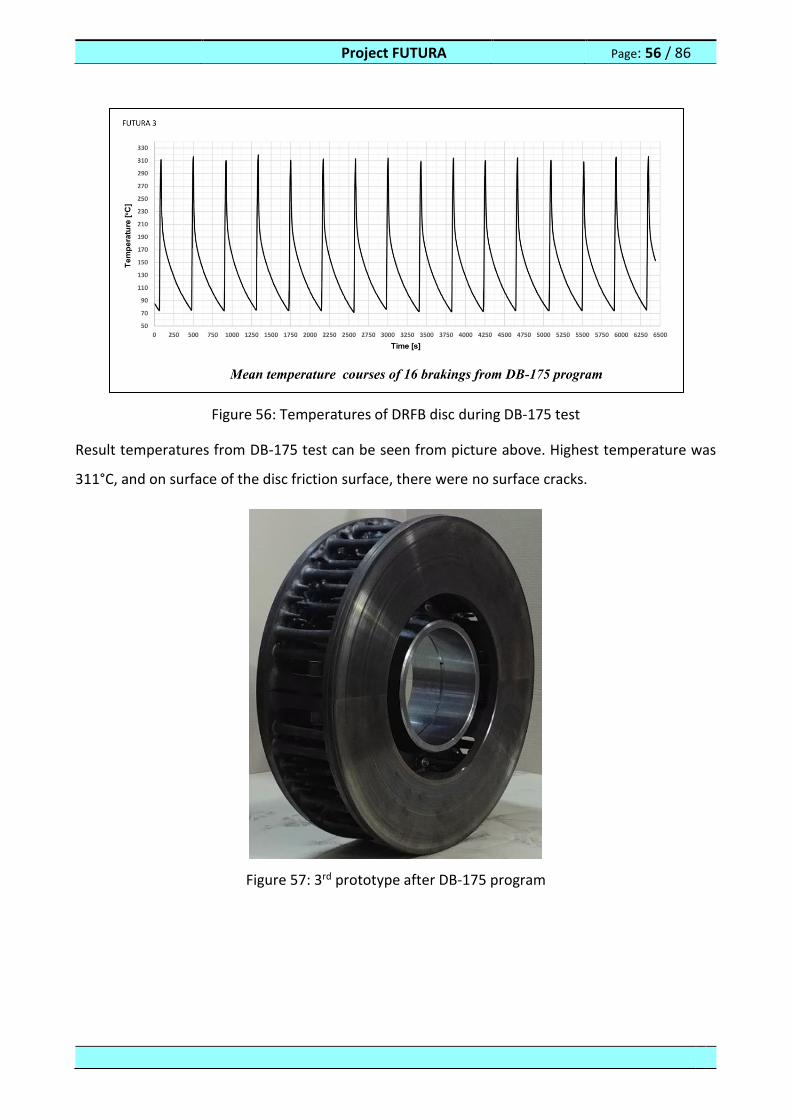
Project FUTURA Page: 56 / 86
Figure 56: Temperatures of DRFB disc during DB-175 test
Result temperatures from DB-175 test can be seen from picture above. Highest temperature was
311°C, and on surface of the disc friction surface, there were no surface cracks.
Figure 57: 3rd prototype after DB-175 program
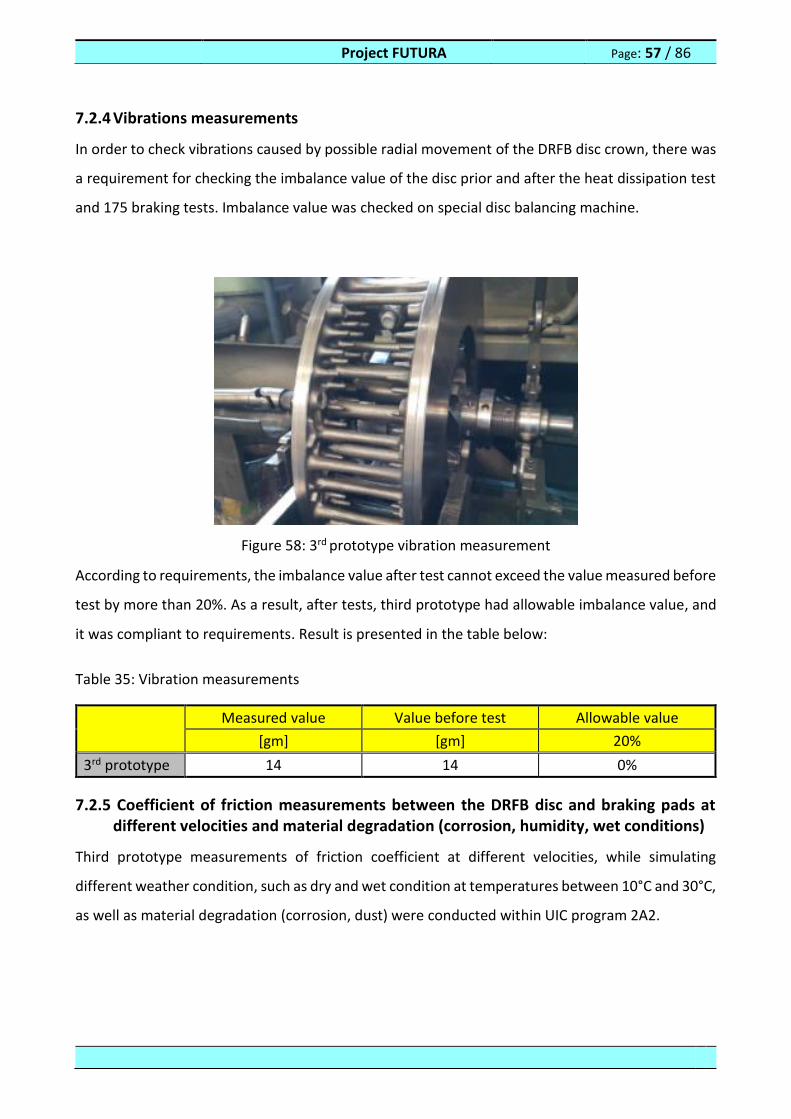
Project FUTURA Page: 57 / 86
7.2.4 Vibrations measurements
In order to check vibrations caused by possible radial movement of the DRFB disc crown, there was
a requirement for checking the imbalance value of the disc prior and after the heat dissipation test
and 175 braking tests. Imbalance value was checked on special disc balancing machine.
Figure 58: 3rd prototype vibration measurement
According to requirements, the imbalance value after test cannot exceed the value measured before
test by more than 20%. As a result, after tests, third prototype had allowable imbalance value, and
it was compliant to requirements. Result is presented in the table below:
Table 35: Vibration measurements
Measured value Value before test Allowable value
[gm] [gm] 20%
3rd prototype 14 14 0%
7.2.5 Coefficient of friction measurements between the DRFB disc and braking pads at different velocities and material degradation (corrosion, humidity, wet conditions)
Third prototype measurements of friction coefficient at different velocities, while simulating
different weather condition, such as dry and wet condition at temperatures between 10°C and 30°C,
as well as material degradation (corrosion, dust) were conducted within UIC program 2A2.
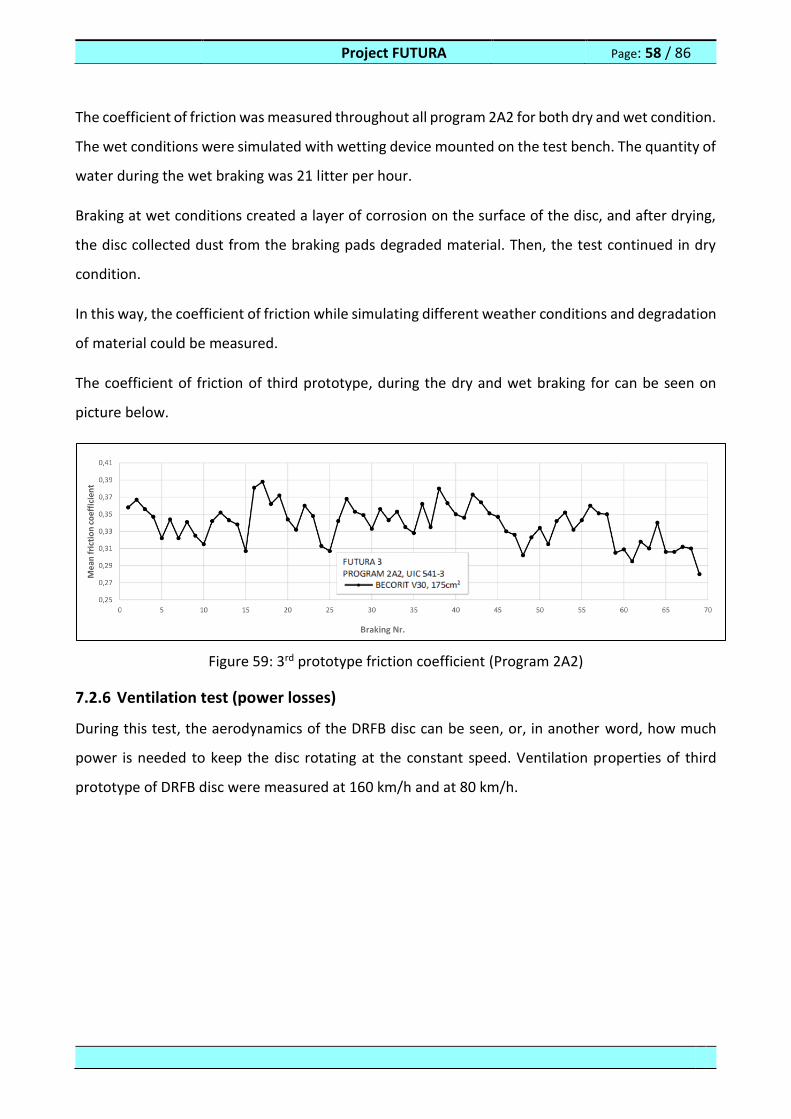
Project FUTURA Page: 58 / 86
The coefficient of friction was measured throughout all program 2A2 for both dry and wet condition.
The wet conditions were simulated with wetting device mounted on the test bench. The quantity of
water during the wet braking was 21 litter per hour.
Braking at wet conditions created a layer of corrosion on the surface of the disc, and after drying,
the disc collected dust from the braking pads degraded material. Then, the test continued in dry
condition.
In this way, the coefficient of friction while simulating different weather conditions and degradation
of material could be measured.
The coefficient of friction of third prototype, during the dry and wet braking for can be seen on
picture below.
Figure 59: 3rd prototype friction coefficient (Program 2A2)
7.2.6 Ventilation test (power losses)
During this test, the aerodynamics of the DRFB disc can be seen, or, in another word, how much
power is needed to keep the disc rotating at the constant speed. Ventilation properties of third
prototype of DRFB disc were measured at 160 km/h and at 80 km/h.

Project FUTURA Page: 59 / 86
Figure 60: 3rd prototype ventilation losses
For third prototype maximum ventilation losses were 377 W at speed 160 km/h, which was not
compliant to requirement of 350W.
7.2.7 Measurement of the wear of material (determining the mass and the volume of used material)
As prescribed in 2A2 program of UIC 541-3 standard, the wear of material (weighing) was done.
The weighing of pads was done after bedding-in, 41st, 45th and 57th braking. The total loss of mass,
during the 2A2 program was 146 grams. As specific weight of the pad is around 2.18 g/cm3 and the
spent energy was 253,97 MJ, the specific volume of wear after the test was 0,263 cm3/MJ. This
value is compliant to prescribed requirement 0,28 𝑐𝑚3.
Table 36: 3rd prototype pad wear
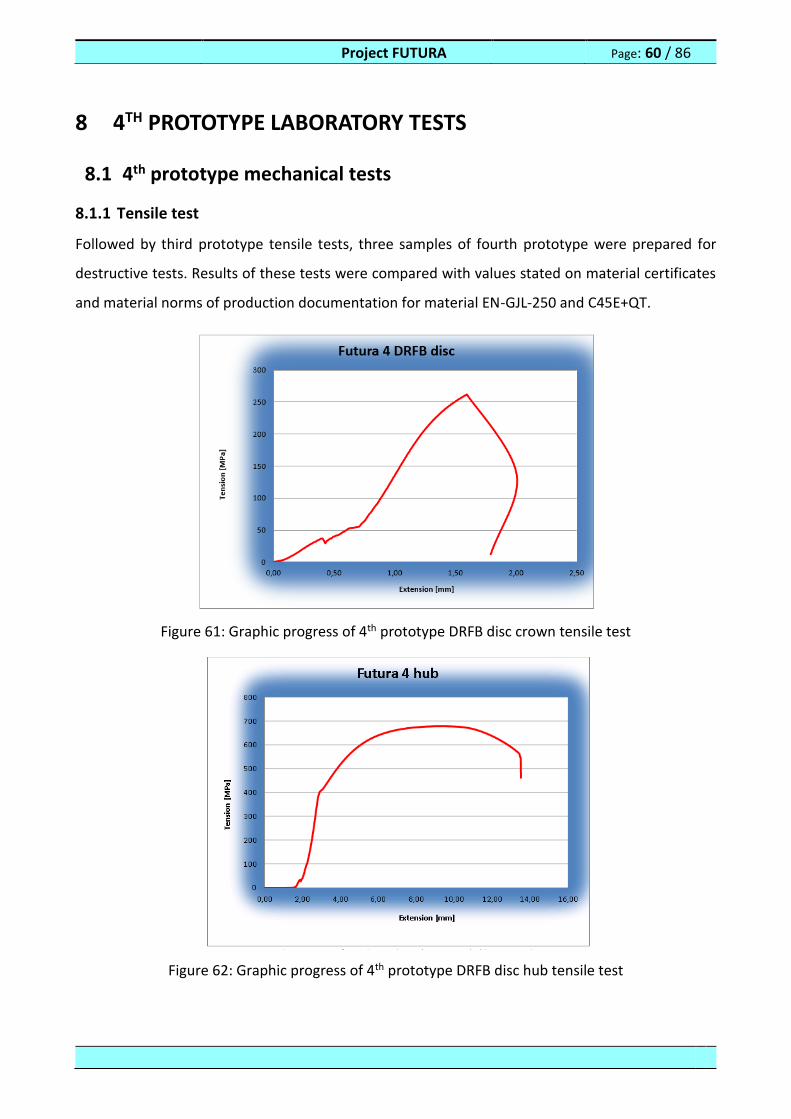
Project FUTURA Page: 60 / 86
8 4TH PROTOTYPE LABORATORY TESTS
8.1 4th prototype mechanical tests
8.1.1 Tensile test
Followed by third prototype tensile tests, three samples of fourth prototype were prepared for
destructive tests. Results of these tests were compared with values stated on material certificates
and material norms of production documentation for material EN-GJL-250 and C45E+QT.
Figure 61: Graphic progress of 4th prototype DRFB disc crown tensile test
Figure 62: Graphic progress of 4th prototype DRFB disc hub tensile test
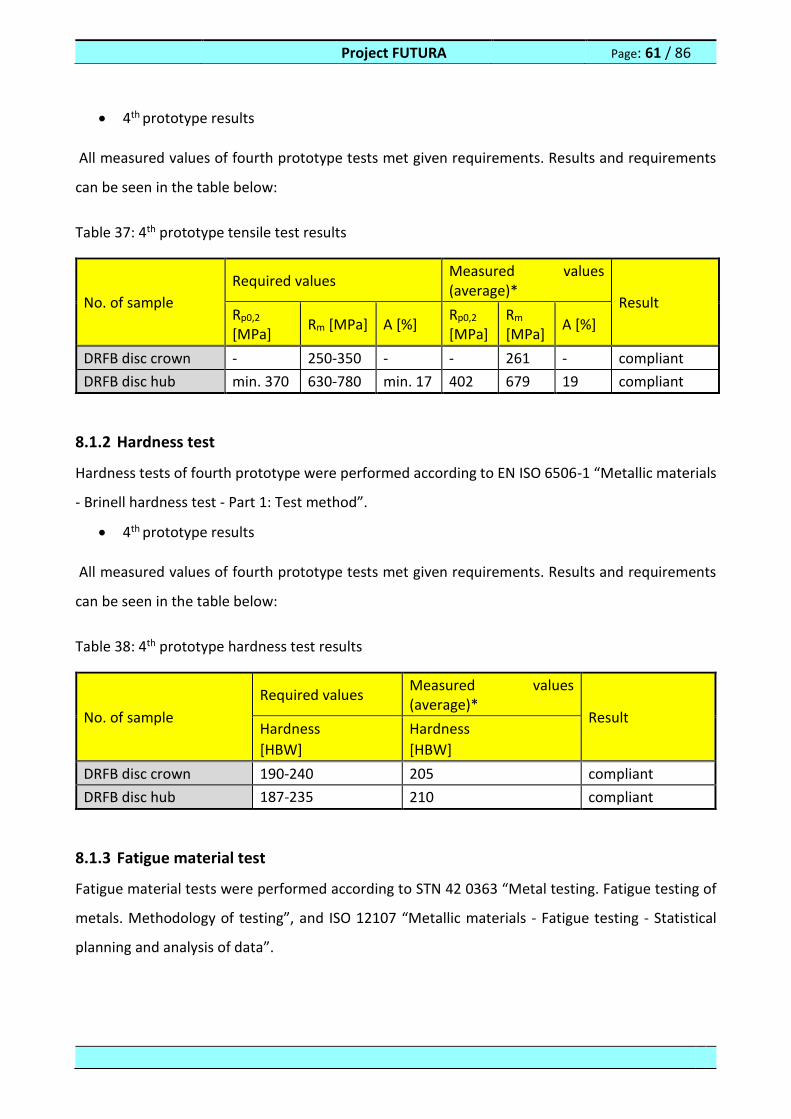
Project FUTURA Page: 61 / 86
4th prototype results
All measured values of fourth prototype tests met given requirements. Results and requirements
can be seen in the table below:
Table 37: 4th prototype tensile test results
No. of sample
Required values Measured values (average)*
Result Rp0,2
[MPa] Rm [MPa] A [%]
Rp0,2
[MPa] Rm [MPa]
A [%]
DRFB disc crown - 250-350 - - 261 - compliant
DRFB disc hub min. 370 630-780 min. 17 402 679 19 compliant
8.1.2 Hardness test
Hardness tests of fourth prototype were performed according to EN ISO 6506-1 “Metallic materials
- Brinell hardness test - Part 1: Test method”.
4th prototype results
All measured values of fourth prototype tests met given requirements. Results and requirements
can be seen in the table below:
Table 38: 4th prototype hardness test results
No. of sample
Required values Measured values (average)*
Result Hardness
[HBW]
Hardness
[HBW]
DRFB disc crown 190-240 205 compliant
DRFB disc hub 187-235 210 compliant
8.1.3 Fatigue material test
Fatigue material tests were performed according to STN 42 0363 “Metal testing. Fatigue testing of
metals. Methodology of testing”, and ISO 12107 “Metallic materials - Fatigue testing - Statistical
planning and analysis of data”.

Project FUTURA Page: 62 / 86
The objective of the test was to prove endurance strength at sample with non-modified (not
grinded) surface of sample at level of stress δu= 114 MPa. Sample of material was loaded with cyclic
loading force with sinusoidal course, and maximum amplitude which loads sample with stress above
114 MPa.
In case of crack stress is lowered, and the test are repeated. According to mentioned standards
there can’t occur a crack after completing 2 million of loading cycles with maximum stress higher
than 114 MPa. Verification of surface crack is performed by non-destructive capillary control of
surface defects on test sample. Positive test result will be confirmed between fatigue tests of two
samples. All measured values of fourth prototype tests met given requirements. Results and
requirements can be seen in the table below:
Table 39: 4th prototype fatigue test results
No. of sample Material Required level of fatigue stress δu
[MPa]
Level of stress without cracks 2 samples
[MPa]
DRFB disc hub C45E+QT min. 114 218
8.1.4 Charpy test
Charpy impact tests of fourth prototype were performed according to EN ISO 148-1 “Metallic
materials - Charpy pendulum impact test - Part 1: Test method”.
Samples were prepared in accordance with standard EN ISO 148-1. Notch geometry “V” was used
for preparation of samples. The V-notch had an included angle of 45°, depth of 2 mm, and a root
radius of 0,25 mm.
4th prototype results
All measured values of fourth prototype tests met given requirements, and are within required
range. Results and requirements can be seen in the table below:

Project FUTURA Page: 63 / 86
Table 40: 4th prototype Charpy test results
No. of sample
Required values Measured values
(average)* Result
Kv
[J]
Kv
[J]
DRFB disc hub min 32 45 compliant
8.1.5 Fracture toughness test
Fracture toughness test for fourth prototype were performed according to ISO 15653 “Metallic
materials -- Method of test for the determination of quasistatic fracture toughness”. The objective
of the test was to check resistance to fracture with test specimens already containing a crack.
4th prototype results
Results of fourth prototype fracture toughness tests of DRB disc and crown can be seen in the table
below:
Table 41: 4th prototype hub fracture toughness test results
Load level DRFB disc hub
Force [kN]
F1 2,45
F2 5,92
F3 7,72
F1 – fracture toughness at generation of first crack
F2 – fracture toughness at generation of second crack
F3 – maximum fracture toughness
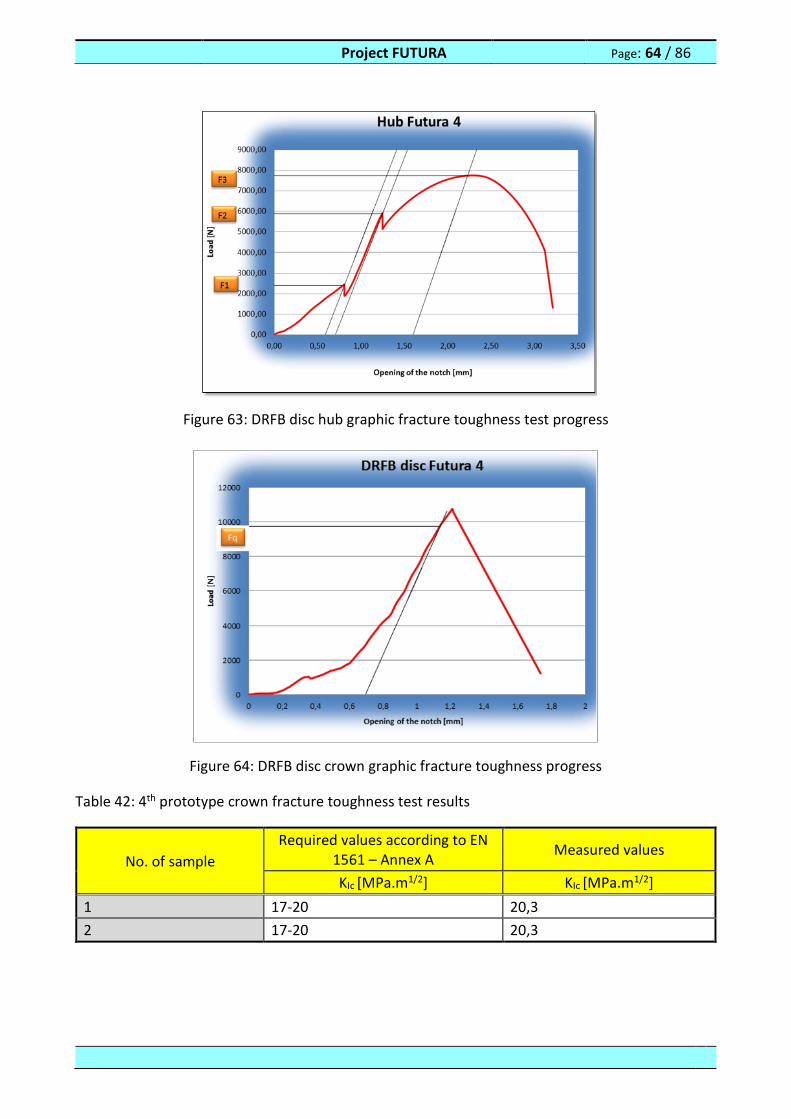
Project FUTURA Page: 64 / 86
Figure 63: DRFB disc hub graphic fracture toughness test progress
Figure 64: DRFB disc crown graphic fracture toughness progress
Table 42: 4th prototype crown fracture toughness test results
No. of sample
Required values according to EN 1561 – Annex A
Measured values
KIc [MPa.m1/2] KIc [MPa.m1/2]
1 17-20 20,3
2 17-20 20,3
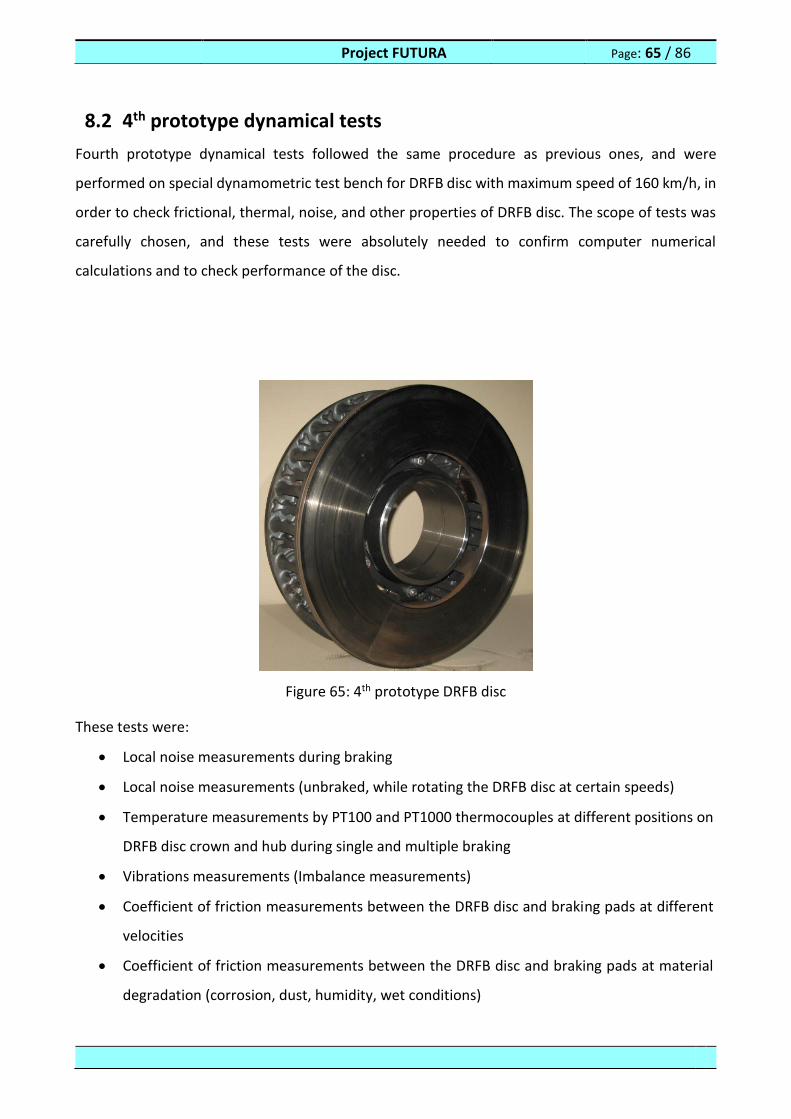
Project FUTURA Page: 65 / 86
8.2 4th prototype dynamical tests
Fourth prototype dynamical tests followed the same procedure as previous ones, and were
performed on special dynamometric test bench for DRFB disc with maximum speed of 160 km/h, in
order to check frictional, thermal, noise, and other properties of DRFB disc. The scope of tests was
carefully chosen, and these tests were absolutely needed to confirm computer numerical
calculations and to check performance of the disc.
Figure 65: 4th prototype DRFB disc
These tests were:
Local noise measurements during braking
Local noise measurements (unbraked, while rotating the DRFB disc at certain speeds)
Temperature measurements by PT100 and PT1000 thermocouples at different positions on
DRFB disc crown and hub during single and multiple braking
Vibrations measurements (Imbalance measurements)
Coefficient of friction measurements between the DRFB disc and braking pads at different
velocities
Coefficient of friction measurements between the DRFB disc and braking pads at material
degradation (corrosion, dust, humidity, wet conditions)
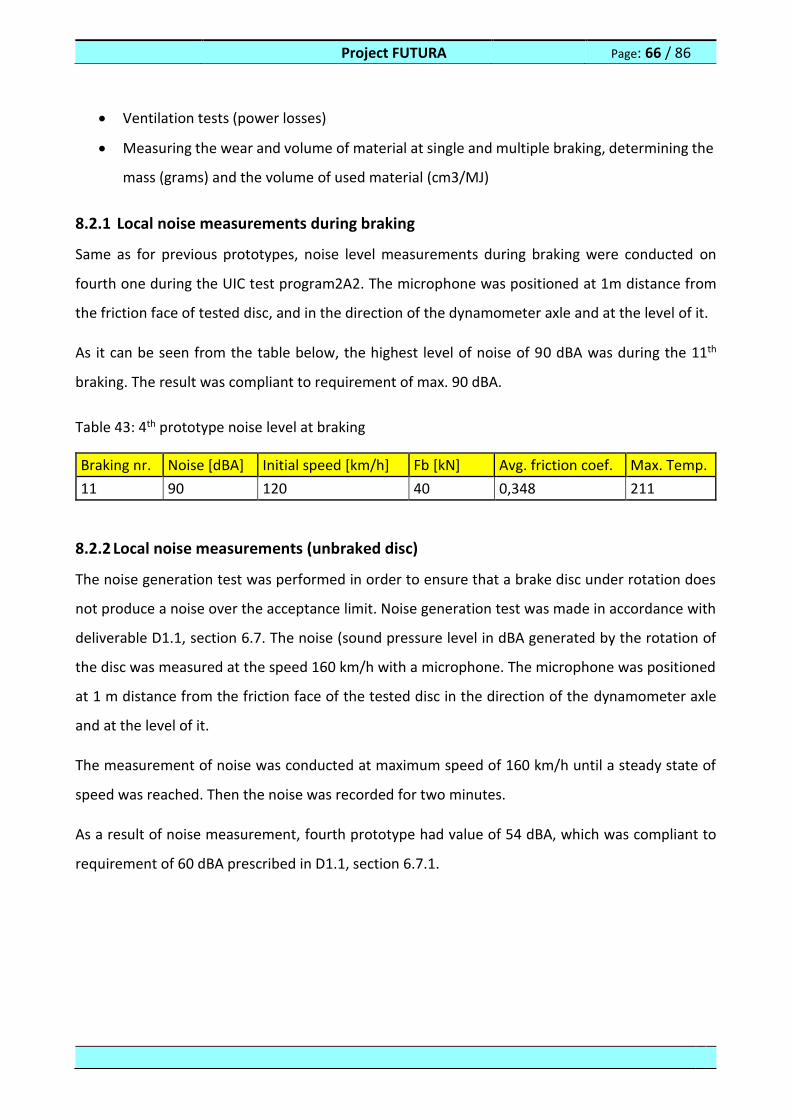
Project FUTURA Page: 66 / 86
Ventilation tests (power losses)
Measuring the wear and volume of material at single and multiple braking, determining the
mass (grams) and the volume of used material (cm3/MJ)
8.2.1 Local noise measurements during braking
Same as for previous prototypes, noise level measurements during braking were conducted on
fourth one during the UIC test program2A2. The microphone was positioned at 1m distance from
the friction face of tested disc, and in the direction of the dynamometer axle and at the level of it.
As it can be seen from the table below, the highest level of noise of 90 dBA was during the 11th
braking. The result was compliant to requirement of max. 90 dBA.
Table 43: 4th prototype noise level at braking
Braking nr. Noise [dBA] Initial speed [km/h] Fb [kN] Avg. friction coef. Max. Temp.
11 90 120 40 0,348 211
8.2.2 Local noise measurements (unbraked disc)
The noise generation test was performed in order to ensure that a brake disc under rotation does
not produce a noise over the acceptance limit. Noise generation test was made in accordance with
deliverable D1.1, section 6.7. The noise (sound pressure level in dBA generated by the rotation of
the disc was measured at the speed 160 km/h with a microphone. The microphone was positioned
at 1 m distance from the friction face of the tested disc in the direction of the dynamometer axle
and at the level of it.
The measurement of noise was conducted at maximum speed of 160 km/h until a steady state of
speed was reached. Then the noise was recorded for two minutes.
As a result of noise measurement, fourth prototype had value of 54 dBA, which was compliant to
requirement of 60 dBA prescribed in D1.1, section 6.7.1.
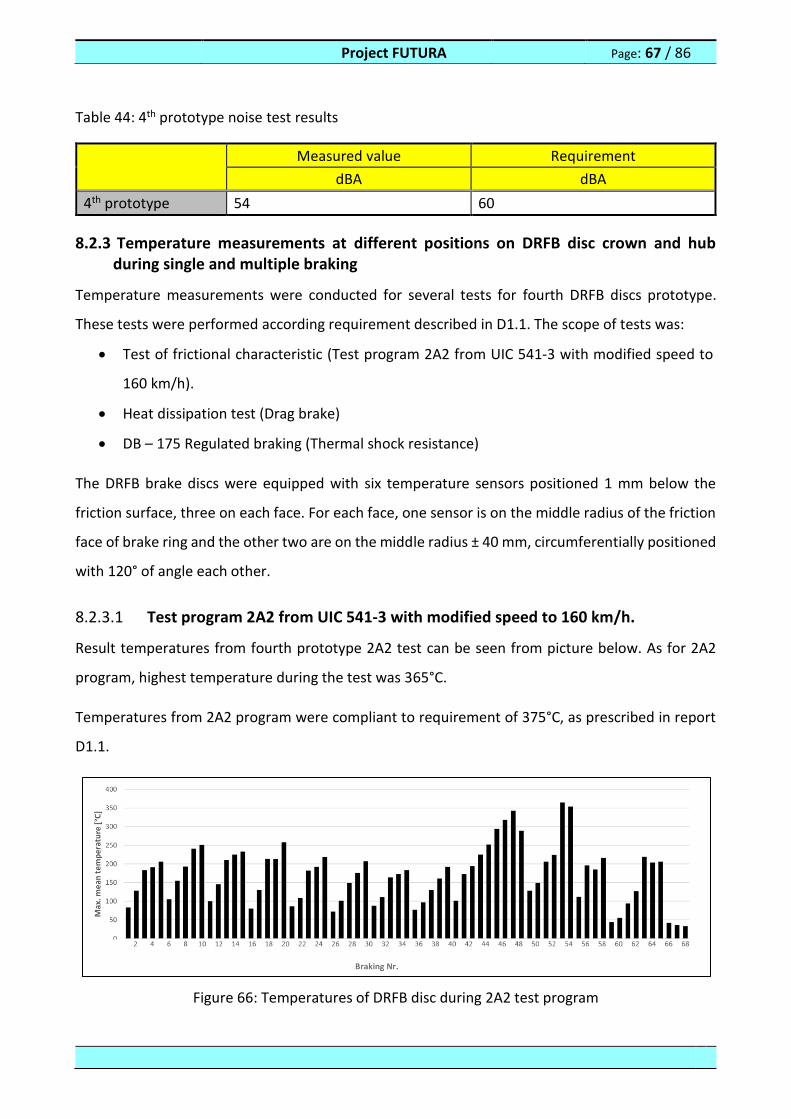
Project FUTURA Page: 67 / 86
Table 44: 4th prototype noise test results
Measured value Requirement
dBA dBA
4th prototype 54 60
8.2.3 Temperature measurements at different positions on DRFB disc crown and hub during single and multiple braking
Temperature measurements were conducted for several tests for fourth DRFB discs prototype.
These tests were performed according requirement described in D1.1. The scope of tests was:
Test of frictional characteristic (Test program 2A2 from UIC 541‐3 with modified speed to
160 km/h).
Heat dissipation test (Drag brake)
DB – 175 Regulated braking (Thermal shock resistance)
The DRFB brake discs were equipped with six temperature sensors positioned 1 mm below the
friction surface, three on each face. For each face, one sensor is on the middle radius of the friction
face of brake ring and the other two are on the middle radius ± 40 mm, circumferentially positioned
with 120° of angle each other.
8.2.3.1 Test program 2A2 from UIC 541‐3 with modified speed to 160 km/h.
Result temperatures from fourth prototype 2A2 test can be seen from picture below. As for 2A2
program, highest temperature during the test was 365°C.
Temperatures from 2A2 program were compliant to requirement of 375°C, as prescribed in report
D1.1.
Figure 66: Temperatures of DRFB disc during 2A2 test program
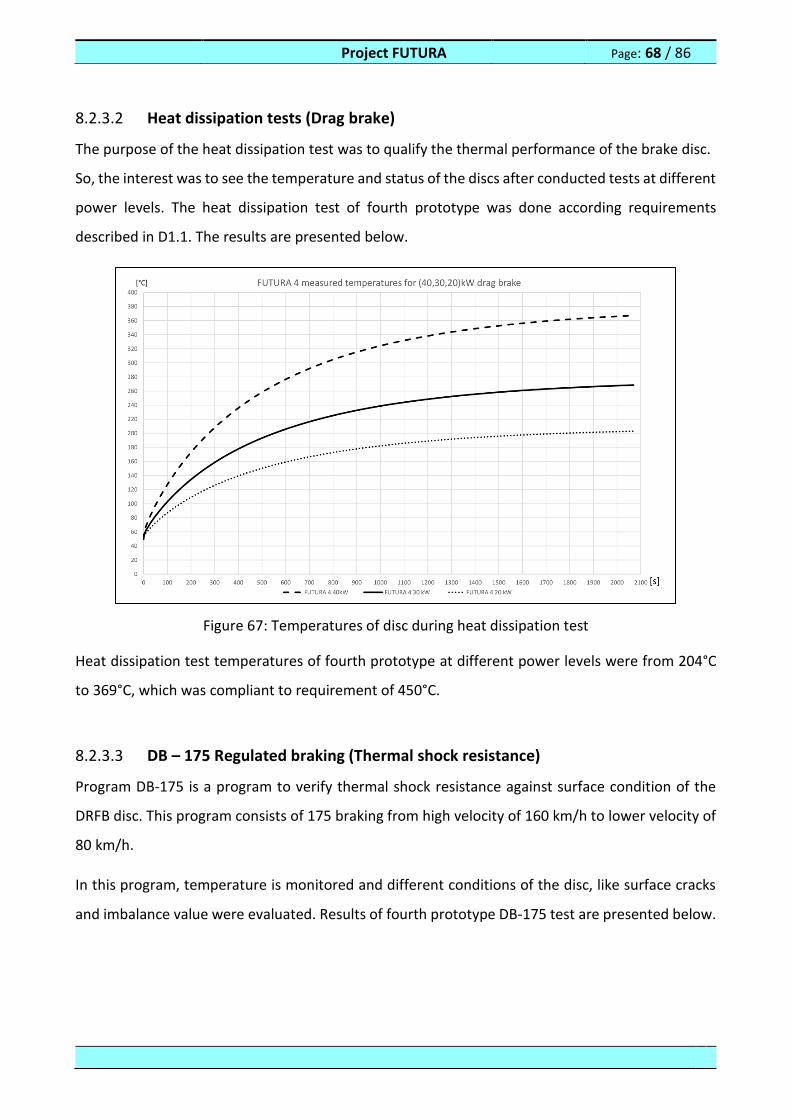
Project FUTURA Page: 68 / 86
8.2.3.2 Heat dissipation tests (Drag brake)
The purpose of the heat dissipation test was to qualify the thermal performance of the brake disc.
So, the interest was to see the temperature and status of the discs after conducted tests at different
power levels. The heat dissipation test of fourth prototype was done according requirements
described in D1.1. The results are presented below.
Figure 67: Temperatures of disc during heat dissipation test
Heat dissipation test temperatures of fourth prototype at different power levels were from 204°C
to 369°C, which was compliant to requirement of 450°C.
8.2.3.3 DB – 175 Regulated braking (Thermal shock resistance)
Program DB-175 is a program to verify thermal shock resistance against surface condition of the
DRFB disc. This program consists of 175 braking from high velocity of 160 km/h to lower velocity of
80 km/h.
In this program, temperature is monitored and different conditions of the disc, like surface cracks
and imbalance value were evaluated. Results of fourth prototype DB-175 test are presented below.
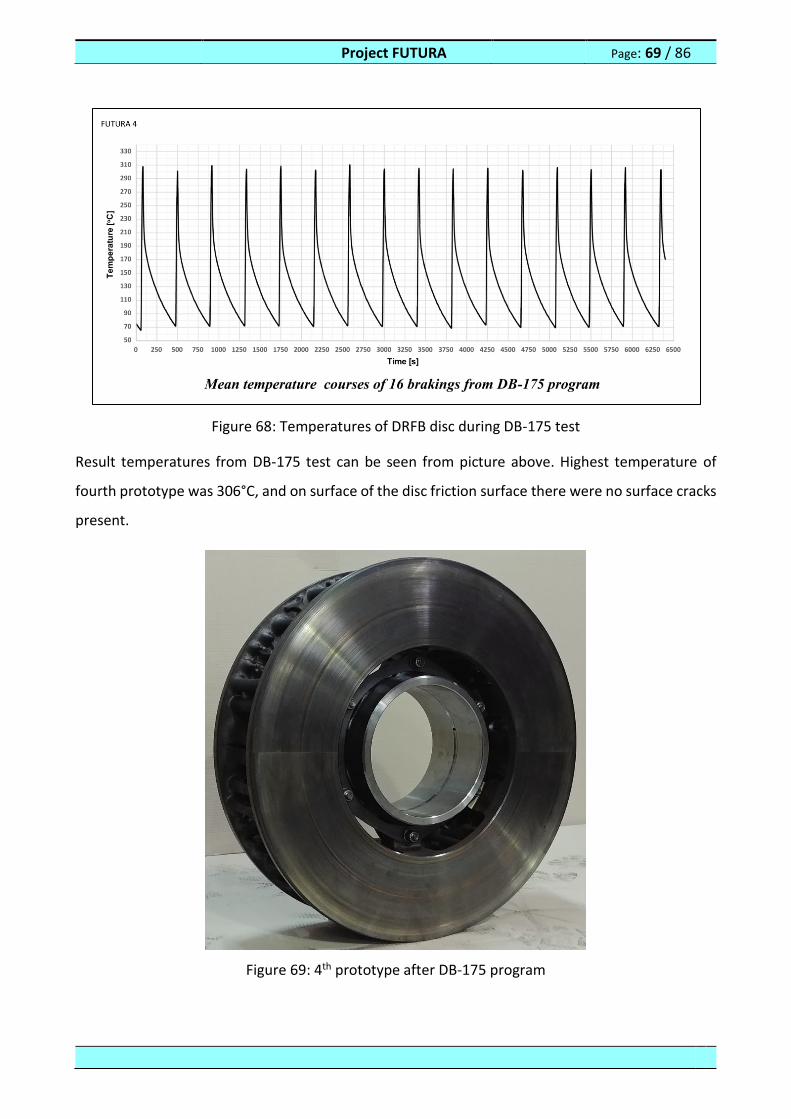
Project FUTURA Page: 69 / 86
Figure 68: Temperatures of DRFB disc during DB-175 test
Result temperatures from DB-175 test can be seen from picture above. Highest temperature of
fourth prototype was 306°C, and on surface of the disc friction surface there were no surface cracks
present.
Figure 69: 4th prototype after DB-175 program
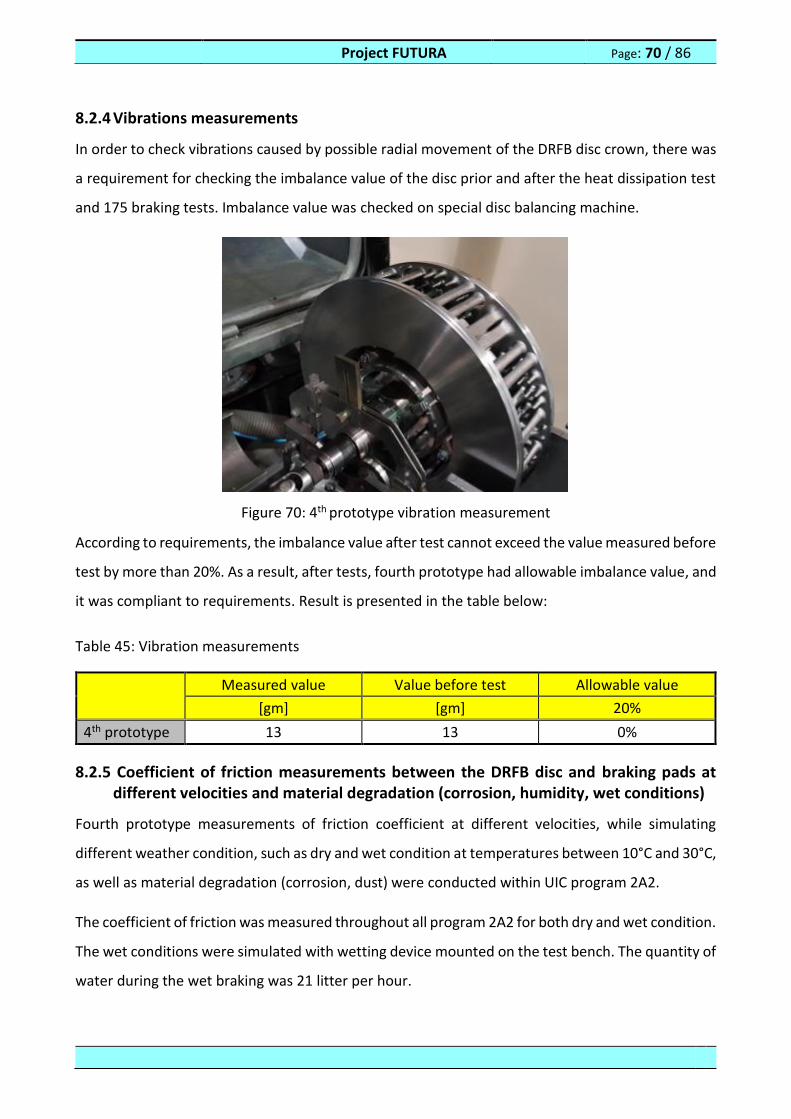
Project FUTURA Page: 70 / 86
8.2.4 Vibrations measurements
In order to check vibrations caused by possible radial movement of the DRFB disc crown, there was
a requirement for checking the imbalance value of the disc prior and after the heat dissipation test
and 175 braking tests. Imbalance value was checked on special disc balancing machine.
Figure 70: 4th prototype vibration measurement
According to requirements, the imbalance value after test cannot exceed the value measured before
test by more than 20%. As a result, after tests, fourth prototype had allowable imbalance value, and
it was compliant to requirements. Result is presented in the table below:
Table 45: Vibration measurements
Measured value Value before test Allowable value
[gm] [gm] 20%
4th prototype 13 13 0%
8.2.5 Coefficient of friction measurements between the DRFB disc and braking pads at different velocities and material degradation (corrosion, humidity, wet conditions)
Fourth prototype measurements of friction coefficient at different velocities, while simulating
different weather condition, such as dry and wet condition at temperatures between 10°C and 30°C,
as well as material degradation (corrosion, dust) were conducted within UIC program 2A2.
The coefficient of friction was measured throughout all program 2A2 for both dry and wet condition.
The wet conditions were simulated with wetting device mounted on the test bench. The quantity of
water during the wet braking was 21 litter per hour.
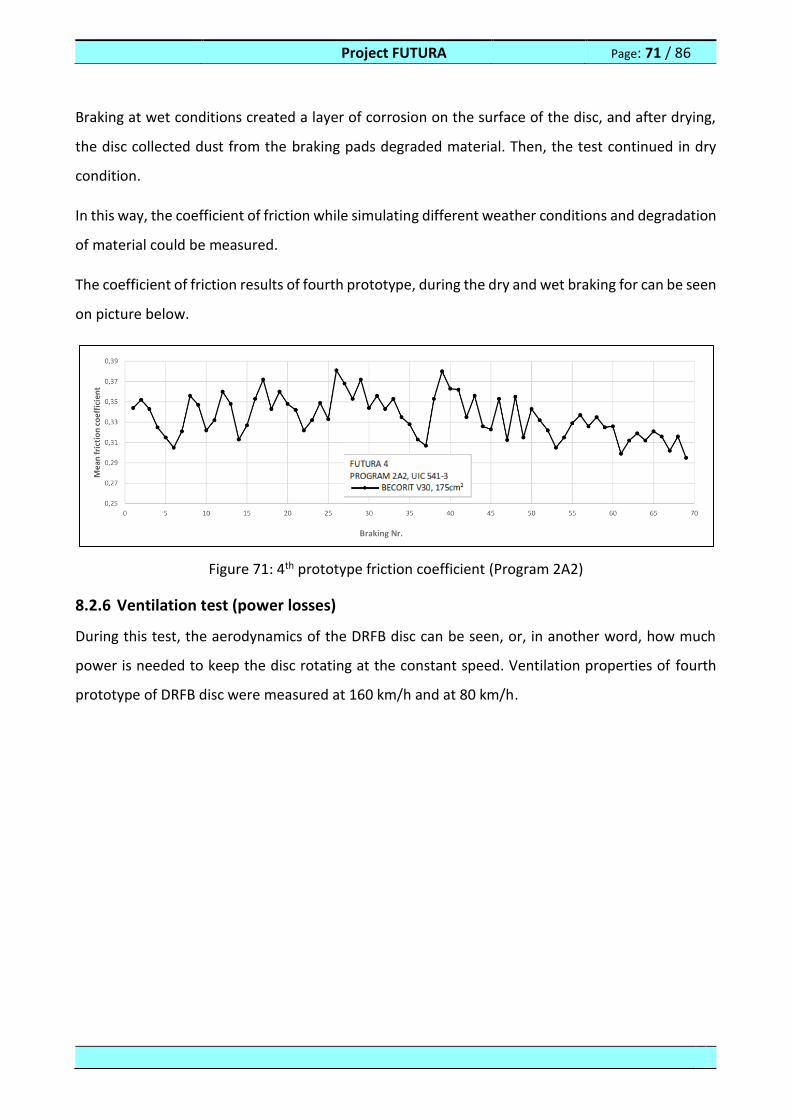
Project FUTURA Page: 71 / 86
Braking at wet conditions created a layer of corrosion on the surface of the disc, and after drying,
the disc collected dust from the braking pads degraded material. Then, the test continued in dry
condition.
In this way, the coefficient of friction while simulating different weather conditions and degradation
of material could be measured.
The coefficient of friction results of fourth prototype, during the dry and wet braking for can be seen
on picture below.
Figure 71: 4th prototype friction coefficient (Program 2A2)
8.2.6 Ventilation test (power losses)
During this test, the aerodynamics of the DRFB disc can be seen, or, in another word, how much
power is needed to keep the disc rotating at the constant speed. Ventilation properties of fourth
prototype of DRFB disc were measured at 160 km/h and at 80 km/h.
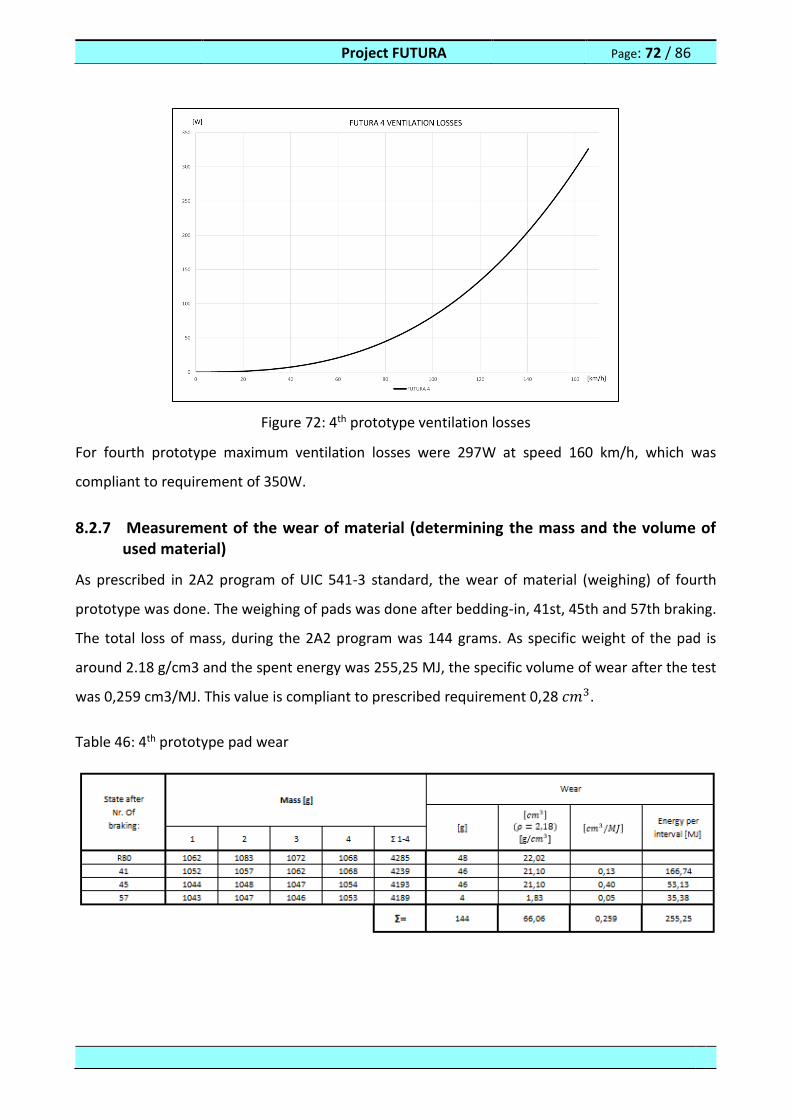
Project FUTURA Page: 72 / 86
Figure 72: 4th prototype ventilation losses
For fourth prototype maximum ventilation losses were 297W at speed 160 km/h, which was
compliant to requirement of 350W.
8.2.7 Measurement of the wear of material (determining the mass and the volume of used material)
As prescribed in 2A2 program of UIC 541-3 standard, the wear of material (weighing) of fourth
prototype was done. The weighing of pads was done after bedding-in, 41st, 45th and 57th braking.
The total loss of mass, during the 2A2 program was 144 grams. As specific weight of the pad is
around 2.18 g/cm3 and the spent energy was 255,25 MJ, the specific volume of wear after the test
was 0,259 cm3/MJ. This value is compliant to prescribed requirement 0,28 𝑐𝑚3.
Table 46: 4th prototype pad wear
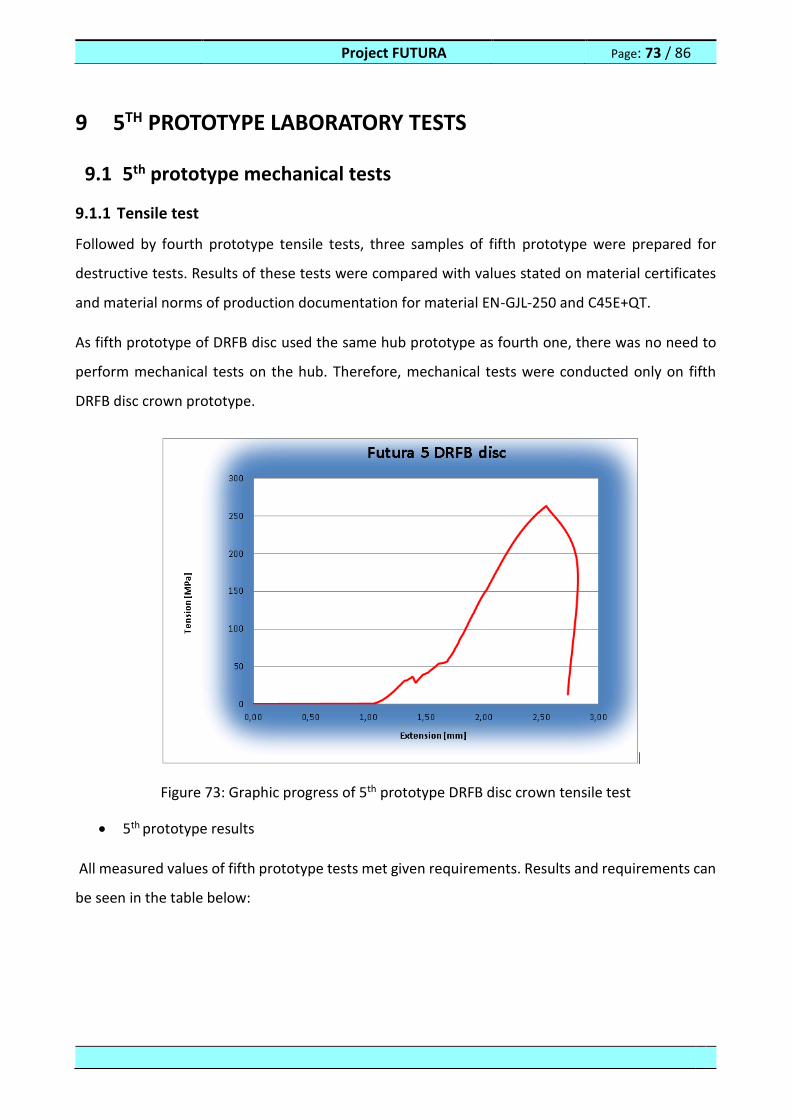
Project FUTURA Page: 73 / 86
9 5TH PROTOTYPE LABORATORY TESTS
9.1 5th prototype mechanical tests
9.1.1 Tensile test
Followed by fourth prototype tensile tests, three samples of fifth prototype were prepared for
destructive tests. Results of these tests were compared with values stated on material certificates
and material norms of production documentation for material EN-GJL-250 and C45E+QT.
As fifth prototype of DRFB disc used the same hub prototype as fourth one, there was no need to
perform mechanical tests on the hub. Therefore, mechanical tests were conducted only on fifth
DRFB disc crown prototype.
Figure 73: Graphic progress of 5th prototype DRFB disc crown tensile test
5th prototype results
All measured values of fifth prototype tests met given requirements. Results and requirements can
be seen in the table below:
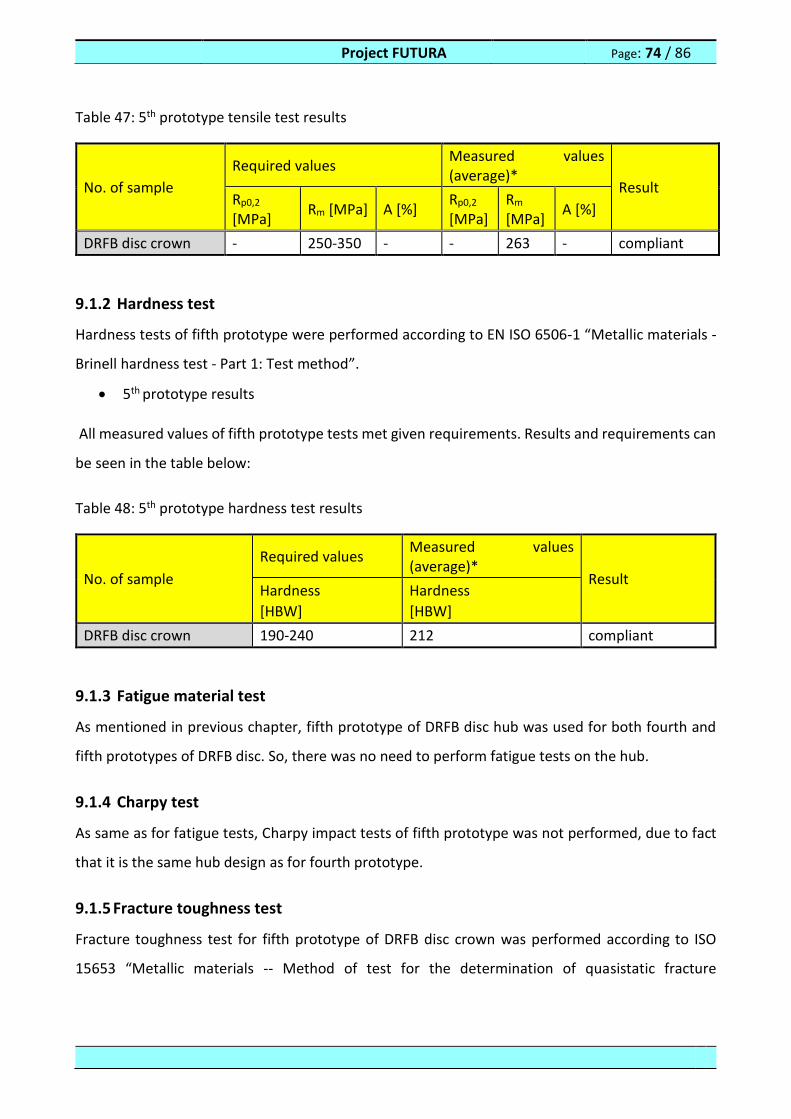
Project FUTURA Page: 74 / 86
Table 47: 5th prototype tensile test results
No. of sample
Required values Measured values (average)*
Result Rp0,2
[MPa] Rm [MPa] A [%]
Rp0,2
[MPa] Rm [MPa]
A [%]
DRFB disc crown - 250-350 - - 263 - compliant
9.1.2 Hardness test
Hardness tests of fifth prototype were performed according to EN ISO 6506-1 “Metallic materials -
Brinell hardness test - Part 1: Test method”.
5th prototype results
All measured values of fifth prototype tests met given requirements. Results and requirements can
be seen in the table below:
Table 48: 5th prototype hardness test results
No. of sample
Required values Measured values (average)*
Result Hardness
[HBW]
Hardness
[HBW]
DRFB disc crown 190-240 212 compliant
9.1.3 Fatigue material test
As mentioned in previous chapter, fifth prototype of DRFB disc hub was used for both fourth and
fifth prototypes of DRFB disc. So, there was no need to perform fatigue tests on the hub.
9.1.4 Charpy test
As same as for fatigue tests, Charpy impact tests of fifth prototype was not performed, due to fact
that it is the same hub design as for fourth prototype.
9.1.5 Fracture toughness test
Fracture toughness test for fifth prototype of DRFB disc crown was performed according to ISO
15653 “Metallic materials -- Method of test for the determination of quasistatic fracture

Project FUTURA Page: 75 / 86
toughness”. The objective of the test was to check resistance to fracture with test specimens already
containing a crack.
5th prototype results
Results of fifth prototype fracture toughness tests of DRB disc and crown can be seen in the table
below:
Figure 74: DRFB disc crown graphic fracture toughness progress
Table 49: 5th prototype crown fracture toughness test results
No. of sample
Required values according to EN 1561 – Annex A
Measured values
KIc [MPa.m1/2] KIc [MPa.m1/2]
1 17-20 20,9
2 17-20 20,85
9.2 5th prototype dynamical tests
Fifth prototype dynamical tests followed the same procedure as previous ones, and were performed
on special dynamometric test bench for DRFB disc with maximum speed of 160 km/h, in order to
check frictional, thermal, noise, and other properties of DRFB disc. The scope of tests was carefully
chosen, and these tests were absolutely needed to confirm computer numerical calculations and to
check performance of the disc.

Project FUTURA Page: 76 / 86
Figure 75: 5th prototype DRFB disc
These tests were:
Local noise measurements during braking
Local noise measurements (unbraked, while rotating the DRFB disc at certain speeds)
Temperature measurements by PT100 and PT1000 thermocouples at different positions on
DRFB disc crown and hub during single and multiple braking
Vibrations measurements (Imbalance measurements)
Coefficient of friction measurements between the DRFB disc and braking pads at different
velocities
Coefficient of friction measurements between the DRFB disc and braking pads at material
degradation (corrosion, dust, humidity, wet conditions)
Ventilation tests (power losses)
Measuring the wear and volume of material at single and multiple braking, determining the
mass (grams) and the volume of used material (cm3/MJ)
9.2.1 Local noise measurements during braking
Same as for previous prototypes, noise level measurements during braking were conducted on fifth
during the UIC test program2A2. The microphone was positioned at 1m distance from the friction
face of tested disc, and in the direction of the dynamometer axle and at the level of it.
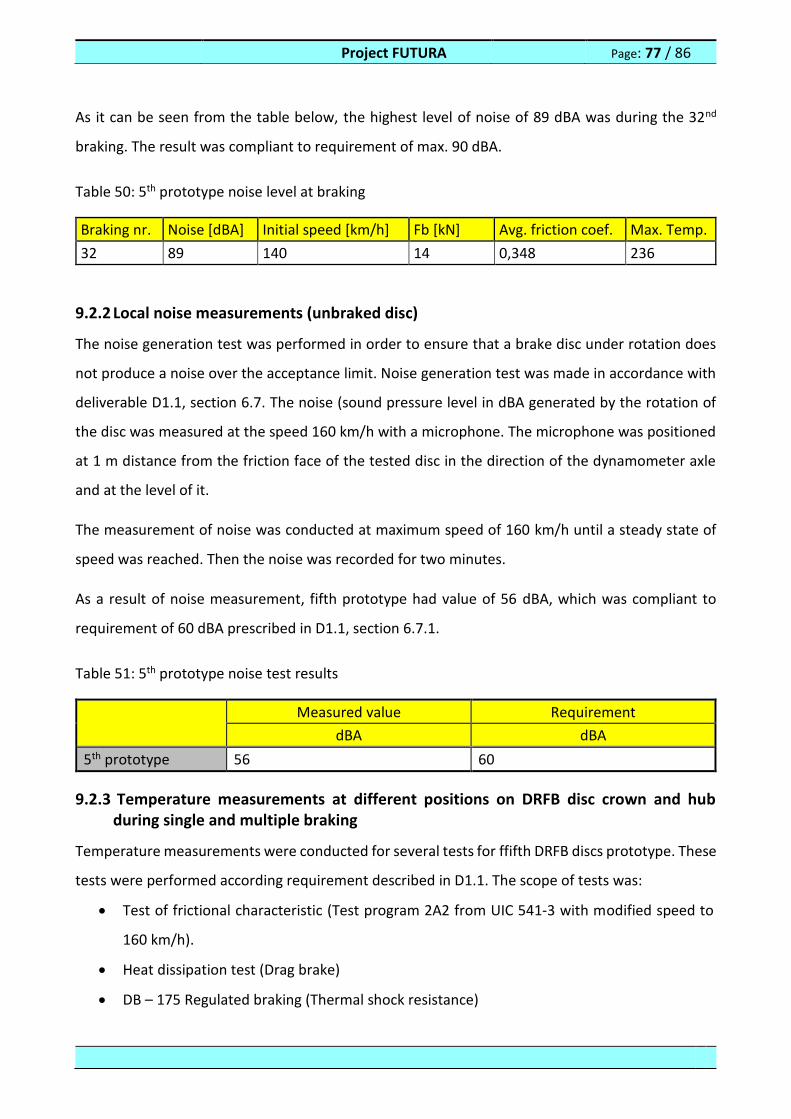
Project FUTURA Page: 77 / 86
As it can be seen from the table below, the highest level of noise of 89 dBA was during the 32nd
braking. The result was compliant to requirement of max. 90 dBA.
Table 50: 5th prototype noise level at braking
Braking nr. Noise [dBA] Initial speed [km/h] Fb [kN] Avg. friction coef. Max. Temp.
32 89 140 14 0,348 236
9.2.2 Local noise measurements (unbraked disc)
The noise generation test was performed in order to ensure that a brake disc under rotation does
not produce a noise over the acceptance limit. Noise generation test was made in accordance with
deliverable D1.1, section 6.7. The noise (sound pressure level in dBA generated by the rotation of
the disc was measured at the speed 160 km/h with a microphone. The microphone was positioned
at 1 m distance from the friction face of the tested disc in the direction of the dynamometer axle
and at the level of it.
The measurement of noise was conducted at maximum speed of 160 km/h until a steady state of
speed was reached. Then the noise was recorded for two minutes.
As a result of noise measurement, fifth prototype had value of 56 dBA, which was compliant to
requirement of 60 dBA prescribed in D1.1, section 6.7.1.
Table 51: 5th prototype noise test results
Measured value Requirement
dBA dBA
5th prototype 56 60
9.2.3 Temperature measurements at different positions on DRFB disc crown and hub during single and multiple braking
Temperature measurements were conducted for several tests for ffifth DRFB discs prototype. These
tests were performed according requirement described in D1.1. The scope of tests was:
Test of frictional characteristic (Test program 2A2 from UIC 541‐3 with modified speed to
160 km/h).
Heat dissipation test (Drag brake)
DB – 175 Regulated braking (Thermal shock resistance)
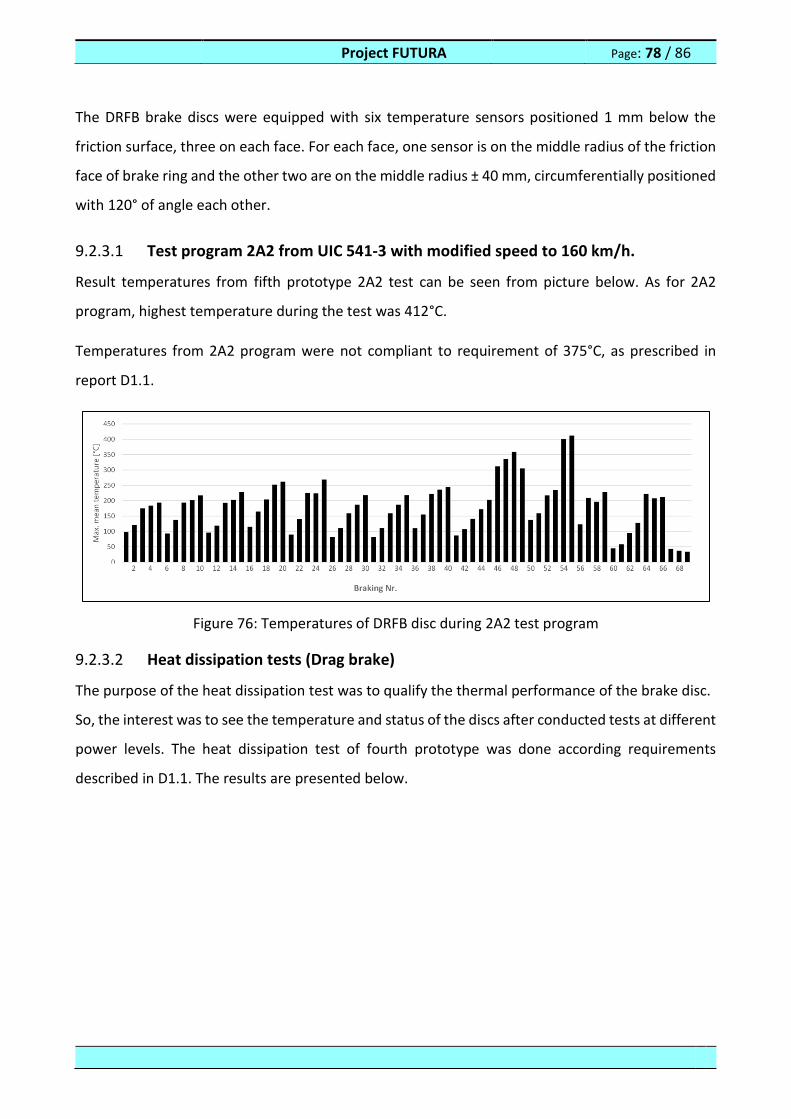
Project FUTURA Page: 78 / 86
The DRFB brake discs were equipped with six temperature sensors positioned 1 mm below the
friction surface, three on each face. For each face, one sensor is on the middle radius of the friction
face of brake ring and the other two are on the middle radius ± 40 mm, circumferentially positioned
with 120° of angle each other.
9.2.3.1 Test program 2A2 from UIC 541‐3 with modified speed to 160 km/h.
Result temperatures from fifth prototype 2A2 test can be seen from picture below. As for 2A2
program, highest temperature during the test was 412°C.
Temperatures from 2A2 program were not compliant to requirement of 375°C, as prescribed in
report D1.1.
Figure 76: Temperatures of DRFB disc during 2A2 test program
9.2.3.2 Heat dissipation tests (Drag brake)
The purpose of the heat dissipation test was to qualify the thermal performance of the brake disc.
So, the interest was to see the temperature and status of the discs after conducted tests at different
power levels. The heat dissipation test of fourth prototype was done according requirements
described in D1.1. The results are presented below.
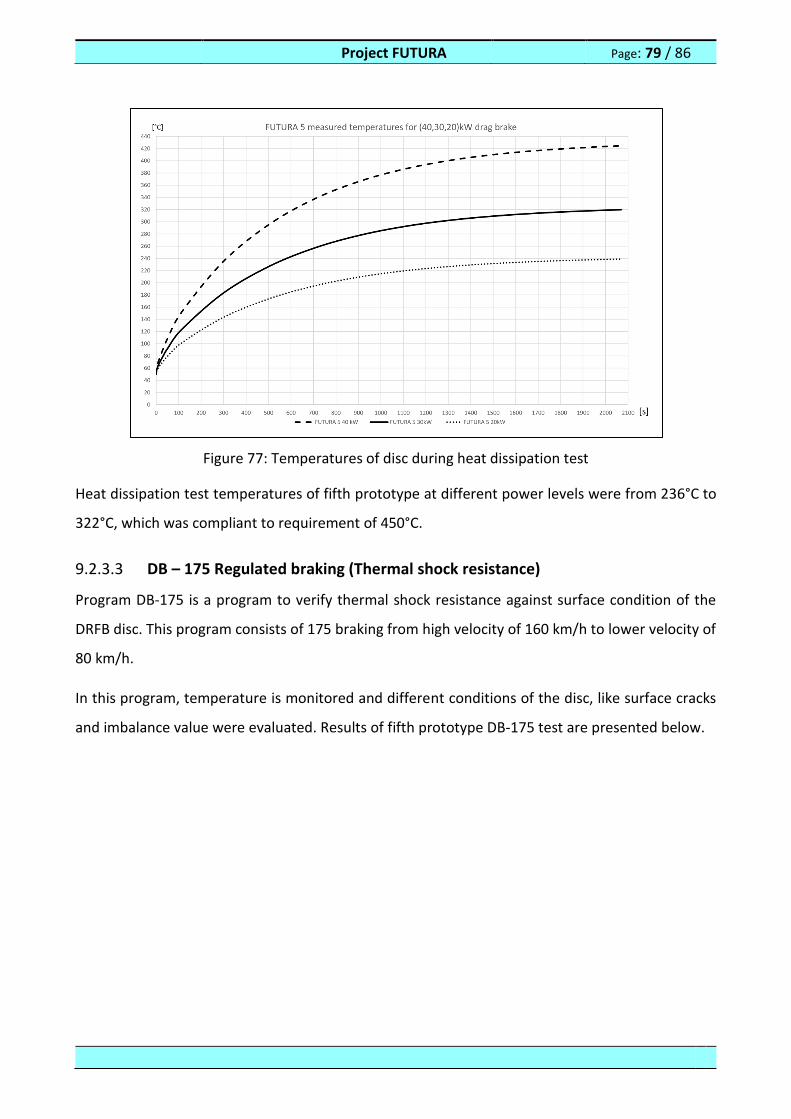
Project FUTURA Page: 79 / 86
Figure 77: Temperatures of disc during heat dissipation test
Heat dissipation test temperatures of fifth prototype at different power levels were from 236°C to
322°C, which was compliant to requirement of 450°C.
9.2.3.3 DB – 175 Regulated braking (Thermal shock resistance)
Program DB-175 is a program to verify thermal shock resistance against surface condition of the
DRFB disc. This program consists of 175 braking from high velocity of 160 km/h to lower velocity of
80 km/h.
In this program, temperature is monitored and different conditions of the disc, like surface cracks
and imbalance value were evaluated. Results of fifth prototype DB-175 test are presented below.
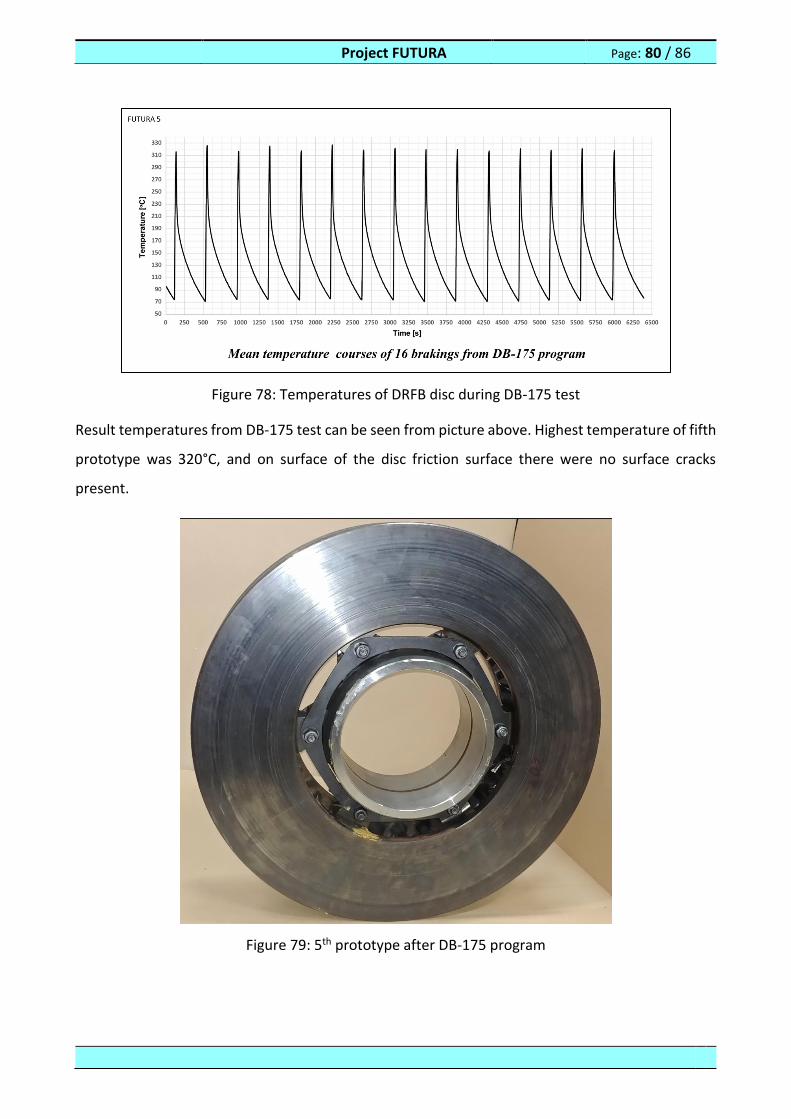
Project FUTURA Page: 80 / 86
Figure 78: Temperatures of DRFB disc during DB-175 test
Result temperatures from DB-175 test can be seen from picture above. Highest temperature of fifth
prototype was 320°C, and on surface of the disc friction surface there were no surface cracks
present.
Figure 79: 5th prototype after DB-175 program
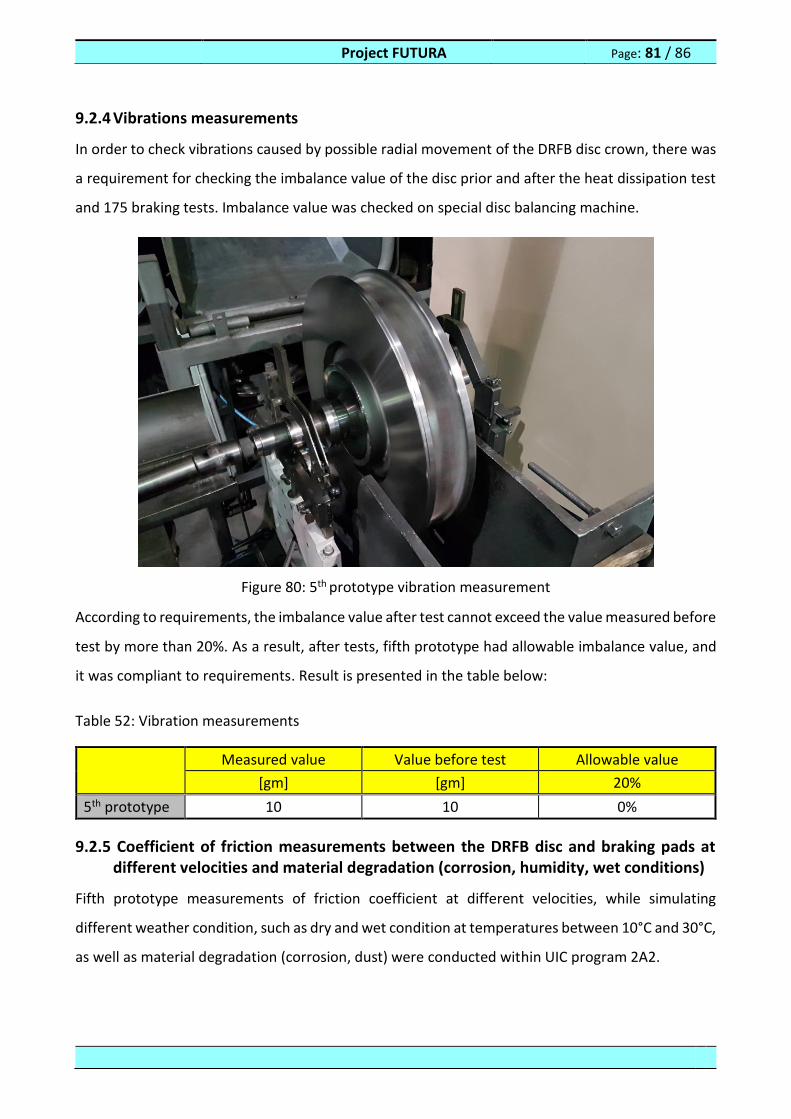
Project FUTURA Page: 81 / 86
9.2.4 Vibrations measurements
In order to check vibrations caused by possible radial movement of the DRFB disc crown, there was
a requirement for checking the imbalance value of the disc prior and after the heat dissipation test
and 175 braking tests. Imbalance value was checked on special disc balancing machine.
Figure 80: 5th prototype vibration measurement
According to requirements, the imbalance value after test cannot exceed the value measured before
test by more than 20%. As a result, after tests, fifth prototype had allowable imbalance value, and
it was compliant to requirements. Result is presented in the table below:
Table 52: Vibration measurements
Measured value Value before test Allowable value
[gm] [gm] 20%
5th prototype 10 10 0%
9.2.5 Coefficient of friction measurements between the DRFB disc and braking pads at different velocities and material degradation (corrosion, humidity, wet conditions)
Fifth prototype measurements of friction coefficient at different velocities, while simulating
different weather condition, such as dry and wet condition at temperatures between 10°C and 30°C,
as well as material degradation (corrosion, dust) were conducted within UIC program 2A2.
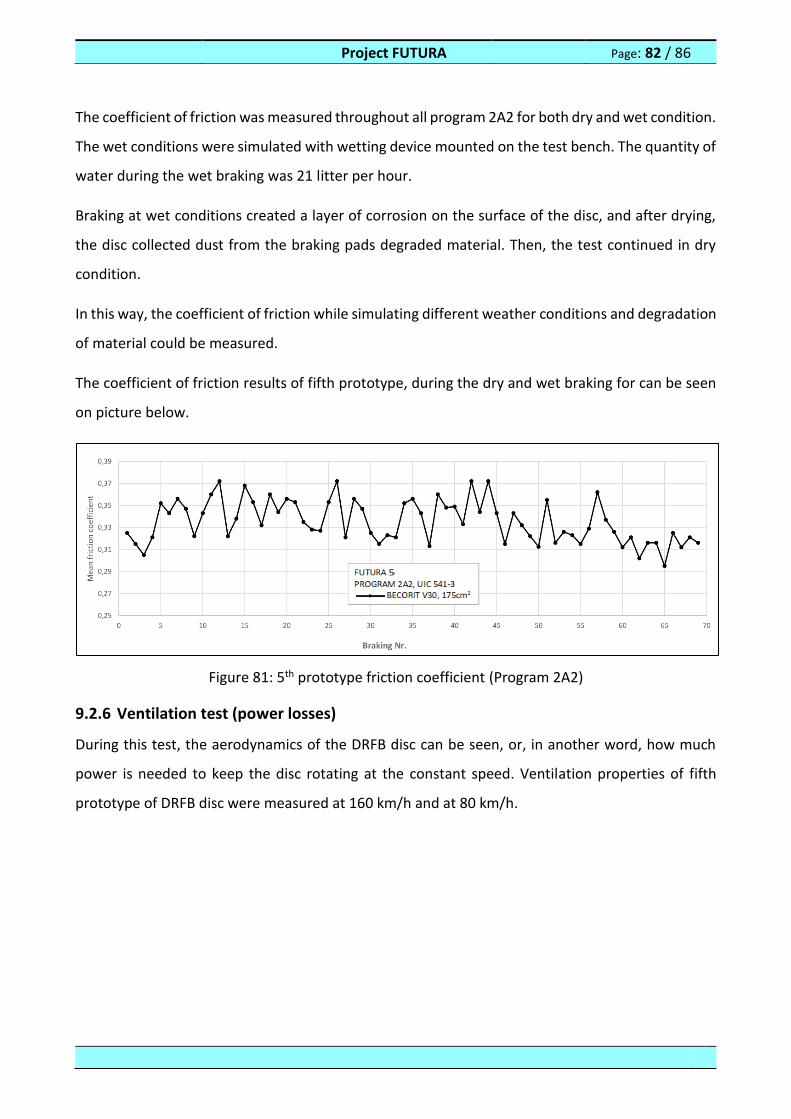
Project FUTURA Page: 82 / 86
The coefficient of friction was measured throughout all program 2A2 for both dry and wet condition.
The wet conditions were simulated with wetting device mounted on the test bench. The quantity of
water during the wet braking was 21 litter per hour.
Braking at wet conditions created a layer of corrosion on the surface of the disc, and after drying,
the disc collected dust from the braking pads degraded material. Then, the test continued in dry
condition.
In this way, the coefficient of friction while simulating different weather conditions and degradation
of material could be measured.
The coefficient of friction results of fifth prototype, during the dry and wet braking for can be seen
on picture below.
Figure 81: 5th prototype friction coefficient (Program 2A2)
9.2.6 Ventilation test (power losses)
During this test, the aerodynamics of the DRFB disc can be seen, or, in another word, how much
power is needed to keep the disc rotating at the constant speed. Ventilation properties of fifth
prototype of DRFB disc were measured at 160 km/h and at 80 km/h.
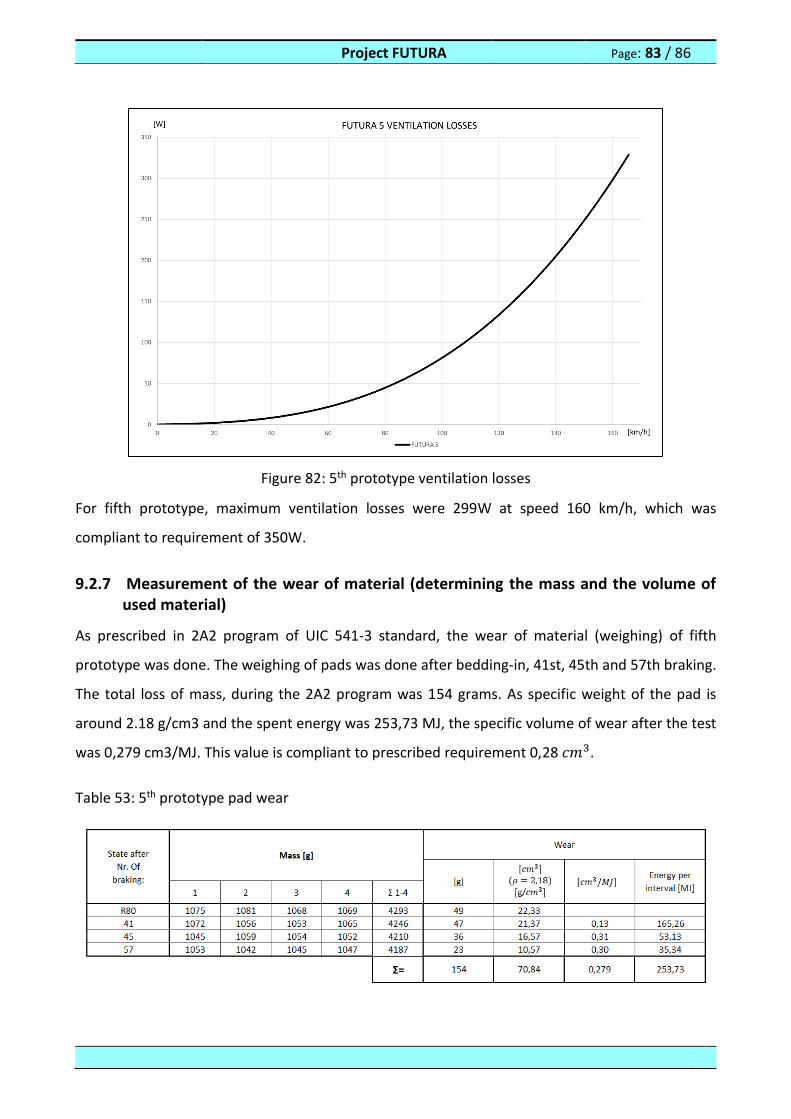
Project FUTURA Page: 83 / 86
Figure 82: 5th prototype ventilation losses
For fifth prototype, maximum ventilation losses were 299W at speed 160 km/h, which was
compliant to requirement of 350W.
9.2.7 Measurement of the wear of material (determining the mass and the volume of used material)
As prescribed in 2A2 program of UIC 541-3 standard, the wear of material (weighing) of fifth
prototype was done. The weighing of pads was done after bedding-in, 41st, 45th and 57th braking.
The total loss of mass, during the 2A2 program was 154 grams. As specific weight of the pad is
around 2.18 g/cm3 and the spent energy was 253,73 MJ, the specific volume of wear after the test
was 0,279 cm3/MJ. This value is compliant to prescribed requirement 0,28 𝑐𝑚3.
Table 53: 5th prototype pad wear
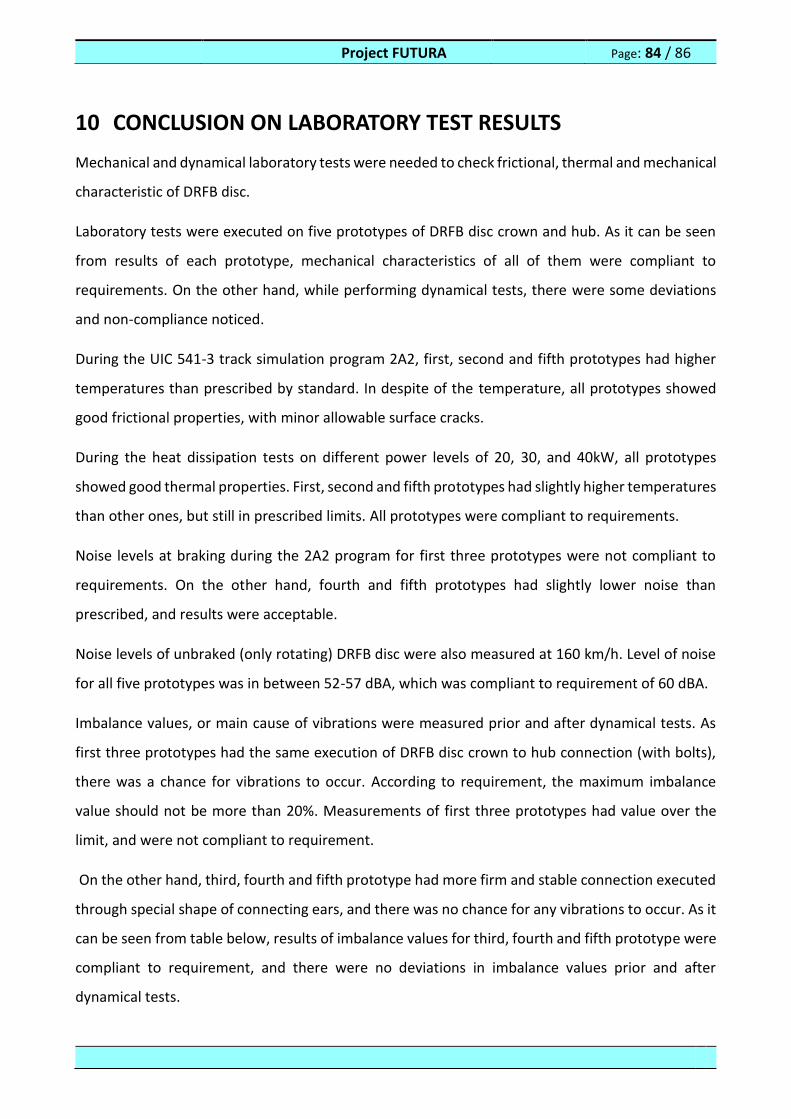
Project FUTURA Page: 84 / 86
10 CONCLUSION ON LABORATORY TEST RESULTS
Mechanical and dynamical laboratory tests were needed to check frictional, thermal and mechanical
characteristic of DRFB disc.
Laboratory tests were executed on five prototypes of DRFB disc crown and hub. As it can be seen
from results of each prototype, mechanical characteristics of all of them were compliant to
requirements. On the other hand, while performing dynamical tests, there were some deviations
and non-compliance noticed.
During the UIC 541-3 track simulation program 2A2, first, second and fifth prototypes had higher
temperatures than prescribed by standard. In despite of the temperature, all prototypes showed
good frictional properties, with minor allowable surface cracks.
During the heat dissipation tests on different power levels of 20, 30, and 40kW, all prototypes
showed good thermal properties. First, second and fifth prototypes had slightly higher temperatures
than other ones, but still in prescribed limits. All prototypes were compliant to requirements.
Noise levels at braking during the 2A2 program for first three prototypes were not compliant to
requirements. On the other hand, fourth and fifth prototypes had slightly lower noise than
prescribed, and results were acceptable.
Noise levels of unbraked (only rotating) DRFB disc were also measured at 160 km/h. Level of noise
for all five prototypes was in between 52-57 dBA, which was compliant to requirement of 60 dBA.
Imbalance values, or main cause of vibrations were measured prior and after dynamical tests. As
first three prototypes had the same execution of DRFB disc crown to hub connection (with bolts),
there was a chance for vibrations to occur. According to requirement, the maximum imbalance
value should not be more than 20%. Measurements of first three prototypes had value over the
limit, and were not compliant to requirement.
On the other hand, third, fourth and fifth prototype had more firm and stable connection executed
through special shape of connecting ears, and there was no chance for any vibrations to occur. As it
can be seen from table below, results of imbalance values for third, fourth and fifth prototype were
compliant to requirement, and there were no deviations in imbalance values prior and after
dynamical tests.
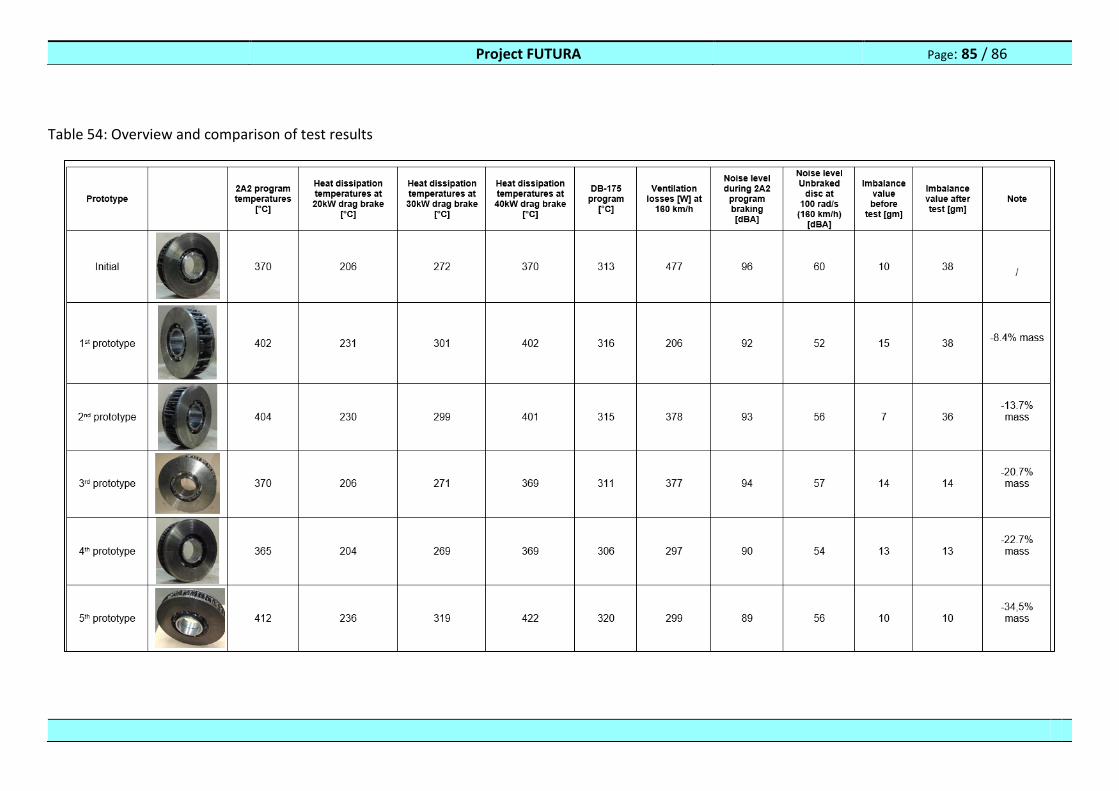
Project FUTURA Page: 85 / 86
Table 54: Overview and comparison of test results
Project FUTURA Page: 86 / 86
11 REFERENCES
[1] EN 14535-1: Railway applications – Brake discs for railway rolling stock– Part 1
[2] UIC 541-3: Brakes – Disc brakes and their application – General conditions for the approval
of brake pads
[3] TSI 2008/861/EC: Technical specification for interoperability relating to the subsystem
‘rolling stock freight wagons’ of the rail system in the European Union
[4] KOVIS d.o.o.: Internal company documents