Project 2021 - Ashtead Group · PROJECT 2021 Ashtead Group plc Investor Presentation3 Initial plan...
57
Project 2021 Ashtead Group plc Investor Presentation OCTOBER 13, 2016
Transcript of Project 2021 - Ashtead Group · PROJECT 2021 Ashtead Group plc Investor Presentation3 Initial plan...

Project 2021
Ashtead Group plc Investor Presentation
OCTOBER 13, 2016

AGENDA / SPEAKERS
Ashtead Group plc Investor Presentation 2
What’s happening with rental penetration?
Further share gains
Outlook for Greenfields and Bolt-Ons
What does it all look like by 2021?
Brendan
Horgan
CEO
20 Years
• Target markets
• Benefits of clusters
• What does it all shape up to?
John
Washburn
SVP
22 Years
Brad Lull
VP
19 Years

PROJECT 2021
Ashtead Group plc Investor Presentation 3
Initial plan set in 2011 to take advantage of structural changes in the market
Objective was to grow and diversify from both a geographic and product perspective
The plan proved very successful and Project 2021 is all about refining our plans

OUR GROWTH
Ashtead Group plc Investor Presentation 4
$1.0bn
Market Share
Fleet Size
# of Locations
Rental Revenue
April 2011 April 2016
$1.1bn
356
$2.2bn
4% Market Share
Fleet Size
# of Locations
Rental Revenue $2.9bn
546
$5.5bn
7%
EBITA EBITA $0.2bn

OUR DIVERSIFICATION
Ashtead Group plc Investor Presentation 5
2012
Growth Locations
GEOGRAPHY
22%
Non-Construction
Construction
22%
SEGMENTAL ANALYSIS
SPECIALTY
47% 53%
TOTAL BUSINESS
60% 40%
GENERAL TOOL
22%

WHERE THE GROWTH HAS COME FROM
Ashtead Group plc Investor Presentation 6
+16%
Same Store
Growth
End Market
Growth
+8%
Structural Share
Gains
+8%
+6%
Bolt-Ons &
Greenfields
+ = +22%
Total Rental Only
Revenue Growth
CAGR FY11 – FY16

OUR MARKET
Ashtead Group plc Investor Presentation 7

OUR MARKET CONSTRUCTION
Ashtead Group plc Investor Presentation 8
Construction
Airports
Highways and bridges
Office buildings
Data centers
Schools and universities
Shopping centers
Residential
Remodel

Entertainment / Special Events
OUR MARKET ENTERTAINMENT AND SPECIAL EVENTS
Ashtead Group plc Investor Presentation 9
Concerts
Sporting events
Movies/TV production
Theme parks
Festivals
Farmers market
Local 5K

Facilities and Municipalities
OUR MARKET FACILITIES AND MUNICIPALITIES
Ashtead Group plc Investor Presentation 10
Office complexes
Parks and recreation depts
Schools and universities
Shopping centers
Condo complexes
Sidewalk/Curb repairs
Golf Course maintenance
Government

Emergency Response
OUR MARKET EMERGENCY RESPONSE
Ashtead Group plc Investor Presentation 11
Fire
Hurricanes
Flooding
Tornados
Winter storms
Residential emergencies
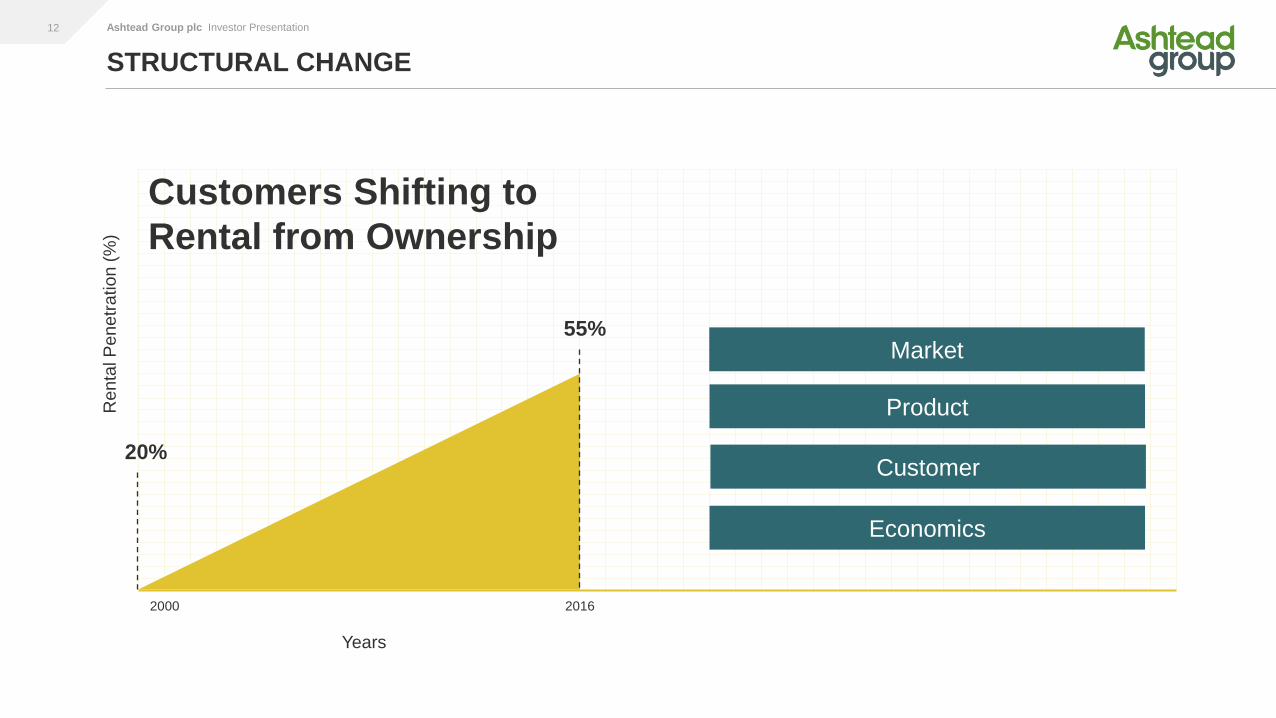
STRUCTURAL CHANGE
Ashtead Group plc Investor Presentation 12
2000 2016
Ren
tal P
en
etr
ation
(%
)
Years
Customers Shifting to
Rental from Ownership
20%
55% Market
Product
Customer
Economics

RENTAL PENETRATION THE PRODUCT RANGE
Ashtead Group plc Investor Presentation 13
HIGH LOW

RENTAL PENETRATION THE PRODUCT RANGE
Ashtead Group plc Investor Presentation 14
AERIAL WORK PLATFORM +90% MARKET PENETRATION
Drivers
Product range introduced by rental
Range of quantity and size needs
Health and safety requirements

ROUGH TERRAIN FORKLIFT +80% MARKET PENETRATION
RENTAL PENETRATION THE PRODUCT RANGE
Ashtead Group plc Investor Presentation 15
Drivers
Manufactured largely by Aerial OEMs
Health and safety requirements
• Exponential growth — universal applications

RENTAL PENETRATION THE PRODUCT RANGE
Ashtead Group plc Investor Presentation 16
GENERAL EQUIPMENT ~35% MARKET PENETRATION
Drivers
Deep history of ownership
Absence of industry reliability

RENTAL PENETRATION THE PRODUCT RANGE
Ashtead Group plc Investor Presentation 17
CONTRACTOR TOOLS
Drivers
Deep history of ownership
Absence of industry reliability
Vast range
~10% MARKET PENETRATION

RENTAL PENETRATION THE CUSTOMER – CONSTRUCTION MARKET
Ashtead Group plc Investor Presentation 18
Mid-Sized Contractor Large National Contractor Small Local Contractor

RENTAL PENETRATION THE CUSTOMER – NON-CONSTRUCTION MARKET
Ashtead Group plc Investor Presentation 19
Rental Penetration
Remediation / Restoration Events / Entertainment Facility / Municipality

UNDERSTANDING RENTAL PENETRATION ECONOMICS
Ashtead Group plc Investor Presentation 20
ACQUISITION
COSTS
TECHNOLOGY
/ REGULATORY
Inflation
Tier4
Capital Availability
Cash in hand v.
in equipment
OPERATING
EXPENSES
Facilities
Employees
Stocking Spare Parts
Repair / Maintenance
Logistics
Tier4
Legislative Requirements
OSHA
Environmental
D.O.T.

WHY FROM SUNBELT? PRODUCT RANGE
Ashtead Group plc Investor Presentation 21
Product Stats
$600k
$340k
$190k
$250
$9k $1k
$45
$38k
2 meg
Generator
400 ton
Chiller
135’
Boom
Track
Skidsteer
19’ Electric
Scissor
Rotary
Hammer
2” Submersible
Pump
Steel for
Air Hammer
Fleet size
$6 billion
Fleet range
8,500 classes

WHY FROM SUNBELT? FOOTPRINT
Ashtead Group plc Investor Presentation 22

WHY FROM SUNBELT? SERVICE & SOLUTIONS
Ashtead Group plc Investor Presentation 23
1,724 DRIVERS
10,125 EMPLOYEES
98M MILES DRIVEN
LAST YEAR 73% ORDERS
WITHIN 24 HRS
193K SERVICE CALLS
689
1,442
FIELD TECHNICIANS
TECHNICIANS
ENGINEER, DESIGN (BYPASS – SCAFFOLD -
CLIMATE CONTROL ETC.)
JUST SAY
YES! We solve customers
problems AND make it easy!
2,440 DELIVERY & SERVICE
FLEET

WHY FROM SUNBELT?
Ashtead Group plc Investor Presentation 24
=
PRODUCT (Size & Range)
SERVICE &
SOLUTIONS (People, Technology, Specialty)
FOOTPRINT (Breadth & Depth)
+
+

WHY FROM SUNBELT? INNOVATION
Ashtead Group plc Investor Presentation 25
Complete digital eco-system
CREATING AVAILABILITY, RELIABILITY AND EASE FOR THE CUSTOMER
VDOS COMMAND CENTER &
COMMAND CENTER MOBILE ACCELERATE TOOLFLEX

COMMAND CENTER
Ashtead Group plc Investor Presentation 26

ACCELERATE
Ashtead Group plc Investor Presentation 27

VEHICLE DELIVERY OPTIMIZATION SYSTEM (VDOS)
Ashtead Group plc Investor Presentation 28
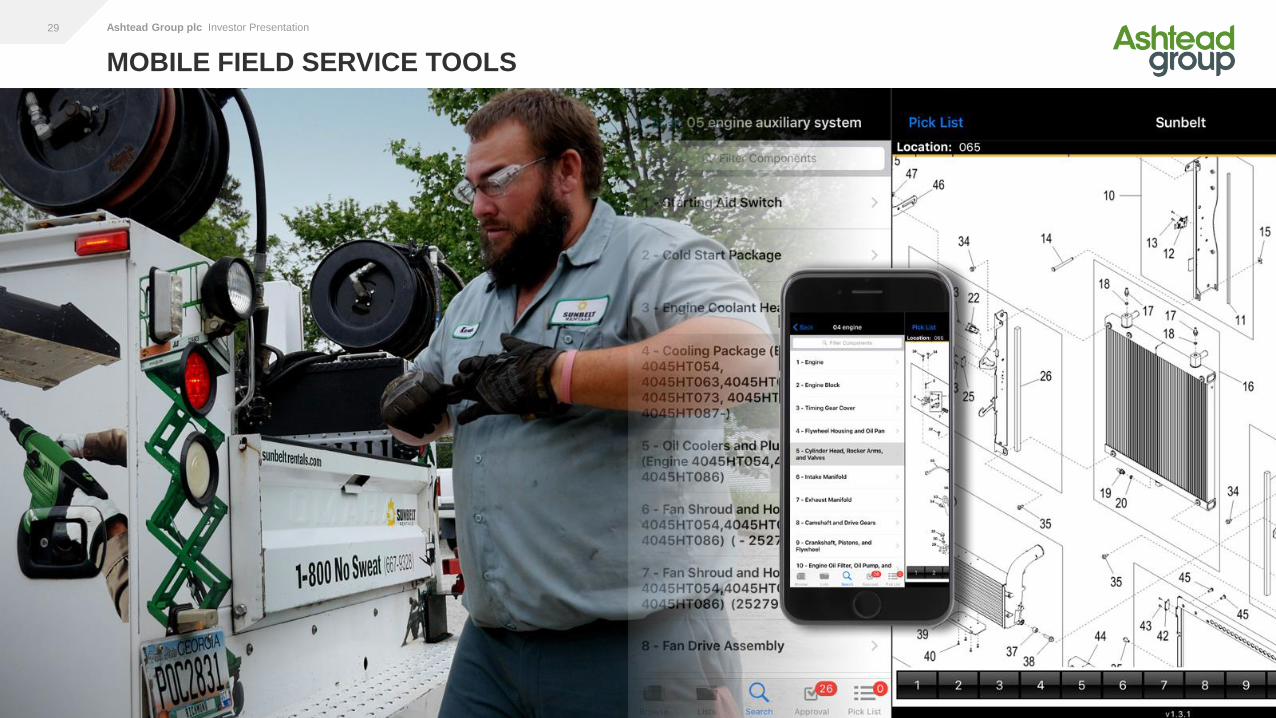
MOBILE FIELD SERVICE TOOLS
Ashtead Group plc Investor Presentation 29

WHY FROM SUNBELT? INNOVATION
Ashtead Group plc Investor Presentation 30
Innovation driving rental penetration in under-penetrated product segments

WHY FROM SUNBELT?
Ashtead Group plc Investor Presentation 31

FUTURE GROWTH STRATEGY
Ashtead Group plc Investor Presentation 32

THROUGH THE CYCLE GROWTH: FY08 – FY16
Ashtead Group plc Investor Presentation 33
FY08 FY09 FY10 FY11 FY12 FY13 FY14 FY15 FY16
Revenue
FY08 FY09 FY10 FY11 FY12 FY13 FY14 FY15 FY16
EBITA
Same Store Greenfield/Bolt-Ons Same Store Greenfield/Bolt-Ons

THE RENTAL MARKET: MACRO VIEW
Ashtead Group plc Investor Presentation 34
Rental Market
DMAs
Today's Rental
Market $bn
% Of Rental Market
2015 Sunbelt
Market Share*
Rental Market
CAGR (08-15)
Sunbelt
CAGR
(08-15)
Sunbelt Vs
Market
1 to 25 22.5 56% 6% 3.0% 10% 3.3x
26 to 50 7.5 19% 9% 2.7% 9% 3.3x
51 to 100 6.5 16% 5% 2.7% 13% 4.8x
100 to 210 3.8 9% 6% 2.1% 11% 5.2x
Top 25
Markets = 56%
Of The U.S.
Rental Market
26 To 50 Markets
Is Historically The
“Sunbelt” Of The
U.S. – 9% Share
Sunbelt Has Out
Performed The
Market In Each
Segment No Less
Than 3x
*As of December 2015

THE RENTAL MARKET: MICRO VIEW
Ashtead Group plc Investor Presentation 35

GROWTH TIMELINE – GREENFIELDS & BOLT-ONS
Ashtead Group plc Investor Presentation 36
Greenfields 138
Bolt-Ons 98
Total Additions 236
Growth locations since April 2011
General Tool 116
Specialty 120
236

WHERE WE ADDED LOCATIONS
Ashtead Group plc Investor Presentation 37
2012 2016
2012
Growth Locations
Opened locations
in new markets
Added locations in
existing markets to
build out clusters
Introduced specialty
locations to existing
clusters

2021 GROWTH LOCATIONS
Ashtead Group plc Investor Presentation 38
April 16 Planned Openings 2021
Locations 546 329 875
Targeted
location
openings
Advancement of
Clusters
Continued
progression of
Specialty business

COMPOSITION OF GROWTH LOCATIONS
Ashtead Group plc Investor Presentation 39
LOCATION TYPE
Total
329
General Tool
185
Specialty
144
Current
Clusters
92
Partial
Clusters
170
New
Markets
67
$15m plus
55
$10m - $15m
93
$5m - $10m
77
Under $5m
104
MARKET TYPE
LOCATION SIZE
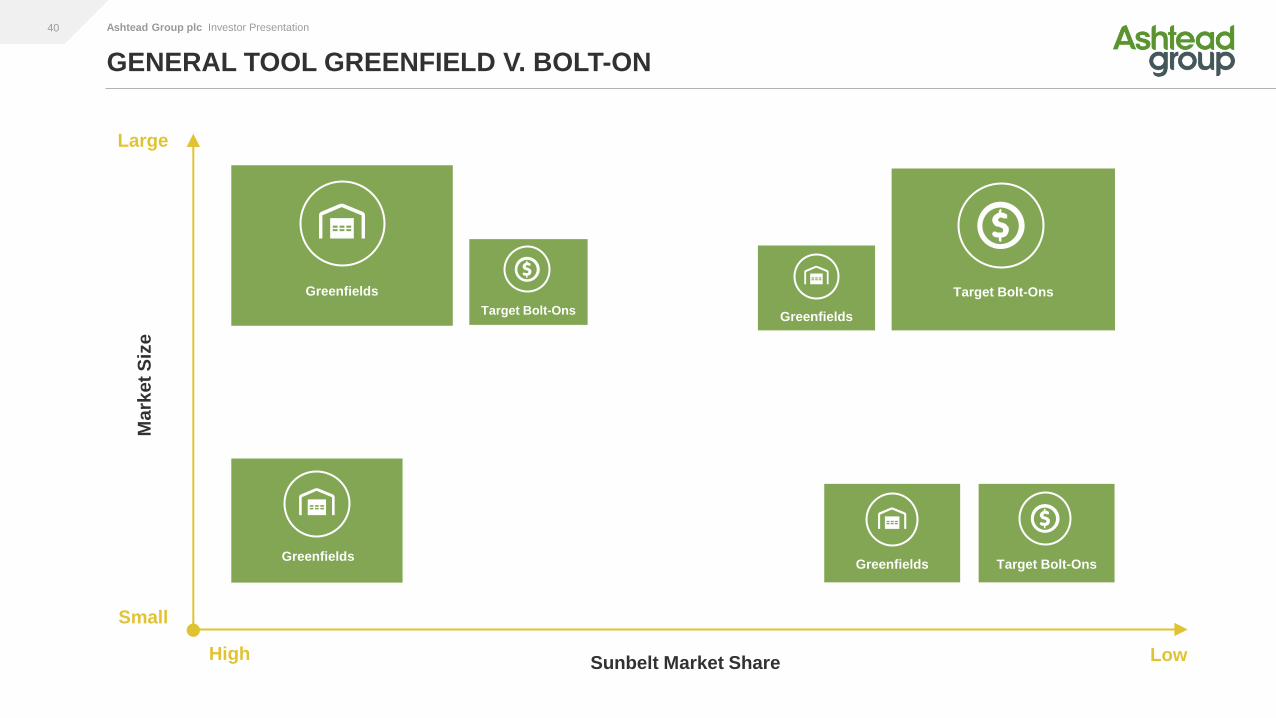
GENERAL TOOL GREENFIELD V. BOLT-ON
Ashtead Group plc Investor Presentation 40
Ma
rket
Siz
e
Small
Large
High Low Sunbelt Market Share
Target Bolt-Ons
Greenfields
Greenfields
Target Bolt-Ons
Target Bolt-Ons Greenfields
Greenfields

Scaffolding
Pump & Power
SPECIALTY GREENFIELD V. BOLT-ON
Ashtead Group plc Investor Presentation 41
Sp
ec
ialt
y M
atu
rity
Low
High
Greenfield Bolt-On
Flooring
Climate Control
Industrial

OPPORTUNITY FOR BOLT-ONS
Ashtead Group plc Investor Presentation 42

UNDERSTANDING THE CLUSTER
Ashtead Group plc Investor Presentation 43
UNDERSTANDING THE CLUSTER

General Tool
Pump & Power
Climate Control
Flooring
Industrial
Scaffold
WORKING CLUSTER
Ashtead Group plc Investor Presentation 44
Fleet Size $299 million
GT Locations 21
Specialty Locations 10
Market Share 12%
EBITA 44%
ROI 31%
Baltimore/Washington DC
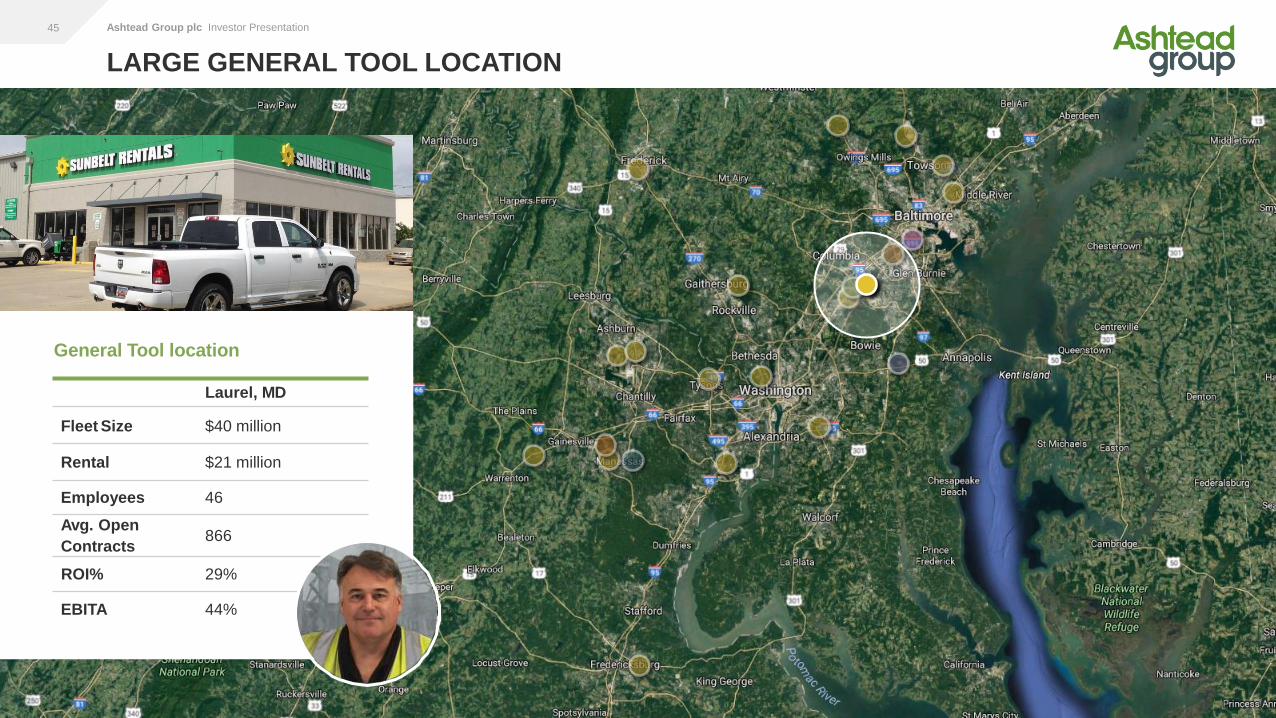
General Tool location
Laurel, MD
Fleet Size $40 million
Rental $21 million
Employees 46
Avg. Open
Contracts 866
ROI% 29%
EBITA 44%
LARGE GENERAL TOOL LOCATION
Ashtead Group plc Investor Presentation 45
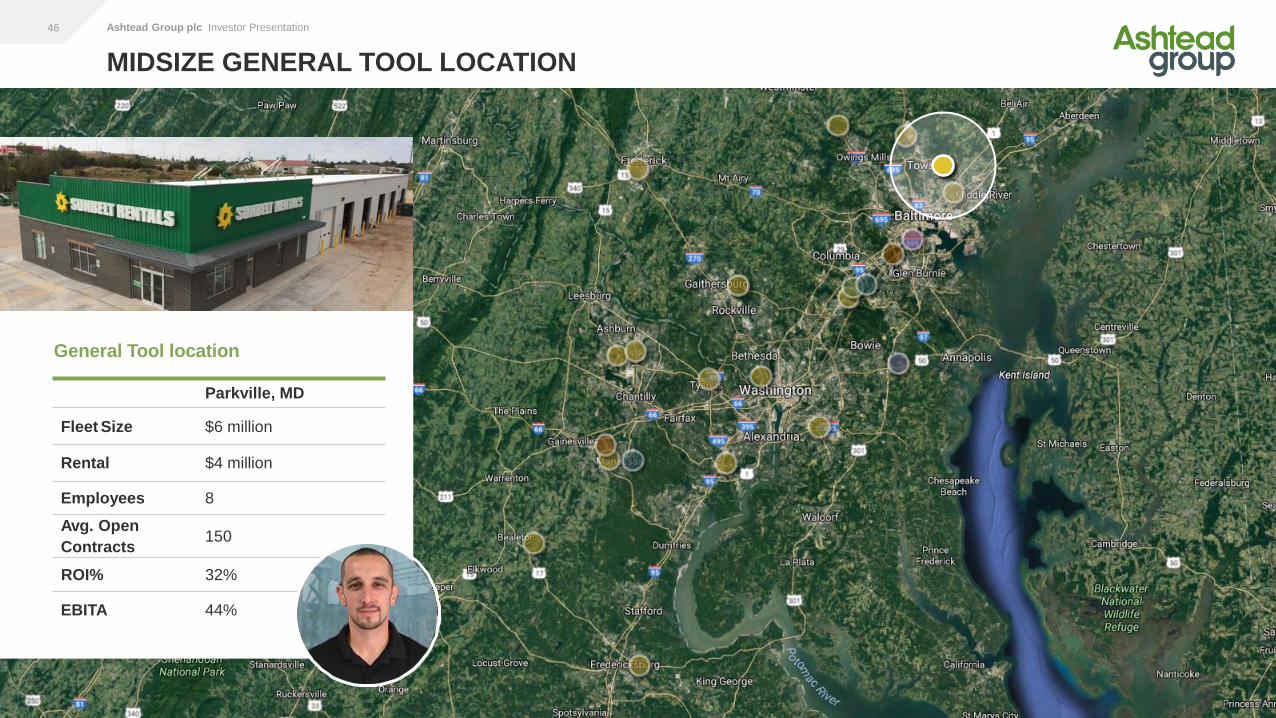
General Tool location
Parkville, MD
Fleet Size $6 million
Rental $4 million
Employees 8
Avg. Open
Contracts 150
ROI% 32%
EBITA 44%
MIDSIZE GENERAL TOOL LOCATION
Ashtead Group plc Investor Presentation 46

Rough Terrain
Forklifts
Laurel, MD Parkville, MD
Quantity 99 units 12 units
Utilization 85% 72%
Example of Rental
Major Commercial
Project
Landscape
Project
4 units 1 unit
Multi-Month Rental 2 Day Rental
DIFFERENT SIZE GENERAL TOOL LOCATIONS SATISFY MULTIPLE NEEDS
Ashtead Group plc Investor Presentation 47
Day Week Month
Suggested $419 $990 $2,695
Book $415 $990 $2,695
High $445 $1,065 $2,860
Average $420 $1,015 $2,590
Floor $400 $970 $2,390

Pump & Power location
Maryland Pump & Power
Fleet Size $16 million
Rental $10 million
Employees 23
Avg. Open
Contracts 155
ROI% 42%
EBITA 44%
PUMP & POWER LOCATION
Ashtead Group plc Investor Presentation 48

Climate Control location
DC Climate Control
Fleet Size $4 million
Rental $4 million
Employees 8
Avg. Open
Contracts 103
ROI% 69%
EBITA 49%
CLIMATE CONTROL LOCATION
Ashtead Group plc Investor Presentation 49
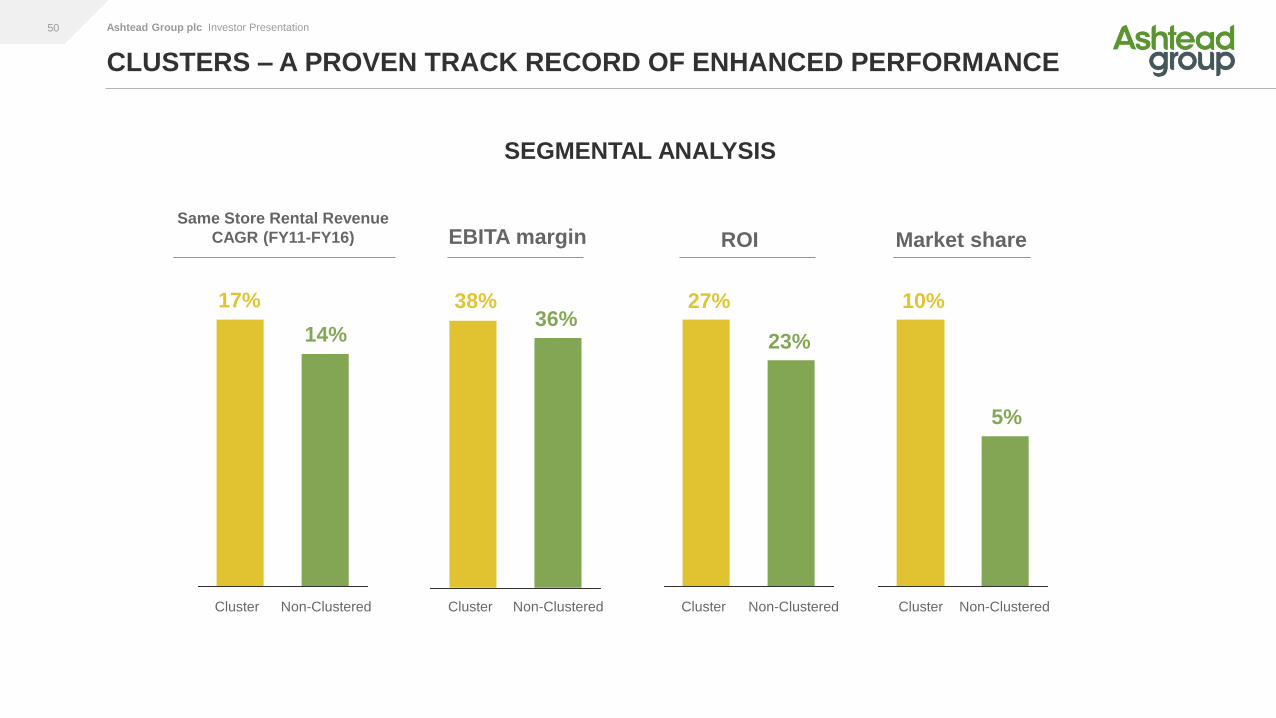
CLUSTERS – A PROVEN TRACK RECORD OF ENHANCED PERFORMANCE
Ashtead Group plc Investor Presentation 50
5%
10%
Cluster
36%
38%
Cluster
23%
27%
Cluster
14%
17%
Cluster Non-Clustered
Market share EBITA margin ROI Same Store Rental Revenue
CAGR (FY11-FY16)
17%
14%
38% 27% 10% 36%
23%
5%
SEGMENTAL ANALYSIS
Non-Clustered Non-Clustered Non-Clustered

SIGNIFICANT OPPORTUNITY TO BUILD OUT FURTHER CLUSTERS
Ashtead Group plc Investor Presentation 51
Rental Markets Top 25 26-50 51-100 100-210
Rental Market % 56% 19% 16% 9%
Cluster Definition >10 >7 >4 >1
Clustered 9 markets
132 stores
8 markets
70 stores
2 markets
13 stores
13 markets
32 stores
Non-Clustered 16 markets
103 stores
17 markets
70 stores
44 markets
66 stores
34 markets
34 stores
No Presence 0 0 4 63

2021 GROWTH PLAN
Ashtead Group plc Investor Presentation 52

2021 CULTURE
Ashtead Group plc Investor Presentation 53
There are the physical
& financial elements
Time to set what we want to be in 2021
This is what we are rolling out to our team
Entrepreneurial spirit closest to
the customer
Empowerment to do the right thing
Community engagement
But also at our core
is the culture
Customers & Markets
We Are Targeting Who We Want to Be

THE FUTURE STARTS TODAY
Ashtead Group plc Investor Presentation 54

OUR FINANCIAL ROAD MAP TO 2021
Ashtead Group plc Investor Presentation 55
Revenue $bn
2016 EBITA
Margin %* Store Vintage Locations 2016 2021 Evolution
Mature stores (up to FY11)
310 2.5 3.3 - 3.5 39 • Continue to build at circa 1.5x
market growth
• EBITA improvement through scale
and efficiency
Recent openings (FY12-FY16)
236 0.7 0.9 - 1.0 30 • Growth at rate of mature stores
as we broaden the product offering
and establish ourselves in newly
penetrated markets
• EBITA margin trends towards
mature stores
Future openings (FY17-FY21)
329 N/A 0.8 - 1.0 N/A • Similar evolution in revenue and
margins as recent openings
875 3.2 5.0 - 5.5 36
* EBITA margins exclude central cost

SUMMARY
Ashtead Group plc Investor Presentation 56
Structural change still the main driver of growth
– Increased rental penetration
–Consolidation to larger more sophisticated players
Scale and technology increasingly important
–Availability
–Reliability
–Ease
We are uniquely positioned to benefit from these changes
Detailed roadmap by location to grow to 875 locations and a $5bn+ business by 2021

Q&A SESSION
Ashtead Group plc Investor Presentation 57