An analysis of the folded waveguide: a compact waveguide ...
1
Technical Notes Volume 1, Number 31
Progressive TransitionTM (PT) Waveguides
Background:
The modern constant-directivity horn has evolvedslowly since its introduction over 25 years ago.Advances in horn design have been primaryevolutionary in nature. Indeed current popularconstant directivity horns appear strikingly similarto the first devices, which at their time, defined arevolutionary change in design philosophy.
Horn design involves balancing compromise. Keyperformance parameters that can be controlled bythe designer include: frequency response (both on-and off-axis), horizontal and vertical beamwidth,directivity index, electrical impedance, harmonicdistortion, and low frequency cut-off. The designermay also manipulate the acoustic wave-front togenerate a desirable radiation pattern thatsmoothly transitions from horizontal to vertical.
Horn designers typically optimize one, two, or threeperformance parameters considered to be of thehighest value, and then other areas of performancebecome an indirect result of the other choicesmade.
Unfortunately each parameter mentioned influ-ences sound quality, arrayability, and accuracy.This in turn impacts the successful application of ahorn in a loudspeaker system. Focus on a limitedsubset of objective parameters may not yield anoptimal performance balance for real world appli-cations.
Since the human ear doesn’t discriminate basedon a single area of technical superiority, a balanceof each area of performance is required.
2
An Introduction to ProgressiveTransition Waveguides:
PTTM Waveguide Design:
To achieve balanced response of all parameters,JBL Professional started with a clean sheet ofpaper and developed Progressive Transition (PT)Waveguides.
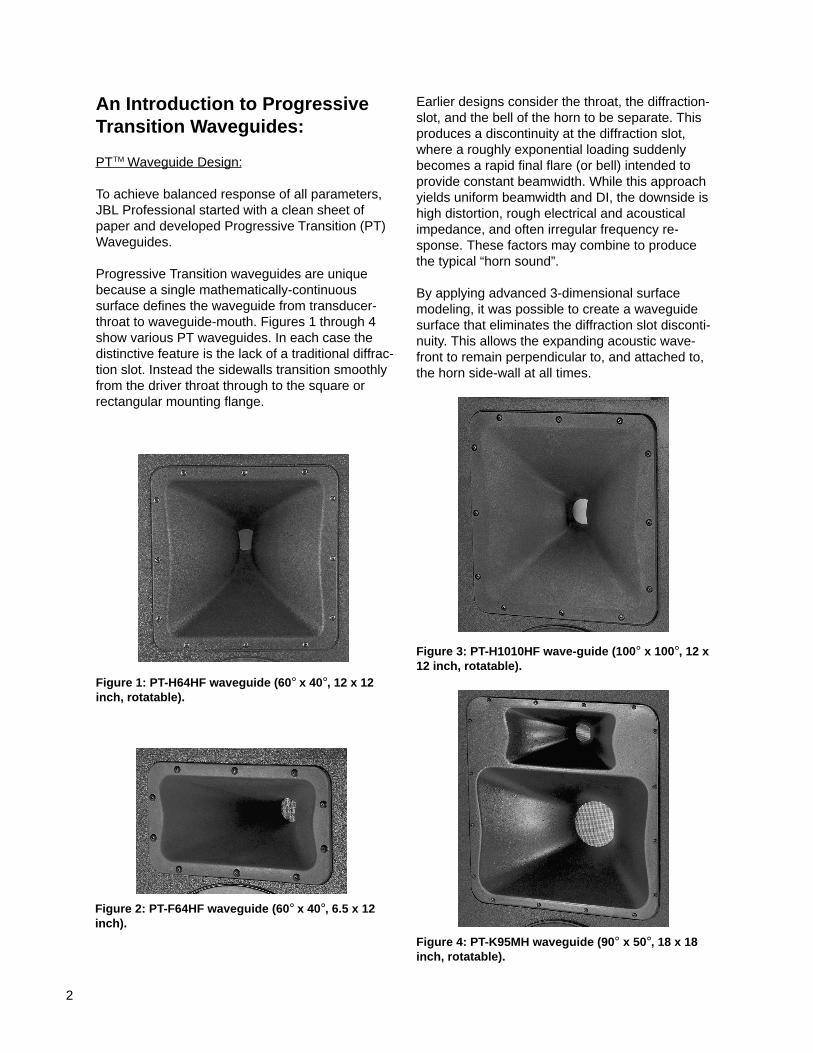
Progressive Transition waveguides are uniquebecause a single mathematically-continuoussurface defines the waveguide from transducer-throat to waveguide-mouth. Figures 1 through 4show various PT waveguides. In each case thedistinctive feature is the lack of a traditional diffrac-tion slot. Instead the sidewalls transition smoothlyfrom the driver throat through to the square orrectangular mounting flange.
Figure 3: PT-H1010HF wave-guide (100° x 100°, 12 x12 inch, rotatable).
Figure 1: PT-H64HF waveguide (60° x 40°, 12 x 12inch, rotatable).
Earlier designs consider the throat, the diffraction-slot, and the bell of the horn to be separate. Thisproduces a discontinuity at the diffraction slot,where a roughly exponential loading suddenlybecomes a rapid final flare (or bell) intended toprovide constant beamwidth. While this approachyields uniform beamwidth and DI, the downside ishigh distortion, rough electrical and acousticalimpedance, and often irregular frequency re-sponse. These factors may combine to producethe typical “horn sound”.
By applying advanced 3-dimensional surfacemodeling, it was possible to create a waveguidesurface that eliminates the diffraction slot disconti-nuity. This allows the expanding acoustic wave-front to remain perpendicular to, and attached to,the horn side-wall at all times.
Figure 2: PT-F64HF waveguide (60° x 40°, 6.5 x 12inch).
Figure 4: PT-K95MH waveguide (90° x 50°, 18 x 18inch, rotatable).
3
In a PT waveguide, the wave-front is controlled togenerate the correct shape to propagate from thewaveguide’s mouth. Even though geometricaldiffraction is eliminated in PT designs, constantbeamwidth and constant directivity are achieved.Improved frequency response, and lower distortionresult. PT waveguide design principles are patentpending.
PT Waveguide Performance Benefits:
• Smoother frequency response. With JBL’s2451SL compression driver frequency responseof ±1.0 dB is realized, with minimal equaliza-tion, on many PT waveguides.
• Electrical Impedance is smoother, and is free oftypical “high-Q” peaks that compromise passivecrossover design, and indicate difficult throatloading of the compression driver.
• Advanced constant beamwidth and directivity isachieved.
• Wide coverage angles are achieved withoutcompromise. PT waveguides may be as wide as120° x 120°, but do not have rough frequencyresponse, severe electrical and impedanceanomalies, or poor acoustic loading.
• Harmonic Distortion is minimized to allow themaximum SPL capability of the compressiondriver to be used to its full advantage without aharsh “horn sound”.
• A continuous transition from the transducer exitto the rectangular or square waveguide mouthensures uniform projection in the intendedcoverage area.
Progressive TransitionWaveguide Families:
PT waveguides are grouped into two families. Thefirst is “compact”, and second is “optimized cover-age/rotatable”.
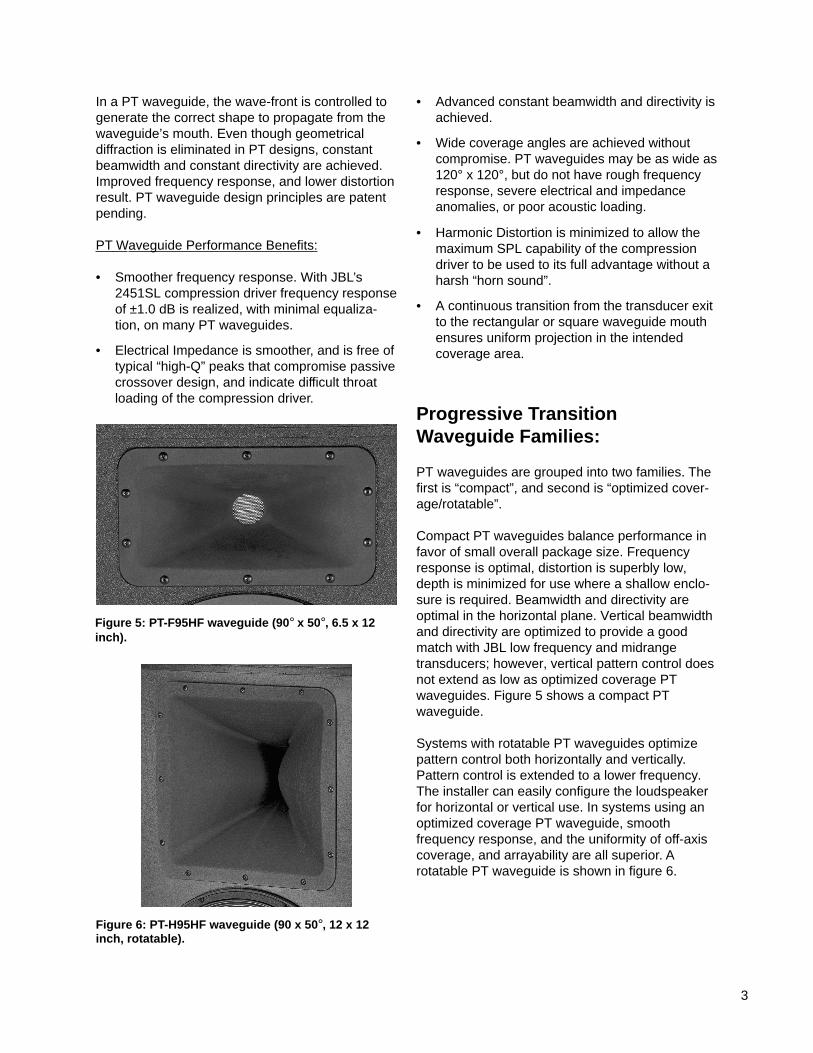
Compact PT waveguides balance performance infavor of small overall package size. Frequencyresponse is optimal, distortion is superbly low,depth is minimized for use where a shallow enclo-sure is required. Beamwidth and directivity areoptimal in the horizontal plane. Vertical beamwidthand directivity are optimized to provide a goodmatch with JBL low frequency and midrangetransducers; however, vertical pattern control doesnot extend as low as optimized coverage PTwaveguides. Figure 5 shows a compact PTwaveguide.
Systems with rotatable PT waveguides optimizepattern control both horizontally and vertically.Pattern control is extended to a lower frequency.The installer can easily configure the loudspeakerfor horizontal or vertical use. In systems using anoptimized coverage PT waveguide, smoothfrequency response, and the uniformity of off-axiscoverage, and arrayability are all superior. Arotatable PT waveguide is shown in figure 6.
Figure 5: PT-F95HF waveguide (90° x 50°, 6.5 x 12inch).
Figure 6: PT-H95HF waveguide (90 x 50°, 12 x 12inch, rotatable).
4
Compact vs. Optimized Coverage PT Waveguides:
Each PT design is appropriate for a wide variety ofapplications:
Compact PT waveguides offer these features:• Minimized enclosure size.• Optimized low distortion for maximum output.• Maximum output and superior intelligibility.
Stage monitors, distributed systems, and smallarrays are excellent applications.
Optimized Coverage PT waveguides allow for:• Rotatable systems: Horizontal or Vertical
orientation.• Extremely smooth frequency response at all
playback levels.• Predictable arrayability in engineered loud-
speaker systems.• Superior uniform coverage in difficult acoustical
environments.• Improved intelligibility.
PT Mid-High Rotatable Waveguides:
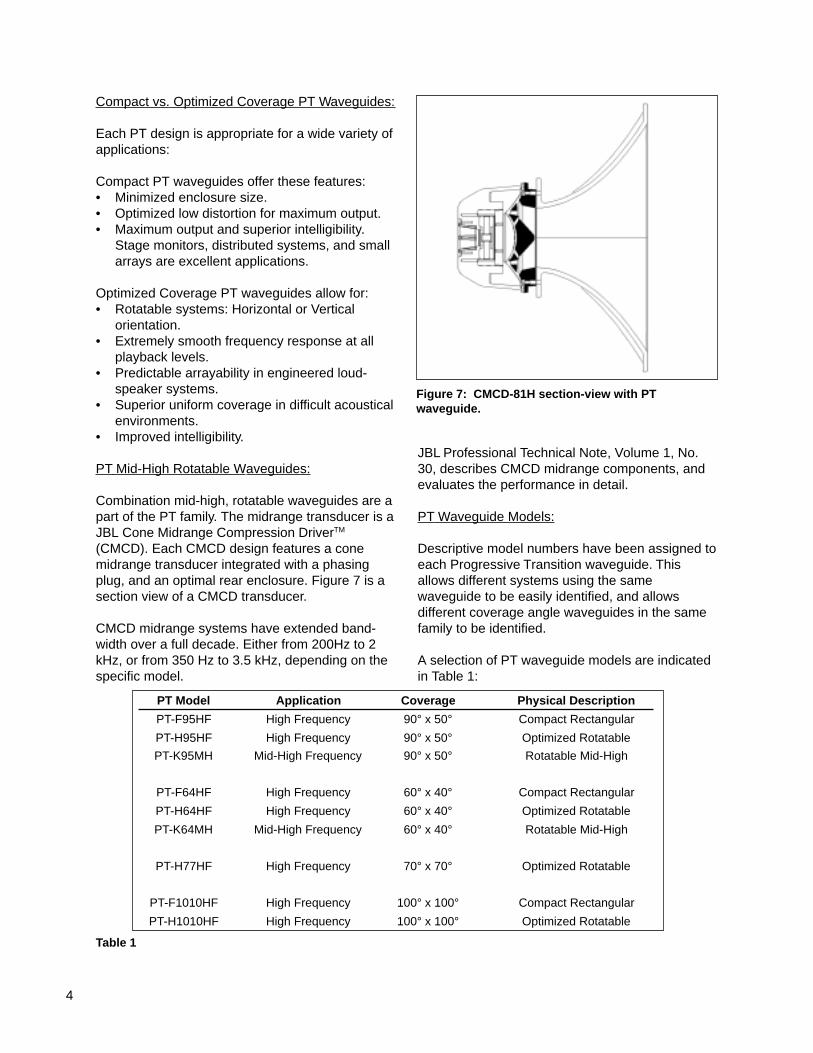
Combination mid-high, rotatable waveguides are apart of the PT family. The midrange transducer is aJBL Cone Midrange Compression DriverTM
(CMCD). Each CMCD design features a conemidrange transducer integrated with a phasingplug, and an optimal rear enclosure. Figure 7 is asection view of a CMCD transducer.
CMCD midrange systems have extended band-width over a full decade. Either from 200Hz to 2kHz, or from 350 Hz to 3.5 kHz, depending on thespecific model.
JBL Professional Technical Note, Volume 1, No.30, describes CMCD midrange components, andevaluates the performance in detail.
PT Waveguide Models:
Descriptive model numbers have been assigned toeach Progressive Transition waveguide. Thisallows different systems using the samewaveguide to be easily identified, and allowsdifferent coverage angle waveguides in the samefamily to be identified.
A selection of PT waveguide models are indicatedin Table 1:
Figure 7: CMCD-81H section-view with PTwaveguide.
Table 1
PT Model Application Coverage Physical Description
PT-F95HF High Frequency 90° x 50° Compact Rectangular
PT-H95HF High Frequency 90° x 50° Optimized Rotatable
PT-K95MH Mid-High Frequency 90° x 50° Rotatable Mid-High
PT-F64HF High Frequency 60° x 40° Compact Rectangular
PT-H64HF High Frequency 60° x 40° Optimized Rotatable
PT-K64MH Mid-High Frequency 60° x 40° Rotatable Mid-High
PT-H77HF High Frequency 70° x 70° Optimized Rotatable
PT-F1010HF High Frequency 100° x 100° Compact Rectangular
PT-H1010HF High Frequency 100° x 100° Optimized Rotatable
5
Design and Development:
In developing these waveguides, JBL combinedadvanced acoustical modeling, computer-aidedsurface modeling, in-house rapid-prototyping, andan automated acoustical measurement system.
Waveguide Contours:
Proprietary, patent-pending, mathematical modelsare used to establish the contours that eachwaveguide surface must pass through. Based onJBL’s decades of horn design experience, thesemodels allow the designer to select coverageangles, mouth size, depth, and throat diameter.The vector-splines calculated then define betweensix and ten boundaries of the PT waveguidesurface.
Computer Surface Modeling:
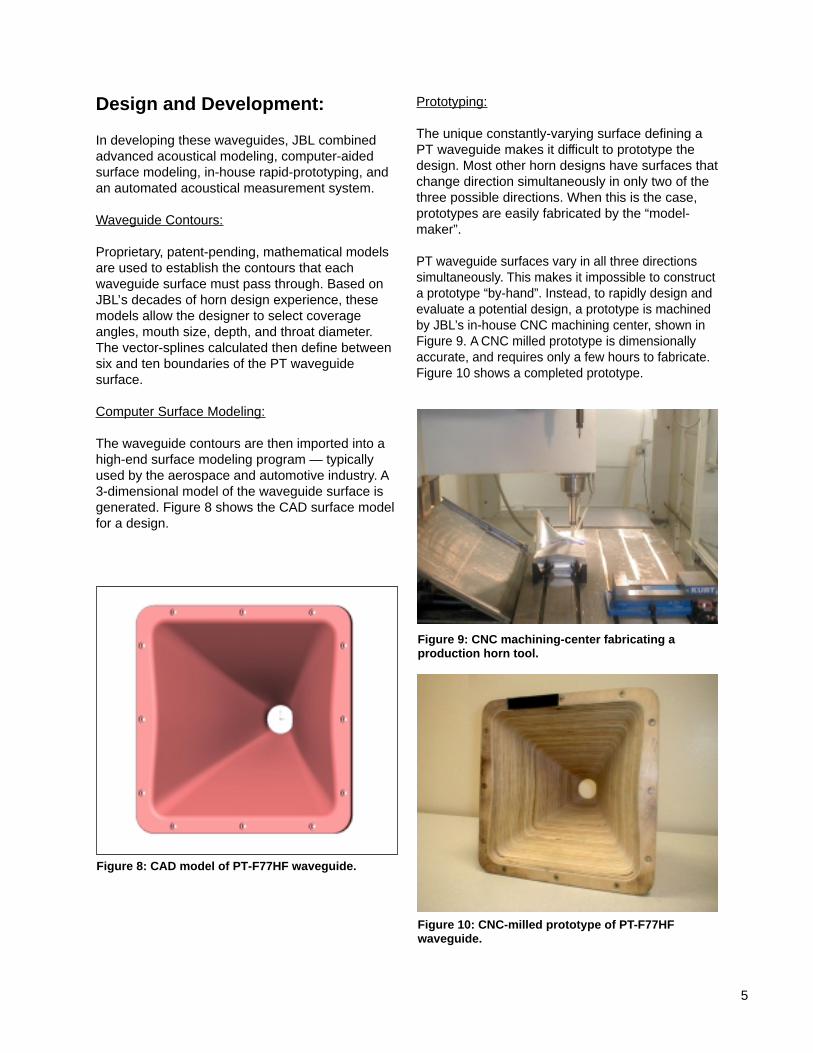
The waveguide contours are then imported into ahigh-end surface modeling program — typicallyused by the aerospace and automotive industry. A3-dimensional model of the waveguide surface isgenerated. Figure 8 shows the CAD surface modelfor a design.
Prototyping:
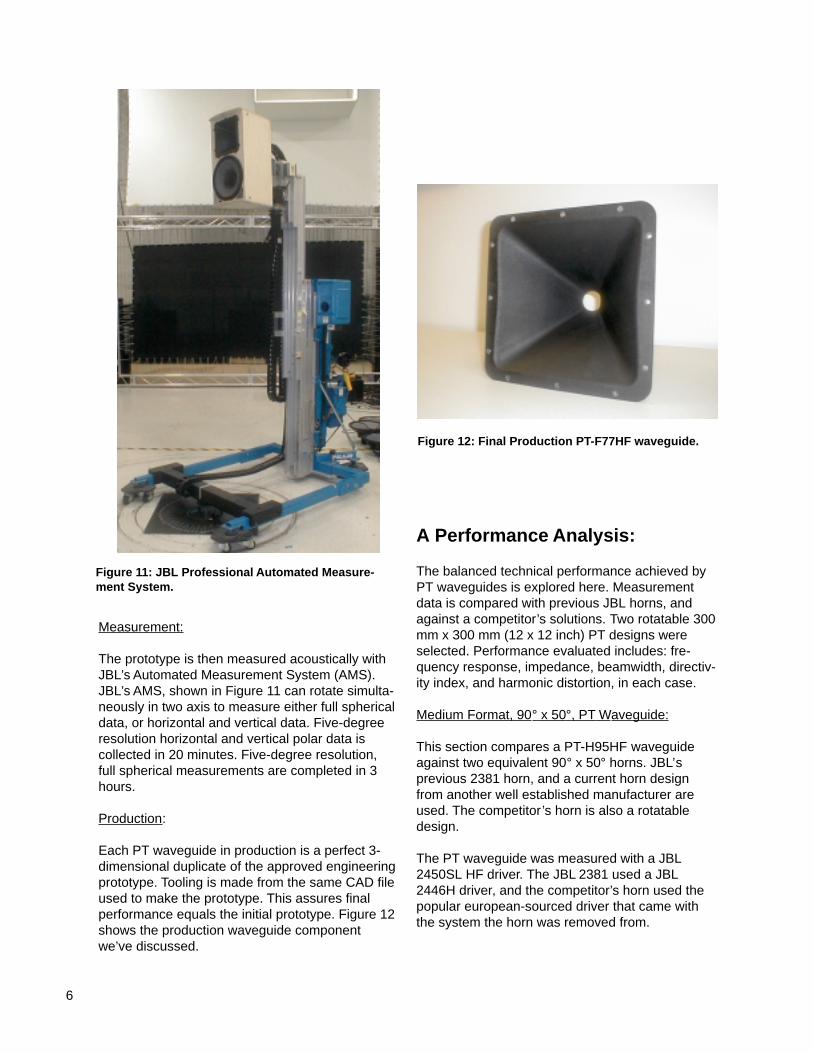
The unique constantly-varying surface defining aPT waveguide makes it difficult to prototype thedesign. Most other horn designs have surfaces thatchange direction simultaneously in only two of thethree possible directions. When this is the case,prototypes are easily fabricated by the “model-maker”.
PT waveguide surfaces vary in all three directionssimultaneously. This makes it impossible to constructa prototype “by-hand”. Instead, to rapidly design andevaluate a potential design, a prototype is machinedby JBL’s in-house CNC machining center, shown inFigure 9. A CNC milled prototype is dimensionallyaccurate, and requires only a few hours to fabricate.Figure 10 shows a completed prototype.
Figure 8: CAD model of PT-F77HF waveguide.
Figure 9: CNC machining-center fabricating aproduction horn tool.
Figure 10: CNC-milled prototype of PT-F77HFwaveguide.
6
Measurement:
The prototype is then measured acoustically withJBL’s Automated Measurement System (AMS).JBL’s AMS, shown in Figure 11 can rotate simulta-neously in two axis to measure either full sphericaldata, or horizontal and vertical data. Five-degreeresolution horizontal and vertical polar data iscollected in 20 minutes. Five-degree resolution,full spherical measurements are completed in 3hours.
Production:
Each PT waveguide in production is a perfect 3-dimensional duplicate of the approved engineeringprototype. Tooling is made from the same CAD fileused to make the prototype. This assures finalperformance equals the initial prototype. Figure 12shows the production waveguide componentwe’ve discussed.
A Performance Analysis:
The balanced technical performance achieved byPT waveguides is explored here. Measurementdata is compared with previous JBL horns, andagainst a competitor’s solutions. Two rotatable 300mm x 300 mm (12 x 12 inch) PT designs wereselected. Performance evaluated includes: fre-quency response, impedance, beamwidth, directiv-ity index, and harmonic distortion, in each case.
Medium Format, 90° x 50°, PT Waveguide:
This section compares a PT-H95HF waveguideagainst two equivalent 90° x 50° horns. JBL’sprevious 2381 horn, and a current horn designfrom another well established manufacturer areused. The competitor’s horn is also a rotatabledesign.
The PT waveguide was measured with a JBL2450SL HF driver. The JBL 2381 used a JBL2446H driver, and the competitor’s horn used thepopular european-sourced driver that came withthe system the horn was removed from.
Figure 11: JBL Professional Automated Measure-ment System.
Figure 12: Final Production PT-F77HF waveguide.
7
100 1000 10000
80
90
100
110
120
Imp
edan
ce (
oh
ms)
10
100
20 20K
dB
SP
L
Frequency (Hz)
1 Watt Sensitivity and Impedance
100 1000 10000
80
90
100
110
120
Imp
edan
ce (
oh
ms)
10
100
20 20K
dB
SP
L
Frequency (Hz)
1 Watt Sensitivity and Impedance
100 1000 10000
80
90
100
110
120
Imp
edan
ce (
oh
ms)
10
100
20 20K
dB
SP
L
Frequency (Hz)
1 Watt Sensitivity and Impedance
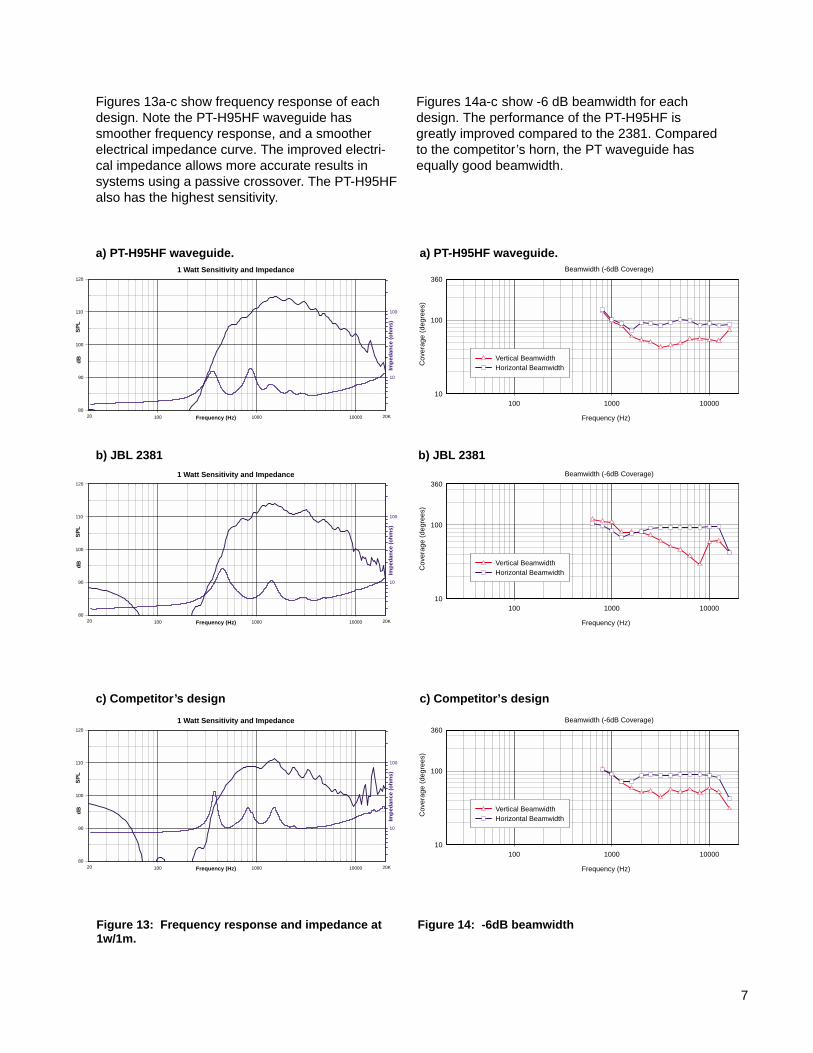
Figure 13: Frequency response and impedance at1w/1m.
Figures 13a-c show frequency response of eachdesign. Note the PT-H95HF waveguide hassmoother frequency response, and a smootherelectrical impedance curve. The improved electri-cal impedance allows more accurate results insystems using a passive crossover. The PT-H95HFalso has the highest sensitivity.
Figures 14a-c show -6 dB beamwidth for eachdesign. The performance of the PT-H95HF isgreatly improved compared to the 2381. Comparedto the competitor’s horn, the PT waveguide hasequally good beamwidth.
100 1000 1000010
100
Vertical BeamwidthHorizontal Beamwidth
Frequency (Hz)
Beamwidth (-6dB Coverage)
Cov
erag
e (d
egre
es)
360
100 1000 1000010
100
Vertical BeamwidthHorizontal Beamwidth
Frequency (Hz)
Beamwidth (-6dB Coverage)
Cov
erag
e (d
egre
es)
360
100 1000 1000010
100
Vertical BeamwidthHorizontal Beamwidth
Frequency (Hz)
Beamwidth (-6dB Coverage)
Cov
erag
e (d
egre
es)
360
Figure 14: -6dB beamwidth
a) PT-H95HF waveguide.
b) JBL 2381
c) Competitor’s design
a) PT-H95HF waveguide.
b) JBL 2381
c) Competitor’s design
8
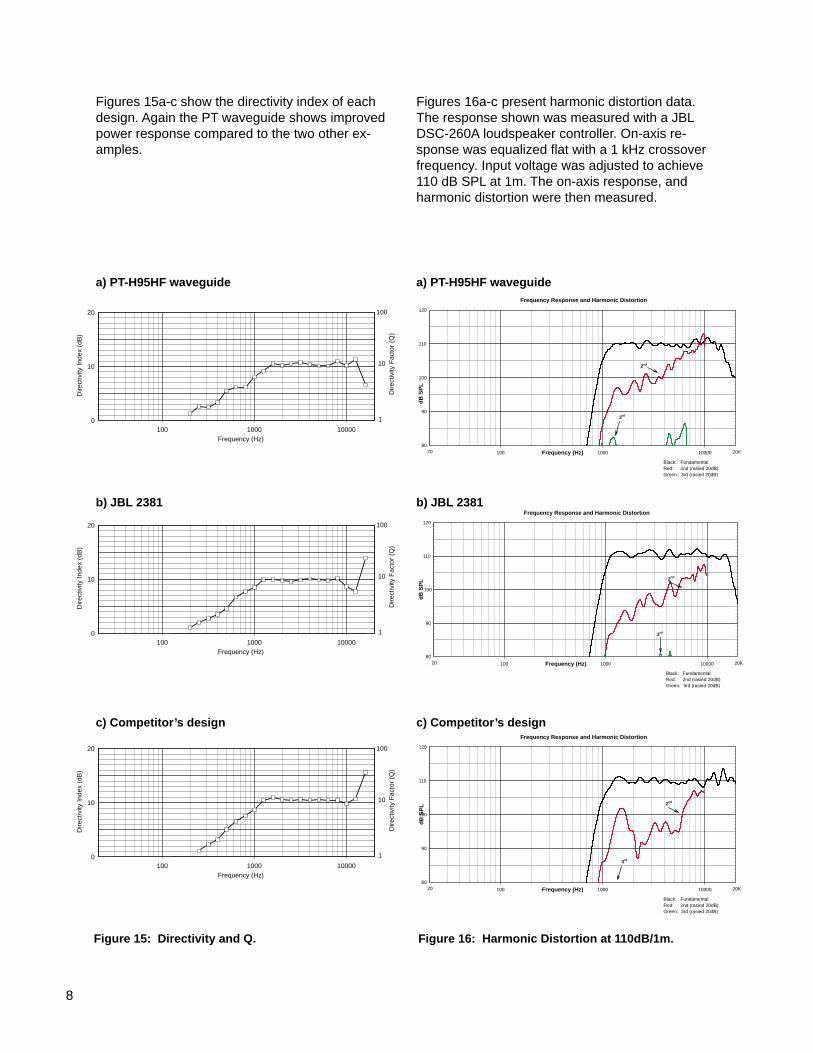
Figures 15a-c show the directivity index of eachdesign. Again the PT waveguide shows improvedpower response compared to the two other ex-amples.
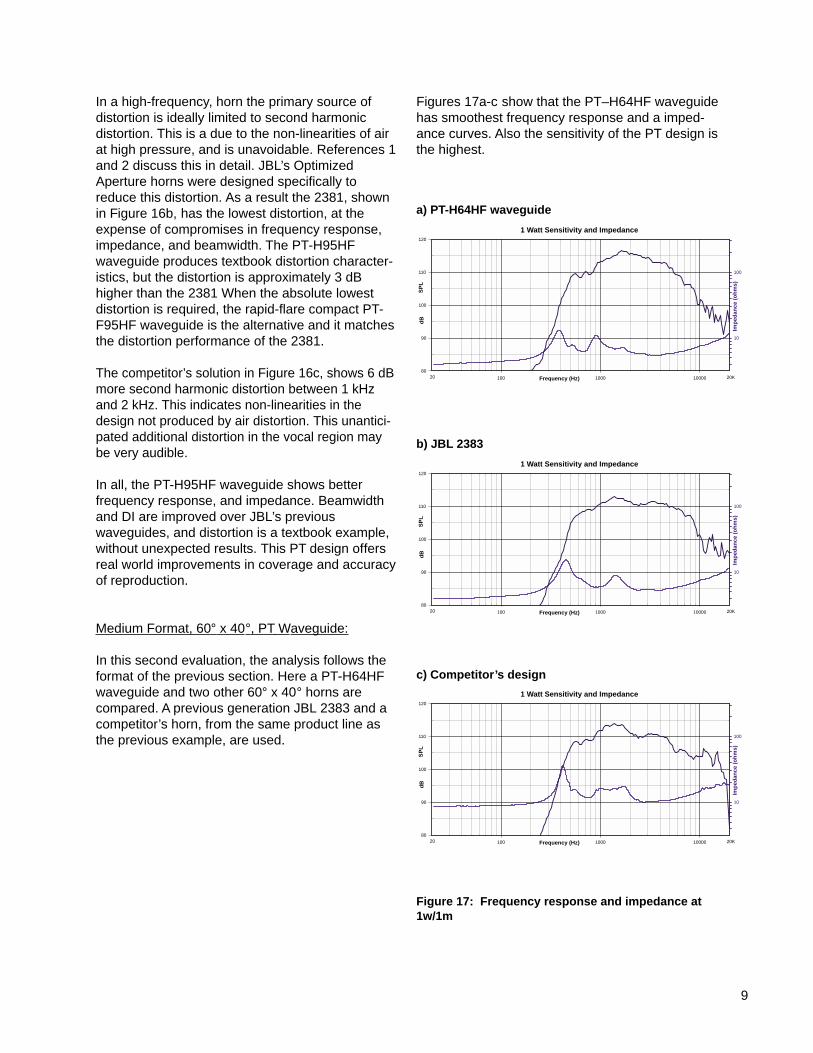
Figures 16a-c present harmonic distortion data.The response shown was measured with a JBLDSC-260A loudspeaker controller. On-axis re-sponse was equalized flat with a 1 kHz crossoverfrequency. Input voltage was adjusted to achieve110 dB SPL at 1m. The on-axis response, andharmonic distortion were then measured.
Figure 15: Directivity and Q. Figure 16: Harmonic Distortion at 110dB/1m.
100 1000 100000
10
20
Frequency (Hz)
Dire
ctiv
ity In
dex
(dB
)
Dire
ctiv
ity F
acto
r (Q
)
1
10
100
100 1000 100000
10
20
Frequency (Hz)
Dire
ctiv
ity In
dex
(dB
)
Dire
ctiv
ity F
acto
r (Q
)
1
10
100
100 1000 100000
10
20
Frequency (Hz)
Dire
ctiv
ity In
dex
(dB
)
Dire
ctiv
ity F
acto
r (Q
)
1
10
100
100 1000 10000
80
90
100
110
120
20 20K
dB
SP
L
Frequency (Hz)
Frequency Response and Harmonic Distortion
Black: FundamentalRed: 2nd (rasied 20dB)Green: 3rd (rasied 20dB)
2nd
3rd
100 1000 10000
80
90
100
110
120
20 20K
dB
SP
L
Frequency (Hz)
Frequency Response and Harmonic Distortion
Black: FundamentalRed: 2nd (rasied 20dB)Green: 3rd (rasied 20dB)
2nd
3rd
100 1000 10000
80
90
100
110
120
20 20K
dB
SP
L
Frequency (Hz)
Frequency Response and Harmonic Distortion
Black: FundamentalRed: 2nd (rasied 20dB)Green: 3rd (rasied 20dB)
2nd
3rd
a) PT-H95HF waveguide
b) JBL 2381
c) Competitor’s design
a) PT-H95HF waveguide
b) JBL 2381
c) Competitor’s design
9
In a high-frequency, horn the primary source ofdistortion is ideally limited to second harmonicdistortion. This is a due to the non-linearities of airat high pressure, and is unavoidable. References 1and 2 discuss this in detail. JBL’s OptimizedAperture horns were designed specifically toreduce this distortion. As a result the 2381, shownin Figure 16b, has the lowest distortion, at theexpense of compromises in frequency response,impedance, and beamwidth. The PT-H95HFwaveguide produces textbook distortion character-istics, but the distortion is approximately 3 dBhigher than the 2381 When the absolute lowestdistortion is required, the rapid-flare compact PT-F95HF waveguide is the alternative and it matchesthe distortion performance of the 2381.
The competitor’s solution in Figure 16c, shows 6 dBmore second harmonic distortion between 1 kHzand 2 kHz. This indicates non-linearities in thedesign not produced by air distortion. This unantici-pated additional distortion in the vocal region maybe very audible.
In all, the PT-H95HF waveguide shows betterfrequency response, and impedance. Beamwidthand DI are improved over JBL’s previouswaveguides, and distortion is a textbook example,without unexpected results. This PT design offersreal world improvements in coverage and accuracyof reproduction.
Medium Format, 60° x 40°, PT Waveguide:
In this second evaluation, the analysis follows theformat of the previous section. Here a PT-H64HFwaveguide and two other 60° x 40° horns arecompared. A previous generation JBL 2383 and acompetitor’s horn, from the same product line asthe previous example, are used.
Figures 17a-c show that the PT–H64HF waveguidehas smoothest frequency response and a imped-ance curves. Also the sensitivity of the PT design isthe highest.
Figure 17: Frequency response and impedance at1w/1m
100 1000 10000
80
90
100
110
120
Imp
edan
ce (
oh
ms)
10
100
20 20K
dB
SP
L
Frequency (Hz)
1 Watt Sensitivity and Impedance
100 1000 10000
80
90
100
110
120
Imp
edan
ce (
oh
ms)
10
100
20 20K
dB
SP
L
Frequency (Hz)
1 Watt Sensitivity and Impedance
100 1000 10000
80
90
100
110
120
Imp
edan
ce (
oh
ms)
10
100
20 20K
dB
SP
L
Frequency (Hz)
1 Watt Sensitivity and Impedance
c) Competitor’s design
b) JBL 2383
a) PT-H64HF waveguide
10
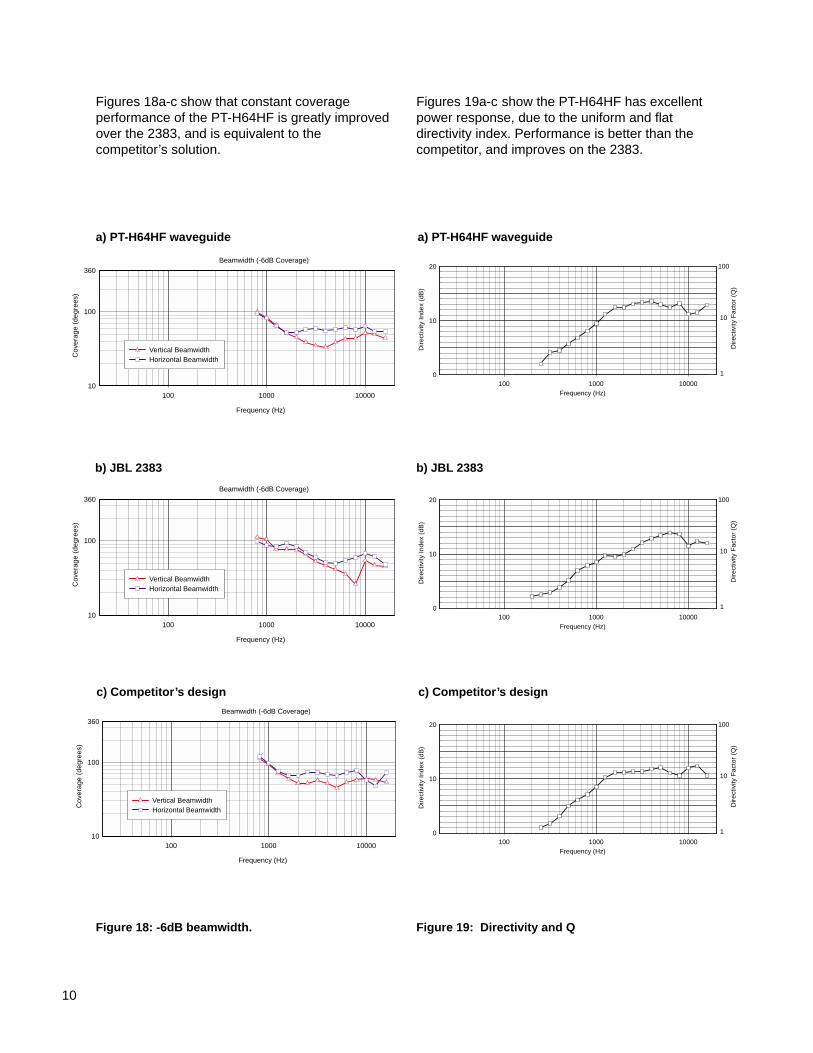
Figures 18a-c show that constant coverageperformance of the PT-H64HF is greatly improvedover the 2383, and is equivalent to thecompetitor’s solution.
Figures 19a-c show the PT-H64HF has excellentpower response, due to the uniform and flatdirectivity index. Performance is better than thecompetitor, and improves on the 2383.
100 1000 1000010
100
Vertical BeamwidthHorizontal Beamwidth
Frequency (Hz)
Beamwidth (-6dB Coverage)
Cov
erag
e (d
egre
es)
360
100 1000 100000
10
20
Frequency (Hz)
Dire
ctiv
ity In
dex
(dB
)
Dire
ctiv
ity F
acto
r (Q
)
1
10
100
100 1000 100000
10
20
Frequency (Hz)
Dire
ctiv
ity In
dex
(dB
)
Dire
ctiv
ity F
acto
r (Q
)
1
10
100
100 1000 100000
10
20
Frequency (Hz)
Dire
ctiv
ity In
dex
(dB
)
Dire
ctiv
ity F
acto
r (Q
)
1
10
100
Figure 18: -6dB beamwidth. Figure 19: Directivity and Q
100 1000 1000010
100
Vertical BeamwidthHorizontal Beamwidth
Frequency (Hz)
Beamwidth (-6dB Coverage)
Cov
erag
e (d
egre
es)
360
100 1000 1000010
100
Vertical BeamwidthHorizontal Beamwidth
Frequency (Hz)
Beamwidth (-6dB Coverage)
Cov
erag
e (d
egre
es)
360
c) Competitor’s design
b) JBL 2383
a) PT-H64HF waveguide
c) Competitor’s design
b) JBL 2383
a) PT-H64HF waveguide
11
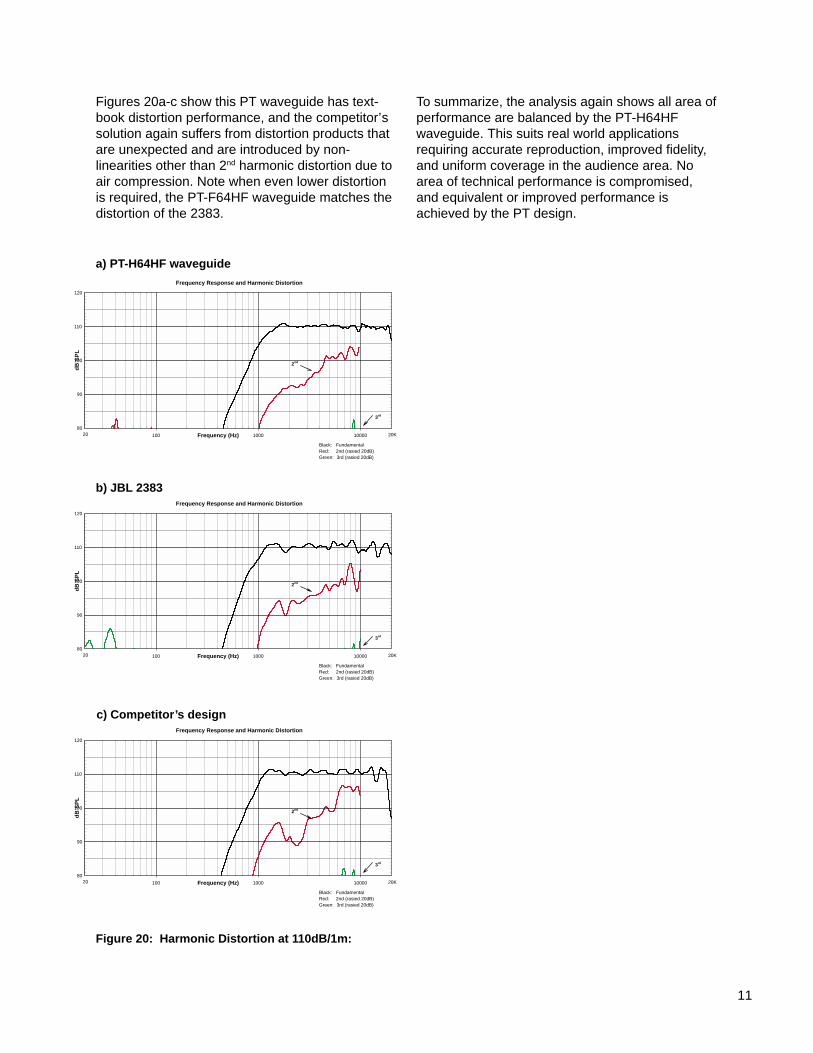
Figures 20a-c show this PT waveguide has text-book distortion performance, and the competitor’ssolution again suffers from distortion products thatare unexpected and are introduced by non-linearities other than 2nd harmonic distortion due toair compression. Note when even lower distortionis required, the PT-F64HF waveguide matches thedistortion of the 2383.
To summarize, the analysis again shows all area ofperformance are balanced by the PT-H64HFwaveguide. This suits real world applicationsrequiring accurate reproduction, improved fidelity,and uniform coverage in the audience area. Noarea of technical performance is compromised,and equivalent or improved performance isachieved by the PT design.
100 1000 10000
80
90
100
110
120
20 20K
dB
SP
L
Frequency (Hz)
Frequency Response and Harmonic Distortion
Black: FundamentalRed: 2nd (rasied 20dB)Green: 3rd (rasied 20dB)
2nd
3rd
100 1000 10000
80
90
100
110
120
20 20K
dB
SP
L
Frequency (Hz)
Frequency Response and Harmonic Distortion
Black: FundamentalRed: 2nd (rasied 20dB)Green: 3rd (rasied 20dB)
2nd
3rd
100 1000 10000
80
90
100
110
120
20 20K
dB
SP
L
Frequency (Hz)
Frequency Response and Harmonic Distortion
Black: FundamentalRed: 2nd (rasied 20dB)Green: 3rd (rasied 20dB)
2nd
3rd
Figure 20: Harmonic Distortion at 110dB/1m:
c) Competitor’s design
b) JBL 2383
a) PT-H64HF waveguide
12
JBL Professional8500 Balboa BoulevardNorthrdge, California 91329 U. S. A.
TN Vol 1 No 314/02
© 2002 JBL Professional. All rights reserved.
Conclusion:
JBL’s Progressive Transition waveguides were developed to achieve improved real world performance.By balancing technical performance in the areas of frequency response, pattern control, and distortion,improved sound reproduction results.
Compared to JBL’s previous generation of horns, the PT series offers dramatically improved constant-coverage response, and improved frequency response, while keeping distortion low.
PT waveguides fall into three basic families: compact; optimized/rotatable; and mid-high rotatable.Compact PT waveguides offer extremely low distortion, and smooth frequency response in smaller sizes.Optimized and rotatable PT designs achieve low distortion, uniform coverage in the audience area, andideal frequency response. Integrated Mid-High PT waveguides are rotatable, and provide matcheddispersion and pattern control through the mid/high crossover region. Midrange PT designs utilize JBLCMCD Cone Midrange Compression Drivers for clear and uniform midrange response.
PT waveguides are integrated into the Application EngineeredTM (AE) series of fixed installation loud-speakers, and are available in JBL Professional Custom Shop loudspeakers to meet unique acousticalchallenges. Please visit www.jblpro.com for up-to-date information, or contact JBL Professional for furtherdetails.
References:
1. A. Thuras, et al., Extraneous Frequencies Generated in Air Carrying Intense Sound Waves, J. Acoustical Societyof America, Vol. 6, No. 3 (January 1935)
2. J. Eargle and W. Gelow, Performance of Horn Systems: Low-Frequency Cut-off, Pattern Control, and DistortionTrade-offs, Preprint 4330, Presented at 101st AES Convention, November 1996.