Progress Out of Poverty Index™. Progress Out of Poverty Index™ Overview What is the PPI? An...
26
Progress Out of Poverty Index™
-
Upload
beatrix-butler -
Category
Documents
-
view
243 -
download
1
Transcript of Progress Out of Poverty Index™. Progress Out of Poverty Index™ Overview What is the PPI? An...
Progress Out of Poverty Index™
Progress Out of Poverty Index™ Overview
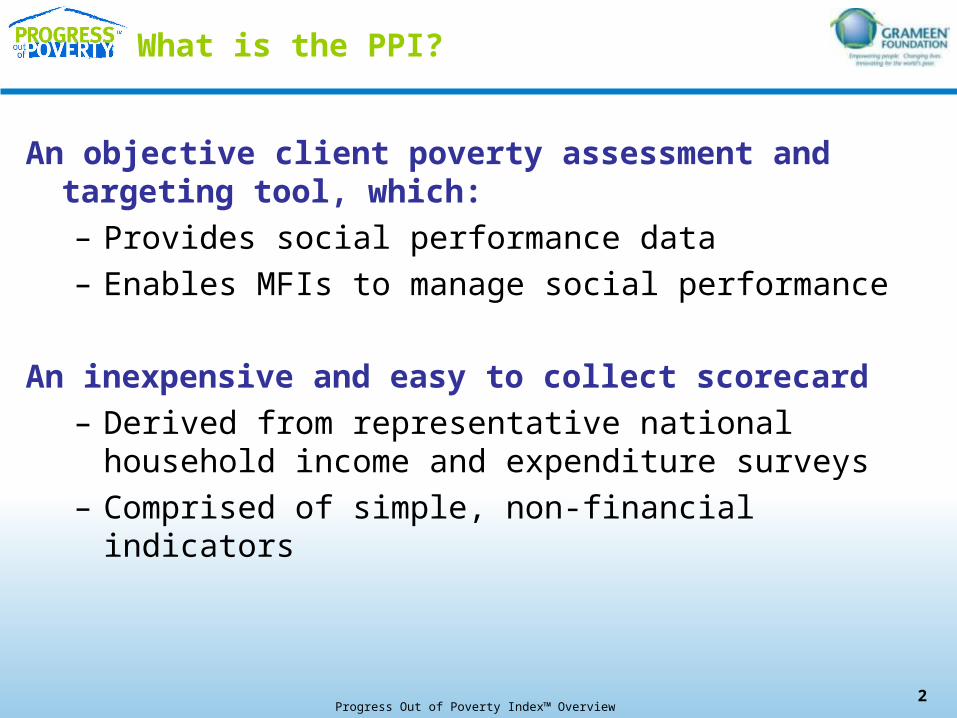
What is the PPI?
An objective client poverty assessment and targeting tool, which:– Provides social performance data – Enables MFIs to manage social performance
An inexpensive and easy to collect scorecard– Derived from representative national household
income and expenditure surveys – Comprised of simple, non-financial indicators
2
Progress Out of Poverty Index™ Overview
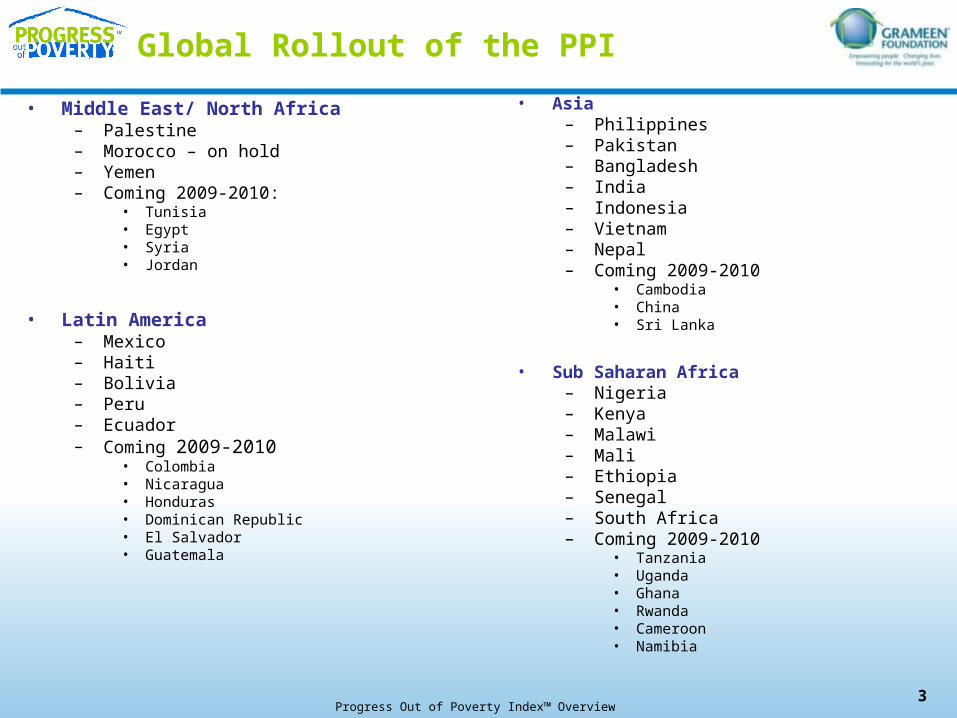
Global Rollout of the PPI
• Middle East/ North Africa – Palestine– Morocco – on hold– Yemen– Coming 2009-2010:
• Tunisia• Egypt• Syria• Jordan
• Latin America – Mexico– Haiti– Bolivia– Peru– Ecuador– Coming 2009-2010
• Colombia• Nicaragua• Honduras • Dominican Republic• El Salvador • Guatemala
3
• Asia– Philippines– Pakistan – Bangladesh– India– Indonesia– Vietnam– Nepal– Coming 2009-2010
• Cambodia• China• Sri Lanka
• Sub Saharan Africa– Nigeria– Kenya– Malawi– Mali– Ethiopia– Senegal– South Africa – Coming 2009-2010
• Tanzania• Uganda• Ghana• Rwanda • Cameroon • Namibia
Progress Out of Poverty Index™ Overview
The PPI in Context
Progress Out of Poverty Index™ Overview
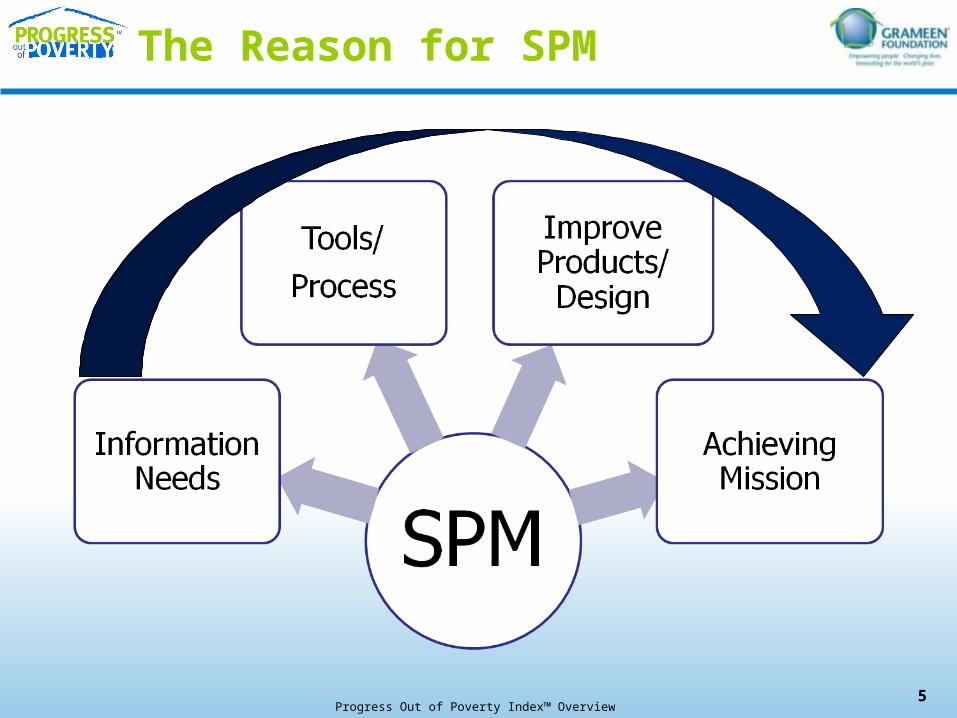
The Reason for SPM
5
Progress Out of Poverty Index™ Overview
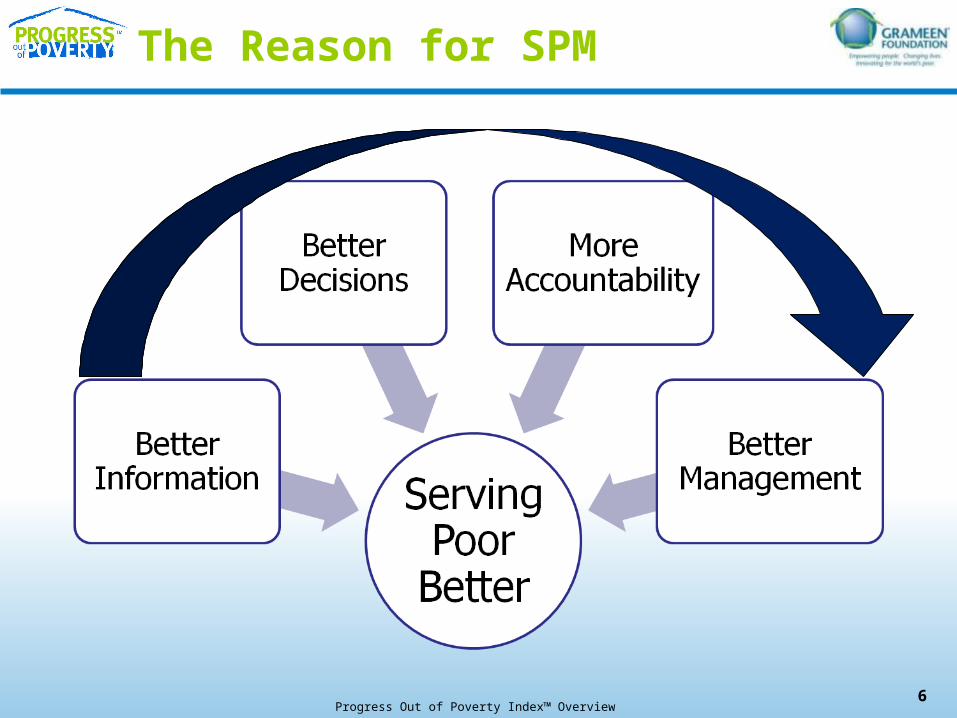
The Reason for SPM
6
Progress Out of Poverty Index™ Overview 7
Objectives of PPI Use
• Understand poverty levels of clients… • …And change in those levels• Measure outreach• Use poverty level data to improve products and
services
“…to measure the achievement of the social goals as in the mission statement and to design and deliver better products and services to our clients.”
Progress Out of Poverty Index™ Overview
What can the PPI do for MFI management?
• Inform management decisions about processes, programs, products, and provision of services
• Target clients for specific products and services
• Help in responding to competitive pressures, by understanding the balance of financial and social returns
• Market to investors with a social bottom line
8
Progress Out of Poverty Index™ Overview
What can the PPI do for the Industry?
• Allow investors to better target investments
• Better, more transparent segmentation of the microfinance market
• Reliably demonstrate poverty outreach
• Provide timely and accurate social performance information to regulatory bodies, social investors, donors, and rating agencies
9
Progress Out of Poverty Index™ Overview
What is the PPI?
Progress Out of Poverty Index™ Overview
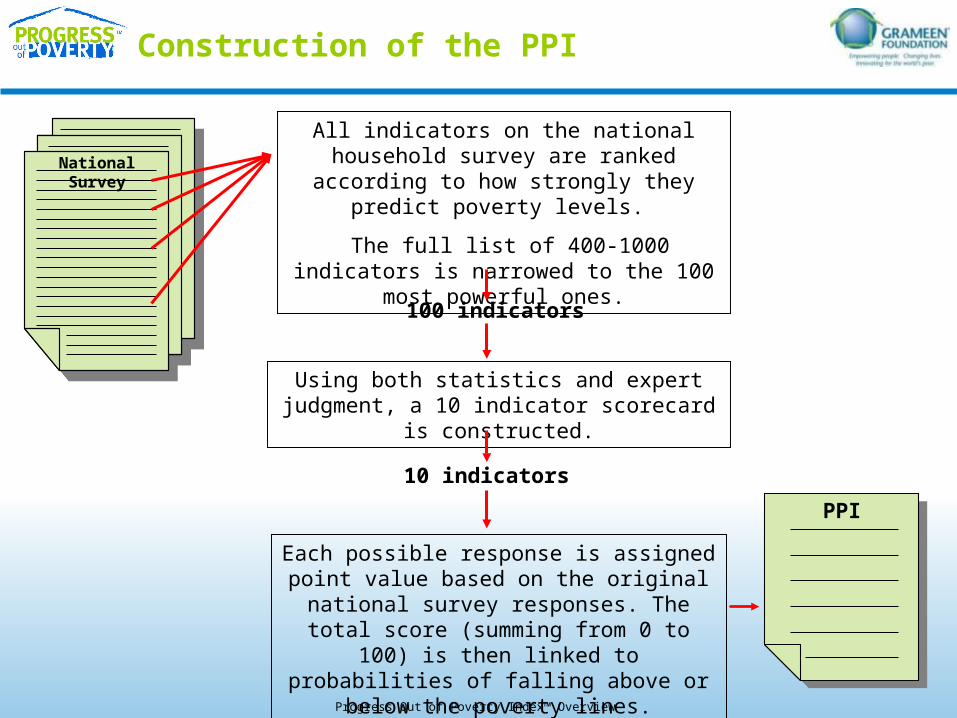
Construction of the PPI
PPI
National Survey
All indicators on the national household survey are ranked according to how strongly
they predict poverty levels.
The full list of 400-1000 indicators is narrowed to the 100 most powerful ones.
100 indicators
Using both statistics and expert judgment, a 10 indicator scorecard is constructed.
10 indicators
Each possible response is assigned point value based on the original national survey
responses. The total score (summing from 0 to 100) is then linked to probabilities of falling
above or below the poverty lines.
Progress Out of Poverty Index™ Overview
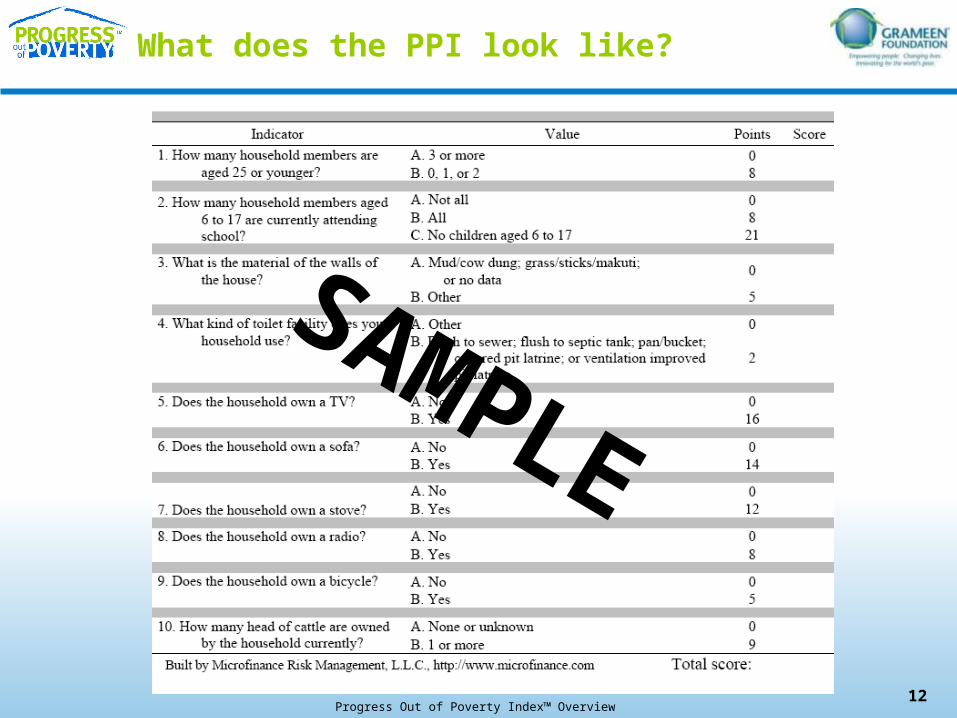
What does the PPI look like?
12
SAMPLE
Progress Out of Poverty Index™ Overview
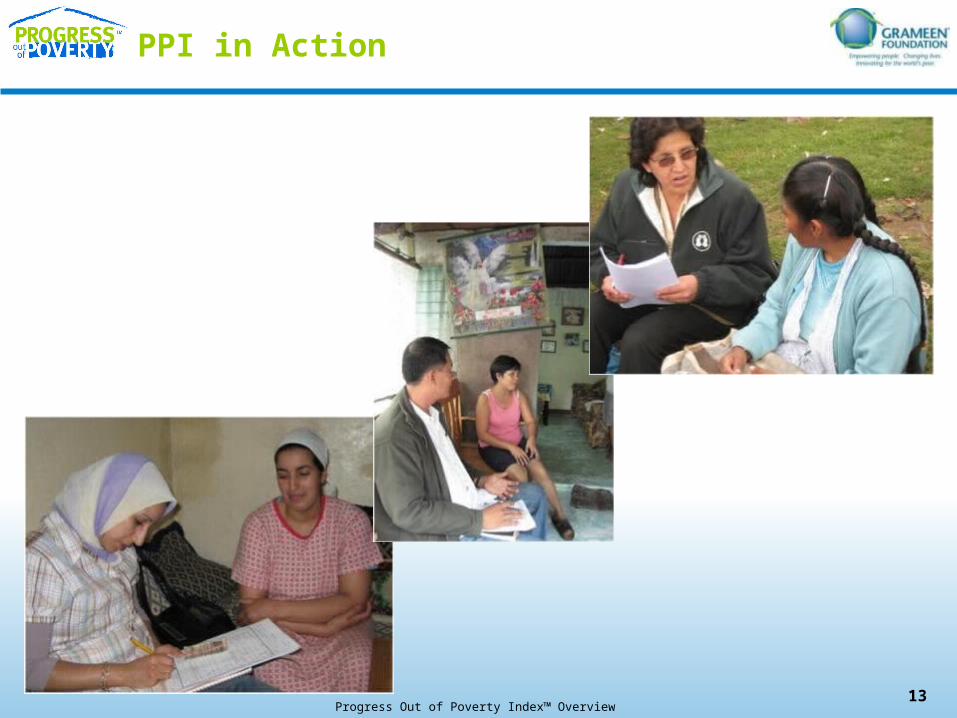
PPI in Action
13
Progress Out of Poverty Index™ Overview
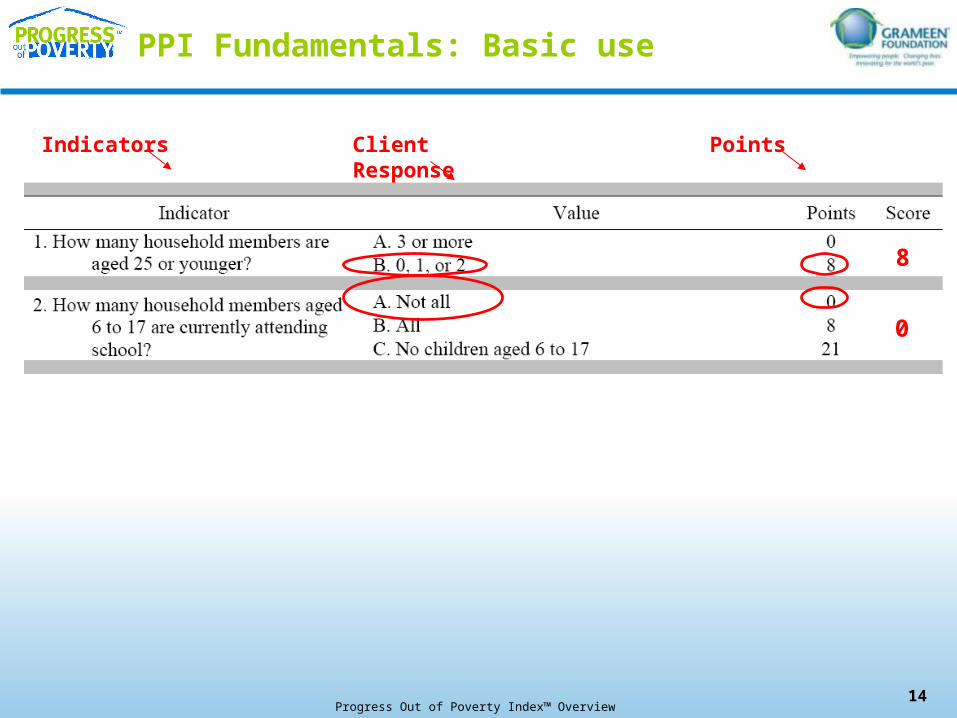
PPI Fundamentals: Basic use
14
Client Response
8
0
Indicators Points
Progress Out of Poverty Index™ Overview
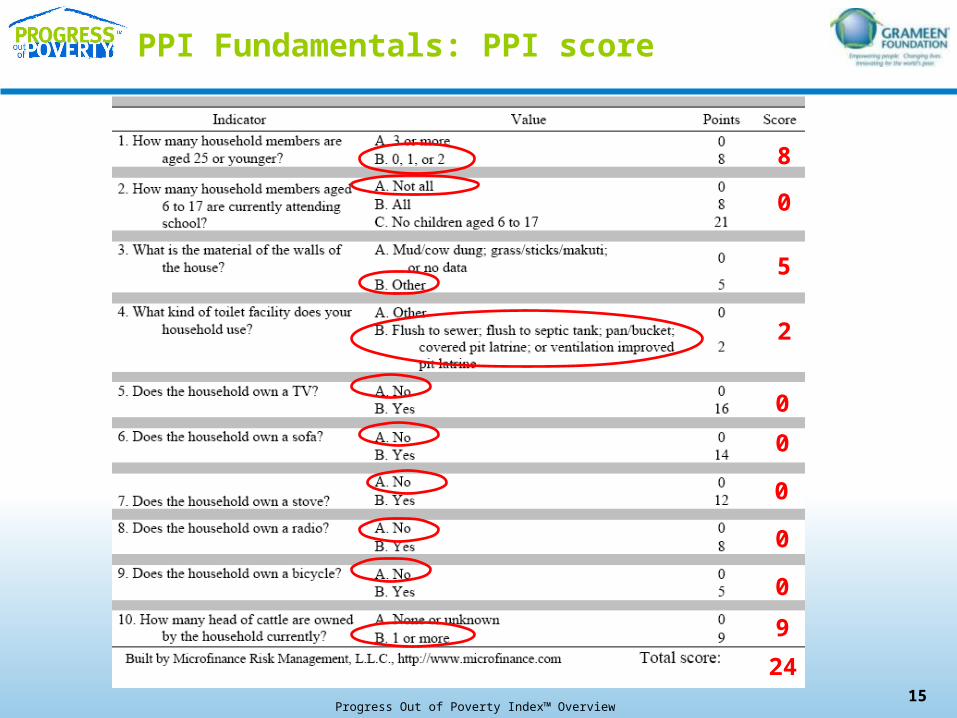
PPI Fundamentals: PPI score
15
8
0
5
2
0
0
0
0
0
9
24
Progress Out of Poverty Index™ Overview
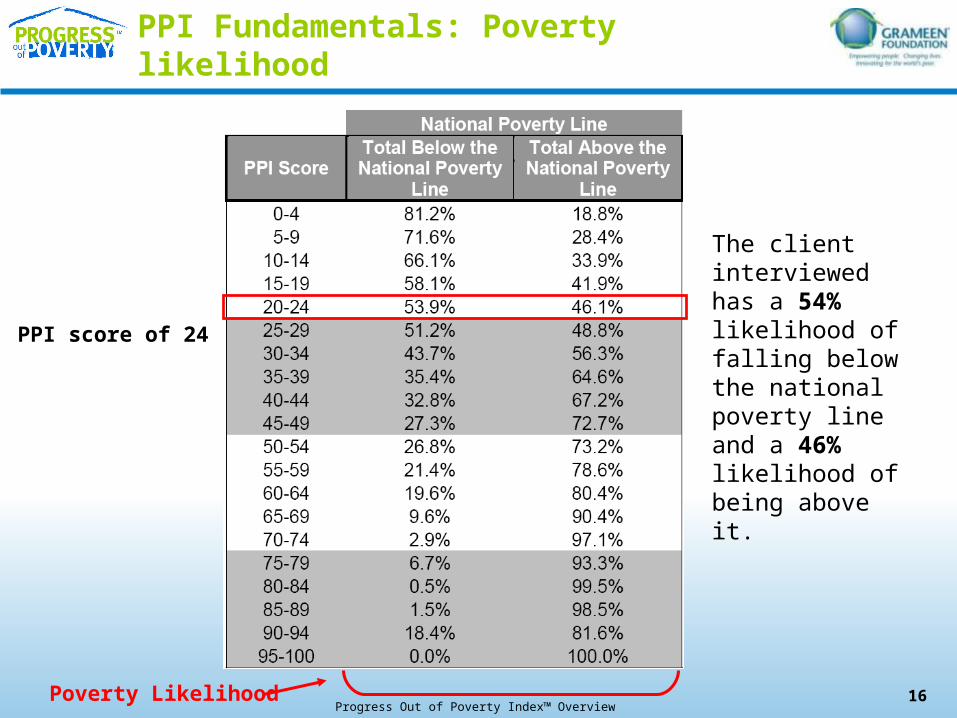
PPI Fundamentals: Poverty likelihood
16
PPI score of 24
Poverty Likelihood
The client interviewed has a 54% likelihood of falling below the national poverty line and a 46% likelihood of being above it.
Progress Out of Poverty Index™ Overview
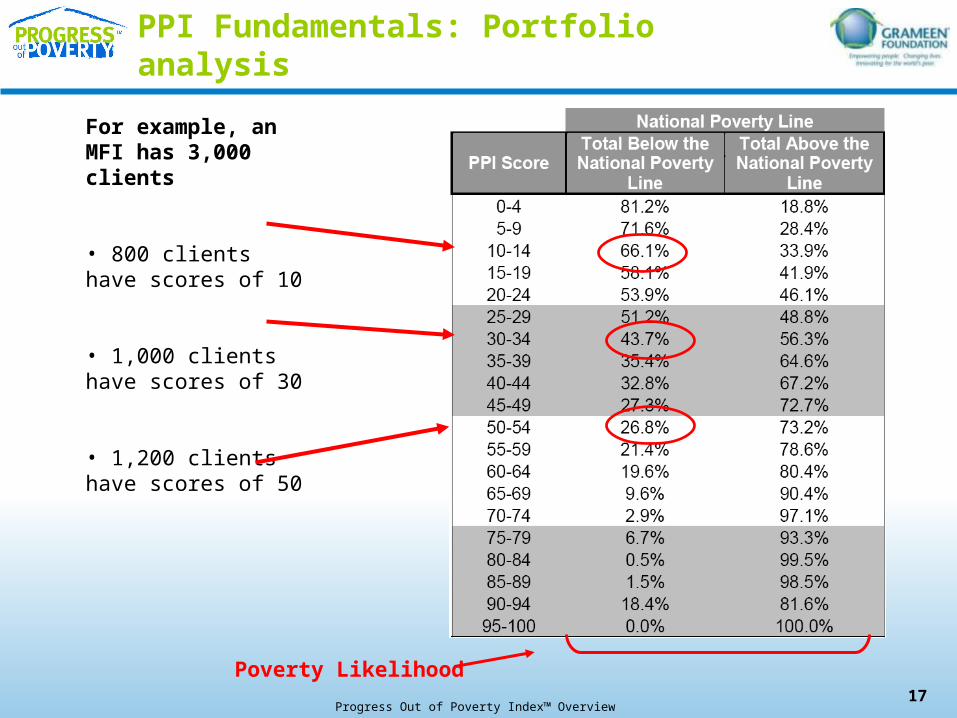
PPI Fundamentals: Portfolio analysis
17
For example, an MFI has 3,000 clients
• 800 clients have scores of 10
• 1,000 clients have scores of 30
• 1,200 clients have scores of 50
Poverty Likelihood
Progress Out of Poverty Index™ Overview
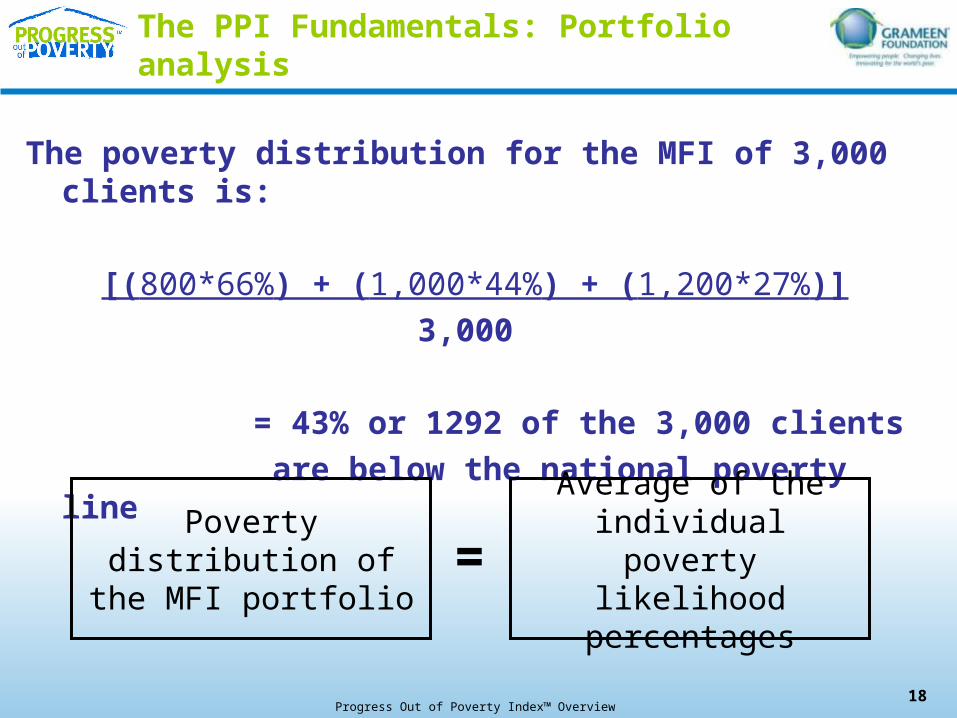
The PPI Fundamentals: Portfolio analysis
The poverty distribution for the MFI of 3,000 clients is:
[(800*66%) + (1,000*44%) + (1,200*27%)]3,000
= 43% or 1292 of the 3,000 clients are below the national poverty line
18
Poverty distribution of the MFI portfolio
Average of the individual poverty
likelihood percentages=
Progress Out of Poverty Index™ Overview
The PPI Fundamentals: Portfolio analysis
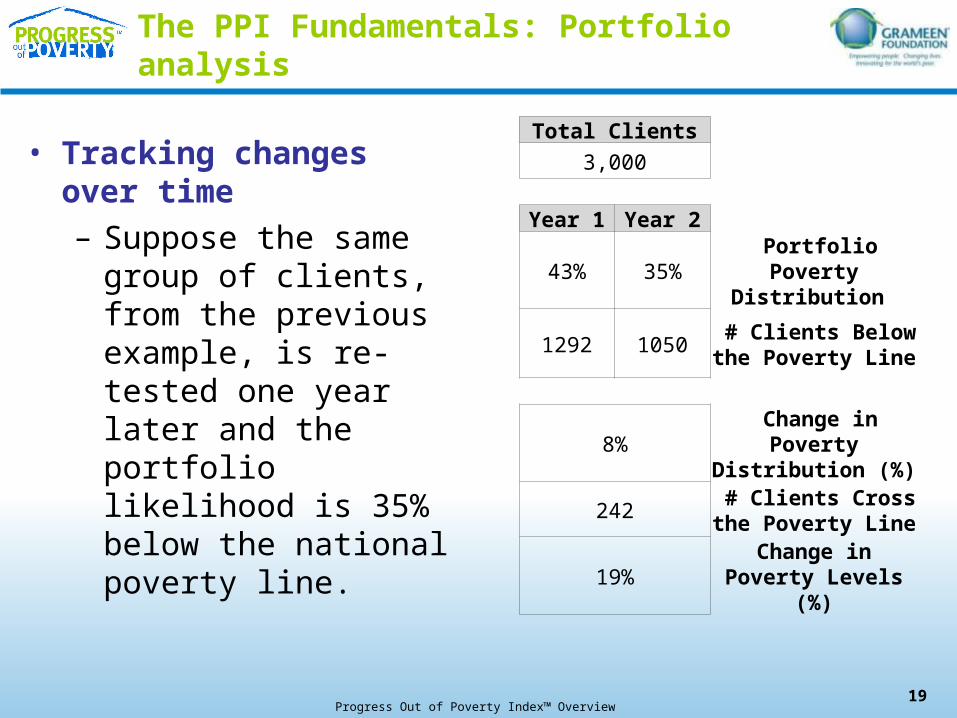
• Tracking changes over time– Suppose the same
group of clients, from the previous example, is re-tested one year later and the portfolio likelihood is 35% below the national poverty line.
19
Total Clients
3,000
Year 1 Year 2
43% 35% Portfolio Poverty
Distribution
1292 1050 # Clients Below the
Poverty Line
8% Change in Poverty
Distribution (%)
242 # Clients Cross the
Poverty Line
19%Change in Poverty
Levels (%)
Progress Out of Poverty Index™ Overview
How are PPI data used?
Progress Out of Poverty Index™ Overview
PPI Case Study: NWTF
• Negros Women for Tomorrow (NWTF) in the Philippines– Integrated the PPI collection across all branches after
piloting two years ago– Collected information on additional indicators to use as
it refines its outreach and its products and services– Compared data by branch to understand what products
and services are most effective
• Outcomes– Changed its eligibility requirements for incoming clients
by targeting 10 percent of clients above the poverty line – Facilitated entry for the poorest clients by adjusting
loan size, loan cycle period and possible pre-payment options
21
Progress Out of Poverty Index™ Overview
PPI Case Study: NWTF
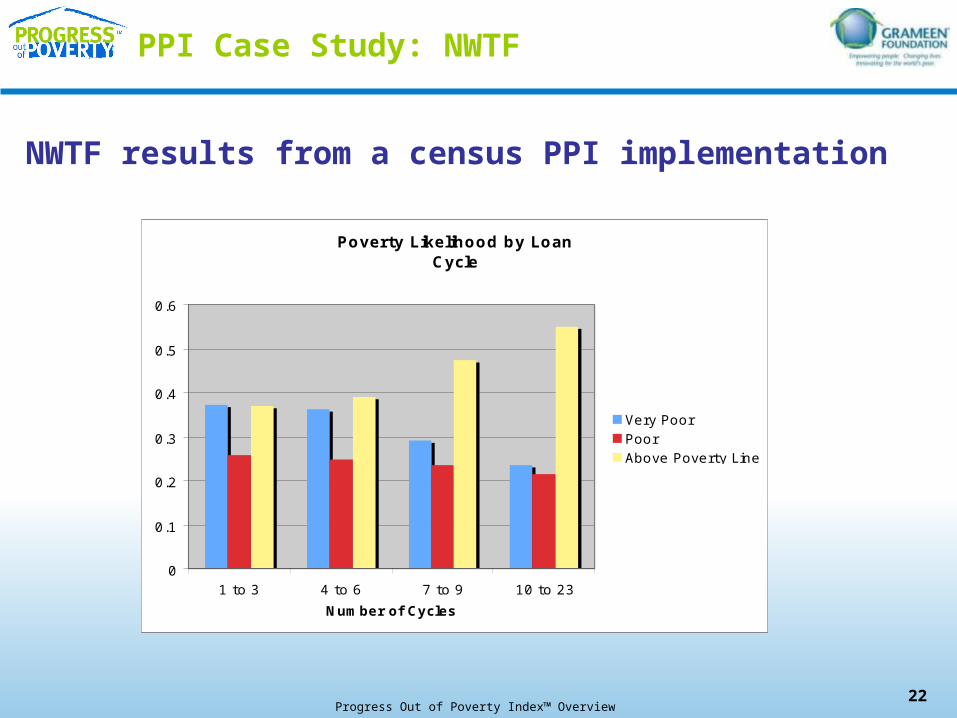
NWTF results from a census PPI implementation
22
Poverty Likelihood by Loan Cycle
0
0.1
0.2
0.3
0.4
0.5
0.6
1 to 3 4 to 6 7 to 9 10 to 23
Number of Cycles
Very PoorPoorAbove Poverty Line
Progress Out of Poverty Index™ Overview
PPI Case Study: Fonkoze
• Products tailored for clients at different levels means there is a need to differentiate those clients
• Collect PPI as part of “Evaluation Card” from all clients
• Use “Social Impact Monitors” to track 20% of clients over time
• Outcomes– Clear poverty level distinctions for each product type. – Ability to track client poverty level changes over time. – Improve product design and targeting to serve its
clients better.
23
Progress Out of Poverty Index™ Overview
PPI Case Study: K-Rep Pilot Project
PPI has assisted K-Rep in:• monitoring changes in client poverty levels for
purposes of management decision making and reporting;
• identification and development of innovative products and services which target specific market nitches;
• understanding of clients’ socio economic conditions before, during and after our credit intervention and how well K-Rep is achieving its social goals of reducing poverty, reaching the poor and the vulnerable and in promoting community development
24
Progress Out of Poverty Index™ Overview
PPI Summary
• Easy-to-use, inexpensive, transparent, objective
• Estimate likelihood that a household is poor:– Use policy cut-offs for targeting– Take average to get portfolio poverty rate– Track over time for progress out of poverty
• Practicality and accuracy – One page, few indicators, simple weights– Field workers can compute scores on paper in real time (no
software required)
• Valid for any program serving the poor, not just microfinance
25
Progress Out of Poverty Index™ Overview
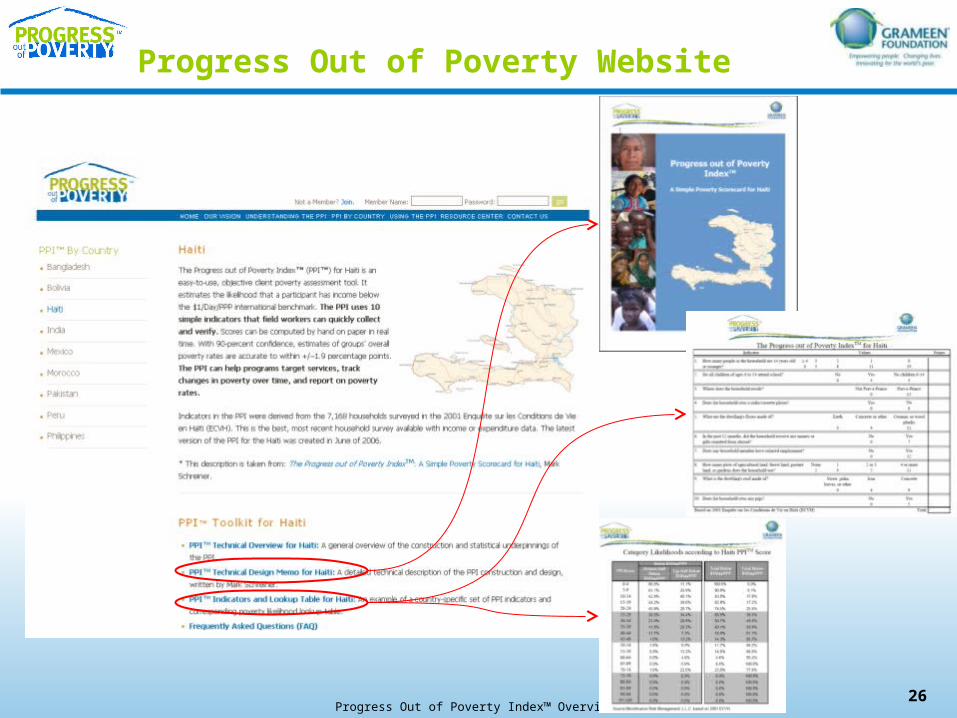
Progress Out of Poverty Website
26