Testing the “Progress out of Poverty Index” - Home | COSA · 4. The Multidimensional Poverty...
33
` Testing the “Progress out of Poverty Index” Update to 2013-14 Report
Transcript of Testing the “Progress out of Poverty Index” - Home | COSA · 4. The Multidimensional Poverty...
`
Testing the
“Progress out of Poverty Index”
Update to 2013-14 Report

Testing the
“Progress out of Poverty Index”
Synthesis Report for
Update to 2013-14 Report
This report is made possible by the generous support of the Ford Foundation
and by additional core support from the Swiss Government SECO.
Suggested citation: COSA. 2015. Testing the “Progress out of Poverty Index”: Synthesis Update to 2013-14 Report.
The Committee on Sustainability Assessment.

Contents
Executive Summary…………………………………………………………………………….. i
I. Purpose and Background………………………………………………………………….. 3
Background on poverty measurement ................................................................... 3
1. IRIS/USAID’s Poverty Assessment Tools…………………………………………….. 5
2. Consultative Group to Assist the Poor’s Microfinance Poverty
Assessment Tool……………………………………………………………………………….. 6
3. International Fund for Agricultural Development’s Multidimensional
Poverty Assessment Tool………………………………………………………………….. 6
4. Multidimensional Poverty Index (MPI) of Oxford Poverty & Human
Initiative (OPHI)…………………………………………………………………………………. 7
5. The Grameen Foundation’s Progress out of Poverty Index (PPI)……..... 8
Empirical Reviews of Poverty Assessment Tests .................................................... 9
Choosing a PAT to complement the COSA tool .................................................... 10
II. Comparisons of PPI to COSA economic indicators…………………………… 11
Mexico Implementation ........................................................................................... 12
Cocoa in Colombia .................................................................................................... 16
Future questions ....................................................................................................... 21
III. Next steps…………………………………………………………………………………….. 22
Advancing the work of COSA with the PPI ............................................................ 22
Other indices and tools ............................................................................................ 22
IV. Appendices…………………………………………………………………………………… 23
Appendix 1: COSA Indicators that are typically directly relevant to poverty ... 23
Appendix 2: PAT for Nicaragua ............................................................................... 24
Appendix 3: PPI for Nicaragua ................................................................................ 27
Appendix 4: Global OPHI MPI ................................................................................. 29

Progress out of Poverty Index Synthesis Report i
Executive Summary
As we seek to improve and refine the ways in which poverty can be assessed,
the Committee on Sustainability Assessment (COSA) evaluated different
existing poverty measurement tools such as the Progress out of Poverty Index®
(PPI®) that could be integrated into the COSA Producer Surveys. The goal was
to trial these approaches to determine both their validity and whether we could
establish direct correlations between the actual farmer incomes as determined
by such globally recognized poverty metrics and our existing COSA indicators
measured with the COSA Producer Surveys. After a review of several of the
leading poverty assessment tools, COSA decided to pilot the Grameen
Foundation’s PPI, and also the Multidimensional Poverty Index (MPI) designed
by the Oxford Poverty & Human Initiative (OPHI) in a smaller test.
COSA successfully used the PPI in four implementations: Guatemala (coffee),
Peru (coffee), Mexico (coffee) and Colombia (cocoa). The initial results from
these implementations utilizing the PPI tools suggest that the PPI could be a
useful addition to the COSA Producer Survey. Our use of other indicators for
poverty (total income, net income from crops, household assets, etc.) are
valuable for targeted action but do not provide a complete benchmark for
reporting the contextual reality of the farm family especially in relation to
overall poverty levels in the country. Using net income as a proxy for poverty
provides one valuable but incomplete piece of understanding about the
socioeconomic status of the beneficiaries. Since other non-crop factors also
affect their poverty, a broader tool like the PPI is particularly useful.
Incorporating and using the PPI is therefore allowing COSA to better
contextualize the reporting and interpretation of the poverty data it presents
while also tempering the PPI with more localized findings.
Reviewing the data from two of the implementations (Mexico and Colombia),
there was a correlation between COSA’s income indicators and the PPI scores.
For example, the poverty rate calculated using the PPI was related to food
security and had a negative relationship with environmental practices.
However, there is some uncertainty about the accuracy of using the PPI (created
using national consumption data) while using populations that, by their nature
– agricultural producers – may not be nationally representative.
For COSA clients (firms, development agencies and NGOs), using the PPI
provides added value in two ways. First, the PPI can help identify the extent to
which the project is targeting the poor. Second, the PPI can be used over time

Progress out of Poverty Index Synthesis Report ii
to track the status of beneficiaries and help discern the change in their poverty
level.
COSA has reviewed a number of discrete tool kits, such as the Women’s
Empowerment in Agriculture Index developed by IFPRI, and will continue to
adopt and develop other promising indices for the broader COSA toolkit.

Progress out of Poverty Index Synthesis Report 3
I. Purpose and Background The Committee on Sustainability Assessment (COSA) is a global organization
facilitating the measurement of social, environmental, and economic impacts
in agriculture. COSA measures impact with its Research Partners in each
country using an evolving set of indicators for each of these themes. COSA is
continuously looking to improve how it measures impact and sought to add a
poverty assessment tool to complement the current suite of survey tools. The
goal was to establish more direct linkages from its detailed field work to more
globally recognized poverty lines and metrics (such as USAID’s Extreme Poverty
Line, or the World Bank’s global poverty line of $1.25 at 2005 PPP). By using
clear and well-accepted poverty measures that reflect best practices and that
use global standards, results can be quickly and easily compared across
regions and projects, contributing to the improved understanding of poverty
and the economic dimensions of sustainability.
The purpose of this report is to briefly discuss the recent advent of several
poverty measurement tools and look at how each of these might work with the
COSA system. We describe the results of four COSA pilots utilizing the
Grameen Foundation’s PPI, selected because of its transparency and wide
acceptance. We compare the results of the PPI with our own income indicators,
and then we use the PPI data to provide greater context for each of the pilots.
Finally, we discuss how COSA can better integrate this tool and other
established indices to improve the information COSA reports and how the PPI
serves as a model index.
Background on poverty measurement
There is a need to accurately determine the socioeconomic status of groups of
individuals or households. Governments, development institutions, NGOs, and
others require this information to identify potential participants in projects,
track the progress and evolution of poverty over time, and to identify the
impact of policies or interventions that are intended to alleviate poverty. The
United Nations 2015 Millennium Development Goals identify the eradication of
poverty as the most important of all the goals. This poverty MDG is explicitly
described in the following way: Halve, between 1990 and 2015, the proportion
of people whose income is less than $1.25 a day.1 A recent World Bank report2
1 http://www.un.org/millenniumgoals/poverty.shtml
2 Olinto, P, et al. 2013. The State of the Poor: Where Are The Poor, Where Is Extreme Poverty Harder to End,
and What Is the Current Profile of the World’s Poor? Economic Premise. October 2013 Number 125.
Washington, D.C.: The World Bank.
Progress out of Poverty Index Synthesis Report 4
on the state of the global poor estimates that while the number of extremely
poor people is declining, there are still 1.2 billion people who are destitute –
defined as having $1.25 per day or less (in 2005 Purchasing Power Parity). It is
of paramount importance to be able to measure poverty rates especially
related to sustainability initiatives in order to know if advances are truly being
realized.
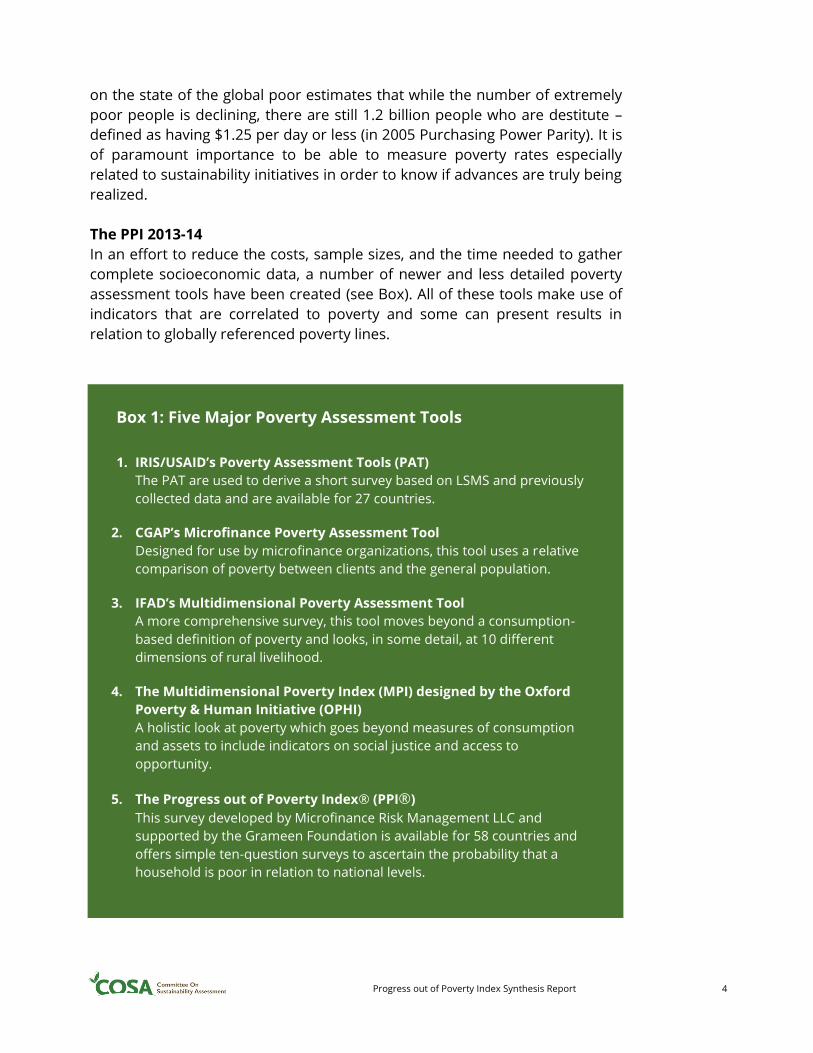
The PPI 2013-14
In an effort to reduce the costs, sample sizes, and the time needed to gather
complete socioeconomic data, a number of newer and less detailed poverty
assessment tools have been created (see Box). All of these tools make use of
indicators that are correlated to poverty and some can present results in
relation to globally referenced poverty lines.
Box 1: Five Major Poverty Assessment Tools
1. IRIS/USAID’s Poverty Assessment Tools (PAT)
The PAT are used to derive a short survey based on LSMS and previously
collected data and are available for 27 countries.
2. CGAP’s Microfinance Poverty Assessment Tool
Designed for use by microfinance organizations, this tool uses a relative
comparison of poverty between clients and the general population.
3. IFAD’s Multidimensional Poverty Assessment Tool
A more comprehensive survey, this tool moves beyond a consumption-
based definition of poverty and looks, in some detail, at 10 different
dimensions of rural livelihood.
4. The Multidimensional Poverty Index (MPI) designed by the Oxford
Poverty & Human Initiative (OPHI)
A holistic look at poverty which goes beyond measures of consumption
and assets to include indicators on social justice and access to
opportunity.
5. The Progress out of Poverty Index® (PPI®)
This survey developed by Microfinance Risk Management LLC and
supported by the Grameen Foundation is available for 58 countries and
offers simple ten-question surveys to ascertain the probability that a
household is poor in relation to national levels.

Progress out of Poverty Index Synthesis Report 5
There are advantages to using any of these tools as a proxy measurement of
poverty rates. Compared to an LSMS survey, most require fewer resources to
gather data and can still provide a reasonable estimate of the poverty level of
a beneficiary or a group. In the time it takes to fill one LSMS survey, a surveyor
could conduct about 10 PPI surveys, for instance. In the following sections,
each of these tools is briefly reviewed.
Conventional measurements of poverty are executed at the household level,
where surveys and researchers ask detailed questions about household
income and about recent consumption patterns. The best-known examples of
this approach are the Living Standards Measurement Surveys (LSMS),3 which
were established by the World Bank in 1980, in an attempt to improve the
methods used for monitoring progress in investments and projects that aimed
to raise the socioeconomic status of beneficiaries. In addition, LSMS were
designed to make local and national policy decision more evidence-based –
here was the data to identify priorities and determine what was working and
what needed to be changed. LSMS surveys, while highly credible, are also an
enormous undertaking with multi-hour surveys and sample sizes in the
thousands (1,600 to 5,000)4. Their practicality is therefore limited.
1. IRIS/USAID’s Poverty Assessment Tools
USAID worked with and funded the IRIS (Institutional Reform and the Informal
Sector) Center at the University of Maryland to develop, test, and disseminate
poverty assessment tools that could calculate the percent of a population living
below one or more national or international poverty lines and that also meet
US Congressional requirements for accuracy and practicality.5 Each tool
consists of two components and is designed to be administered in twenty
minutes or less, and produces data that can be easily used by partner
organizations to determine the percentage of clients or beneficiaries that fall
into different poverty categories.
The first of the two components is a country-specific household survey that
collects data on indicators that are pre-identified as the best predictors of
whether a given set of households is very poor, according to the official
definition of extreme poverty applicable to the country in question. The
second is a data entry template into which survey data is entered. The
3 Grosh, Margaret E.; Glewwe, Paul. 1995. A guide to living standards measurement study surveys and their
data sets. Living standards measurement study (LSMS) working paper; no. LSM 120. Washington, D.C.: The
World Bank.
4 Ibid. 5 The IRIS Center at the University of Maryland has since closed

Progress out of Poverty Index Synthesis Report 6
templates are connected to a software package that calculates and estimates
the share of households living below the applicable poverty line. Results can
be disaggregated by any number of variables and other relevant statistics from
the data can also be calculated.
There are currently IRIS Poverty Assessment Tools (PATs) available for 37
countries, but as of 2012 with the end of USAID funding, no more new PATs are
currently being developed by the IRIS Center, nor are the older PATs being
updated. With no further development and updating, this tool may have a
modest shelf-life and therefore was not actively tested in the field.
2. Consultative Group to Assist the Poor’s Microfinance Poverty
Assessment Tool
The poverty assessment tool developed by CGAP (Consultative Group to Assist
the Poor) is distinct from the other tools discussed here. Rather than
establishing and measuring the absolute poverty level of a beneficiary, this
poverty assessment tool looks at the relative level of poverty. The tool
compares the poverty levels of clients compared to non-clients in the same
community. The tool was developed specifically for the use of microfinance
organizations to target and identify new clients and to simply assess the effect
of current microfinance services or projects on existing clients.
The tool involves surveys of 200 randomly selected client households of the
target microfinance institution (MFI) and 300 non-client households in the
same operational area as the target MFI. The survey is an indicator-based
questionnaire which does not have pre-defined or coded responses. The
survey collects information on the demographic structure and activities of
households such as their footwear and clothing expenditure, food security and
vulnerability, housing indicators, land ownership and assets. CGAP’s extensive
manual provides guidelines on how to adapt the recommended questionnaire
to country conditions, including the possibility of adding local indicators to
account for context specificity.
While the manual gives all the steps to create a survey for any given country
and steps on how to analyze the data, the lack of information regarding the
use, adaptation, or interpretation of this tool suggests that there may be
relatively modest levels of uptake outside of the MFI community. For COSA, the
difficulty it presents for having comparable data means it will be less relevant
for its needs.

Progress out of Poverty Index Synthesis Report 7
3. International Fund for Agricultural Development’s Multidimensional
Poverty Assessment Tool
IFAD’s Multidimensional Poverty Assessment Tool (MPAT) is a multi-purpose
tool that attempts to be more broadly inclusive in the definition of poverty.
MPAT builds on traditional poverty assessment methods that are focused on
economic and consumption-oriented indicators and has added other
indicators to provide an overview of fundamental and relatively universal
dimensions of rural livelihoods and rural life, and therefore of rural poverty.
The MPAT is a survey-based (household and village level) tool with thematic
indicators primarily designed to support monitoring and evaluation, targeting,
and prioritization efforts at the local level.
The MPAT focuses on assessing 10 dimensions of rural livelihood: Food,
Nutrition and Security; Domestic Water Supply; Health and Healthcare;
Sanitation and Hygiene; Housing, Clothing and Energy; Education; Farm Assets;
Non-farm Assets; Exposure and Resilience to Shocks; Gender and Social
Equality.
This tool was designed to be universal enough to be relevant to most rural
contexts around the world, yet it can be made specific enough to provide
project managers and others with detail on key dimensions relevant to their
rural poverty reduction efforts. The survey takes somewhat longer to
administer than the other tools profiled here; in China, the surveys ran from 15
minutes to 105 minutes per household, with an average of 33 minutes.6
4. Multidimensional Poverty Index (MPI) of Oxford Poverty and Human
Initiative (OPHI)
This poverty assessment tool expands on the approach that IFAD took.
Basically, it assumes that measuring consumption or income of the household
only provides us with a small and limited viewpoint of what poverty is and how
it affects a household. In a nod to the work of Amartya Sen, this index attempts
to measure and include the lack of opportunities and deprivations that the
poor experience. In other words, poverty is not simply low income or low
expenditures on household goods, but occurs in a context where the poor lack
basic rights, services and opportunities. Chief among these are education,
health, housing, empowerment, humiliation, employment, personal security
and others. By including all of these, OPHI argues that levels of income are not
always correlated with other trends, such as child mortality, access to
6 Cohen, Alasdair (2009). The Multidimensional Poverty Assessment Tool: Design, development and application of
a new framework for measuring rural poverty. International Fund for Agricultural Development: Rome.

Progress out of Poverty Index Synthesis Report 8
education and undernourishment. This index was meant to complement and
not replace income-based types of poverty assessment measurements.
OPHI created an equally weighted index for measuring poverty through
identification of the number of deprivations that the poor suffer from. The
resulting measures aggregate information to reflect societal poverty in a way
that can be broken down by regions, groups and, importantly, can be broken
down by dimension and indicator to show how people are poor and how they
lack access to basic rights and services. OPHI has proposed using the Alkire-
Foster7 method to create a Multidimensional Poverty Index 2.0 for the post-
2015 MDGs, as a headline indicator of multidimensional poverty that can reflect
participatory inputs and still be easily disaggregated.
5. The Grameen Foundation’s Progress out of Poverty Index (PPI)
The Progress out of Poverty Index is a poverty measurement tool comprised
of a country specific survey with 10 simple, easy-to-answer multiple-choice
questions. Each question has a point value associated with the potential
answers. The point values are added up and this value is used to obtain a
poverty score. An accompanying look-up table is then used to convert the
poverty score to a probability that the given beneficiary is below a reference
poverty line. Averaging these likelihoods for a group and considering the
sample size, a likely poverty rate can be estimated for the group in question.
The PPI is constructed by identifying the 10 questions that will constitute the
survey on the basis of a logit regression analysis of a country’s national
household income or expenditure survey to identify the indicators that are
most predictive of poverty. These indicators are then converted into a question
format for the survey. The regressions estimate the power of each
question/indicator to predict the financial poverty level of a respondent.
Among the criteria for the indicators that are chosen is that they are easy to
verify by a surveyor and simple to answer. Importantly, they are also subject
to measurable change over time. Asking about education level of the head of
the household will often result in a useful indicator for poverty (provided that
educational levels are correlated to poverty in that country) but is not always
included since this indicator will likely not show much change over time, even
if the beneficiaries are improving their socioeconomic status. Likewise, the PPI
7 Alkire and Foster developed the method to usefully aggregate other types of deprivations that the poor
suffer from. More here: http://www.ophi.org.uk/research/multidimensional-poverty/alkire-foster-method/

Progress out of Poverty Index Synthesis Report 9
surveys do not ask the values of expenditures, rather the questions often ask
about the presence of household goods or the availability of certain services.
The chosen indicators are then verified for their ability to predict the poverty
level by testing them using national survey data that was not used in the
construction of the PPI survey. The results of the tests and scorecard creation
are available for each country.8 For every country where other Poverty
Assessment Tools are available, PPI documentation shows the tests of these
other Poverty Assessment Tools compared to the PPI. Most of the other tools
do not document the exact methods of their comparison.
Mark Schreiner of Microfinance Risk Management, developer of this tool, has
emphasized that a significant intention is to ensure its ease of adoption and
simple usability for broad uptake. In particular he highlights the use of
categorical indicators (presence of items) rather than numerical indicators
(cost and values), and the scoring is calculated using whole number
increments. The PPI score is then used to find the appropriate poverty rate –
often multiple rates are available for comparison. The PPI score is a range from
0 to 100, and the poverty rates are given as the probability that the individual
is below the chosen poverty line. When using the score for a group, the
probabilities of each individual are averaged for the group’s poverty rate.
Empirical Reviews of Poverty Assessment Tests
There are few examples in referenced, published journals that attempt to
compare the different tools. A direct comparison of each is a difficult
proposition, as they have been created from distinct sources and methods and
cannot be easily compared directly. However the Poverty Assessment Tools
that use the same source data (LSMS or other type of national surveys) can be
more readily compared. Recently in El Salvador a study by the University of
California took a sampling of the beneficiaries of a Catholic Relief Services
project and applied three different Poverty Assessment Tools: the Progress out
of Poverty Index, the USAID/IRIS Poverty Assessment Tool, and the OPHI
Multidimensional Poverty Index and compared accuracy9 against the national
poverty levels.
8 See www.microfinance.com 9 Janet, Brendan Scott (2008). The Accuracy, Precision, and Implementation Challenges of Three Different
Poverty Measurement Tools in El Salvador and Guatemala. Agricultural Economics Masters Thesis, University
of California, Davis.

Progress out of Poverty Index Synthesis Report 10
The study found that single dimension poverty tools (PPI and PAT) are both
reasonably accurate when applied to nationally representative samples, but
their accuracy can vary greatly when applied to non-nationally representative
samples (areas and sub-regions). Using different definitions of poverty (single
dimension tools like PPI and PAT versus multidimensional MPI) will identify
different households as poor. However, it is not yet clear under which
scenarios each tool will provide the most accurate representation of poverty.
The multidimensional poverty index certainly provides more context through
the inclusion of other dimensions but its distinct and more complex approach
would require substantially more in-depth work. The researcher thus focused
comparison on the PPI and PAT. He concluded that both the PPI and PAT
provided good estimates of poverty, but the author recommended the PPI
over the PAT in terms of accuracy and ease of use.
When using a specific poverty cut-off score (for targeting beneficiaries), the PPI
was more accurate than the PAT. In samples that were nationally
representative, both tools provided similarly accurate estimates. The PPI
however was found to be more “field ready” and easier to implement.
Additionally, the amount of literature available for each country specific PPI
(available at www.progressoutofpoverty.org and www.microfinance.com),
makes the PPI much more transparent and open to use. For these reasons,
and that the PAT is no longer being updated, the PPI is the superior single-
dimension poverty measurement tool.
Choosing a PAT to complement the COSA tool
COSA wanted to complement its survey by adding a poverty assessment tool
that would seamlessly blend in with the existing structure of its detailed farm-
level surveys. COSA already had a number of different indicators for poverty:
income (both farm and off-farm); education level of the household; household
assets, farm assets, living standards such as smoke ventilation in cooking area
and access to clean drinking water, and food security (see Appendix 1). While
these can be constructed to give a good representation of poverty, they do not
directly measure poverty on a consumption basis and are limited in their
relation to national poverty levels or global poverty lines. COSA measures of
poverty do not readily map to other indices so adding a PAT to the COSA
indicators provides a link to the broader policy discussions and, in turn, COSA
can offer those discussions a more granular level of detail that provides access
to the specific areas of intervention that would be most likely to make a
difference to a farming household.

Progress out of Poverty Index Synthesis Report 11
A significant consideration in integrating a separate PAT was how it would fit
into the existing system that COSA uses of indicators, the survey, electronic
data collection application, and the system of queries to access that data
consistently. Finding a tool that can be readily applied during a brief farm visit
and that will be continuously available (supported) were strong priorities for
the selection. Based on these criteria, COSA chose to focus on the Grameen
Foundation’s Progress out of Poverty Index tool to pilot with the COSA surveys
and to also try the OPHI MPI.
The PPI surveys for each country are readily available with full documentation
on construction and scoring. At present, the PPI is available in 58 countries.
Within the COSA platform, it is a matter of adding separate new sections for
each PPI within the survey builder platform. This gives the user the ability to
select and add the PPI as needed to a survey. Within the platform, individual
queries are written and then tested for each PPI survey that will automate the
scoring of each survey and reduce user error. This means that for every new
country in which the PPI will be added to existing COSA surveys it requires some
time for the set up but after initial configuration, and the additional training of
surveyors, the data collection and analysis become a seamless part of the
existing COSA workflow.
COSA began testing the PPI with some limited trials in farmer surveys for a
cocoa project in Nicaragua, in collaboration with IFC and Ecom Agroindustrial
Company. The testing involved using the Nicaraguan PPI, loading the survey
into the system and creating queries for the data. After initial learning about
the PPI and the success of some small pilots, COSA began to incorporate the
use of PPI into the larger scale implementations. Now, it is beginning to use
the PPI to not only provide context for the regions where it is working but also
to supplement and validate the results of its indicators such as net income.10
To date, COSA has utilized the PPI in collaboration with Root Capital’s evaluation
of cooperatives and microfinance in Guatemala; in the impact assessment of a
leading multinational firm in southern Mexico; in an assessment of cocoa
growers in Colombia; and in the evaluation of a credit program in Peru
(ongoing). Additionally, the OPHI MPI for Colombia was included in the survey
in order to facilitate a comparison of the OPHI.
10 This comprehensive indicator for economic sustainability takes into account yield, prices, and cost of
production.

Progress out of Poverty Index Synthesis Report 12
II. Comparing PPI to COSA economic
indicators
In this section we present some of the tests and analyses of the findings, first
looking at the relationship between the PPI and COSA’s standard economic
indicators. We then look in more detail at how the PPI can provide context in
the reports. Integrating the PPI more completely with COSA indicators is in
process, but the addition of the PPI has already facilitated communication of
the poverty levels of various participants.
Integrating the PPI into COSA implementations is intended to complement the
current economic indicators that COSA uses. COSA principally measures the
farmer’s economic situation through net income and total household revenue
(other measures relevant to poverty are noted in Appendix 1). COSA’s net
income indicator is described as total revenue from focus crop sales less total
costs for focus crop production. Household revenue is combined revenue from
focus crop sales, other crops, other earnings (off farm, services, business revenue,
and land & equipment rental), and gifts & remittances. Net income is calculated
using amounts sold and prices from the target crop (currently coffee and cocoa)
and the cost of production for this crop. Household revenue requires recall and
estimations of income from non-farm sources and of other members of the
household. Net Income provides an indicator to analyze the economic viability
and sustainability of the cultivation of the focus crop, while household revenue
allows COSA to understand the diversification of income for the beneficiaries
and the risk of depending solely on the target crop. While neither strictly
provides an indicator of poverty per se, they do suggest the socioeconomic
status of the beneficiary.
Mark Schreiner, the developer of the PPI, has stated that comparisons of other
poverty indicators against the PPI are necessarily imperfect as these different
poverty tools are built from different data and approach poverty from different
perspectives and definitions.11 The PPI scorecard is constructed with and
measures consumption expenditures and thus measures one definition or
aspect of poverty, which differs from how COSA has measured and described
the indicators of poverty from multiple dimensions. In an ideal scenario, the
correlation between the PPI and COSA economic indicators point in the same
direction, but an absence of a correlation does not necessarily invalidate either
approach. Since it is designed to align with national census averages in most
cases it will not always pick up the specific poverty aspects experienced in a
11 Personal communication with Mark Schreiner, 18 November, 2013

Progress out of Poverty Index Synthesis Report 13
smaller sample such as a sub-national region if these aspects vary from the
national tendencies.
Therefore, we explore the correlation between COSA economic indicators and
the poverty rates provided by the PPI as a heuristic exercise and seek to learn
how the PPI can enrich our understanding of other key indicators. The overall
goal is to improve the accuracy of COSA assessments and the contextual
validity of those results.
For the purposes of this comparison, we primarily use data gathered from two12
COSA smallholder implementations for two crops in Mexico and Colombia. For
each country we present the comparisons with the economic indicators first,
and then we use the poverty rates from the PPI to look at other relationships
between poverty and indicators in other thematic areas.
Mexico Implementation
The Mexico implementation was an evaluation of the certification project of a
leading multinational firm conducted in a rural region in southeastern Mexico
(Veracruz). The evaluation was funded by IFC, who asked COSA to take the
baseline and midline data compiled by a COSA Research Partner organization
and complete the impact assessment. The PPI for Mexico was incorporated
into this final survey instrument and was implemented with 300 households,
comprising both treatment and control groups.
The first comparison we show for Mexico is between net income from the
focus crop and the poverty rate as calculated by the PPI. The PPI is constructed
using national databases and even though this was not a nationally
representative sample, we see that there is a correlation between the net
income from coffee and the expected poverty rate calculated by PPI of each
group when using net income per capita and dividing the groups into quintiles.
12 Field work for the other pilots with the PPI wrapped up in December 2013 and the data was not yet available
for this report

Progress out of Poverty Index Synthesis Report 14
Figure 1: Mexico - National Poverty rate versus Per Capita Net Income from Coffee
When viewed on an individual level (Figure 2), the correlation is clearer but also
exposes interesting exceptions. Looking more closely at the data, there are a
number of individuals who have relatively low per capita net incomes of less
than US$1,000 and surprisingly also have low probabilities of being poor. The
imperfect correlation to the expected PPI range could be caused by normal
distributions of the data or factors such as that the household had other large
sources of unreported income or that these are exceptions that occur naturally
when a sample is not nationally representative.
Figure 2: Mexico - Individual per capita net coffee income and probability of being poor
19%18%
15%
9% 8%
0%
5%
10%
15%
20%
25%
$ 9 $ 101 $ 215 $ 405 $ 1,450
Po
ve
rty r
ate
(N
ati
on
al
Po
ve
rty
Lin
es)
Per Capita Net Income from Coffee by Quintile (Avg per quintile)
-$ 1,000
$ 0
$ 1,000
$ 2,000
$ 3,000
$ 4,000
$ 5,000
$ 6,000
$ 7,000
0% 10% 20% 30% 40% 50% 60% 70% 80% 90%
Ne
t in
com
e (
US
D $
)
Probability that farmer is below national poverty line

Progress out of Poverty Index Synthesis Report 15
To further understand the context, the PPI was used to look at the differences
of poverty rates between the target and control farmers and then to see how
that matched food security findings. In the selection of control and treatment
farmers, Propensity Score Matching techniques were used to ensure that the
groups were well matched. Generally speaking, the target farmers in the
sample are a bit less likely to be poor. Using the Mexican national food poverty
line, target farmers had a 14% poverty rate compared to 18% of control
farmers (this difference is significant at the 90% level). When the USAID’s
Extreme Poverty Line is used, there is a 4% difference in the poverty rates
between the groups, but this difference is no longer significant. Since we only
have the PPI data for the final evaluation, we cannot attribute the difference
to participation in the project.
Figure 3: Mexico evaluation, coffee - Poverty rates of control and treatment group
One of the clearest relationships is that between poverty and food security.
While there were not many respondents in Mexico who were identified as
having long periods of food insecurity, those that did report food insecurity had
a much higher poverty rate than those that did not have any periods of food
insecurity. In other words – of the farmers (both control and treatment) that
reported having periods of food insecurity, they collectively had a poverty rate
of 41% (using the Mexican National Poverty Line), whereas the farmers who did
not report any food insecurity have a poverty rate of 14%.
14%
20%18%
24%
0%
10%
20%
30%
40%
50%
National Food* USAID Extreme
Po
ve
rty R
ate
Target Control

Progress out of Poverty Index Synthesis Report 16
Figure 4: Mexico evaluation - Food security and poverty rate
Cocoa in Colombia
As part of a donor evaluation for a training and technical assistance project for
cocoa producer organizations in the south and northeast of Colombia, COSA
deployed the PPI as a part of our Producer Survey with 960 producers (target
and control). As depicted in Figure 5, there is a clear correlation between our
measures of crop net income13 and the PPI measures. It shows reduced
likelihood of poverty among cocoa producers who have higher net cocoa
incomes. When we estimate overall producer incomes and arrange them by
quintiles, we can see that the PPI, using a different, broader indicator still
returns a similar overall finding. The correlation is certainly not always clearly
evident across the individual samples.
13 Crop net income for small farmers tends to correlate to overall income when the crop is the primary focus
of the farm, as it is in most of the evaluations noted in this report.
14%
41%
0%
10%
20%
30%
40%
50%
Does not have food security issues Has food security issues
Po
ve
rty r
ate
(N
ati
on
al
Po
ve
rty
Lin
e)

Progress out of Poverty Index Synthesis Report 17
Figure 5: Colombia evaluation - Net income quintiles versus poverty rate (treatment,
control and average) of participants in program
Similar to the results seen previously in Figure 4 for Mexico, there is a clear
relationship between those identified as having food insecurity and the
poverty rate calculated by the PPI. Those that are food insecure have a higher
poverty rate (as defined by the national food poverty line) than those that are
not for both targets and controls. For Colombia, the poverty rate for those that
have identified as having food security issues is 23% versus 11% for those that
had none (Figure 6).
Figure 6: Colombia evaluation - Food insecurity and poverty rate
11%
23%
0%
10%
20%
30%
40%
Does not have food security issues Has food security issues***
Po
ve
rty r
ate
(N
ati
on
al
Lin
e)
18%
21%
19%
13%10%
14%12%
14% 14%
9%
0%
10%
20%
30%
40%
1 2 3 4 5
Total Farm Income Quintile (Lowest to Highest)
Target Control

Progress out of Poverty Index Synthesis Report 18
Environmental degredation and poverty are two rural issues that appear to be
linked in the Colombia work, though not necessarily in a causal way. The data
from Colombia (Figure 7) shows that farms that utilized a higher number of
environmentally sound management practices were less likely to be poor than
those that did not have as many environmental practices. While further
information is required to determine if poor farmers have adequate
information about the benefits of good environmental practices to make
appropriate decisions, the correlation between the two issues is clear.
Figure 7: Colombia evaluation - number of environmental practices vs. poverty rate
This piece of data shows a fairly intuitive comparison. In Colombia, the farmers
that had greater amounts of land were less likely to be poor. This is especially
true for land cultivated with cocoa, the dominant legal cash crop for the
regions that were surveyed. Farmers that have smaller plots of land planted to
the target crop are not diversifying into other crops and are more likely to be
poor. These are the farmers that could be ideally targeted for productivity or
efficiency improvements.
0%
5%
10%
15%
20%
0 2 4 6 8 10
Po
ve
rty R
ate
(N
ati
on
al
Po
ve
rty L
ine
)
Number of conservation practices

Progress out of Poverty Index Synthesis Report 19
Figure 8: Colombia evaluation - land area vs. poverty rate
The final comparison presented in the work done in Colombia is the
comparison of the OPHI MPI and the PPI across the total income quintiles. At
first glance it may seem that the MPI and the PPI are at odds with the poverty
rates for the farmers grouped by income quintile. However, there is a measure
of correlation and it is important to note that each index has its own reference
point. The PPI is referring to the National Food Poverty Line, while the MPI is
its own sui generis reference point. The MPI is different from the PPI because
it includes the following indicators: Education of family members, Childhood
and youth conditions, Labor, Healthcare, Public services and house conditions.
Each of these indicators carries an equal weight in calculating the overall MPI
score.
Figure 9: Comparison of MPI to PPI across income quintiles in Colombia
0%
5%
10%
15%
20%
25%
0 1 2 3 4 5
Po
ve
rty R
ate
(N
ati
on
al
Po
ve
rty L
ine
)
Quintiles of Total area and Cocoa area
Total area quintiles
16%18%
16%
14%
10%
6…77%
68%
5…
4…
0%
20%
40%
60%
80%
100%
0%
5%
10%
15%
20%
1 2 3 4 5
MP
I
PPI
Total income quintile

Progress out of Poverty Index Synthesis Report 20
Colombia has a national MPI score of 35%14, and so these groups of farmers
are significantly poorer by this index than the national average. The PPI for
Colombia15 only has partial overlap with 2 of these categories, or would
comprise approximately 20% of the score. The difference that is observed is in
how the poverty rates are interpreted. The PPI was used to calculate the
national food poverty rate, which is only a small component in the more holistic
measurement of poverty used by the MPI.
The PPI and MPI appear to be quite different but at one general level, the two
indices are in agreement as both show a decreasing relationship between
poverty rate and the income quintile groups, and both relate the second
quintile as more likely to be poor than the first quintile. The first quintile, with
the lowest total income has a lower poverty rate than the second quintile. Total
income for the quintile classifications is calculated from both the income from
the sale of the main crop (cocoa) plus the other household and off-farm
income. The data shown here is compiled from three different Colombian
departments. Focusing on the first and second quintiles, while the difference
in the poverty rate calculated by the PPI is not significantly different (16% to
18%), the MPI is substantially so, from 77% to 60%. One potential
interpretation is that the first quintile and second income quintiles may have
similar levels of poverty as defined by income, yet there are public services or
other opportunities available to this first group that are not available to those
in the second quintile. The rest of the income comparison shows decreasing
poverty with increasing income, which is the correlation that is expected.
The limited exposure that COSA has had with the PPI assessment tools has
been positive to date. Incorporating the PPI country surveys into COSA impact
assessment surveys has been successful. Within the COSA platform, queries
have been coded to provide the PPI score and the probabilities of alignment
to the national poverty lines in addition to the $1.25 and $2.50 lines. Initial
feedback from clients has been limited but all positive, as using the PPI has
provided a simple and quick way of classifying and even comparing the
beneficiaries to the control population. For COSA, we continue to explore ways
to better report and present this data, to identify how the poverty data
provided by the PPI works with and improves the information presented by
our indicators, and how we can use the PPI to track participants’ status over
time.
14 See http://www.ophi.org.uk/policy/national-policy/colombia-mpi/ for the Colombian government’s use of
the MPI.
15 http://www.microfinance.com/English/Papers/Scoring_Poverty_Colombia_2009_EN.pdf

Progress out of Poverty Index Synthesis Report 21
Future questions
Given the transparency and the documentation of the PPI, there is little doubt
that as a practical and easy to deploy Poverty Assessment tool there are few
peers. However, in reviewing the applicability of the PPI for use in assessment
of the poverty status of rural farmers in global supply chains, questions are
raised about the necessary scale of sampling.
The PPI is created and verified using a national data set. In other words, for the
PPI to be the most accurate, a nationally representative sample is needed.
Many investigations of farmers and sustainability initiatives are limited to
geographic regions and specific rural locations, whose populations are not
nationally representative. In the PPI documentation, and in a recent
conversation, Mark Schreiner suggests that the accuracy of the PPI would drop
in cases where the PPI is applied to a subgroup. Using a power analysis to
determine the minimum sample size for the 2005 PPI for Nicaragua, estimates
for poverty rates with a .90 confidence level and a confidence interval of +/- 3%,
requires sample size of 339 farmers. It also requires the assumption that these
339 farmers are representative of the national sample. While smaller samples
are likely to reduce the statistical accuracy of the poverty rate for these groups,
they can still be tracked over time utilizing the PPI.
Reviewing the COSA indicators on poverty (Appendix 1) there are a few
indicators that do not overlap with the commonly used questions engaged for
the construction of the PPI. Living standards (smoke ventilation in cooking area
and access to clean drinking water) and Food Security are two of the most
obvious. These two indicators are a standard part of any COSA implementation
and could be used by the PPI implementers to provide some depth and a more
granular understanding of poverty to the consumption-based poverty rates
provided by the PPI. However, where considerable detail is preferred and
where having easy comparability is not desired, then the OPHI MPI can be
incorporated in situations where the project requires a holistic view of poverty.

Progress out of Poverty Index Synthesis Report 22
III. Next steps
Advancing the work of COSA with the PPI
COSA endeavors to work with time series data and counterfactuals. Very
simply, data is gathered at the baseline, before an intervention or investment
is made, then captured again after sufficient time has passed to determine the
results of such interventions and compare to a similar control group over the
same period. The changes captured in the data over time provide the basis for
an assessment of the impact of the intervention. As of this report, we did not
have any time series data for the PPI in any of the implementations. Adding
the ability to look at and track changes in poverty status over time, in parallel
with changes for other COSA indicators, will reveal future ways in which COSA
might incorporate the poverty data provided by the PPI and use it for learning,
monitoring, and evaluation of results. Presently, we also have PPI data for 1000
households in Peru and will be tracking the PPI over the course of that
implementation with our partners there, the InterAmerican Development
Bank and the Sustainable Commodity Assistance Network. We will be
gathering another series of this data in late 2015 and hope to determine the
outcomes of the program on the poverty levels of the beneficiaries using a
blended COSA-PPI approach that combines PPI national relevance with COSA
local relevance. We will also share these lessons with the Grameen
Foundation.
Other indices and tools
The COSA platform offers the opportunity to provide a testing ground for the
integration of diverse tools and indices with the comprehensive farm
household assessment that COSA and dozens of its partner institutions
already employ. The experience with the PPI and the modular nature of the
COSA platform allows us to provide valuable feedback. Developers of similar
tools and indices can design and create discrete modules that can be
repeatedly tested and improved utilizing established COSA indicators and
tools. COSA supports such collaborations to provide an ever improving and
common platform for enhancing our reporting and understanding of the key
issues surrounding agricultural sustainability and rural poverty.

Progress out of Poverty Index Synthesis Report 23
IV. Appendices
Appendix 1. COSA Indicators that are Typically
Directly Relevant to Poverty
Indicator name Description
Producer net income
from focus crop
Total revenue from focus crop sales less total costs for focus crop
production
Household revenue*
Combined revenue from focus crop sales, other crops, other earnings
(off farm, services, business revenue, and land & equipment rental),
and gifts & remittances
Production/labor
efficiency
Kg crop produced per unit of input (fertilizer, herbicide, fungicide,
pesticide, paid labor day, unpaid labor day)
Producer
characteristics
Age of decision maker (producer) responsible for the focus crop,
grades of school completed, gender, years of experience growing
focus crop
Smoke ventilation in
cooking area Whether or not a vent or chimney is used to eliminate indoor smoke
Food Security The ability of all members of a farm household to obtain adequate
nutrition in a culturally appropriate and satisfying way each day.

Progress out of Poverty Index Synthesis Report 24
Appendix 2. PAT for Nicaragua
Survey Number ____________
USAID Poverty Assessment Tool, Nicaragua, October 2012
Client Assessment Survey - Nicaragua
Interviewer: Text in bold should be read aloud. Text in italics are instructions and should not be read aloud.
Fill out the information below before the survey begins. Do not ask the respondent for this information.
Date of Interview (dd-mm-yyyy)
Interviewer (code)
Branch (code)
Region 1 □ Managua Headquarters
2 □ Pacifico
3 □ Atlantico
4 □ Central
Client Location 0 □ Urban
1 □ Rural
Months in Program
Client or ID #
If person is desired respondent, read only the instructions marked 2.
If person is NOT desired respondent, read both 1 and 2 when desired respondent is located.
After he/she agrees, proceed with the text below.
1.
B.
Is [NAME]
female or
male?
C.
What is the relationship of [NAME]
to [HOUSEHOLD HEAD]?
D.
How old is
[NAME]?
Date___________ Initials ____________
Date___________ Initials ____________
Field Supervisor
First, I would like to ask you about your household. Let me tell you what we mean by 'household.' For our purposes today, members of a household
are those that usually live and eat together in this dwelling. It should include anyone who has lived in your house for 6 or more of the last 12 months,
as well as the person you identify as the head of household if he or she has been absent for more than 6 of the last 12 months and infants under 6
months of age who normally live and eat here. Do you have any questions about that?
2. The interview should only take about 20 minutes and your answers will be put together with answers from other households. All of your answers
are completely confidential and your name will not be given with your answers. Are you willing to answer these questions today?
Data Processor
Date___________ Initials ____________
You should use probing questions if necessary to elicit responses to all questions. If, however, a response is still not forthcoming, the following codes should be
used: 99 - not applicable; 98 - no response given.
Now I would like you to identify each person in your household and answer some basic questions about each person. Let's start with the names of
each person in your household. Shall I identify you as [name]?
If the respondent is reluctant to provide his or her name or those of others in the household, record relationships instead (ex: Respondent, Husband, etc).
Answer any questions the respondent has before proceeding.
Hello. My name is ___. I work for the organization ___. We are conducting a survey to learn a little bit more about the clients we work with. My
records indicate that [name] is the main point of contact between [organization] and your household. May I please speak to [name]?
1. Hello. My name is ___. I work for the organization ___. We are conducting a survey to learn a little bit more about the clients we work with. My
records indicate that you are the point of contact between [organization] and your household.
Quality Control Checks
Are you the head of the household or is someone else?
Use row 1 for respondent.
If not the respondent, record the Head of Household’s name next, then continue filling in column A with each household member before asking questions in the
remaining columns.
A.
Household Member's Name
E.
Ask only if age 7 or older
What is the highest diploma, certificate, or degree
[name] has obtained?

Progress out of Poverty Index Synthesis Report 25
Survey Number ____________
USAID Poverty Assessment Tool, Nicaragua, October 2012
Female .... 0
Male ….… 1
Head ……….......…................. 1
Spouse/partner .................. 2
Son/Daughter ......................… 3
Parents/parents-in-law …....... 4
Son/Daughter in law …........... 5
Grandchild/Great grandchild .. 6
Sister/Brother ..................... 7
Other relatives of head …....... 8
Unrelated ............................ 9
Domestic Worker .................. 10
Pensioner ........................... 11
(complete years)
If less than one year
old, write 0.
2. How many rooms does the household have?
(Do not include bathrooms, corridors, garages and the kitchen.) enter number
3. Where does this household obtain most of its water? 1 □Pipe inside the house
2!□Piping outside house but on property
3!□Public place
4!□Public or private well
5 □Water hole, spring
6!□River, stream, creek
7!□Tanker truck
8!□Lake or pond
9!□Another home, neighbor, business
10!□Other
4. What is the primary source of lighting used by this household? 1 □Electric power network
2!□Plant, electric generator
3!□Solar panel4!□Car battery
5!□Kerosene gas
6!□Candle
7!□Pine (ocote)
8!□Other
9!□None
5. What type of fuel is usually used for cooking? 1 □Firewood
2!□Butane or propane gas
3!□Coal or charcoal
4!□Kerosene
5!□Electricity
6!□Other
7!□No kitchen
14)
15)
1)
None …......……......................................………......…… 0
Preschool ………….............................................……… 1
Adult Education ……............................................…… 2
Primary School …………...........................................……….. 3
Secondary School………........................................……… 4
Basic Technical ……..............................................… 5
Intermediate Technical School …...........................… 6
Teacher Training ……..........................................……. 7
Superior Technical …..........................................…. 8
University ………........................................................ 9
Masters .............................................................. 10
Doctorate ............................................................. 11
Special Education ................................................ 12
13)
5)
2)
3)
4)
Now, I would like to ask you a few questions about your home.
6)
7)
8)
9)
10)
11)
12)

Progress out of Poverty Index Synthesis Report 26
Survey Number ____________
USAID Poverty Assessment Tool, Nicaragua, October 2012
6. How is most of the garbage disposed of in this household? 1 □Garbage truck
2!□Authorized container or dumpster
3!□Burning
4!□Burying
5!□Dumped in field, vacant lot, river, street
6!□In a field, vacant lot or waterway
7!□Pay to throw away
8!□Used as compost
9!□Other
7. What type of toilet facility is used by your household? 1 □Untreated toilet or latrine
2!□Treated toilet or latrine
3!□Connected to sewage pipes
4!□Connected to septic tank
5!□River or creek
6!□None
8. What is the primary material used in the exterior walls of the dwelling?
1 □Concrete blocks
2!□Quarry stone
3!□Reinforced concrete
4!□Concrete Slab
5!□Covintec panels
6!□Gypsum
7!□Laminated plycem, nicalit
8!□Concrete and wood (minifalda style)
9!□Concrete and other material
10!□Clay brick or block
11!□Adobe or Wattle & Daub
12!□Wood
13!□Zinc
14!□Bamboo, barul, cane, or palm
15!□Rubble or debris
16!□Other
9. What is the main construction material used for the floor of your dwelling?
1 □Cement brick, mosaic, terrazzo, or ceramic
2!□Pavement or concrete
3!□Mud brick
4!□Log
5!□Earth
6!□Other
Next, I would like to ask you about farming and animal raising activities.
10a. During the last 12 months, did any members of your household 0 □No
raise or tend any cattle? 1!□Yes
10b. How many cattle do you currently have?
number or "0" if 11a response was "0"
11a. Does your household own any small tools used for 0 □No
agriculture or forestry? 1!□Yes
11b. How many small tools used for agriculture or forestry does your household own?
number or "0" if 12a response was "0"
Look over the survey to see if you have missed any questions, then end the interview.
Those are all the questions I need to ask you today. Thank you for your time and effort in completing this survey.

Progress out of Poverty Index Synthesis Report 27
Appendix 3: PPI for Colombia

Progress out of Poverty Index Synthesis Report 28

Progress out of Poverty Index Synthesis Report 29
Appendix 4: Global OPHI MPI

Progress out of Poverty Index Synthesis Report 30