Profile Report - State - ACT · time conditions and achieved a college reportable composite score....
36
Profile Report - State Graduating Class 2017 West Virginia ACT, INC. -- CONFIDENTIAL *070086110*
Transcript of Profile Report - State - ACT · time conditions and achieved a college reportable composite score....
Profile Report - State
Graduating Class 2017
West Virginia
ACT, INC. -- CONFIDENTIAL*070086110*

ACT PROFILE REPORT- State
Graduating Class 2017 Code 499999
West Virginia
Total Students in Report: 12,011
New to your 2017 Profile Report
Though ACT will continue to report English, mathematics, reading, and science subject scores, beginning in September 2016, subscores such as rhetorical skills and arts/literature will be omitted. Instead, a comprehensive set of reporting categories aligned with ACT College and Career Readiness Standards and other standards that target college and career readiness will be included. This change will make it easier for students, parents, and educators to gain deeper insight into students’ performance and better understand strengths and areas for improvement in each subject. In this report, reporting category outcomes indicate the percentage of students with reporting category scores falling within associated ACT Readiness Ranges. These ranges reflect where a student who as met an associated ACT College Readiness Benchmark would typically perform in each reporting category.
ACT PROFILE REPORT - State PAGE 1
Graduating Class 2017 Code 499999
West Virginia
Total Students in Report: 12,011
Table of Contents
Section I: Executive Summary Page 5 Section III: College Readiness & Impact of Course Rigor Page 17
Average Composite Scores: 5 Years of Testing Percent of Students Meeting 3 or 4 College Readiness
Percent Meeting 3 or 4 Benchmarks: 5 Years of Testing Benchmarks by Core College Curriculum Status
Percent Meeting STEM Benchmark: 5 Years of Testing Percent of Students in College and Career Readiness Standards (CCRS)
Percent Taking A Core Curriculum: 5 Years of Testing Score Ranges
Five Year Trends—Percent of Students Who Met Percent of Students Who Met ACT College Readiness Benchmark Scores
College Readiness Benchmarks by Gender
Five Year Trends—Average ACT Scores Percent of Students Who Met ACT College Readiness Benchmark Scores
Five Year Trends—Average ACT Scores by Level of Preparation by Race/Ethnicity
Five Year Trends—Percent and Average Composite Score Likely ACT National Career Readiness Certificate (NCRC) Level
by Race/Ethnicity Based Upon ACT Composite Score
Five Year Trends—Achievement in STEM College Readiness Benchmark Percent and Average ACT Scores
Proficiency Toward Understanding Complex Text by Overall High School Curriculum
Average ACT College Reportable Scores by Test Session Duration College Readiness Benchmark Percent and Average ACT Scores
Percent of Students Who Met College Readiness Benchmark Scores by Content-Specific Curriculum
by Test Session Duration College Readiness Benchmark Percent and Average ACT Scores
by Common Course Patterns
Section II: Academic Achievement Page 11 College Readiness Benchmark Percent and Average ACT Scores
Average ACT Composite Scores by Race and Core Curriculum Status for Gender by Common Course Patterns
ACT Score Distributions, Cumulative Percents, and Averages
Subject Area Reporting Categories Section IV: Career and Educational Aspirations Page 25
Average ACT Composite Scores for Race/Ethnicity Average ACT Composite Scores
by Level of Preparation by Race and Student Postsecondary Aspirations
Average ACT Scores by Race/Ethnicity Distribution of Planned Educational Majors for All Students
Average ACT Composite Scores for Gender by Level of Preparation by College Plans
Average ACT Scores by Gender Average ACT Composite Scores for Racial/Ethnic Groups
ACT Score Quartile Values by Post-Secondary Educational Aspirations
Students' Score Report Preferences at Time of Testing
Section V: Optional Writing Test Results Page 31
Average ACT Writing Scores by Race/Ethnicity
Average ACT Writing and English/Language Arts Scores
by Race/Ethnicity and Gender for students who took ACT Writing

ACT PROFILE REPORT - State PAGE 2
Graduating Class 2017 Code 499999
West Virginia
Total Students in Report: 12,011
This report focuses on:
Performance - student test performance in the context of college readiness
Access - number of your graduates exposed to college entrance testing and the percent of race/ethnicity participation
Course Selection - percent of students pursuing a core curriculum
Course Rigor - impact of rigorous coursework on achievement
College Readiness - percent of students meeting ACT College Readiness Benchmark Scores in each content area
Awareness - extent to which student aspirations match performance
Articulation - colleges and universities to which your students send test results
We are pleased to provide this 2017 Graduating Class ACT Profile Report. This report summarizes the preparation and
performance of your 2017 graduates who took the ACT as sophomores, juniors, or seniors under standard- or extended-
time conditions and achieved a college reportable composite score. The most recent set of test information is used in your
report for students testing more than once.
Each year, test data for a school, district, and the state represents a different cohort of students. ACT encourages
educators to focus on trends (3, 5, 10 years), not year-to-year changes. Such changes can represent normal – even
expected – fluctuations. On the other hand, trend lines offer more insight into what is happening in a school, district, or
the state.
Furthermore, ACT encourages educators to measure student performance in the context of college readiness measures.
The focus should be on the number and percentage of students who met or exceeded ACT’s College Readiness
Benchmark Scores, a measure that is much more meaningful and understandable than an average composite score for a
group of students.
ACT PROFILE REPORT - State PAGE 3
Graduating Class 2017 Code 499999
West Virginia
Total Students in Report: 12,011
The ACT is a curriculum-based measure of college readiness. ACT components include:
Tests of academic achievement in English, math, reading, science, STEM, and writing (optional)
High school grade and course information
Student Profile Section
Career Interest Inventory
The ACT:
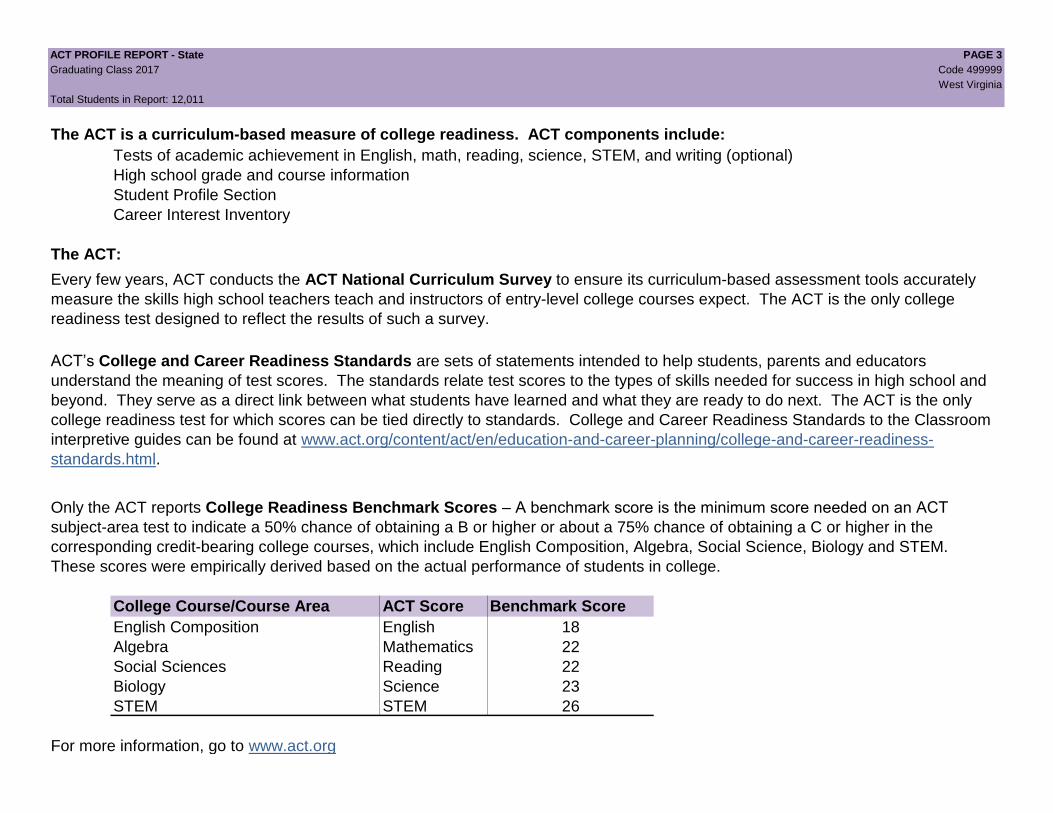
College Course/Course Area ACT Score Benchmark Score
English Composition English 18
Algebra Mathematics 22
Social Sciences Reading 22
Biology Science 23
STEM STEM 26
For more information, go to www.act.org
Every few years, ACT conducts the ACT National Curriculum Survey to ensure its curriculum-based assessment tools accurately
measure the skills high school teachers teach and instructors of entry-level college courses expect. The ACT is the only college
readiness test designed to reflect the results of such a survey.
ACT’s College and Career Readiness Standards are sets of statements intended to help students, parents and educators
understand the meaning of test scores. The standards relate test scores to the types of skills needed for success in high school and
beyond. They serve as a direct link between what students have learned and what they are ready to do next. The ACT is the only
college readiness test for which scores can be tied directly to standards. College and Career Readiness Standards to the Classroom
interpretive guides can be found at www.act.org/content/act/en/education-and-career-planning/college-and-career-readiness-
standards.html.
Only the ACT reports College Readiness Benchmark Scores – A benchmark score is the minimum score needed on an ACT
subject-area test to indicate a 50% chance of obtaining a B or higher or about a 75% chance of obtaining a C or higher in the
corresponding credit-bearing college courses, which include English Composition, Algebra, Social Science, Biology and STEM.
These scores were empirically derived based on the actual performance of students in college.
ACT PROFILE REPORT - State PAGE 4
Graduating Class 2017 Code 499999
West Virginia
Total Students in Report: 12,011
How to Improve Scores and Increase College Readiness
#1430
For more information on interpreting data in this report, or to learn how ACT can help your students improve their readiness for college and the
workplace, contact ACT Customer Service at 319-337-1365 or [email protected].
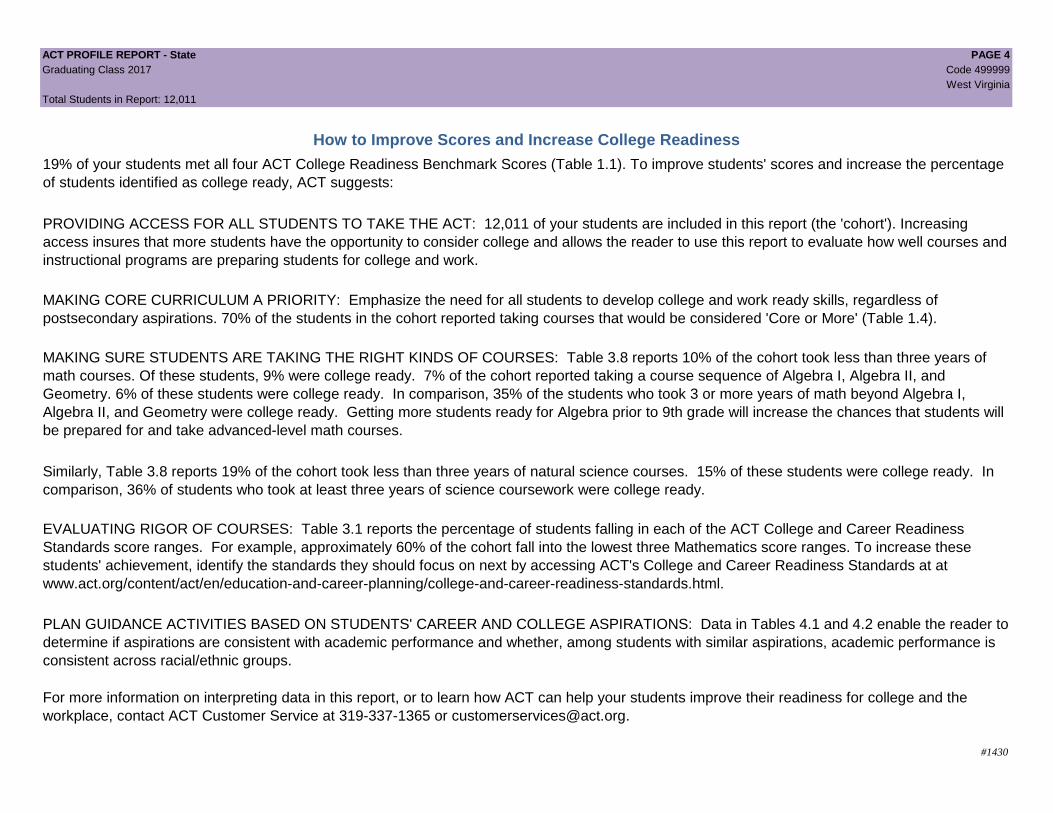
PLAN GUIDANCE ACTIVITIES BASED ON STUDENTS' CAREER AND COLLEGE ASPIRATIONS: Data in Tables 4.1 and 4.2 enable the reader to
determine if aspirations are consistent with academic performance and whether, among students with similar aspirations, academic performance is
consistent across racial/ethnic groups.
EVALUATING RIGOR OF COURSES: Table 3.1 reports the percentage of students falling in each of the ACT College and Career Readiness
Standards score ranges. For example, approximately 60% of the cohort fall into the lowest three Mathematics score ranges. To increase these
students' achievement, identify the standards they should focus on next by accessing ACT's College and Career Readiness Standards at at
www.act.org/content/act/en/education-and-career-planning/college-and-career-readiness-standards.html.
19% of your students met all four ACT College Readiness Benchmark Scores (Table 1.1). To improve students' scores and increase the percentage
of students identified as college ready, ACT suggests:
PROVIDING ACCESS FOR ALL STUDENTS TO TAKE THE ACT: 12,011 of your students are included in this report (the 'cohort'). Increasing
access insures that more students have the opportunity to consider college and allows the reader to use this report to evaluate how well courses and
instructional programs are preparing students for college and work.
MAKING CORE CURRICULUM A PRIORITY: Emphasize the need for all students to develop college and work ready skills, regardless of
postsecondary aspirations. 70% of the students in the cohort reported taking courses that would be considered 'Core or More' (Table 1.4).
MAKING SURE STUDENTS ARE TAKING THE RIGHT KINDS OF COURSES: Table 3.8 reports 10% of the cohort took less than three years of
math courses. Of these students, 9% were college ready. 7% of the cohort reported taking a course sequence of Algebra I, Algebra II, and
Geometry. 6% of these students were college ready. In comparison, 35% of the students who took 3 or more years of math beyond Algebra I,
Algebra II, and Geometry were college ready. Getting more students ready for Algebra prior to 9th grade will increase the chances that students will
be prepared for and take advanced-level math courses.
Similarly, Table 3.8 reports 19% of the cohort took less than three years of natural science courses. 15% of these students were college ready. In
comparison, 36% of students who took at least three years of science coursework were college ready.
ACT PROFILE REPORT - State: SECTION I, EXECUTIVE SUMMARY PAGE 5
Graduating Class 2017 Code 499999
West Virginia
Total Students in Report: 12,011
Section I
Executive Summary
To find the results of only standard time or extended time test takers, refer to Tables 1.8 and 1.9 on page 10.
Beginning in August of 2013, all students whose scores are college reportable, both standard and extended time tests, are now included.
Also beginning in August 2013 Graduating Class data, College Readiness Benchmarks for Reading and Science were updated to reflect the most recent
college coursework research.

ACT PROFILE REPORT - State: SECTION I, EXECUTIVE SUMMARY PAGE 6
Graduating Class 2017 Code 499999
West Virginia
Total Students in Report: 12,011
Figure 1.1. Average Composite Scores: 5 Years of Testing* Figure 1.2. Percent Meeting 3 or 4 Benchmarks: 5 Years of Testing*
Figure 1.3. Percent Meeting STEM Benchmark: 5 Years of Testing* Figure 1.4. Percent Taking A Core Curriculum: 5 Years of Testing*
* Missing columns in above graphs reflect years in which no students were tested.
20.6 20.6 20.8 20.7 20.4 20.9 21.0 21.0 20.8 21.0
1
6
11
16
21
26
31
36
2012-2013 2013-2014 2014-2015 2015-2016 2016-2017
Avera
ge A
CT
Score
State National
35 34 36 35 33 39 39 40 38 39
0
10
20
30
40
50
60
70
80
90
100
2012-2013 2013-2014 2014-2015 2015-2016 2016-2017
Perc
ent
State National
11 12 12 12 11
19 20 20 20 21
0
10
20
30
40
50
60
70
80
90
100
2012-2013 2013-2014 2014-2015 2015-2016 2016-2017
Perc
ent
State National
81
17
77
19
78
20
73
25
70
28
74
22
73
22
72
22
69
23
68
23
0
10
20
30
40
50
60
70
80
90
100
Core LessThanCore
Core LessThanCore
Core LessThanCore
Core LessThanCore
Core LessThanCore
Perc
ent
State National
2012-2013 2013-2014 2014-2015 2015-2016 2016-2017

ACT PROFILE REPORT - State: SECTION I, EXECUTIVE SUMMARY PAGE 7
Graduating Class 2017 Code 499999
West Virginia
Total Students in Report: 12,011
Table 1.1. Five Year Trends—Percent of Students Who Met College Readiness Benchmarks
Percent Who Met Benchmarks
English Mathematics Reading Science Met All Four
Year State National State National State National State National State National State National
2013 11,426 1,799,243 69 64 33 44 45 44 34 36 20 26
2014 11,191 1,845,787 68 64 31 43 45 44 32 37 19 26
2015 11,289 1,924,436 69 64 34 42 48 46 34 38 21 28
2016 11,682 2,090,342 67 61 32 41 46 44 33 36 20 26
2017 12,011 2,030,038 64 61 30 41 47 47 32 37 19 27
Table 1.2. Five Year Trends—Average ACT Scores
Average ACT Scores
English Mathematics Reading Science Composite
Year State National State National State National State National State National State National
2013 11,426 1,799,243 20.5 20.2 19.5 20.9 21.3 21.1 20.6 20.7 20.6 20.9
2014 11,191 1,845,787 20.4 20.3 19.5 20.9 21.4 21.3 20.6 20.8 20.6 21.0
2015 11,289 1,924,436 20.6 20.4 19.7 20.8 21.5 21.4 20.7 20.9 20.8 21.0
2016 11,682 2,090,342 20.5 20.1 19.6 20.6 21.5 21.3 20.7 20.8 20.7 20.8
2017 12,011 2,030,038 20.0 20.3 19.4 20.7 21.2 21.4 20.5 21.0 20.4 21.0
Table 1.3. Five Year Trends—Average ACT Scores Nationwide
Average ACT Scores
Year English Mathematics Reading Science Composite
2013 1,799,243 20.2 20.9 21.1 20.7 20.9
2014 1,845,787 20.3 20.9 21.3 20.8 21.0
2015 1,924,436 20.4 20.8 21.4 20.9 21.0
2016 2,090,342 20.1 20.6 21.3 20.8 20.8
2017 2,030,038 20.3 20.7 21.4 21.0 21.0
Number of Students
Tested
Number of Students
Tested
Number of Students
Tested

ACT PROFILE REPORT - State: SECTION I, EXECUTIVE SUMMARY PAGE 8
Graduating Class 2017 Code 499999
West Virginia
Total Students in Report: 12,011
Table 1.4. Five Year Trends—Average ACT Scores by Level of Preparation
Average ACT Scores
Number of
Students Tested Percent2
English Mathematics Reading Science Composite
Year
Core or
More1
Less than
Core
Core
or
More
Less
than
Core
Core or
More
Less than
Core
Core or
More
Less than
Core
Core or
More
Less than
Core
Core or
More
Less than
Core
Core or
More
Less than
Core
2013 9,226 1,962 81 17 21.1 18.1 20.0 17.4 21.9 19.2 21.1 18.6 21.2 18.4
2014 8,656 2,181 77 19 21.2 18.0 20.2 17.3 22.0 19.3 21.2 18.4 21.3 18.4
2015 8,775 2,296 78 20 21.4 18.2 20.4 17.7 22.2 19.5 21.3 18.7 21.4 18.7
2016 8,484 2,865 73 25 21.3 18.7 20.3 17.8 22.2 19.8 21.4 19.0 21.5 19.0
2017 8,360 3,326 70 28 20.9 18.1 20.2 17.6 22.0 19.5 21.3 18.8 21.2 18.61"Core or More" results correspond to students taking four or more years of English AND three or more years each of math, social studies, and natural science.
2Percent of all students tested. Numbers will not add up to 100% due to student non-response.
Table 1.5. Five Year Trends—Percent and Average Composite Score by Race/Ethnicity
2013 2014 2015 2016 2017
Race/Ethnicity N % Avg N % Avg N % Avg N % Avg N % Avg
All Students 11,426 100 20.6 11,191 100 20.6 11,289 100 20.8 11,682 100 20.7 12,011 100 20.4
Black/African American 422 4 17.5 397 4 17.1 382 3 17.6 393 3 17.7 433 4 17.5
American Indian/Alaska Native 19 0 20.2 29 0 19.3 25 0 18.6 40 0 17.3 32 0 17.7
White 9,939 87 20.7 9,792 87 20.7 9,835 87 20.9 10,089 86 20.8 10,305 86 20.6
Hispanic/Latino 231 2 20.5 204 2 20.3 205 2 19.9 245 2 20.0 300 2 19.6
Asian 91 1 23.5 97 1 24.1 99 1 24.5 99 1 24.5 116 1 23.6
Native Hawaiian/Other Pacific Islander 8 0 20.3 5 0 21.2 13 0 19.8 10 0 20.6 7 0 20.3
Two or more races 402 4 20.4 380 3 20.5 421 4 20.5 463 4 20.4 511 4 19.7
Prefer not to respond/No response 314 3 20.2 287 3 20.7 309 3 20.6 343 3 20.9 307 3 19.9

ACT PROFILE REPORT - State: SECTION I, EXECUTIVE SUMMARY PAGE 9
Graduating Class 2017 Code 499999
West Virginia
Total Students in Report: 12,011
Table 1.6. Five Year Trends—Achievement in STEM1
All Tested Students Students Meeting STEM Benchmarks
Number of
Students Tested Avg. STEM Score Percent Meeting STEM Benchmark Avg. Mathematics Score Avg. Science Score
Year State National State National State National State National State National
2013 11,426 1,799,243 20.3 21.1 11 19 27.5 28.7 28.0 28.0
2014 11,191 1,845,787 20.3 21.1 12 20 27.5 28.7 28.3 28.3
2015 11,289 1,924,436 20.5 21.1 12 20 27.6 28.7 28.3 28.4
2016 11,682 2,090,342 20.4 20.9 12 20 27.6 28.7 28.4 28.6
2017 12,011 2,030,038 20.2 21.1 11 21 27.5 28.7 28.3 28.71The STEM score describes students' overall proficiency in mathematics and science.
Table 1.7. Proficiency In Understanding Complex Texts1
Text Complexity Proficiency Level
Below Proficient Proficient Above Proficient
N Percent Avg. Reading N Percent Avg. Reading N Percent Avg. Reading
Year State National State National State National State National State National State National State National State National State National
2013 0 0 . . . . 0 0 . . . . 0 0 . . . .
2014 0 0 . . . . 0 0 . . . . 0 0 . . . .
2015 0 0 . . . . 0 0 . . . . 0 0 . . . .
2016 5,272 485,762 45 23 17.2 17.0 3,330 322,548 29 15 23.4 23.6 1,593 235,380 14 11 29.6 30.3
2017 5,958 999,708 50 49 16.9 16.2 4,049 596,096 34 29 23.3 23.4 1,967 427,075 16 21 29.9 30.81The text complexity indicator, beginning in Fall 2015, represents students' progress toward understanding complex written material often encountered in college and careers.

ACT PROFILE REPORT - State: SECTION I, EXECUTIVE SUMMARY PAGE 10
Graduating Class 2017 Code 499999
West Virginia
Total Students in Report: 12,011
Table 1.8. Average ACT College Reportable Scores by Test Session Duration
Average ACT Scores
N Percent English Mathematics Reading Science Composite
Standard Time 11,677 97 20.1 19.5 21.3 20.6 20.5
Extended Time 334 3 15.7 16.8 17.9 17.8 17.2
Total 12,011 100 20.0 19.4 21.2 20.5 20.4
Standard Time 1,927,386 95 20.5 20.8 21.5 21.1 21.1
Extended Time 102,652 5 17.5 18.5 19.5 18.9 18.7
Total 2,030,038 100 20.3 20.7 21.4 21.0 21.0
Table 1.9. Percent of Students Who Met College Readiness Benchmark Scores by Test Session Duration
Percent of Students Met
English Mathematics Reading Science All Four
Standard Time 64 30 47 32 19
Extended Time 35 13 30 15 10
Total 64 30 47 32 19
Standard Time 63 41 48 38 28
Extended Time 42 25 36 26 19
Total 61 41 47 37 27
State
National
Student GroupTest Session
Duration
State
National
Student GroupTest Session
Duration
ACT PROFILE REPORT- State: SECTION II, ACADEMIC ACHIEVEMENT PAGE 11
Graduating Class 2017 Code 499999
West Virginia
Total Students in Report: 12,011
Section II
Academic Achievement
Beginning with the Graduating Class of 2013, all students whose scores are college reportable, both standard and extended time tests, are now included.
Also beginning with the 2013 Graduating Class data, College Readiness Benchmarks for Reading and Science were updated to reflect the most recent
college coursework research.
ACT PROFILE REPORT - State: SECTION II, ACADEMIC ACHIEVEMENT PAGE 12
Graduating Class 2017 Code 499999
West Virginia
Total Students in Report: 12,011
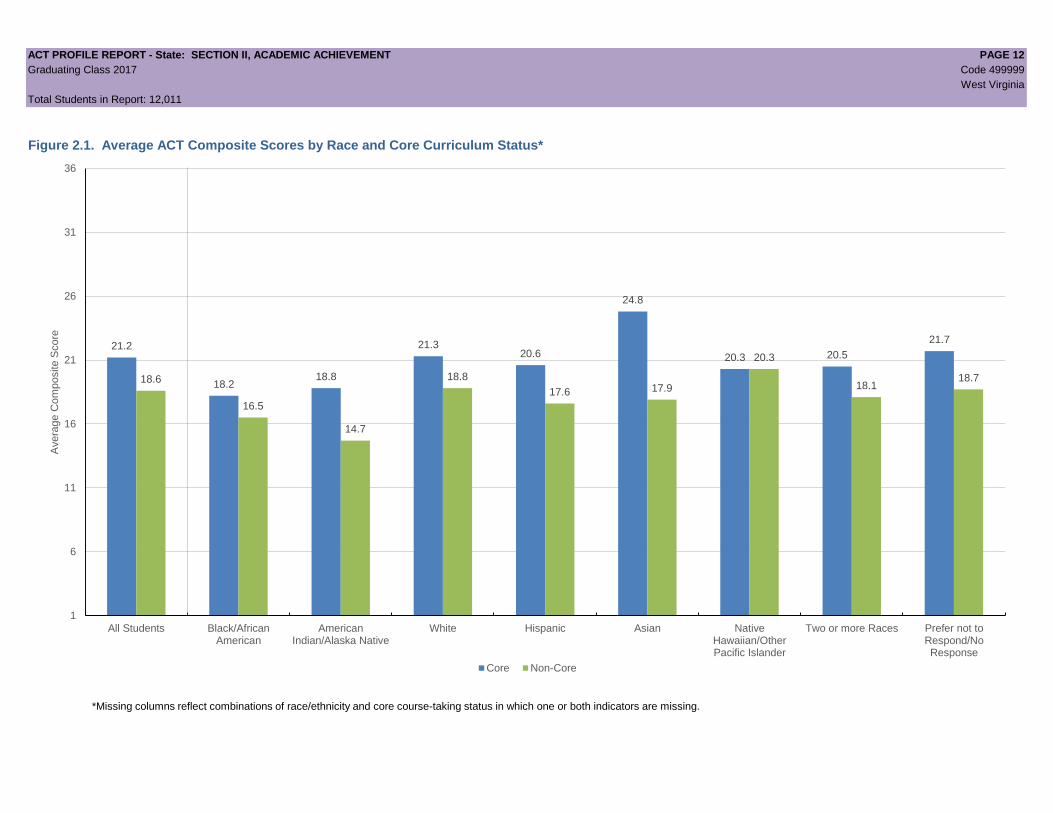
Figure 2.1. Average ACT Composite Scores by Race and Core Curriculum Status*
21.2
18.2 18.8
21.3 20.6
24.8
20.3 20.5
21.7
18.6
16.5
14.7
18.8
17.6 17.9
20.3
18.1 18.7
1
6
11
16
21
26
31
36
All Students Black/AfricanAmerican
AmericanIndian/Alaska Native
White Hispanic Asian NativeHawaiian/OtherPacific Islander
Two or more Races Prefer not toRespond/NoResponse
Avera
ge C
om
posite S
core
Core Non-Core
*Missing columns reflect combinations of race/ethnicity and core course-taking status in which one or both indicators are missing.
ACT PROFILE REPORT- State: SECTION II, ACADEMIC ACHIEVEMENT PAGE 13
Graduating Class 2017 Code 499999
West Virginia
Total Students in Report: 12,011
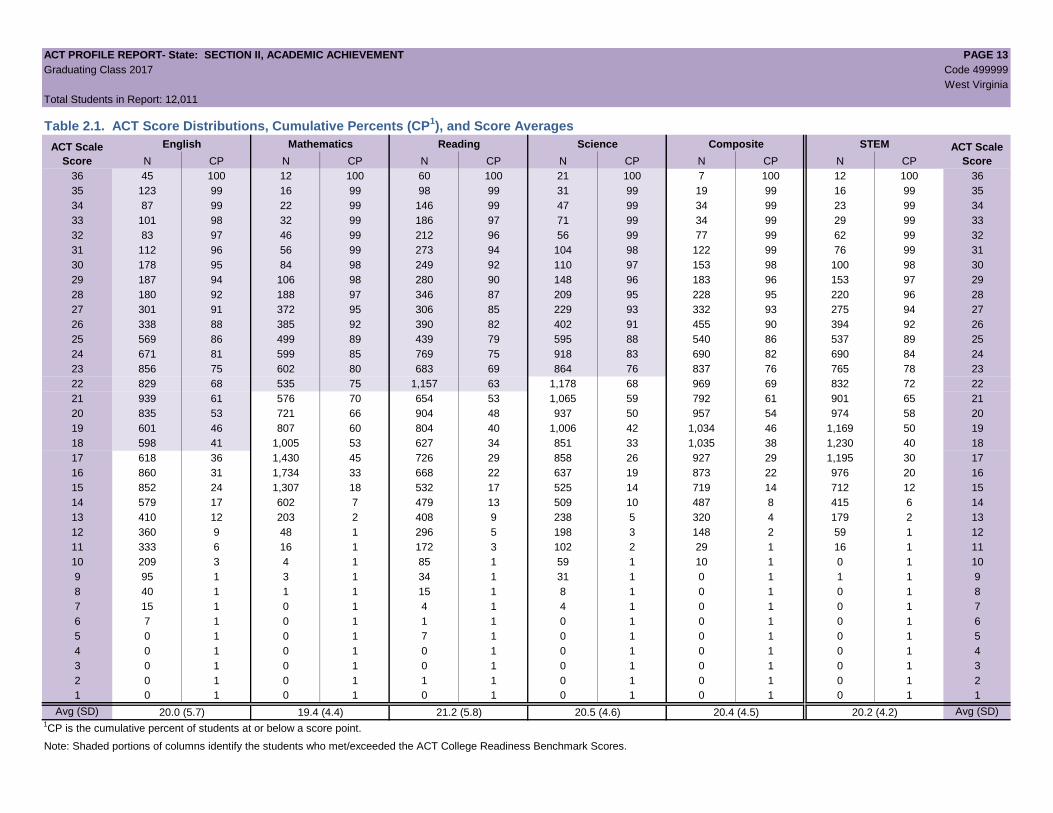
Table 2.1. ACT Score Distributions, Cumulative Percents (CP1), and Score Averages
English Mathematics Reading Science Composite STEM
N CP N CP N CP N CP N CP N CP
36 45 100 12 100 60 100 21 100 7 100 12 100 36
35 123 99 16 99 98 99 31 99 19 99 16 99 35
34 87 99 22 99 146 99 47 99 34 99 23 99 34
33 101 98 32 99 186 97 71 99 34 99 29 99 33
32 83 97 46 99 212 96 56 99 77 99 62 99 32
31 112 96 56 99 273 94 104 98 122 99 76 99 31
30 178 95 84 98 249 92 110 97 153 98 100 98 30
29 187 94 106 98 280 90 148 96 183 96 153 97 29
28 180 92 188 97 346 87 209 95 228 95 220 96 28
27 301 91 372 95 306 85 229 93 332 93 275 94 27
26 338 88 385 92 390 82 402 91 455 90 394 92 26
25 569 86 499 89 439 79 595 88 540 86 537 89 25
24 671 81 599 85 769 75 918 83 690 82 690 84 24
23 856 75 602 80 683 69 864 76 837 76 765 78 23
22 829 68 535 75 1,157 63 1,178 68 969 69 832 72 22
21 939 61 576 70 654 53 1,065 59 792 61 901 65 21
20 835 53 721 66 904 48 937 50 957 54 974 58 20
19 601 46 807 60 804 40 1,006 42 1,034 46 1,169 50 19
18 598 41 1,005 53 627 34 851 33 1,035 38 1,230 40 18
17 618 36 1,430 45 726 29 858 26 927 29 1,195 30 17
16 860 31 1,734 33 668 22 637 19 873 22 976 20 16
15 852 24 1,307 18 532 17 525 14 719 14 712 12 15
14 579 17 602 7 479 13 509 10 487 8 415 6 14
13 410 12 203 2 408 9 238 5 320 4 179 2 13
12 360 9 48 1 296 5 198 3 148 2 59 1 12
11 333 6 16 1 172 3 102 2 29 1 16 1 11
10 209 3 4 1 85 1 59 1 10 1 0 1 10
9 95 1 3 1 34 1 31 1 0 1 1 1 9
8 40 1 1 1 15 1 8 1 0 1 0 1 8
7 15 1 0 1 4 1 4 1 0 1 0 1 7
6 7 1 0 1 1 1 0 1 0 1 0 1 6
5 0 1 0 1 7 1 0 1 0 1 0 1 5
4 0 1 0 1 0 1 0 1 0 1 0 1 4
3 0 1 0 1 0 1 0 1 0 1 0 1 3
2 0 1 0 1 1 1 0 1 0 1 0 1 2
1 0 1 0 1 0 1 0 1 0 1 0 1 1
Avg (SD) 20.0 (5.7) 19.4 (4.4) 21.2 (5.8) 20.5 (4.6) 20.4 (4.5) 20.2 (4.2) Avg (SD)1CP is the cumulative percent of students at or below a score point.
Note: Shaded portions of columns identify the students who met/exceeded the ACT College Readiness Benchmark Scores.
ACT Scale
Score
ACT Scale
Score
ACT PROFILE REPORT - State: SECTION II, ACADEMIC ACHIEVEMENT PAGE 14
Graduating Class 2017 Code 499999
West Virginia
Total Students in Report: 12,011
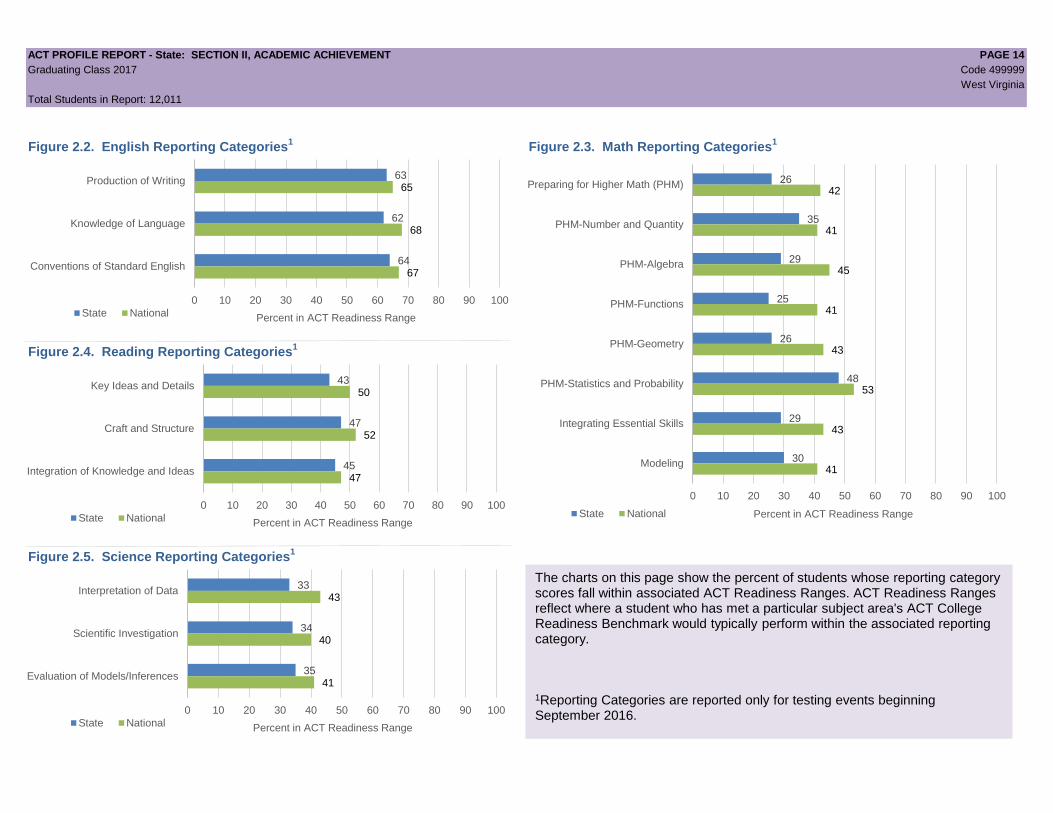
Figure 2.2. English Reporting Categories1
Figure 2.3. Math Reporting Categories1
Figure 2.4. Reading Reporting Categories1
Figure 2.5. Science Reporting Categories1
63
62
64
65
68
67
0 10 20 30 40 50 60 70 80 90 100
Production of Writing
Knowledge of Language
Conventions of Standard English
Percent in ACT Readiness Range State National
26
35
29
25
26
48
29
30
42
41
45
41
43
53
43
41
0 10 20 30 40 50 60 70 80 90 100
Preparing for Higher Math (PHM)
PHM-Number and Quantity
PHM-Algebra
PHM-Functions
PHM-Geometry
PHM-Statistics and Probability
Integrating Essential Skills
Modeling
Percent in ACT Readiness Range State National
The charts on this page show the percent of students whose reporting category scores fall within associated ACT Readiness Ranges. ACT Readiness Ranges reflect where a student who has met a particular subject area's ACT College Readiness Benchmark would typically perform within the associated reporting category. 1Reporting Categories are reported only for testing events beginning September 2016.
43
47
45
50
52
47
0 10 20 30 40 50 60 70 80 90 100
Key Ideas and Details
Craft and Structure
Integration of Knowledge and Ideas
Percent in ACT Readiness Range State National
33
34
35
43
40
41
0 10 20 30 40 50 60 70 80 90 100
Interpretation of Data
Scientific Investigation
Evaluation of Models/Inferences
Percent in ACT Readiness Range State National

ACT PROFILE REPORT- State: SECTION II, ACADEMIC ACHIEVEMENT PAGE 15
Graduating Class 2017 Code 499999
West Virginia
Total Students in Report: 12,011
Table 2.2. Average ACT Composite Scores for Race/Ethnicity by Level of Preparation
Student Number of Percent Taking Average ACT Composite Score
Group Race/Ethnicity Students Tested Core or More1
Core or More Less Than CoreAll Students 12,011 70 21.2 18.6
Black/African American 433 62 18.2 16.5
American Indian/Alaska Native 32 75 18.8 14.7
White 10,305 71 21.3 18.8
Hispanic/Latino 300 66 20.6 17.6
Asian 116 82 24.8 17.9
Native Hawaiian/Other Pac. Isl. 7 57 20.3 20.3
Two or More Races 511 68 20.5 18.1
Prefer not/No Response 307 50 21.7 18.7
All Students 2,030,038 68 22.1 18.9
Black/African American 256,756 63 17.9 16.0
American Indian/Alaska Native 16,135 54 18.7 16.4
White 1,062,439 72 23.4 20.2
Hispanic/Latino 347,906 66 19.8 17.4
Asian 96,097 78 25.0 22.5
Native Hawaiian/Other Pac. Isl. 6,503 58 20.0 16.5
Two or More Races 86,119 68 22.2 19.3
Prefer not/No Response 158,083 46 22.6 18.31"Core or More" results correspond to students taking four or more years of English AND three or more years each of math, social studies, and natural science.
Table 2.3. Average ACT Scores by Race/Ethnicity
Student
Group Race/Ethnicity N Percent English Mathematics Reading Science Composite STEMAll Students 12,011 100 20.0 19.4 21.2 20.5 20.4 20.2
Black/African American 433 4 16.5 17.2 18.0 17.9 17.5 17.8
American Indian/Alaska Native 32 0 16.4 18.0 17.6 18.5 17.7 18.4
White 10,305 86 20.2 19.5 21.4 20.7 20.6 20.3
Hispanic/Latino 300 2 19.0 18.5 20.6 19.6 19.6 19.3
Asian 116 1 23.3 24.0 23.1 23.4 23.6 23.9
Native Hawaiian/Other Pac. Isl. 7 0 18.0 20.7 21.4 20.7 20.3 21.0
Two or More Races 511 4 19.1 18.8 20.5 19.8 19.7 19.5
Prefer not/No Response 307 3 19.2 18.9 21.0 19.9 19.9 19.6
All Students 2,030,038 100 20.3 20.7 21.4 21.0 21.0 21.1
Black/African American 256,756 13 16.0 17.1 17.4 17.4 17.1 17.5
American Indian/Alaska Native 16,135 1 16.1 17.6 18.0 18.0 17.5 18.0
White 1,062,439 52 22.1 21.9 23.0 22.3 22.4 22.3
Hispanic/Latino 347,906 17 17.7 18.9 19.3 19.1 18.9 19.2
Asian 96,097 5 23.7 25.2 23.9 24.0 24.3 24.9
Native Hawaiian/Other Pac. Isl. 6,503 0 17.2 18.6 18.6 18.7 18.4 18.9
Two or More Races 86,119 4 20.6 20.7 21.9 21.2 21.2 21.2
Prefer not/No Response 158,083 8 19.5 20.1 20.8 20.3 20.3 20.5
National
State
National
State
ACT PROFILE REPORT- State: SECTION II, ACADEMIC ACHIEVEMENT PAGE 16
Graduating Class 2017 Code 499999
West Virginia
Total Students in Report: 12,011
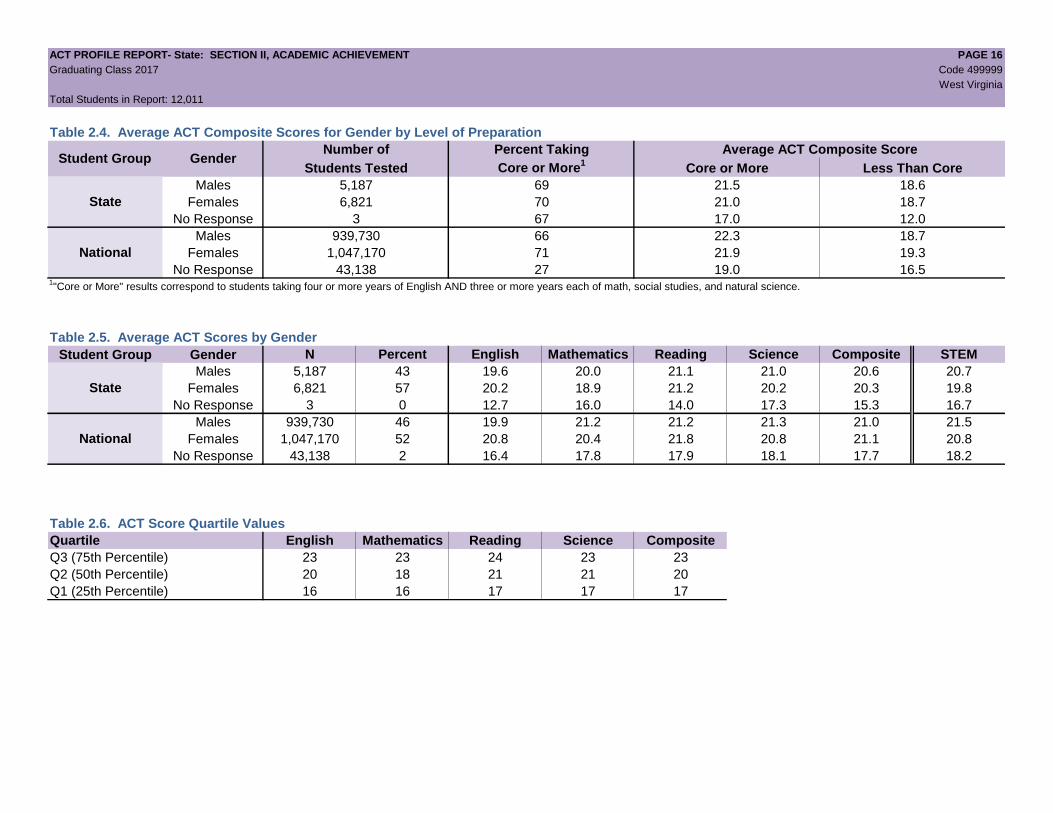
Table 2.4. Average ACT Composite Scores for Gender by Level of Preparation
Number of Percent Taking Average ACT Composite Score
Students Tested Core or More1
Core or More Less Than Core
Males 5,187 69 21.5 18.6
Females 6,821 70 21.0 18.7
No Response 3 67 17.0 12.0
Males 939,730 66 22.3 18.7
Females 1,047,170 71 21.9 19.3
No Response 43,138 27 19.0 16.51"Core or More" results correspond to students taking four or more years of English AND three or more years each of math, social studies, and natural science.
Table 2.5. Average ACT Scores by Gender
Student Group Gender N Percent English Mathematics Reading Science Composite STEM
Males 5,187 43 19.6 20.0 21.1 21.0 20.6 20.7
Females 6,821 57 20.2 18.9 21.2 20.2 20.3 19.8
No Response 3 0 12.7 16.0 14.0 17.3 15.3 16.7
Males 939,730 46 19.9 21.2 21.2 21.3 21.0 21.5
Females 1,047,170 52 20.8 20.4 21.8 20.8 21.1 20.8
No Response 43,138 2 16.4 17.8 17.9 18.1 17.7 18.2
Table 2.6. ACT Score Quartile Values
Quartile English Mathematics Reading Science Composite
Q3 (75th Percentile) 23 23 24 23 23
Q2 (50th Percentile) 20 18 21 21 20
Q1 (25th Percentile) 16 16 17 17 17
National
Student Group Gender
State
National
State

ACT PROFILE REPORT - State: SECTION III, COLLEGE AND CAREER READINESS & THE IMPACT OF COURSE RIGOR PAGE 17
Graduating Class 2017 Code 499999
West Virginia
Total Students in Report: 12,011
Section III
College and Career Readiness
and the Impact of Course Rigor
Beginning with the Graduating Class of 2013, all students whose scores are college reportable, both standard and extended time tests, are now included.
Also beginning with the 2013 Graduating Class data, College Readiness Benchmarks for Reading and Science were updated to reflect the most recent
college coursework research.
ACT PROFILE REPORT - State: SECTION III, COLLEGE AND CAREER READINESS AND THE IMPACT OF COURSE RIGOR PAGE 18
Graduating Class 2017 Code 499999
West Virginia
Total Students in Report: 12,011
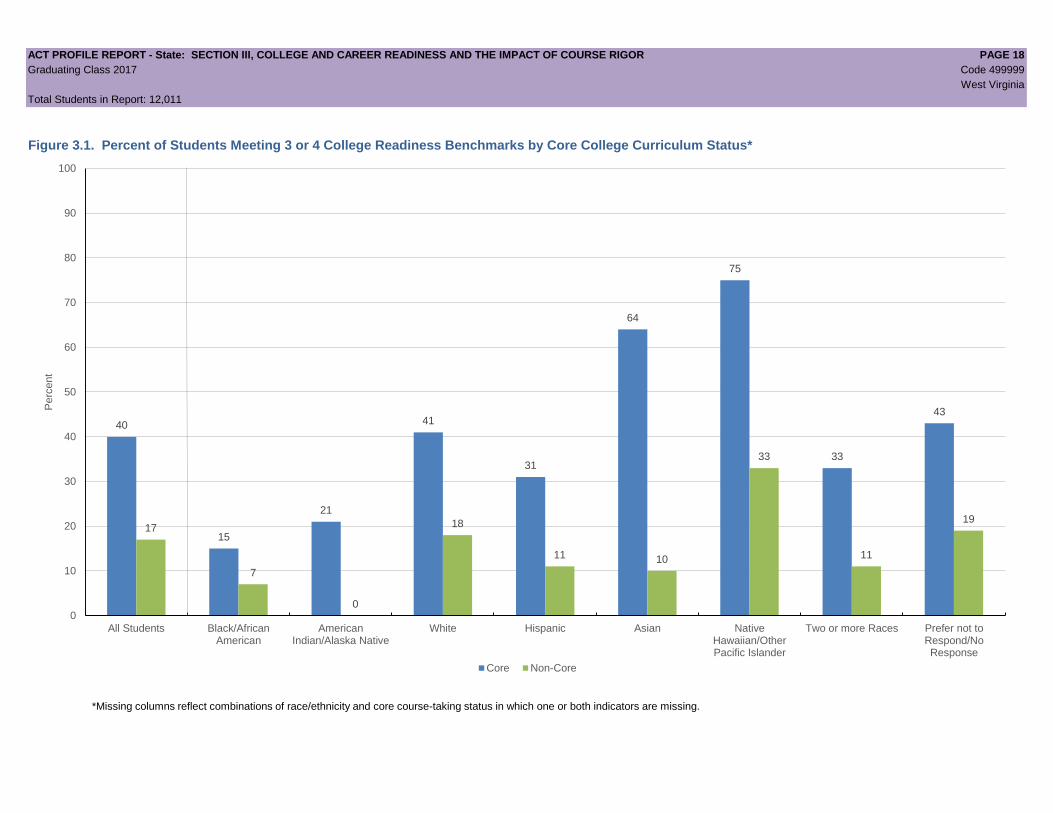
Figure 3.1. Percent of Students Meeting 3 or 4 College Readiness Benchmarks by Core College Curriculum Status*
40
15
21
41
31
64
75
33
43
17
7
0
18
11 10
33
11
19
0
10
20
30
40
50
60
70
80
90
100
All Students Black/AfricanAmerican
AmericanIndian/Alaska Native
White Hispanic Asian NativeHawaiian/OtherPacific Islander
Two or more Races Prefer not toRespond/NoResponse
Perc
ent
Core Non-Core
*Missing columns reflect combinations of race/ethnicity and core course-taking status in which one or both indicators are missing.

ACT PROFILE REPORT - State: SECTION III, COLLEGE AND CAREER READINESS & THE IMPACT OF COURSE RIGOR PAGE 19
Graduating Class 2017 Code 499999
West Virginia
Total Students in Report: 12,011
Table 3.1. Percent of Students in College and Career Readiness Standards (CCRS) Score Ranges
Student English Mathematics Reading Science
Group N % N % N % N %
33 to 36 356 3 82 1 490 4 170 1
28 to 32 740 6 480 4 1,360 11 627 5
24 to 27 1,879 16 1,855 15 1,904 16 2,144 18
20 to 23 3,459 29 2,434 20 3,398 28 4,044 34
16 to 19 2,677 22 4,976 41 2,825 24 3,352 28
13 to 15 1,841 15 2,112 18 1,419 12 1,272 11
01 to 12 1,059 9 72 1 615 5 402 3
33 to 36 136,676 7 61,071 3 141,382 7 79,636 4
28 to 32 180,218 9 192,088 9 276,868 14 159,638 8
24 to 27 304,755 15 404,500 20 287,704 14 371,660 18
20 to 23 454,612 22 329,804 16 472,133 23 580,793 29
16 to 19 372,731 18 686,547 34 426,969 21 513,876 25
13 to 15 307,497 15 332,337 16 274,775 14 227,206 11
01 to 12 273,549 13 23,691 1 150,207 7 97,229 5
Table 3.2. Percent of Students Who Met College Readiness Benchmark Scores by Gender
Percent of Students Met
English Mathematics Reading Science All Four
Males 61 35 46 36 23
Females 65 26 47 28 17
No Response 0 0 0 0 0
Males 59 44 46 40 29
Females 65 39 49 35 26
No Response 37 19 24 18 10
National
Student Group
CCRS
Range
State
National
Gender
State
ACT PROFILE REPORT - State: SECTION III, COLLEGE AND CAREER READINESS & THE IMPACT OF COURSE RIGOR PAGE 20
Graduating Class 2017 Code 499999
West Virginia
Total Students in Report: 12,011
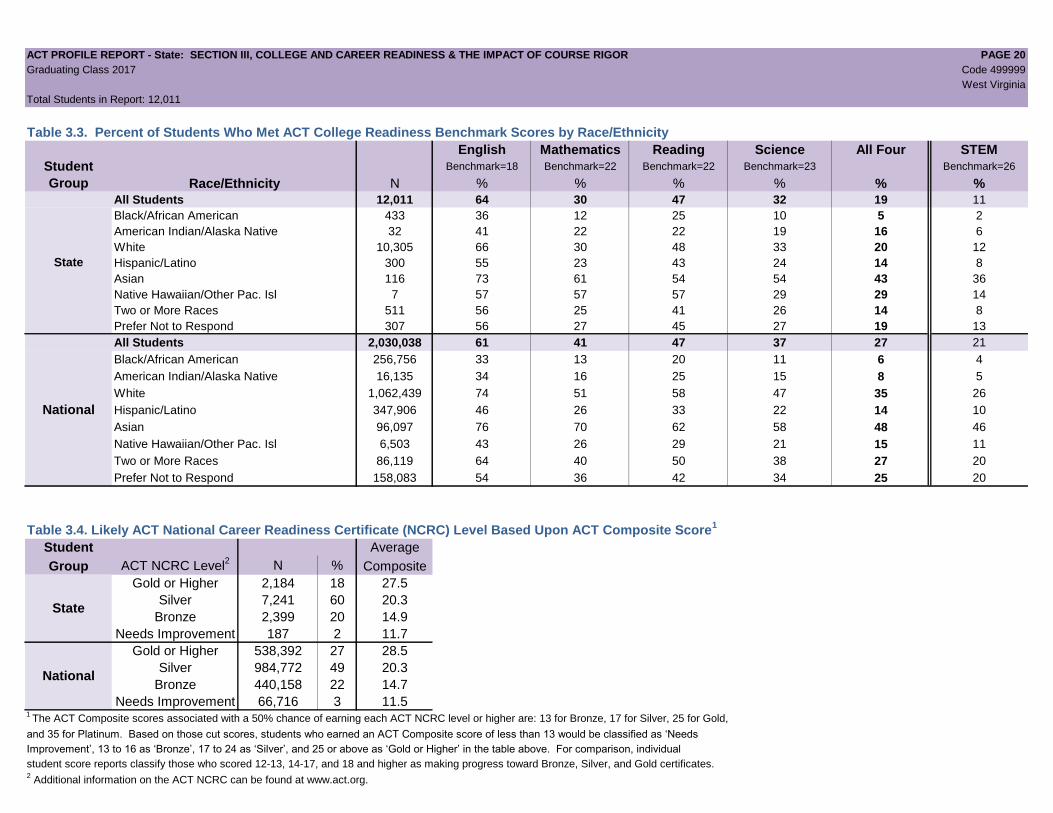
Table 3.3. Percent of Students Who Met ACT College Readiness Benchmark Scores by Race/Ethnicity
English Mathematics Reading Science All Four STEM
Student Benchmark=18 Benchmark=22 Benchmark=22 Benchmark=23 Benchmark=26
Group Race/Ethnicity N % % % % % %
All Students 12,011 64 30 47 32 19 11
Black/African American 433 36 12 25 10 5 2
American Indian/Alaska Native 32 41 22 22 19 16 6
White 10,305 66 30 48 33 20 12
Hispanic/Latino 300 55 23 43 24 14 8
Asian 116 73 61 54 54 43 36
Native Hawaiian/Other Pac. Isl 7 57 57 57 29 29 14
Two or More Races 511 56 25 41 26 14 8
Prefer Not to Respond 307 56 27 45 27 19 13
All Students 2,030,038 61 41 47 37 27 21
Black/African American 256,756 33 13 20 11 6 4
American Indian/Alaska Native 16,135 34 16 25 15 8 5
White 1,062,439 74 51 58 47 35 26
Hispanic/Latino 347,906 46 26 33 22 14 10
Asian 96,097 76 70 62 58 48 46
Native Hawaiian/Other Pac. Isl 6,503 43 26 29 21 15 11
Two or More Races 86,119 64 40 50 38 27 20
Prefer Not to Respond 158,083 54 36 42 34 25 20
Table 3.4. Likely ACT National Career Readiness Certificate (NCRC) Level Based Upon ACT Composite Score1
Student Average
Group ACT NCRC Level2
N % Composite
Gold or Higher 2,184 18 27.5
Silver 7,241 60 20.3
Bronze 2,399 20 14.9
Needs Improvement 187 2 11.7
Gold or Higher 538,392 27 28.5
Silver 984,772 49 20.3
Bronze 440,158 22 14.7
Needs Improvement 66,716 3 11.51
The ACT Composite scores associated with a 50% chance of earning each ACT NCRC level or higher are: 13 for Bronze, 17 for Silver, 25 for Gold,
and 35 for Platinum. Based on those cut scores, students who earned an ACT Composite score of less than 13 would be classified as ‘Needs
Improvement’, 13 to 16 as ‘Bronze’, 17 to 24 as ‘Silver’, and 25 or above as ‘Gold or Higher’ in the table above. For comparison, individual
student score reports classify those who scored 12-13, 14-17, and 18 and higher as making progress toward Bronze, Silver, and Gold certificates.2 Additional information on the ACT NCRC can be found at www.act.org.
State
National
State
National
ACT PROFILE REPORT - State: SECTION III, COLLEGE AND CAREER READINESS & THE IMPACT OF COURSE RIGOR PAGE 21
Graduating Class 2017 Code 499999
West Virginia
Total Students in Report: 12,011
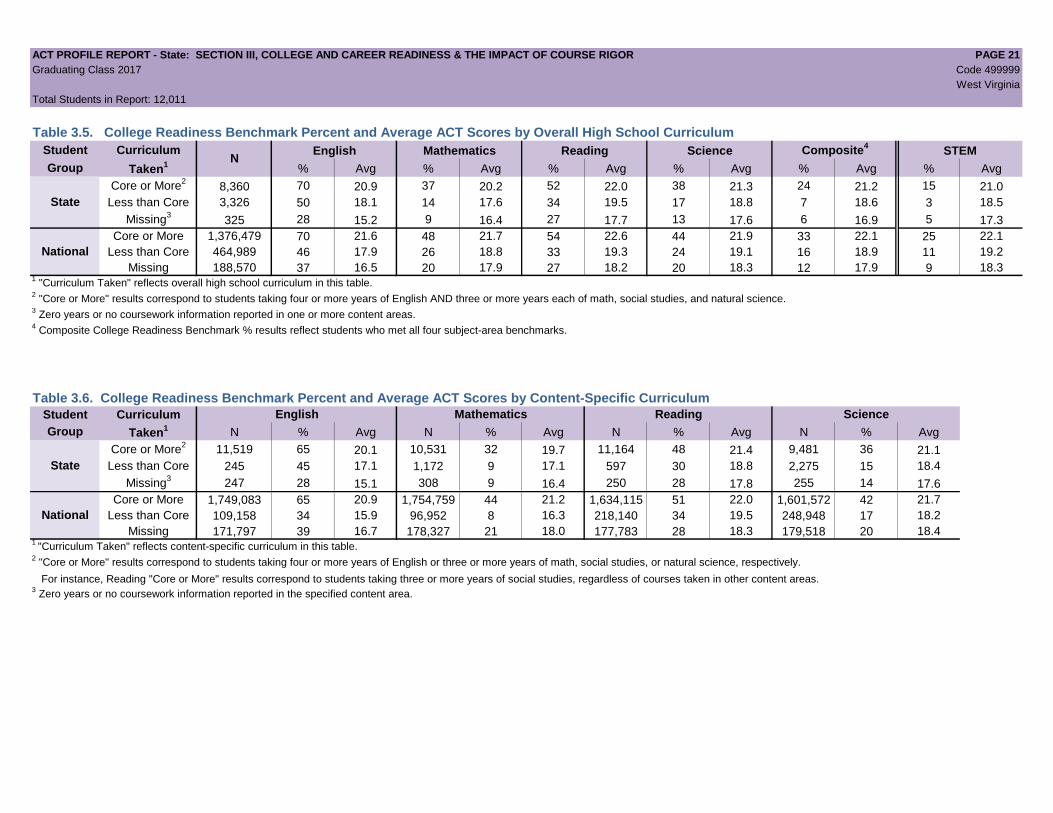
Table 3.5. College Readiness Benchmark Percent and Average ACT Scores by Overall High School Curriculum
Student Curriculum English Mathematics Reading Science Composite4
STEM
Group Taken1 % Avg % Avg % Avg % Avg % Avg % Avg
Core or More2
8,360 70 20.9 37 20.2 52 22.0 38 21.3 24 21.2 15 21.0
Less than Core 3,326 50 18.1 14 17.6 34 19.5 17 18.8 7 18.6 3 18.5
Missing3
325 28 15.2 9 16.4 27 17.7 13 17.6 6 16.9 5 17.3
Core or More 1,376,479 70 21.6 48 21.7 54 22.6 44 21.9 33 22.1 25 22.1
Less than Core 464,989 46 17.9 26 18.8 33 19.3 24 19.1 16 18.9 11 19.2
Missing 188,570 37 16.5 20 17.9 27 18.2 20 18.3 12 17.9 9 18.31 "Curriculum Taken" reflects overall high school curriculum in this table.
2 "Core or More" results correspond to students taking four or more years of English AND three or more years each of math, social studies, and natural science.
3 Zero years or no coursework information reported in one or more content areas.
4 Composite College Readiness Benchmark % results reflect students who met all four subject-area benchmarks.
Table 3.6. College Readiness Benchmark Percent and Average ACT Scores by Content-Specific Curriculum
Student Curriculum English Mathematics Reading Science
Group Taken1 N % Avg N % Avg N % Avg N % Avg
Core or More2
11,519 65 20.1 10,531 32 19.7 11,164 48 21.4 9,481 36 21.1
Less than Core 245 45 17.1 1,172 9 17.1 597 30 18.8 2,275 15 18.4
Missing3
247 28 15.1 308 9 16.4 250 28 17.8 255 14 17.6
Core or More 1,749,083 65 20.9 1,754,759 44 21.2 1,634,115 51 22.0 1,601,572 42 21.7
Less than Core 109,158 34 15.9 96,952 8 16.3 218,140 34 19.5 248,948 17 18.2
Missing 171,797 39 16.7 178,327 21 18.0 177,783 28 18.3 179,518 20 18.41
"Curriculum Taken" reflects content-specific curriculum in this table.2 "Core or More" results correspond to students taking four or more years of English or three or more years of math, social studies, or natural science, respectively.
For instance, Reading "Core or More" results correspond to students taking three or more years of social studies, regardless of courses taken in other content areas.3 Zero years or no coursework information reported in the specified content area.
National
N
State
National
State
ACT PROFILE REPORT - State: SECTION III, COLLEGE AND CAREER READINESS & THE IMPACT OF COURSE RIGOR PAGE 22
Graduating Class 2017 Code 499999
West Virginia
Total Students in Report: 12,011
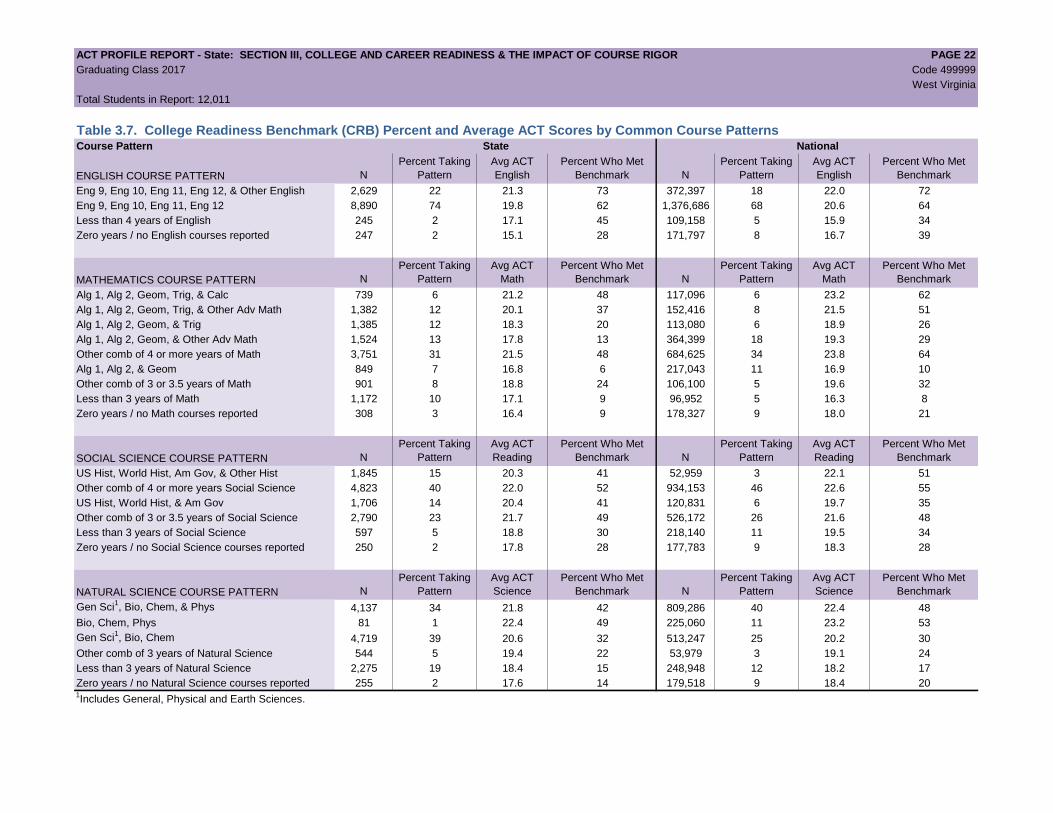
Table 3.7. College Readiness Benchmark (CRB) Percent and Average ACT Scores by Common Course PatternsCourse Pattern State National
ENGLISH COURSE PATTERN N
Percent Taking
Pattern
Avg ACT
English
Percent Who Met
Benchmark N
Percent Taking
Pattern
Avg ACT
English
Percent Who Met
Benchmark
Eng 9, Eng 10, Eng 11, Eng 12, & Other English 2,629 22 21.3 73 372,397 18 22.0 72
Eng 9, Eng 10, Eng 11, Eng 12 8,890 74 19.8 62 1,376,686 68 20.6 64
Less than 4 years of English 245 2 17.1 45 109,158 5 15.9 34
Zero years / no English courses reported 247 2 15.1 28 171,797 8 16.7 39
MATHEMATICS COURSE PATTERN N
Percent Taking
Pattern
Avg ACT
Math
Percent Who Met
Benchmark N
Percent Taking
Pattern
Avg ACT
Math
Percent Who Met
Benchmark
Alg 1, Alg 2, Geom, Trig, & Calc 739 6 21.2 48 117,096 6 23.2 62
Alg 1, Alg 2, Geom, Trig, & Other Adv Math 1,382 12 20.1 37 152,416 8 21.5 51
Alg 1, Alg 2, Geom, & Trig 1,385 12 18.3 20 113,080 6 18.9 26
Alg 1, Alg 2, Geom, & Other Adv Math 1,524 13 17.8 13 364,399 18 19.3 29
Other comb of 4 or more years of Math 3,751 31 21.5 48 684,625 34 23.8 64
Alg 1, Alg 2, & Geom 849 7 16.8 6 217,043 11 16.9 10
Other comb of 3 or 3.5 years of Math 901 8 18.8 24 106,100 5 19.6 32
Less than 3 years of Math 1,172 10 17.1 9 96,952 5 16.3 8
Zero years / no Math courses reported 308 3 16.4 9 178,327 9 18.0 21
SOCIAL SCIENCE COURSE PATTERN N
Percent Taking
Pattern
Avg ACT
Reading
Percent Who Met
Benchmark N
Percent Taking
Pattern
Avg ACT
Reading
Percent Who Met
Benchmark
US Hist, World Hist, Am Gov, & Other Hist 1,845 15 20.3 41 52,959 3 22.1 51
Other comb of 4 or more years Social Science 4,823 40 22.0 52 934,153 46 22.6 55
US Hist, World Hist, & Am Gov 1,706 14 20.4 41 120,831 6 19.7 35
Other comb of 3 or 3.5 years of Social Science 2,790 23 21.7 49 526,172 26 21.6 48
Less than 3 years of Social Science 597 5 18.8 30 218,140 11 19.5 34
Zero years / no Social Science courses reported 250 2 17.8 28 177,783 9 18.3 28
NATURAL SCIENCE COURSE PATTERN N
Percent Taking
Pattern
Avg ACT
Science
Percent Who Met
Benchmark N
Percent Taking
Pattern
Avg ACT
Science
Percent Who Met
Benchmark
Gen Sci1, Bio, Chem, & Phys 4,137 34 21.8 42 809,286 40 22.4 48
Bio, Chem, Phys 81 1 22.4 49 225,060 11 23.2 53
Gen Sci1, Bio, Chem 4,719 39 20.6 32 513,247 25 20.2 30
Other comb of 3 years of Natural Science 544 5 19.4 22 53,979 3 19.1 24
Less than 3 years of Natural Science 2,275 19 18.4 15 248,948 12 18.2 17
Zero years / no Natural Science courses reported 255 2 17.6 14 179,518 9 18.4 201Includes General, Physical and Earth Sciences.

ACT PROFILE REPORT - State: SECTION III, COLLEGE AND CAREER READINESS & THE IMPACT OF COURSE RIGOR PAGE 23
Graduating Class 2017 Code 499999
West Virginia
Total Students in Report: 12,011
Table 3.8. College Readiness Benchmark (CRB) Percent and Average ACT Scores for Gender by Common Course PatternsCourse Pattern All Students Males Females
ENGLISH COURSE PATTERN N Percent
ACT
English
% Who Met
Benchmark N Percent
ACT
English
% Who Met
Benchmark N Percent
ACT
English
% Who Met
Benchmark
Eng 9, Eng 10, Eng 11, Eng 12, & Other English 2,629 22 21.3 73 981 19 20.9 71 1,648 24 21.4 74
Eng 9, Eng 10, Eng 11, Eng 12 8,890 74 19.8 62 3,952 76 19.6 61 4,935 72 20.0 64
Less than 4 years of English 245 2 17.1 45 109 2 16.3 37 136 2 17.9 52
Zero years / no English courses reported 247 2 15.1 28 145 3 15.0 25 102 1 15.2 33
MATHEMATICS COURSE PATTERN N Percent
ACT
Math
% Who Met
Benchmark N Percent
ACT
Math
% Who Met
Benchmark N Percent
ACT
Math
% Who Met
Benchmark
Alg 1, Alg 2, Geom, Trig, & Calc 739 6 21.2 48 279 5 21.9 56 460 7 20.8 43
Alg 1, Alg 2, Geom, Trig, & Other Adv Math 1,382 12 20.1 37 470 9 20.9 44 912 13 19.7 33
Alg 1, Alg 2, Geom, & Trig 1,385 12 18.3 20 583 11 19.0 26 802 12 17.9 15
Alg 1, Alg 2, Geom, & Other Adv Math 1,524 13 17.8 13 612 12 17.9 15 912 13 17.7 12
Other comb of 4 or more years of Math 3,751 31 21.5 48 1,787 34 22.3 54 1,964 29 20.8 43
Alg 1, Alg 2, & Geom 849 7 16.8 6 388 7 17.1 9 461 7 16.5 4
Other comb of 3 or 3.5 years of Math 901 8 18.8 24 399 8 19.3 29 500 7 18.3 21
Less than 3 years of Math 1,172 10 17.1 9 489 9 17.7 13 682 10 16.7 7
Zero years / no Math courses reported 308 3 16.4 9 180 3 16.5 9 128 2 16.2 9
SOCIAL SCIENCE COURSE PATTERN N Percent
ACT
Reading
% Who Met
Benchmark N Percent
ACT
Reading
% Who Met
Benchmark N Percent
ACT
Reading
% Who Met
Benchmark
US Hist, World Hist, Am Gov, & Other Hist 1,845 15 20.3 41 899 17 20.3 39 946 14 20.3 42
Other comb of 4 or more years Social Science 4,823 40 22.0 52 1,925 37 21.8 51 2,898 42 22.1 54
US Hist, World Hist, & Am Gov 1,706 14 20.4 41 799 15 20.6 43 907 13 20.2 39
Other comb of 3 or 3.5 years of Social Science 2,790 23 21.7 49 1,130 22 22.0 52 1,658 24 21.4 47
Less than 3 years of Social Science 597 5 18.8 30 284 5 18.5 30 312 5 19.0 29
Zero years / no Social Science courses reported 250 2 17.8 28 150 3 17.5 27 100 1 18.3 30
NATURAL SCIENCE COURSE PATTERN N Percent
ACT
Science
% Who Met
Benchmark N Percent
ACT
Science
% Who Met
Benchmark N Percent
ACT
Science
% Who Met
Benchmark
Gen Sci1, Bio, Chem, & Phys 4,137 34 21.8 42 1,979 38 22.6 50 2,158 32 21.1 35
Bio, Chem, Phys 81 1 22.4 49 32 1 23.7 53 48 1 21.8 48
Gen Sci2, Bio, Chem 4,719 39 20.6 32 1,791 35 21.0 36 2,926 43 20.4 30
Other comb of 3 years of Natural Science 544 5 19.4 22 271 5 19.9 28 273 4 18.9 15
Less than 3 years of Natural Science 2,275 19 18.4 15 962 19 18.4 15 1,313 19 18.5 15
Zero years / no Natural Science courses reported 255 2 17.6 14 152 3 17.7 14 103 2 17.4 141Includes General, Physical and Earth Sciences.

ACT PROFILE REPORT - State: SECTION III, COLLEGE AND CAREER READINESS & THE IMPACT OF COURSE RIGOR PAGE 24
Graduating Class 2017 Code 499999
West Virginia
Total Students in Report: 12,011
This page intentionally left blank.
ACT PROFILE REPORT - State: SECTION IV, CAREER AND EDUCATIONAL ASPIRATIONS PAGE 25
Graduating Class 2017 Code 499999
West Virginia
Total Students in Report: 12,011
Section IV
Career and Educational Aspirations
Beginning with the Graduating Class of 2013, all students whose scores are college reportable, both standard and extended time tests, are now included.
Also beginning with the 2013 Graduating Class data, College Readiness Benchmarks for Reading and Science were updated to reflect the most recent
college coursework research.

ACT PROFILE REPORT - State: SECTION IV, CAREER AND EDUCATIONAL ASPIRATIONS PAGE 26
Graduating Class 2017 Code 499999
West Virginia
Total Students in Report: 12,011
Figure 4.1. Average ACT Composite Scores by Race and Student Postsecondary Aspirations*
13.1
14.3
16.8
15.3
18.7
15.7 15.3
17.0
15.9
13.0 13.0
17.0 17.4
19.8
18.9
19.8
21.2
18.4
13.0
22.8
21.3
26.1
23.0
19.6
21.7
22.9
21.6
25.9
1
6
11
16
21
26
31
Black/African American American Indian/Alaska Native White Hispanic/Latino Asian Native Hawaiian/Pacific Islander
Avera
ge C
om
posite S
core
Voc-Tech 2-yr College Degree Bachelors Degree Graduate Study Prof. Level Degree
*Missing columns reflect combinations of race/ethnicity and postsecondary aspiration in which one or both indicators are missing.

ACT PROFILE REPORT - State: SECTION IV, CAREER AND EDUCATIONAL ASPIRATIONS PAGE 27
Graduating Class 2017 Code 499999
West Virginia
Total Students in Report: 12,011
Table 4.1. Distribution of Planned Educational Majors for All Students by College Plans
All Students Plan on 2 Years or Less of College Plan on 4 Years or More of College
Planned Educational Major N1
Percent2
Avg ACT
Comp N Percent
Avg ACT
Comp N Percent
Avg ACT
Comp
Agriculture & Natural Resources Conservation 221 2 18.5 27 3 16.3 183 2 18.7
Architecture 65 1 21.0 4 0 15.8 58 1 21.5
Area, Ethnic, & Multidisciplinary Studies 5 0 22.0 1 0 13.0 4 0 24.3
Arts: Visual & Performing 504 4 21.1 36 4 17.9 439 4 21.4
Business 788 7 20.1 64 7 17.5 703 7 20.3
Communications 144 1 21.1 4 0 15.8 133 1 21.4
Community, Family, & Personal Services 261 2 18.1 50 5 16.3 192 2 18.9
Computer Science & Mathematics 385 3 22.2 39 4 18.5 332 3 22.5
Education 871 7 19.3 24 3 15.3 829 8 19.4
Engineering 782 7 22.5 46 5 18.1 713 7 22.9
Engineering Technology & Drafting 155 1 19.3 38 4 17.2 107 1 20.3
English & Foreign Languages 108 1 22.8 1 0 20.0 103 1 23.0
Health Administration & Assisting 538 4 18.4 67 7 16.4 457 4 18.7
Health Sciences & Technologies 3,312 28 20.3 223 24 16.8 3,010 29 20.6
Philosophy, Religion, & Theology 34 0 23.1 1 0 16.0 32 0 23.3
Repair, Production, & Construction 137 1 17.2 86 9 16.6 47 0 18.7
Sciences: Biological & Physical 744 6 22.4 7 1 16.1 726 7 22.5
Social Sciences & Law 936 8 20.8 24 3 16.3 885 8 20.9
Undecided 1,814 15 20.3 147 16 16.9 1,540 15 20.7
No Response 200 2 16.4 25 3 13.9 29 0 16.612-Year and 4-Year "N" counts do not reflect "Missing" and "Other" college plans, therefore they may not add up to the N count for All Students.
2Percent of students tested within College Plan groups (All Students, 2-Year, 4-Year).
ACT PROFILE REPORT - State: SECTION IV, CAREER AND EDUCATIONAL ASPIRATIONS PAGE 28
Graduating Class 2017 Code 499999
West Virginia
Total Students in Report: 12,011
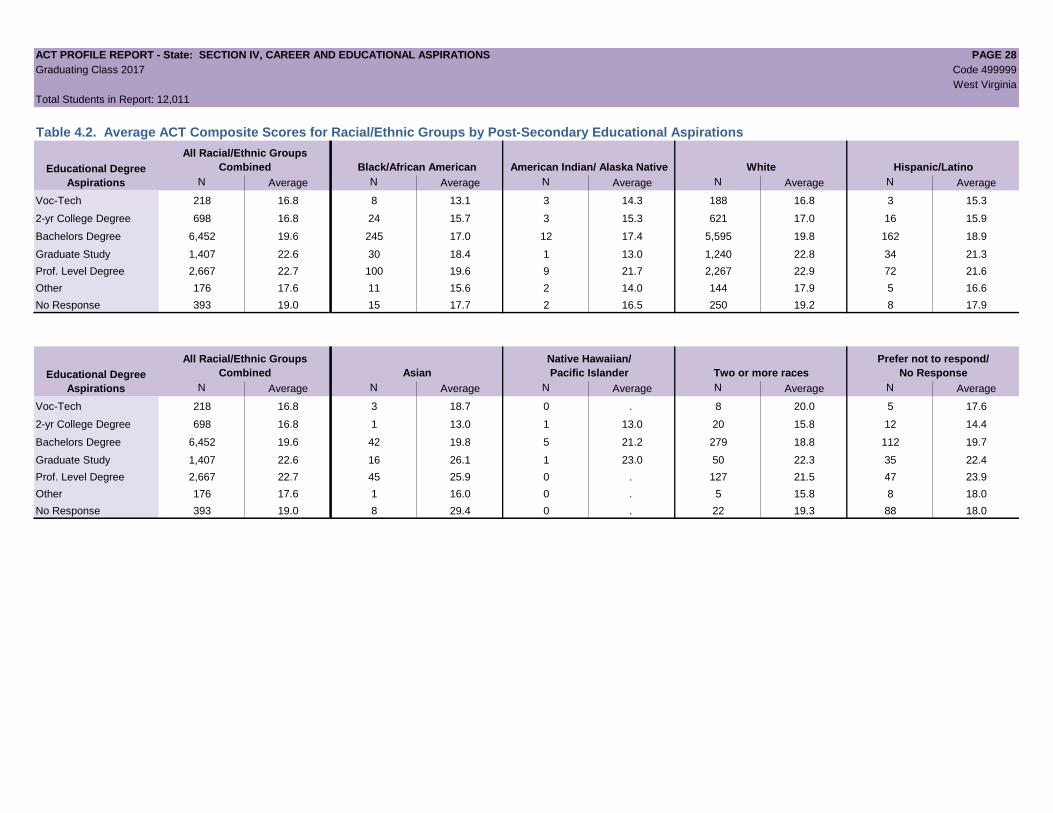
Table 4.2. Average ACT Composite Scores for Racial/Ethnic Groups by Post-Secondary Educational Aspirations
All Racial/Ethnic Groups
Combined Black/African American American Indian/ Alaska Native White Hispanic/Latino
N Average N Average N Average N Average N Average
Voc-Tech 218 16.8 8 13.1 3 14.3 188 16.8 3 15.3
2-yr College Degree 698 16.8 24 15.7 3 15.3 621 17.0 16 15.9
Bachelors Degree 6,452 19.6 245 17.0 12 17.4 5,595 19.8 162 18.9
Graduate Study 1,407 22.6 30 18.4 1 13.0 1,240 22.8 34 21.3
Prof. Level Degree 2,667 22.7 100 19.6 9 21.7 2,267 22.9 72 21.6
Other 176 17.6 11 15.6 2 14.0 144 17.9 5 16.6
No Response 393 19.0 15 17.7 2 16.5 250 19.2 8 17.9
All Racial/Ethnic Groups
Combined Asian
Native Hawaiian/
Pacific Islander Two or more races
Prefer not to respond/
No Response
N Average N Average N Average N Average N Average
Voc-Tech 218 16.8 3 18.7 0 . 8 20.0 5 17.6
2-yr College Degree 698 16.8 1 13.0 1 13.0 20 15.8 12 14.4
Bachelors Degree 6,452 19.6 42 19.8 5 21.2 279 18.8 112 19.7
Graduate Study 1,407 22.6 16 26.1 1 23.0 50 22.3 35 22.4
Prof. Level Degree 2,667 22.7 45 25.9 0 . 127 21.5 47 23.9
Other 176 17.6 1 16.0 0 . 5 15.8 8 18.0
No Response 393 19.0 8 29.4 0 . 22 19.3 88 18.0
Educational Degree
Aspirations
Educational Degree
Aspirations

ACT PROFILE REPORT - State: SECTION IV, CAREER AND EDUCATIONAL ASPIRATIONS PAGE 29
Graduating Class 2017 Code 499999
West Virginia
Total Students in Report: 12,011
Table 4.3. Students' Score Report Preferences at Time of Testing
Percent of Students in
Number of Students College Readiness Standards Ranges
Name State Total 1st Choice
2nd-6th
Choice 01-12 13-15 16-19 20-23 24-27 28-32 33-36
WEST VIRGINIA UNIVERSITY West Virginia 4,287 2,236 2,051 1 8 27 33 21 8 1
MARSHALL UNIVERSITY West Virginia 3,133 1,445 1,688 1 10 31 33 18 6 0
FAIRMONT STATE UNIVERSITY West Virginia 1,647 582 1,065 1 12 34 33 15 4 0
CONCORD UNIVERSITY West Virginia 931 319 612 3 16 34 29 15 3 0
WEST LIBERTY UNIVERSITY West Virginia 623 268 355 0 9 33 36 17 4 0
SHEPHERD UNIVERSITY West Virginia 598 231 367 0 10 29 34 20 6 0
WEST VIRGINIA STATE UNIVERSITY West Virginia 545 124 421 1 13 41 28 13 3 0
GLENVILLE STATE COLLEGE West Virginia 542 166 376 2 17 42 27 10 2 0
UNIVERSITY OF CHARLESTON THE West Virginia 537 122 415 1 11 33 32 18 4 0
WEST VIRGINIA WESLEYAN COLLEGE West Virginia 528 125 403 0 7 28 30 27 7 1
BLUEFIELD STATE COLLEGE West Virginia 375 153 222 4 23 41 25 8 0 0
ALDERSON BROADDUS COLLEGE West Virginia 355 85 270 1 13 34 32 16 4 0
WEST VIRGINIA UNIV INST OF TECHNOLOGY West Virginia 354 126 228 1 13 37 29 16 5 0
POTOMAC STATE COLLEGE OF WVU West Virginia 342 149 193 1 14 40 31 11 3 0
WEST VIRGINIA UNIVERSITY AT PARKERSBURG West Virginia 300 128 172 2 15 40 30 12 1 0
OHIO STATE UNIVERSITY THE Ohio 284 50 234 0 8 20 26 27 15 3
DAVIS & ELKINS COLLEGE West Virginia 269 80 189 1 10 33 32 18 5 0
BRIDGEVALLEY COMM & TECH COLL West Virginia 264 123 141 2 22 44 23 9 0 0
NCAA ELIGIBILITY CENTER Indiana 263 106 157 2 13 32 31 20 3 0
WEST VIRGINA PROMISE SCHOLARSHIP West Virginia 238 48 190 0 6 23 42 24 5 0
PIERPONT COMMUNITY & TECHNICAL COLLEGE West Virginia 237 99 138 3 24 40 26 5 1 0
UNIVERSITY OF KENTUCKY Kentucky 228 37 191 1 5 18 29 29 14 3
WHEELING JESUIT UNIVERSITY West Virginia 168 39 129 1 7 33 34 20 5 1
OHIO UNIVERSITY Ohio 160 30 130 1 4 21 36 29 8 1
VIRGINIA TECH Virginia 160 26 134 3 9 13 24 28 21 3
SOUTHERN WEST VIRGINIA C TECH C-LOGAN West Virginia 152 71 81 6 24 46 20 3 1 0
MOUNTWEST COMMUNITY & TECHNICAL COLLEGE West Virginia 137 39 98 2 28 39 23 7 1 0
NEW RIVER COMMUNITY AND TECHNICAL COLL West Virginia 124 34 90 10 31 40 18 2 0 0
BLUE RIDGE COMM AND TECH COLL West Virginia 115 54 61 3 17 44 30 3 3 0
LIBERTY UNIVERSITY Virginia 109 45 64 0 9 22 30 28 9 1
All Other Institutions 5,152 1,290 3,862 2 11 24 26 21 13 2
Total 23,157 8,430 14,727 1 12 30 30 19 7 1

ACT PROFILE REPORT - State : SECTION IV, CAREER AND EDUCATIONAL ASPIRATIONS PAGE 30
Graduating Class 2017 Code 499999
West Virginia
Total Students in Report: 12,011
This page intentionally left blank.

ACT PROFILE REPORT - State: SECTION V, OPTIONAL WRITING TEST RESULTS PAGE 31
Graduating Class 2017 Code 499999
West Virginia
Total Students in Report: 12,011
Section V
Optional Writing Test Results
Beginning with the Graduating Class of 2013, all students whose scores are college reportable, both standard and extended time tests, are now included.
Also beginning with the 2013 Graduating Class data, College Readiness Benchmarks for Reading and Science were updated to reflect the most recent
college coursework research.

ACT PROFILE REPORT - State: SECTION V, OPTIONAL WRITING TEST RESULTS PAGE 32
Graduating Class 2017 Code 499999
West Virginia
Total Students in Report: 12,011
Figure 5.1. Average ACT Writing Scores by Race/Ethnicity*
6.7
6.1 6.0
6.7 6.8
7.9
3.0
6.4 6.5
5.6 5.5
6.8
6.3
7.4
6.1
6.7
2
3
4
5
6
7
8
9
10
11
12
All Students Black/African American American Indian/AlaskaNative
White Hispanic/Latino Asian Native Hawaiian/OtherPac. Isl.
Two or More Races
Avera
ge W
ritin
g S
core
State National
*Missing columns reflect race/ethnicity groupings that are missing. Results based on students with ACT Writing scores from test events beginning September 2015. Score scale is 2-12.
ACT PROFILE REPORT - State: SECTION V, OPTIONAL WRITING TEST RESULTS PAGE 33
Graduating Class 2017 Code 499999
West Virginia
Total Students in Report: 12,011
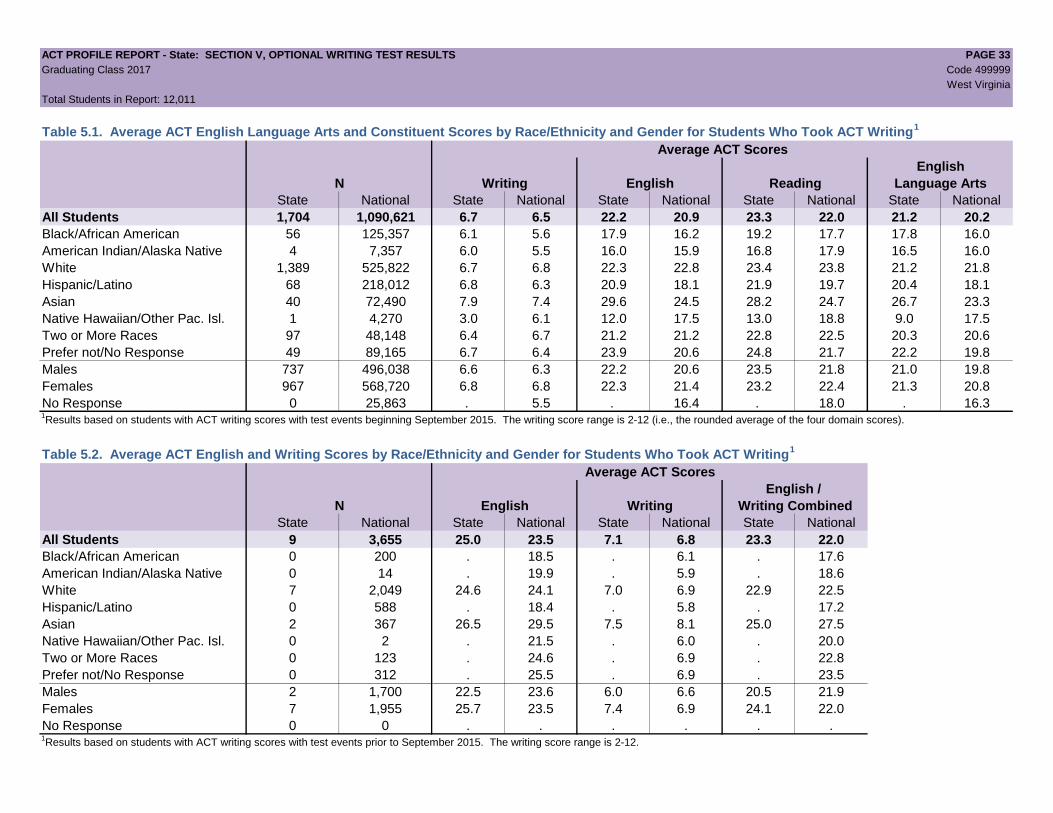
Table 5.1. Average ACT English Language Arts and Constituent Scores by Race/Ethnicity and Gender for Students Who Took ACT Writing1
Average ACT Scores
English
N Writing English Reading Language Arts
State National State National State National State National State National
All Students 1,704 1,090,621 6.7 6.5 22.2 20.9 23.3 22.0 21.2 20.2
Black/African American 56 125,357 6.1 5.6 17.9 16.2 19.2 17.7 17.8 16.0
American Indian/Alaska Native 4 7,357 6.0 5.5 16.0 15.9 16.8 17.9 16.5 16.0
White 1,389 525,822 6.7 6.8 22.3 22.8 23.4 23.8 21.2 21.8
Hispanic/Latino 68 218,012 6.8 6.3 20.9 18.1 21.9 19.7 20.4 18.1
Asian 40 72,490 7.9 7.4 29.6 24.5 28.2 24.7 26.7 23.3
Native Hawaiian/Other Pac. Isl. 1 4,270 3.0 6.1 12.0 17.5 13.0 18.8 9.0 17.5
Two or More Races 97 48,148 6.4 6.7 21.2 21.2 22.8 22.5 20.3 20.6
Prefer not/No Response 49 89,165 6.7 6.4 23.9 20.6 24.8 21.7 22.2 19.8
Males 737 496,038 6.6 6.3 22.2 20.6 23.5 21.8 21.0 19.8
Females 967 568,720 6.8 6.8 22.3 21.4 23.2 22.4 21.3 20.8
No Response 0 25,863 . 5.5 . 16.4 . 18.0 . 16.31Results based on students with ACT writing scores with test events beginning September 2015. The writing score range is 2-12 (i.e., the rounded average of the four domain scores).
Table 5.2. Average ACT English and Writing Scores by Race/Ethnicity and Gender for Students Who Took ACT Writing1
Average ACT Scores
English /
N English Writing Writing Combined
State National State National State National State National
All Students 9 3,655 25.0 23.5 7.1 6.8 23.3 22.0
Black/African American 0 200 . 18.5 . 6.1 . 17.6
American Indian/Alaska Native 0 14 . 19.9 . 5.9 . 18.6
White 7 2,049 24.6 24.1 7.0 6.9 22.9 22.5
Hispanic/Latino 0 588 . 18.4 . 5.8 . 17.2
Asian 2 367 26.5 29.5 7.5 8.1 25.0 27.5
Native Hawaiian/Other Pac. Isl. 0 2 . 21.5 . 6.0 . 20.0
Two or More Races 0 123 . 24.6 . 6.9 . 22.8
Prefer not/No Response 0 312 . 25.5 . 6.9 . 23.5
Males 2 1,700 22.5 23.6 6.0 6.6 20.5 21.9
Females 7 1,955 25.7 23.5 7.4 6.9 24.1 22.0
No Response 0 0 . . . . . .1Results based on students with ACT writing scores with test events prior to September 2015. The writing score range is 2-12.


![Trillium Handouts.Jy [Recovered].Most Recent](https://static.fdocuments.net/doc/165x107/558e9f651a28ab4d528b4791/trillium-handoutsjy-recoveredmost-recent.jpg)