Production of recombinant Human Serum Albumin in ...
148
Production of recombinant Human Serum Albumin in transgenic plants and plant cells Von der Fakultt für Mathematik, Informatik und Naturwissenschaften der Rheinisch-Westflischen Technischen Hochschule Aachen zur Erlangung des akademischen Grades einer Doktorin der Naturwissenschaften genehmigte Dissertation vorgelegt von Master of Science A. Meltem MAVITUNA aus Ankara, Türkei Berichter: Universittsprofessor Dr. rer. nat. Rainer Fischer Universittsprofessor Dr. rer. nat. Fritz Kreuzaler Tag der mündlichen Prüfung: 30.05.2005 Diese Dissertation ist auf den Internetseiten der Hochschulbibliothek online verfügbar.
Transcript of Production of recombinant Human Serum Albumin in ...
Production of recombinant Human Serum
Albumin in transgenic plants and plant cells
Von der Fakultät für Mathematik, Informatik und Naturwissenschaften der
Rheinisch-Westfälischen Technischen Hochschule Aachen
zur Erlangung des akademischen Grades einer
Doktorin der Naturwissenschaften
genehmigte Dissertation
vorgelegt von
Master of Science
A. Meltem MAVITUNA aus
Ankara, Türkei
Berichter: Universitätsprofessor Dr. rer. nat. Rainer Fischer
Universitätsprofessor Dr. rer. nat. Fritz Kreuzaler
Tag der mündlichen Prüfung: 30.05.2005
Diese Dissertation ist auf den Internetseiten der Hochschulbibliothek online verfügbar.

Annelerin en güzeline
While the work for this thes is was be ing c ompleted, my mother passed away.
I wil l always be thankful for my m other s encouragement and uncond it ional l ove .
This thes is is dedicated with love t o the memory of
Mübeccel YÜCELT MAVITUNA
01.12.1934-27.11.2001
She was a wonderful daughter , s is ter , mother and best f r iend to a l l who knew her..
Contents
I
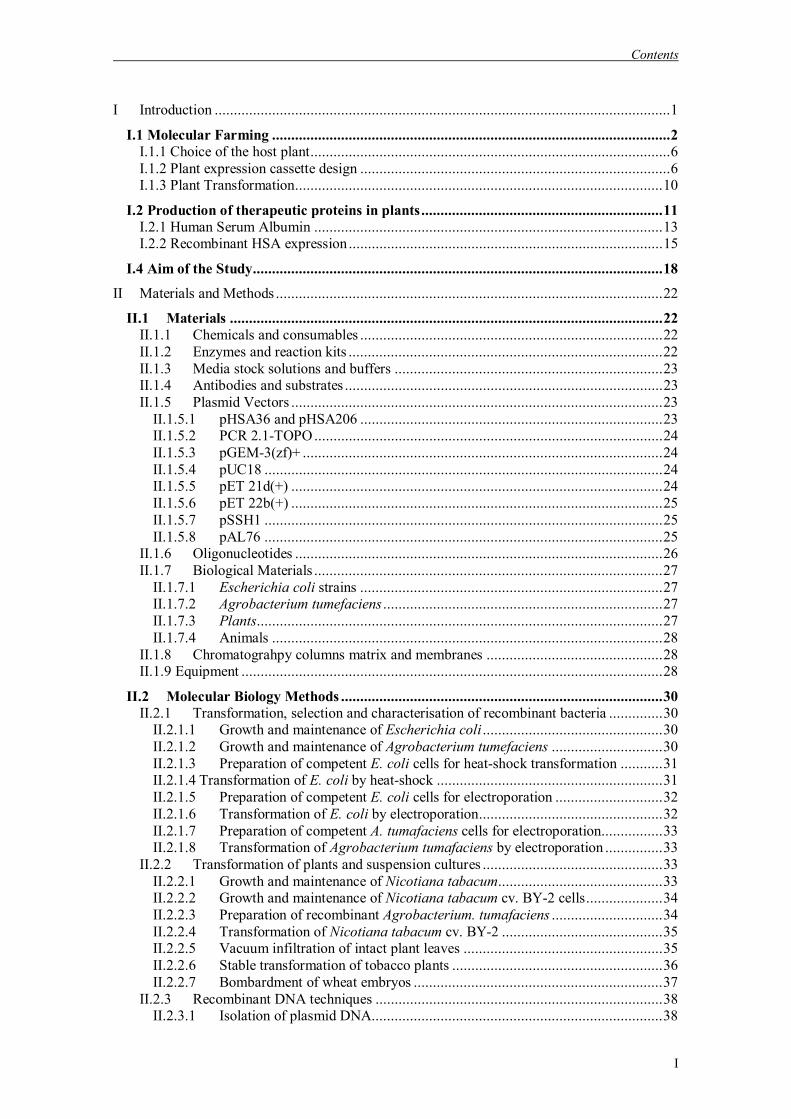
I Introduction .......................................................................................................................1
I.1 Molecular Farming ........................................................................................................2 I.1.1 Choice of the host plant..............................................................................................6 I.1.2 Plant expression cassette design .................................................................................6 I.1.3 Plant Transformation................................................................................................10
I.2 Production of therapeutic proteins in plants...............................................................11 I.2.1 Human Serum Albumin ...........................................................................................13 I.2.2 Recombinant HSA expression ..................................................................................15
I.4 Aim of the Study...........................................................................................................18
II Materials and Methods .....................................................................................................22
II.1 Materials .................................................................................................................22 II.1.1 Chemicals and consumables ...............................................................................22 II.1.2 Enzymes and reaction kits ..................................................................................22 II.1.3 Media stock solutions and buffers ......................................................................23 II.1.4 Antibodies and substrates ...................................................................................23 II.1.5 Plasmid Vectors .................................................................................................23
II.1.5.1 pHSA36 and pHSA206 ...............................................................................23 II.1.5.2 PCR 2.1-TOPO ...........................................................................................24 II.1.5.3 pGEM-3(zf)+ ..............................................................................................24 II.1.5.4 pUC18 ........................................................................................................24 II.1.5.5 pET 21d(+) .................................................................................................24 II.1.5.6 pET 22b(+) .................................................................................................25 II.1.5.7 pSSH1 ........................................................................................................25 II.1.5.8 pAL76 ........................................................................................................25
II.1.6 Oligonucleotides ................................................................................................26 II.1.7 Biological Materials ...........................................................................................27
II.1.7.1 Escherichia coli strains ...............................................................................27 II.1.7.2 Agrobacterium tumefaciens .........................................................................27 II.1.7.3 Plants..........................................................................................................27 II.1.7.4 Animals ......................................................................................................28
II.1.8 Chromatograhpy columns matrix and membranes ..............................................28 II.1.9 Equipment ..............................................................................................................28
II.2 Molecular Biology Methods ....................................................................................30 II.2.1 Transformation, selection and characterisation of recombinant bacteria ..............30
II.2.1.1 Growth and maintenance of Escherichia coli ...............................................30 II.2.1.2 Growth and maintenance of Agrobacterium tumefaciens .............................30 II.2.1.3 Preparation of competent E. coli cells for heat-shock transformation ...........31 II.2.1.4 Transformation of E. coli by heat-shock ...........................................................31 II.2.1.5 Preparation of competent E. coli cells for electroporation ............................32 II.2.1.6 Transformation of E. coli by electroporation................................................32 II.2.1.7 Preparation of competent A. tumafaciens cells for electroporation................33 II.2.1.8 Transformation of Agrobacterium tumafaciens by electroporation ...............33
II.2.2 Transformation of plants and suspension cultures ...............................................33 II.2.2.1 Growth and maintenance of Nicotiana tabacum...........................................33 II.2.2.2 Growth and maintenance of Nicotiana tabacum cv. BY-2 cells....................34 II.2.2.3 Preparation of recombinant Agrobacterium. tumafaciens .............................34 II.2.2.4 Transformation of Nicotiana tabacum cv. BY-2 ..........................................35 II.2.2.5 Vacuum infiltration of intact plant leaves ....................................................35 II.2.2.6 Stable transformation of tobacco plants .......................................................36 II.2.2.7 Bombardment of wheat embryos .................................................................37
II.2.3 Recombinant DNA techniques ...........................................................................38 II.2.3.1 Isolation of plasmid DNA............................................................................38
Contents
II
II.2.3.1.1 TELT method..............................................................................................38 II.2.3.2 Restriction enzyme digestion and precipitation of DNA...............................38 II.2.3.3 Agarose gel electrophoresis .........................................................................39 II.2.3.4 Determination of the DNA concentration.....................................................39 II.2.3.5 Ligation of DNA fragments.........................................................................39 II.2.3.6 PCR amplification.......................................................................................40 II.2.3.6.1 Colony check PCR......................................................................................41 II.2.3.6.2 SOE-PCR amplification ..............................................................................41 II.2.3.7 DNA sequencing.........................................................................................42
II.3 Expression of recombinant proteins .......................................................................42 II.3.1 Bacterial expression ...........................................................................................42 II.3.2 Expression of rHSA in the field..........................................................................43
II.4 Protein analysis...........................................................................................................43 II.4.1 Isolation of total soluble proteins from E. coli ....................................................43 II.4.2 Isolation of total soluble proteins from plant leaves ............................................44 II.4.3 Isolation of total soluble proteins from tobacco suspension cultures....................45 II.4.4 Isolation of total soluble proteins from wheat seeds ............................................45 II.4.5 Quantification of total soluble proteins ...............................................................45 II.4.6 Gel electrophoresis of proteins ...........................................................................46
II.4.6.1 One-dimensional gel electrophoresis ...........................................................46 II.4.6.2 Two-dimensional gel electrophoresis...........................................................46
II.4.7 Staining of protein gels ......................................................................................47 II.4.7.1 Coomassie brilliant blue staining.................................................................47 II.4.7.2 Silver Staining ............................................................................................47
II.4.8 Immunoblot .......................................................................................................48 II.4.9 Enzyme Linked Immunosorbent Assay (ELISA) ................................................50
II.4.9.1 Determination of IgY titer in egg yolk ..............................................................50 II.4.9.2 Detection of recombinant HSA in bacteria and plant .........................................51
II.5 Production of IgY anti sera ........................................................................................52 II.5.1 Immunization of chicken.........................................................................................52 II.5.2 Isolation of chicken polyclonal antibodies from egg yolk ........................................53
II.6 Recombinant protein purification..............................................................................53 II.6.1 Immobilized Metal Affinity Chromatography (IMAC) ............................................53 II.6.2 Cation Exchange Chromatography..........................................................................54
III Results .............................................................................................................................55 III.1 Production of polyclonal anti-HSA serum..............................................................55 III.2 Construction of HSA expression constructs............................................................56
III.2.1 Cloning of rHSA ............................................................................................56 III.2.2 Construction of plant codon optimized rHSA..................................................58 III.2.3 Generation of HSA expression constructs .......................................................63 III.2.3.1 Bacterial expression constructs....................................................................63 III.2.3.2 Plant expression constructs..........................................................................64
III.3 Expression of rHSA...............................................................................................66 III.3.1 Bacterial expression........................................................................................66 III.3.2 Transient expression of rHSA in plant leaves ..................................................67 III.3.2.1 Transient expression in N. tabacum cv. Petite Havana SR1 leaves ...............67 III.3.2.2 Alternative N. tabacum cultivars .................................................................68 III.3.2.3 Transient expression of rHSA in zucchini and bean leaves...........................70 III.3.3 Stable expression of rHSA in transgenic tobacco plants ..................................71 III.3.3.1 Transgenic tobacco plants producing HSA-APO .........................................71 III.3.3.2 Transgenic tobacco plants expressing HSA-KDEL ......................................73 III.3.3.3 Analysis of rHSA accumulation in the T1 generation ...................................74
Contents
III
III.3.3.4 Analysis of rHSA accumulation in homozygous T2 lines .............................75 III.3.3.4.1 Analysis of plant derived rHSA with 2-D SDS PAGE .............................77
III.3.3.5 Field trials of transgenic tobacco plants producing rHSA.............................79 III.3.4 Production of rHSA in transgenic wheat seeds ................................................80 III.3.5 Production of rHSA in transgenic tobacco suspension cells .............................81 III.3.5.1 Analysis of rHSA secreted to the culture medium........................................83 III.3.5.2 Improving rHSA stability in the culture medium .........................................83
III.4 Downstream processing of plant produced rHSA ...................................................86 III.4.1 Optimum pH for binding of rHSA to CEX matrix ...........................................87 III.4.2 Purification of rHSA from transgenic leaves ...................................................88 III.4.2.1 Optimisation of extraction buffer.................................................................88 III.4.2.2 Influence of freezing leaves prior to extraction of rHSA ..............................90 III.4.2.3 Small scale purification of rHSA from transgenic tobacco leaves.................92 III.4.2.4 Large scale purification of rHSA from transgenic tobacco leaves.....................96
IV Discussion .........................................................................................................................98 IV.1. The variability of the HSA cDNA ...........................................................................98 IV.2 Construction of the plant codon optimized HSA .......................................................98 IV.3 Production of recombinant HSA in bacteria and plant cells.....................................102
IV.3.1 Bacterial expression.........................................................................................103 IV.3.2 Expression of rHSA in plants ...........................................................................104 IV.3.3 Expression of rHSA in plant cell suspension cultures .......................................108
IV.4 Production systems for rHSA, system of choice......................................................110 IV.5 Downstream processing .........................................................................................111 IV.6 Conclusions and future perspectives .......................................................................112
V Summary ..........................................................................................................................115
VI References .......................................................................................................................117
VII Appendices.....................................................................................................................127
VII.1 Abbreviations.....................................................................................................127
VII.2 List of primers used for the amplification of plant codon optimised HSA ......130
VII.3 Rare codon distribution in HSA sequence ........................................................135
VII.4 Comparison of authentic and plant codon optimised HSA sequence...............136
VII.5 Figures ...............................................................................................................139
VII.6 Tables .................................................................................................................141
Chapter I Introduction
1
I Introduction
Over the past decades manipulation of DNA in vitro has developed from the transfer of
genetic information between prokaryotic organisms to a technology, which facilitates
efficient and controlled production of proteins in foreign hosts. Recombinant proteins
have been gaining significance as research tools and therapeutics in medicine, yet the
supply of many eukaryotic proteins, which have potential clinical or industrial use, is
often limited by their low natural availability. So far, various expression systems are
established and exploited commercially. The recombinant protein production systems
utilized today range from prokaryotes such as Escherichia coli (E. coli) and Bacillus
subtilis to eukaryotes such as yeast, fungi, mammalian and insect cell cultures, animals
and plants.
The expression of heterologous genes in bacteria is the simplest and most inexpensive
way available for obtaining large amounts of desired proteins for research, industrial
and clinical research purposes. E. coli is the most widely used host for the production of
recombinant proteins because it is such a well-characterized system. Due to availability
of various strong promoters and techniques, the efficient production of recombinant
proteins in E. coli has become a routine matter. Furthermore, E. coli can readily be
grown to high cell density and this has led to the development of inexpensive high-yield
fermentation processes for the production of therapeutic and industrial proteins on a
large scale (Jeong and Lee 1999). Expression of human insulin in bacteria was
successful in 1982 and it became the first protein to be approved for therapeutic use
(Brousseau et al. 1982).
While recombinant proteins expressed in the cytoplasm of bacteria are often insoluble
and therefore inactive, soluble and bioactive proteins can frequently be obtained from
eukaryotic cells. Furthermore eukaryotic cells have the capacity to carry out
posttranslational modifications, such as glycosylation, phosphorylation on tyrosine,
serine and threonine residues or the addition of fatty acids (Geisse et al. 1996). Many
important pharmaceutical proteins are currently produced by using mammalian and
insect cells. Mammalian expression systems comprise a plethora of different cell lines
used for protein production. Most commonly, Chinese hamster ovary (CHO) cells, baby
hamster kidney (BHK) cells and myeloma cell lines are employed as hosts for the
Chapter I Introduction
2
establishment of stable transfectants (Chu and Robinson 2001). The baculovirus
expression system on the other hand has been used extensively for the expression of
recombinant proteins in insect cells (Poul et al. 1995). Recently, recombinant
baculovirus vectors engineered to contain mammalian cell-active promoter elements
have been used successfully for transient and stable gene delivery in a broad spectrum
of primary and established mammalian cells (Kost and Condreay 2002) as well. These
production systems have the advantage of carrying out the authentic post-translational
modifications, but the cost of setting-up and running industrial scale mammalian cell
cultures can be prohibitive and difficult to scale up.
Transgenic animals offer an alternative for producing recombinant proteins. A number
of proteins, including biopharmaceuticals, have been produced in the milk of transgenic
mice, pigs, sheep, and dairy cattle at concentrations of up to ten grams per liter
(Velander et al. 1992; Devinoy et al. 1994). Latest experiments have demonstrated that
the expression of recombinant proteins in egg white of transgenic chickens is a new
alternative for the animal expression systems (Harvey et al. 2002). But there are
potential social and ethical barriers associated with using animals as protein production
systems. In addition, gene transfer to domestic mammals such as sheep, goat, pigs and
cows is not a trivial process, and scale up is slow. There is generally a long
development phase before protein production begins and there are many regulatory
processes that have to be fulfilled (Echelard 1996).
I.1 Molecular Farming
Plants have been proven as versatile expression systems for many forms of different
recombinant proteins. Molecular farming is the production of pharmaceutically
important and commercially valuable proteins in plants (Schillberg et al. 2002; Fischer
et al. 2003). The tools of plant biotechnology that have been developed to improve
agronomics via herbicide, insect and virus resistance or to alter seed and fruit traits are
now being applied to generate new protein products for food, feed and pharmaceutical
industry. Plant expression systems are attractive because they offer advantages over the
classical expression systems based on bacterial, microbial and animal cells:
Chapter I Introduction
3
• Plant cells have a higher eukaryote protein synthesis pathway, similar to animal
cells with minor differences in protein glycosylation (Cabanes-Macheteau et al.
1999) whereas bacteria cannot perform most of the important mammalian post-
translational modifications. When differences between plant and mammal post-
translational processing do represent a problem, it may be possible to engineer
plants with altered protein maturation pathways (Bakker et al. 2001).
• Recombinant proteins can also be directed into plants intracellular compartments
such as vacuole, endoplasmic reticulum or protein bodies, where they are more
stable (Conrad and Fiedler 1998) They can be expressed in definite compartments
like chloroplast (Staub et al. 2000; Daniell et al. 2001) or even targeted to storage
organs such as seeds, where they remain stable for months even at ambient
temperatures, reducing the costs of distribution and storage (Stöger et al. 2000).
• Plant systems are more economical than industrial facilities using bioreactors for
cultivation of cell systems.
• The technology for harvesting and processing plants and plant products on a large
scale is already available.
• The purification requirement can be eliminated when the plant tissue containing
the recombinant protein is used as a food.
• Concerns about contamination of expressed proteins with human or animal
pathogens (HIV, hepatitis viruses) or the co-purification of blood borne pathogens
and oncogenic sequences, are entirely avoided by using plants.
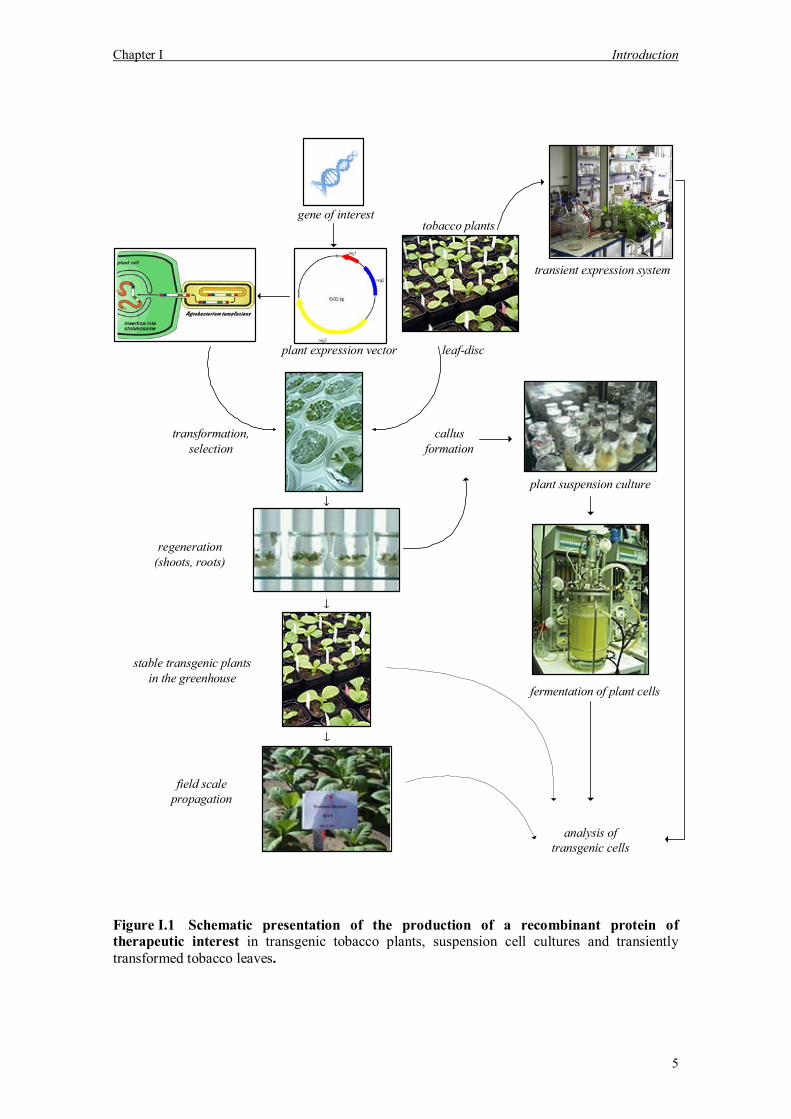
Molecular farming in plants can be accomplished by stable or transient expression of a
recombinant protein in plants. Transient gene expression can rapidly provide large
amounts of recombinant proteins for detailed structural and functional characterisation.
Both for transient and stable transformation, several aspects (for example the choice of
the host plant or the plant organ where expression of the protein is targeted) may
influence the details of the approach but in general the first step of the process consists
in adapting the gene of interest for expression (Figure I.1). Depending on the chosen
plant species, the adapted gene is introduced into plant cells, using well established
techniques like transformation by Agrobacterium tumefaciens based gene transfer
Chapter I Introduction
4
(Horsch et al. 1985), transformation by biolistics (Christou 1995) or by inserting the
transgene into a plant virus, which then enters the plant via the normal infection route
(Kumagai et al. 2000). In contrast to transient expression systems, stable transformation
is characterized by integration of the target gene into the host plant genome. Marker-
based selected transgenic plants are regenerated and selected for the presence of the
recombinant protein. The transgenic plants are then analysed to determine the level of
expression of the recombinant protein. Only those plants that produce satisfying
amounts of the recombinant protein are kept in the process. After a passage and
multiplication in the greenhouse, the offspring of the selected transgenic plants can be
grown in the field to assure large scale production of the necessary biomass. The newly
produced biomass is harvested using existing agricultural tools and the recombinant
protein is isolated and purified from the production plant.
As an alternative to whole plants, plant suspension cell cultures can be used for
recombinant protein production (James et al. 2000). Plant cells maintained in liquid
medium under gentle agitation form cell suspension cultures. The cells can be
transformed by any of the methods, except viral inoculation, discussed above, resulting
in cell lines that continuously produce a recombinant protein. When clinical use of
recombinant proteins is intended, their production under defined, controllable and
sterile conditions with straightforward purification protocols as can be done in flasks or
fermenters may be advantageous (Fischer et al. 1999). Suspended plant cells have been
used in several recent studies producing a variety of foreign proteins (Doran 2000).
These include recombinant antibodies and antibody fragments (Fischer, Liao and
Drossard 1999; Fischer et al. 1999), proteins of therapeutic value such as interferon-2
and 4 (Magnuson et al. 1998) and human antitrypsin (Terashima et al. 1999; Huang et
al. 2001). The most commonly used host species for protein synthesis in suspension
cultures is tobacco (James, Wang et al. 2000; Liu et al. 2001). For molecular farming
purposes, the expense of setting up and maintaining suspension cells in shaker flasks or
fermenters may be prohibitive. Recent experiments demonstrated that production of
commercially important enzymes like ß-glucuronidase and invertase is feasible but
unlikely to be competitive, since scaling up is too expensive when compared to the
minimal cost of agriculture (Doran 2000).
Chapter I Introduction
5
plant expression vector
gene of interest
leaf-disc
tobacco plants
transient expression system
callusformation
regeneration(shoots, roots)
plant suspension culture
fermentation of plant cells
analysis oftransgenic cells
field scalepropagation
stable transgenic plantsin the greenhouse
transformation,selection
Figure I.1 Schematic presentation of the production of a recombinant protein of therapeutic interest in transgenic tobacco plants, suspension cell cultures and transiently transformed tobacco leaves.
Chapter I Introduction
6
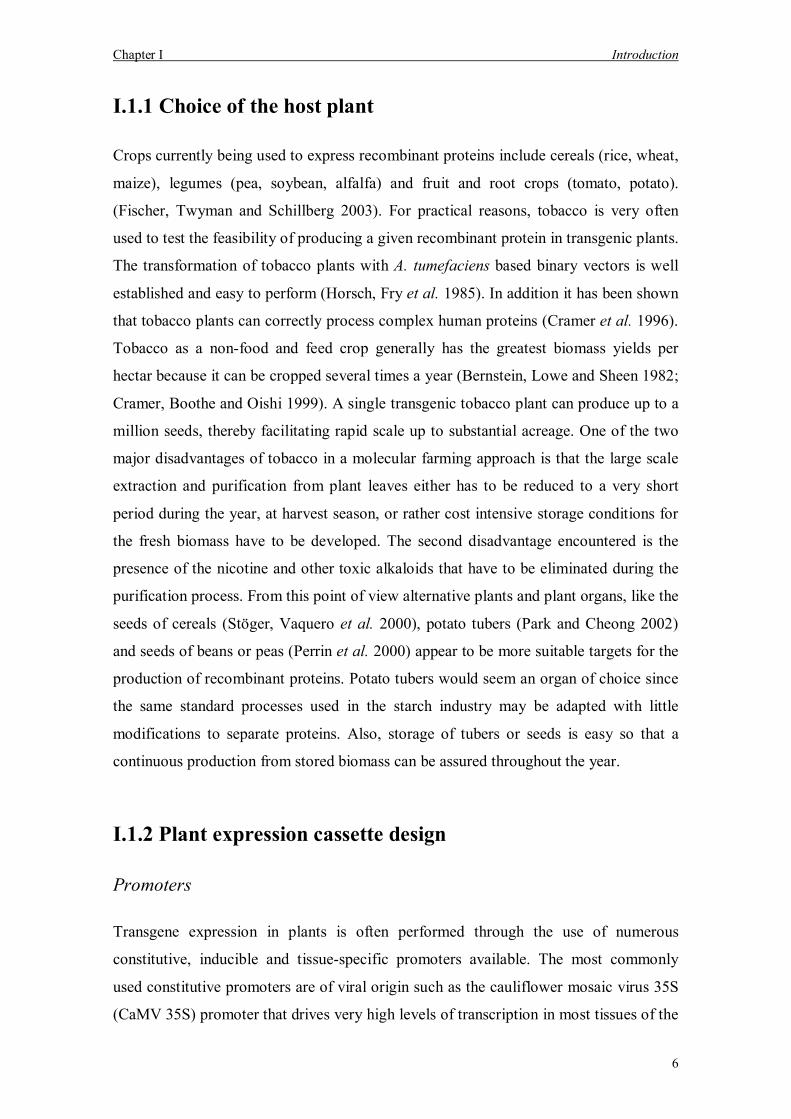
I.1.1 Choice of the host plant
Crops currently being used to express recombinant proteins include cereals (rice, wheat,
maize), legumes (pea, soybean, alfalfa) and fruit and root crops (tomato, potato).
(Fischer, Twyman and Schillberg 2003). For practical reasons, tobacco is very often
used to test the feasibility of producing a given recombinant protein in transgenic plants.
The transformation of tobacco plants with A. tumefaciens based binary vectors is well
established and easy to perform (Horsch, Fry et al. 1985). In addition it has been shown
that tobacco plants can correctly process complex human proteins (Cramer et al. 1996).
Tobacco as a non-food and feed crop generally has the greatest biomass yields per
hectar because it can be cropped several times a year (Bernstein, Lowe and Sheen 1982;
Cramer, Boothe and Oishi 1999). A single transgenic tobacco plant can produce up to a
million seeds, thereby facilitating rapid scale up to substantial acreage. One of the two
major disadvantages of tobacco in a molecular farming approach is that the large scale
extraction and purification from plant leaves either has to be reduced to a very short
period during the year, at harvest season, or rather cost intensive storage conditions for
the fresh biomass have to be developed. The second disadvantage encountered is the
presence of the nicotine and other toxic alkaloids that have to be eliminated during the
purification process. From this point of view alternative plants and plant organs, like the
seeds of cereals (Stöger, Vaquero et al. 2000), potato tubers (Park and Cheong 2002)
and seeds of beans or peas (Perrin et al. 2000) appear to be more suitable targets for the
production of recombinant proteins. Potato tubers would seem an organ of choice since
the same standard processes used in the starch industry may be adapted with little
modifications to separate proteins. Also, storage of tubers or seeds is easy so that a
continuous production from stored biomass can be assured throughout the year.
I.1.2 Plant expression cassette design
Promoters
Transgene expression in plants is often performed through the use of numerous
constitutive, inducible and tissue-specific promoters available. The most commonly
used constitutive promoters are of viral origin such as the cauliflower mosaic virus 35S
(CaMV 35S) promoter that drives very high levels of transcription in most tissues of the
Chapter I Introduction
7
plant (Benfey, Ren and Chua 1990). Further increase of the activity could be achieved
by modification of the enhancer region (Rathus, Bower and Birch 1993). Although the
constitutive promoters of viral origin can drive very high levels of expression, in some
cases deleterious effects such as gene slicing via cosuppression have been reported
(Koosha, Muller and Davis 1989). This phenomenon may be less common in the case of
constitutive promoters of plant origin such as maize ubiquitin-1 promoter (ubi-1)
(Christensen and Quail 1996) and rice actin-1 promoter (act-1). These constitutive
promoters facilitate widespread expression in the plant. However this is not always
advantageous since accumulation of recombinant proteins in vegetative organs may
adversely affect plant growth and regeneration. Rather than overexpressing a transgene
in all tissues, another option is to target expression of the transgene to specific organs
such as leaves, tubers or seeds. Promoters like sps1 promoter (Chavez-Barcenas et al.
2000) for leaf specific expression or patatin promoter (Park and Cheong 2002) for
tuber-specific expression have been identified and well characterized. A further
advantage of this option is that it enables the production of the desired product in easily
harvested tissues. In certain cases, it may be also advantageous for protein stability
and/or downstream processing if recombinant proteins are expressed by the use of
inducible promoters. A wound-inducible defence gene derived promoter (Cramer,
Weissenborn et al. 1996; Hansen et al. 1997) is an inducible promoter example for
recombinant protein expression in plants. The MeGA (mechanical gene activation)
system from CropTech is using a wound-inducible HMG2 (hydroxy-3-methylglutaryl
CoA reductase) promoter. When transgenic tobacco plants containing the MeGA
expression cassette are subjected to mechanical stress by shearing or shredding after
harvesting, gene expression occurs and recombinant protein is synthesized usually
within a 24-hour period.
Transcription terminator
In addition to the promoters, further factors to be considered in design of a plant
expression cassette relates to the type of polyadenylation signal or transcription
terminator to be used. The most commonly used transcription terminator/poly(A)
signals are derived from either the CaMV 35S RNA gene or the nopaline synthase (nos)
gene from A. tumefaciens. This has been used successfully in a wide variety of species
that include dicot and monocot plants (Gleave 1992). However, there are indications
Chapter I Introduction
8
that some plant-derived transcription terminators are more effective such as the 3`
noncoding regions of the Me1 gene (Ali and Taylor 2001) and the wheat histone H3
gene (Ohtsubo and Iwabuchi 1994). The use of the Me1 3 noncoding region has led to a
generalized enhancement of several fold in gene expression from promoters of different
classes (Ali and Taylor 2001) without any alteration in the expression pattern of the
promoters.
Targeting signals
Exploiting the innate protein sorting and targeted mechanisms that plant cells use to
target host proteins to organelles can increase accumulation levels of recombinant
proteins in plants. Protein targeting is important for three reasons in molecular farming.
Firstly, the destination of a protein affects its stability, which in turn affects the final
yield of the protein because total yield reflects not only the rate of production but also
that of degradation. Secondly, the destination of the protein is important if it needs to be
modified. Glycoproteins, for example, must be targeted to the secretory pathway since
glycans are added to proteins in the endoplasmic reticulum (ER) and golgi apparatus of
plant cells (Horvath et al. 2000). Thirdly, protein targeting may be essential for plant
survival. Proteins accumulating in the cytosol may be toxic, but the same protein
accumulating to the same or greater levels in the chloroplast or vacuole is often
tolerated because in this case they do not interfere with endogenous metabolism.
Specific amino acid sequences required for targeting of proteins to particular organelles
and for retention of proteins in organelles have been identified. Targeting signals can be
used to direct the protein for secretion (Voss et al. 1995; Magnuson, Linzmaier et al.
1998) or to intracellular organelles (ER, chloroplast, vacuole) (Moloney and Holbrook
1997). For example, for retrieval of secreted proteins to the ER, an H/KDEL sequence
near the carboxyl terminus specifies that a protein should remain in the ER, where the
nascent glycoprotein is retained in its high mannose form, identical between plants and
mammals. Targeting proteins for secretion to the intercellular space beneath the cell
wall (apoplast) has advantages for downstream processing and also leads to significant
levels of expression. But in case of naturally secreted proteins, ER retention can give
10-100 fold higher yields, presumably due to favourable molecular environment in the
ER lumen and the presence of chaperones (Conrad and Fiedler 1998).
Chapter I Introduction
9
Optimization of expression by codon usage
In plants, as in other eukaryotes, most synonymous codons of the genetic code are not
used with equal frequency but instead some codons are preferred, whereas others are
rare (van Hoof and Green 1997). Accordingly, the choice of codons has been suggested
to influence the rate of translation and mRNA degradation. One possible mechanism by
which rare codons can effect the rate of translation is that a ribosome may pause when
encountering a rare codon, because it may take longer for a rare isoaccepting t-RNA to
enter the A-site of the ribosome (Murray, Lotzer and Eberle 1989). A shortage of a
specific charged tRNA in bacteria can cause the ribosome to pause at codons translated
at that tRNA. As few as one (Hsu, Harms and Umbarger 1985) or two codons
(Yanofsky 2000) for which little charged tRNA are available can cause ribosomal
pausing in bacteria. Especially in cases were rare codons are present at the 5'-end of the
mRNA or in clusters expression levels are low and truncated protein products are found
(van Hoof and Green 1997). In addition, it became clear that the pattern of relative use
of synonymous codons was shown to differ between the taxonomic groups, primarily in
the use of G + C in the degenerate third base (Murray, Lotzer et al. 1989). Human genes
for example possess a GC content of 52.5%, where genes of potato plants contain only
42.9%, tobacco plants 43.5% and wheat plants 55.6%.
Different technically complex strategies have been used to palliate these problems. The
first is site directed mutagenesis studies to partially modify the coding sequence of the
gene of interest. Insecticidal toxin genes from Bacillus thrungiensis (B.t) when
expressed in plants without modification could only accumulate to minimal amounts
(Koziel, Carozzi and Desai 1996). Codons that inhibit efficient plant gene expression
were selectively removed throughout the coding sequence by site directed mutagenesis
to partially modify the gene without changing the amino acid sequence (Perlak et al.
1991). Among the most highly expressing tobacco and tomato plants, transgenic plants
with the partially modified (3% nucleotide difference) cryIA(b) gene had a 10-fold
higher level of insect control protein and plants with the fully modified (21% nucleotide
difference) cryIA(b) had a 100-fold higher level of recombinant cryIA(b) insect control
protein compared with the wild-type gene. The second approach is complete codon
engineering by replacing codons that are rarely found in the plant genes with more
favourable codons throughout the whole gene. The use of partially or fully modified
Chapter I Introduction
10
synthetic gene has the advantage to help solving all the problems resulting from
inappropriate codon usage and from other factors that could interfere with efficient
expression. Using this approach, a fully synthetic gene coding for the winter flounder
antifreeze protein (AFP) in corn (Georges, Saleem and Cutler 1990) and porcine alpha-
lactalbumin gene in the kernels of transgenic maize (Yang et al. 2002) were expressed.
However, in both of these studies a comparison for the expression level of the authentic
and plant codon optimised gene was not carried. Adang et al. compared plant codon
optimized cryIIIA delta-endotoxin gene of B.t. with native gene expression by
electroporation of dicot (carrot) and monocot (corn) protoplasts. CryIIIA-specific RNA
and protein was detected in carrot and corn protoplasts only after electroporation with
the rebuilt gene (Adang et al. 1993). On the other hand, it was demonstrated that plant
codon optimization of the human interleukin 4 gene for expression in tobacco plants did
not improve the level of the optimized protein when compared to the authentic protein
(Dr. Nicole Raven, Institut für Biologie VII, personal communication).
I.1.3 Plant Transformation
Plant transformation involves the transfer of genetic information from the natural source
of the desired protein into a suitable plant expression host. The most common methods
used are viral vectors (Porta and Lomonossoff 1996; Scholthof, Scholthof and Jackson
1996; MacFarlane and Popovich 2000; Toth et al. 2001), biolistic transformation
(Christou 1995; Drakakaki, Christou and Stöger 2000; Lepri et al. 2001), protoplast
transformation (Fromm, Taylor and Walbot 1985; Terzaghi and Cashmore 1997;
Newell 2000) and Agrobacterium mediated gene transfer (Horsch, Fry et al. 1985;
Hansen, Shillito and Chilton 1997; Zupan et al. 2000; Zupan, Ward and Zambryski
2002).
Agroinfiltration
In agroinfiltration, agrobacteria carrying the expression vector are delivered into leaf
tissue by vacuum infiltration. Bacterial proteins then catalyse the transfer of the gene of
interest into the host cells and protein expression can be detected 24 hours after
infiltration. As in conventional methods for generating transgenic plants, genes of
interest are cloned into binary vectors that are transferred into Agrobacterium strains. A
Chapter I Introduction
11
bacterial suspension is then used for vacuum infiltration of the leaves (Kapila et al.
1996; Vaquero et al. 1999) and no selection method to identify transformed cells is
required since the leaf tissue is only used for transient protein production. In
agroinfiltration the transferred DNA does not integrate into the host chromosome but is
present in the nucleus, where it is transcribed and this leads to transient expression of
the gene of interest (Kapila, De Rycke et al. 1996). Agroinfiltration is rapid and yields
sufficient quantities of protein for initial characterization of protein stability and
function. A major advantage is that multiple genes present in different populations of
agrobacteria can be simultaneously expressed. Thus the assembly of complex
multimeric proteins can be tested in plants (Vaquero, Sack et al. 1999). A further
advantage is that agroinfiltration can be scaled up to produce milligrams of recombinant
protein and may be even more suitable for pre-clinical trials without the need for the
production of stably transformed plants.
Expression in stably transformed plants
Initial structural and functional characterization of a recombinant protein can be
performed by transient expression in leaves. However, when long-term production of
complex molecules is anticipated, stable transformation is a prerequisite. Expression
levels can be optimised in stable transgenic plants, where the quantity of recombinant
protein obtained will only be ultimately limited by the harvested acreage. In addition
accumulation levels in stably transformed plants increased in following progenies (T1
and T2) (Zimmermann et al. 1998; Hood, Woodard and Horn 2002). There are two
major disadvantages to the use of stably transformed plants. The first is the timescale
and cost development, which reflects the need for greenhouse space in the several
months required for regeneration of the primary transformants. The second is the fact
that integrated nuclear transgenes are exquisitely sensitive to their chromatin
environment, resulting in a highly variable transgene expression level.
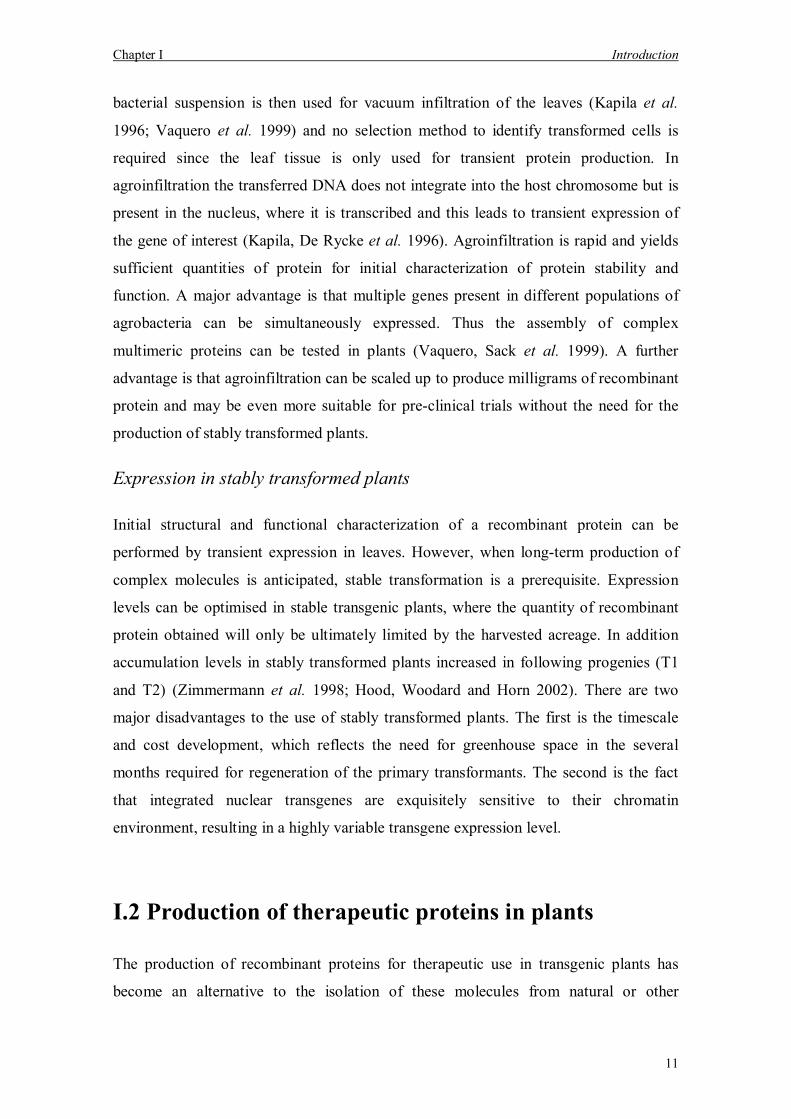
I.2 Production of therapeutic proteins in plants
The production of recombinant proteins for therapeutic use in transgenic plants has
become an alternative to the isolation of these molecules from natural or other
Chapter I Introduction
12
recombinant sources. Plant bioreactors may offer the possibility of an inexpensive
large scale production of high volumes of recombinant proteins with increased safety
concerning contaminations with human pathogens.
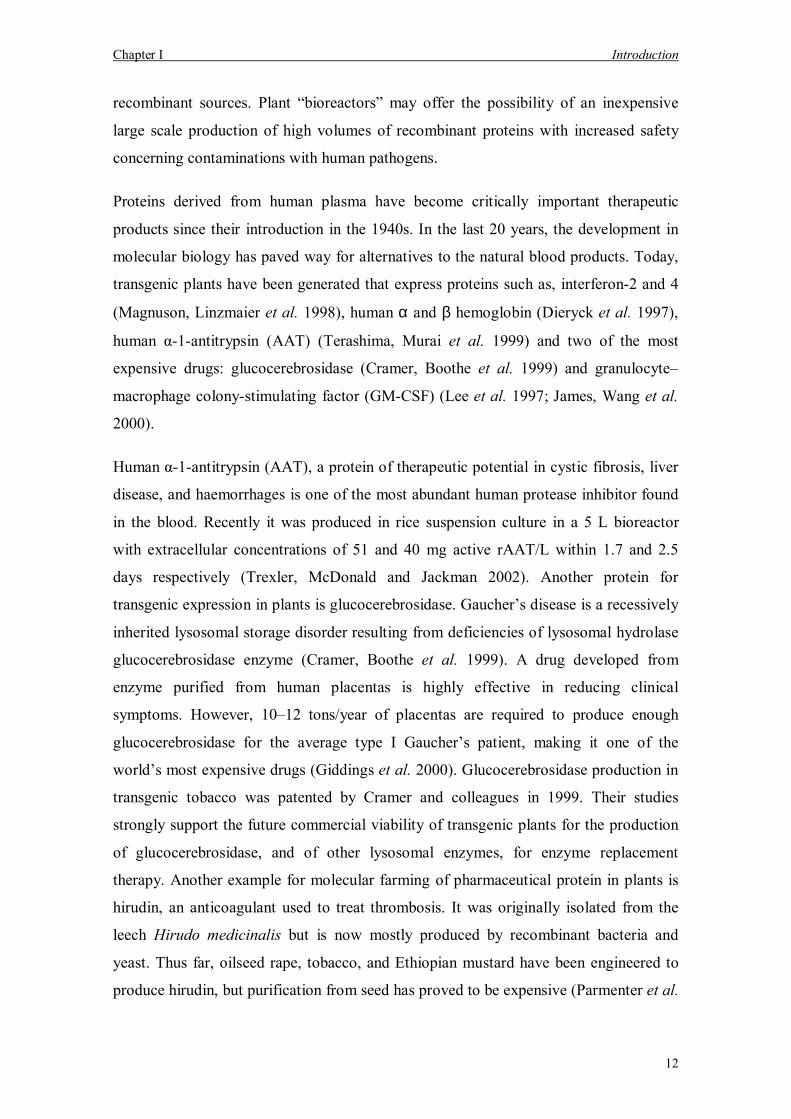
Proteins derived from human plasma have become critically important therapeutic
products since their introduction in the 1940s. In the last 20 years, the development in
molecular biology has paved way for alternatives to the natural blood products. Today,
transgenic plants have been generated that express proteins such as, interferon-2 and 4
(Magnuson, Linzmaier et al. 1998), human α and β hemoglobin (Dieryck et al. 1997),
human α-1-antitrypsin (AAT) (Terashima, Murai et al. 1999) and two of the most
expensive drugs: glucocerebrosidase (Cramer, Boothe et al. 1999) and granulocyte
macrophage colony-stimulating factor (GM-CSF) (Lee et al. 1997; James, Wang et al.
2000).
Human α-1-antitrypsin (AAT), a protein of therapeutic potential in cystic fibrosis, liver
disease, and haemorrhages is one of the most abundant human protease inhibitor found
in the blood. Recently it was produced in rice suspension culture in a 5 L bioreactor
with extracellular concentrations of 51 and 40 mg active rAAT/L within 1.7 and 2.5
days respectively (Trexler, McDonald and Jackman 2002). Another protein for
transgenic expression in plants is glucocerebrosidase. Gauchers disease is a recessively
inherited lysosomal storage disorder resulting from deficiencies of lysosomal hydrolase
glucocerebrosidase enzyme (Cramer, Boothe et al. 1999). A drug developed from
enzyme purified from human placentas is highly effective in reducing clinical
symptoms. However, 1012 tons/year of placentas are required to produce enough
glucocerebrosidase for the average type I Gauchers patient, making it one of the
worlds most expensive drugs (Giddings et al. 2000). Glucocerebrosidase production in
transgenic tobacco was patented by Cramer and colleagues in 1999. Their studies
strongly support the future commercial viability of transgenic plants for the production
of glucocerebrosidase, and of other lysosomal enzymes, for enzyme replacement
therapy. Another example for molecular farming of pharmaceutical protein in plants is
hirudin, an anticoagulant used to treat thrombosis. It was originally isolated from the
leech Hirudo medicinalis but is now mostly produced by recombinant bacteria and
yeast. Thus far, oilseed rape, tobacco, and Ethiopian mustard have been engineered to
produce hirudin, but purification from seed has proved to be expensive (Parmenter et al.
Chapter I Introduction
13
1995). The development of transgenic plants in which hirudin genes are fused to oleosin
genes is likely to make purification easier and cheaper. The fusion construct is designed
to contain an endoprotease recognition site between the two genes, enabling the
eventual cleavage of the recombinant fusion protein and the recovery of the hirudin.
Oleosinhirudin fusion proteins are isolated with oil bodies, from which they can be
easily separated by flotation centrifugation. This method of purification ensures that
hirudin in the plants only becomes active after harvesting, thus limiting environmental
exposure. Oilseed rape transgenic for hirudin is now grown commercially in Canada by
SemBioSys (Calgary, Canada) (Giddings, Allison et al. 2000).
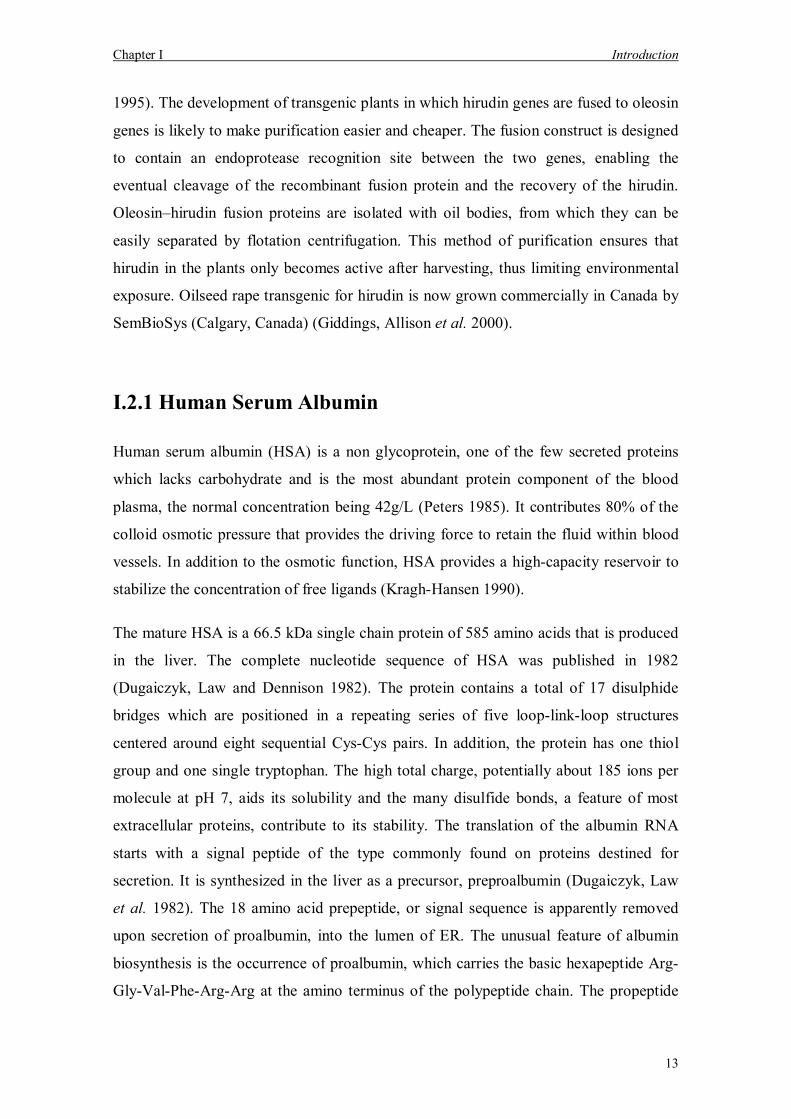
I.2.1 Human Serum Albumin
Human serum albumin (HSA) is a non glycoprotein, one of the few secreted proteins
which lacks carbohydrate and is the most abundant protein component of the blood
plasma, the normal concentration being 42g/L (Peters 1985). It contributes 80% of the
colloid osmotic pressure that provides the driving force to retain the fluid within blood
vessels. In addition to the osmotic function, HSA provides a high-capacity reservoir to
stabilize the concentration of free ligands (Kragh-Hansen 1990).
The mature HSA is a 66.5 kDa single chain protein of 585 amino acids that is produced
in the liver. The complete nucleotide sequence of HSA was published in 1982
(Dugaiczyk, Law and Dennison 1982). The protein contains a total of 17 disulphide
bridges which are positioned in a repeating series of five loop-link-loop structures
centered around eight sequential Cys-Cys pairs. In addition, the protein has one thiol
group and one single tryptophan. The high total charge, potentially about 185 ions per
molecule at pH 7, aids its solubility and the many disulfide bonds, a feature of most
extracellular proteins, contribute to its stability. The translation of the albumin RNA
starts with a signal peptide of the type commonly found on proteins destined for
secretion. It is synthesized in the liver as a precursor, preproalbumin (Dugaiczyk, Law
et al. 1982). The 18 amino acid prepeptide, or signal sequence is apparently removed
upon secretion of proalbumin, into the lumen of ER. The unusual feature of albumin
biosynthesis is the occurrence of proalbumin, which carries the basic hexapeptide Arg-
Gly-Val-Phe-Arg-Arg at the amino terminus of the polypeptide chain. The propeptide
Chapter I Introduction
14
does not appear to effect ligand binding or other properties of albumin, and its purpose
may be to guide the new polypeptide chain through the cytoplasm to the Golgi complex
for proteolytic processing and secretion (Lawn et al. 1981).
Currently human serum albumin (HSA) is prepared by fractionation of donated blood
plasma and is used in plasmaphoresis, fluid replacement, the treatment of burns,
traumatic shock, diuretic-resistant oedema and for some groups of surgical patients
(Goodey 1993).
The characteristic binding locations and chemistry for a selection or representative
biological and pharmaceutical ligands for HSA were determined. The protein has been
described as the major colloid that retains fluid in the vascular system, acting as a tramp
streamer by dithering (a mixed cargo of metabolites around various organs (Kragh-
Hansen 1990). Of these, long chain fatty acids are quantitatively the most abundant,
with the normal loading being approximately two fatty acids per molecule of albumin
(Petitpas et al. 2001). HSA also binds bilirubin (Petersen et al. 2000; Weisiger et al.
2001), amino acids, numerous drugs (Ozer and Tacal 2001; Petitpas et al. 2001) and
heavy metals and is implicated in the transfer of many ligands across organ-circulatory
interfaces such as liver, intestine, kidney and brain. The molecule has been succinctly
described as the protein that makes blood thicker than water.
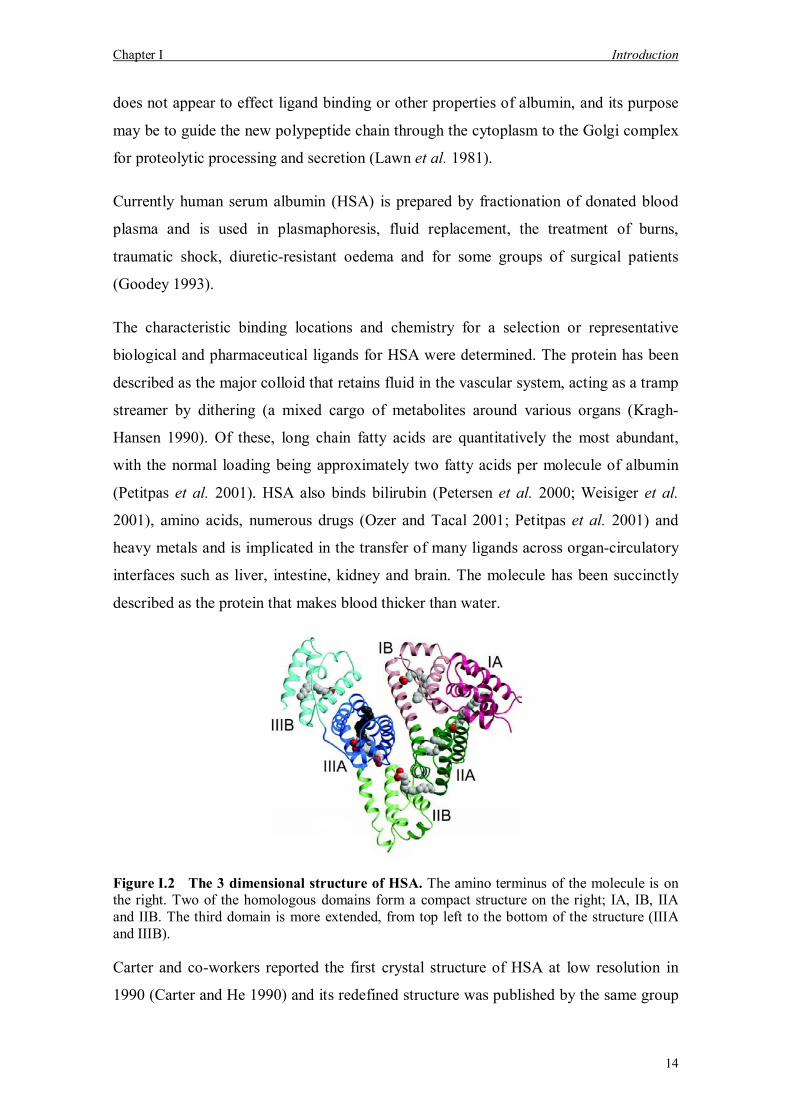
Figure I.2 The 3 dimensional structure of HSA. The amino terminus of the molecule is on the right. Two of the homologous domains form a compact structure on the right; IA, IB, IIA and IIB. The third domain is more extended, from top left to the bottom of the structure (IIIA and IIIB).
Carter and co-workers reported the first crystal structure of HSA at low resolution in
1990 (Carter and He 1990) and its redefined structure was published by the same group
Chapter I Introduction
15
(He and Carter 1992) (Figure 1.2). The structure composed of three domains I, II and
III, which confer to the protein a heart shaped molecule. Each domain is a product of
two subdomains that possess common structural motifs. The principal regions of ligand
binding to human serum albumin are located in hydrophobic cavities in subdomains IIA
and IIIA, which exhibit similar chemistry. The subdomains share a number of common
features, such as the hydrophobic face, the cluster of basic amino acid residues, and
proline residues at the tips of the long loops. However, it is known that each subdomain
is also unique and probably exhibits a certain degree of binding specificity (Gelamo et
al. 2002). More recently a new triclinic crystal form of native or Pichia pastoris
expressed recombinant HSA (rHSA) was obtained at the highest resolution level (2.5 Å)
reported so far (Sugio et al. 1999). The structures of pool plasma HSA (pHSA) and
rHSA have a root mean square (r.m.s) deviation of 0.24 °A over all C-alpha atoms,
which implies that two of the proteins are virtually identical.
I.2.2 Recombinant HSA expression
HSA is the most abundant protein in human plasma involved in the maintenance of a
normal osmolarity and also in the transport of hydrophobic molecules. This protein has
a big market requirement in that it can be used as replacement fluid during septic or
traumatic shock, to compensate for blood loss, and to treat burn victims. At present,
HSA is largely produced (300 tons/year) by conventional techniques involving
fractionation of plasma obtained from blood donors (Saliola et al. 1999). It would be a
great advantage to be able to use genetic engineering to obtain rHSA in good yield and
at lower cost, with no danger of contamination by human pathogens. For this reason,
great efforts have been dedicated to the production of this protein on a large scale by
transgenic organisms. To date, expression of rHSA has been studied in E.coli, (Lawn,
Adelman et al. 1981; Latta et al. 1990) Bacillus subtilis (Saunders et al. 1987),
Saccharomyces cerevisiae (Quirk et al. 1989; Sleep, Belfield and Goodey 1990;
Okabayashi et al. 1991; Kang et al. 2000), Kluyveromyces lactis (Saliola, Mazzoni et al.
1999), Pichia pastoris (Ohi et al. 1998; Ohtani et al. 1998) and potato (Solanum
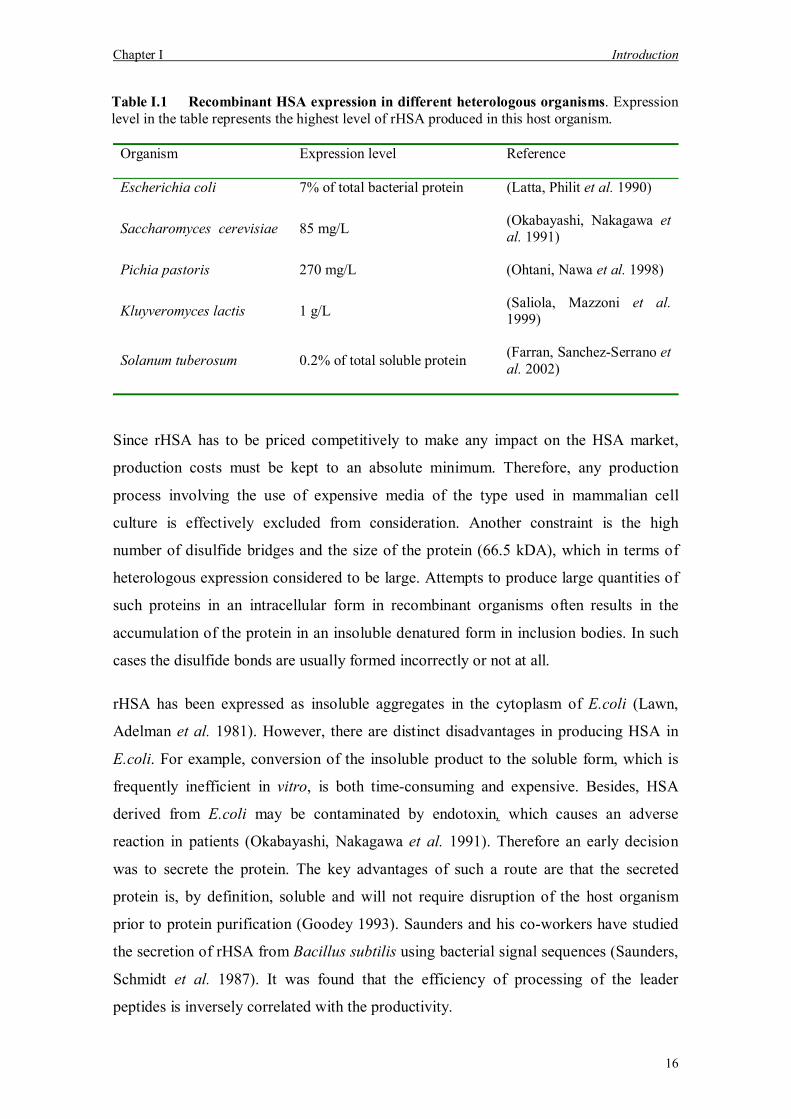
tuberosum) (Sijmons et al. 1990; Farran et al. 2002). (Table I.1).
Chapter I Introduction
16
Table I.1 Recombinant HSA expression in different heterologous organisms. Expression level in the table represents the highest level of rHSA produced in this host organism.
Organism Expression level Reference
Escherichia coli 7% of total bacterial protein (Latta, Philit et al. 1990)
Saccharomyces cerevisiae 85 mg/L (Okabayashi, Nakagawa et al. 1991)
Pichia pastoris 270 mg/L (Ohtani, Nawa et al. 1998)
Kluyveromyces lactis 1 g/L (Saliola, Mazzoni et al. 1999)
Solanum tuberosum 0.2% of total soluble protein (Farran, Sanchez-Serrano et al. 2002)
Since rHSA has to be priced competitively to make any impact on the HSA market,
production costs must be kept to an absolute minimum. Therefore, any production
process involving the use of expensive media of the type used in mammalian cell
culture is effectively excluded from consideration. Another constraint is the high
number of disulfide bridges and the size of the protein (66.5 kDA), which in terms of
heterologous expression considered to be large. Attempts to produce large quantities of
such proteins in an intracellular form in recombinant organisms often results in the
accumulation of the protein in an insoluble denatured form in inclusion bodies. In such
cases the disulfide bonds are usually formed incorrectly or not at all.
rHSA has been expressed as insoluble aggregates in the cytoplasm of E.coli (Lawn,
Adelman et al. 1981). However, there are distinct disadvantages in producing HSA in
E.coli. For example, conversion of the insoluble product to the soluble form, which is
frequently inefficient in vitro, is both time-consuming and expensive. Besides, HSA
derived from E.coli may be contaminated by endotoxin, which causes an adverse
reaction in patients (Okabayashi, Nakagawa et al. 1991). Therefore an early decision
was to secrete the protein. The key advantages of such a route are that the secreted
protein is, by definition, soluble and will not require disruption of the host organism
prior to protein purification (Goodey 1993). Saunders and his co-workers have studied
the secretion of rHSA from Bacillus subtilis using bacterial signal sequences (Saunders,
Schmidt et al. 1987). It was found that the efficiency of processing of the leader
peptides is inversely correlated with the productivity.
Chapter I Introduction
17
One problem with rHSA accumulation that has been observed is that a proportion of the
secreted rHSA molecules are shorter than the full-length protein, the nature and amount
of these truncated molecules vary according to the producer organism, growth regime
leader sequence adopted (Sleep, Belfield et al. 1990). These molecules may be the result
of proteolytic degradation of the full-length protein or incomplete translation of the
mRNA. Saccharomyces cerevisiae has long been known to secrete few or no
extracellular proteases, however investigations carried out in recent years have begun to
reveal that extracellular proteolysis represents one of the most significant barriers to the
secretory production of heterologous proteins in this host organism. For example, the
main problem in the production of rHSA in S. cerevisiae was found to be the
extracellular proteolytic cleavage of the recombinant protein during prolonged culture
(Kang, Choi et al. 2000). In another study, rHSA expressed in the yeast S. cerevisiae
accumulated in the insoluble fraction in a denatured form (Quirk, Geisow et al. 1989).
Extraction of the product requires cell breakage, solubilization, reduction and
renaturation prior to purification (Goodey 1993). Such downstream processing would
not be practical at the scale envisaged for rHSA and would certainly not be cost
effective.
It was reported that the electrophoretic karyotype of S. cerevisiae may not necessarily
be stable. For example, during serial cultivation of S. cerevisiae wild strain,
modifications of electrophoretic karyotype were observed at 55 generations (Longo and
Vezinhet 1993). Pichia pastoris is frequently used as an efficient host for heterologous
gene expression, the high stability of chromosomal DNA in large-scale fermentation is
required for stable production, especially for pharmaceutical products. From this point
of view, the gene stability of a P. pastoris recombinant strain expressing rHSA after
long-term serial cultivation under the conditions of vegetative and non- selective growth
was investigated (Ohi, Okazaki et al. 1998). Isolates from 83 generations showed HSA
production, suggesting that elimination of HSA expression constructs hardly occurred
during serial cultivation. In addition, the cells of each generation produced the almost
same amount of HSA, approximately 110 µg/ml. Thus, P. pastoris was found to have
superior gene stability; therefore, it is regarded as a suitable host for heterologous gene
expression even on an industrial scale.
Chapter I Introduction
18
Kluyveromyces lactis is another promising organism that can be used as an alternative
host due to its good secretory properties. Under the control of the KlADH4 promoter K.
lactis cells grow in complex and defined media resulting in a high biomass production
(70 to 80 g dry-cell weight/L), and a significant amount of rHSA production was
observed in fed-batch cultures (1 g/L) when compared to batch cultures (0.2 to 0.3 g/L)
(Saliola, Mazzoni et al. 1999).
Sijmons et al. (1990) have shown that rHSA can be produced in leaves of transgenic
tobacco and potato and tobacco suspension cells. The transgenic constructs contained
either the authentic HSA signal peptide or a preseqeunce from the extracellular PR-S
protein from tobacco fused to the coding region of HSA. The secreted protein was either
isolated from leaf tissue or from plant cell suspension cultures. Chromatographically
purified rHSA was analysed by N-terminal amino acid sequencing. The recombinant
protein containing the human signal peptide was not correctly processed, while the
construct with the plant specific prepropeptide allowed the production of correctly
cleaved rHSA in transgenic plants, and transgenic tobacco suspension cell lines. Plant
specific signal sequence facilitates secretion of 0.25µg rHSA/mg protein into the culture
medium. However, expression levels were, too low for most commercial applications
being 0.02% of the total soluble protein in shoot and young leaves, and five times lower
in roots and tubers.
Recently Farran and his co-workers studied expression of rHSA in tubers of transgenic
potato plants (Farran, Sanchez-Serrano et al. 2002). HSA gene was cloned under the
B33 promoter of patatin (a specific tuber promoter). The rHSA amino terminal was
fused to a tuber signal peptide (protease inhibitor II) and Agrobacterium mediated gene
transfer to potato leaves was performed. rHSA was detected in the tubers of transgenic
potato plants, the highest accumulation level reaching to 0.2% of the tuber soluble
protein. This higher level than the previous report by Sijmons et al. (1990) was
attributed to the differences in the expression cassettes used for transformation.
I.4 Aim of the Study
Plant molecular biotechnology is receiving increasing attention because it is a source for
innovation for the agriculture, food, chemical and pharmaceutical industry. Besides
Chapter I Introduction
19
genetic engineering is conventionally used for transferring beneficial traits to plant, a
recent emerging field is the production of recombinant proteins in plants. The increasing
demand for pharmaceutically safe and active human proteins can no longer be met by
merely purifying from original sources as the supply of human blood, placenta or other
tissues and organs as starting material for the purification of proteins is limited. In
addition, several examples have shown in the past that the extraction of proteins from
human tissue is not free of risk of contamination with pathogens such as HIV, Hepatitis
B virus or prions and thus may lead to the transmission of infectious diseases to the
treated patients. In the future, demand for existing biopharmaceuticals (e.g.,
erythropoietin, insulin and human serum albumin), as well as new therapeutic proteins
discovered through genomics, is expected to rise considerably. Therefore, it is prudent
to evaluate alternative transgenic production systems and determine how the future
availability of safe recombinant biopharmaceuticals can be ensured in a cost-effective
manner. Plants as bioreactor offer the possibility of an inexpensive large-scale
production of high volumes of recombinant proteins with increased safety concerning
contaminations with human pathogens. Due to increasing demand on albumin,
alternative ways to obtain HSA is highly attractive both to decrease the dependence on
blood banks and to reduce possible health hazards, such as AIDS, hepatitis that may be
transmitted during infusion of contaminated blood derived products.
The primary task of this thesis was the establishment of an expression system for the
production of rHSA that is used in fluid replacement, the treatment of burns, traumatic
shock and for some groups of surgical patients. Aim of this study will be achieved by
the following approaches:
⇒ Plant codon optimization: Since codon usage pattern of human proteins does not
match the pattern found in plants, HSA needs to be codon optimised for optimal
expression in the foreign host. A new strategy will be developed for the assembly of a
semi-synthetic plant codon optimised HSA using PCR.
⇒ Expression of rHSA in different organisms: In order to evaluate different expression
systems in terms of their efficiencies for molecular farming purposes, rHSA will be
expressed in bacteria, tobacco, wheat plants and tobacco suspension cells. Protein
accumulation endoplasmic reticulum (ER) using a KDEL retention signal.

Chapter I Introduction
20
⇒ Purification of rHSA from transgenic tobacco leaves: An efficient purification
method will be needed to establish an efficient protocol in order to obtain better or equal
to the quality of the existing HSA obtained by blood fractionation.
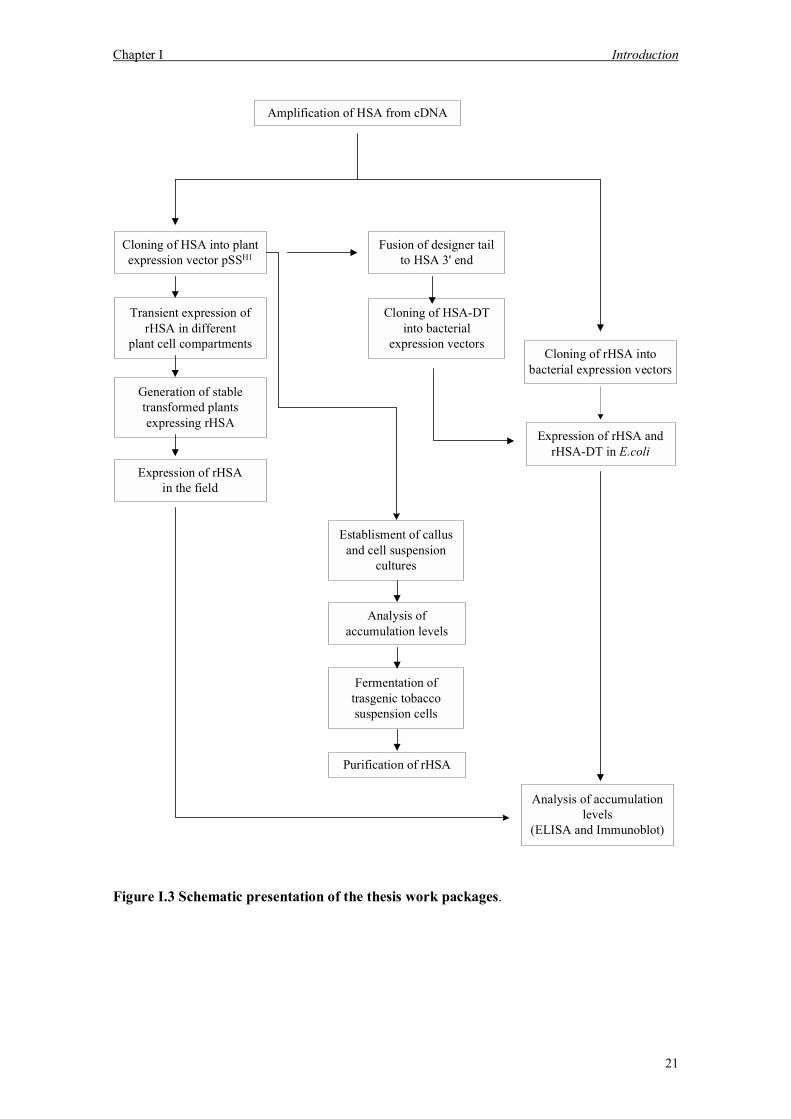
A schematic overview of the thesis is presented in Figure I.3.
Chapter I Introduction
21
Amplification of HSA from cDNA
Cloning of HSA into plantexpression vector pSSH1
Transient expression ofrHSA in different
plant cell compartments
Generation of stabletransformed plantsexpressing rHSA
Cloning of rHSA intobacterial expression vectors
Expression of rHSA andrHSA-DT in E.coli
Analysis of accumulationlevels
(ELISA and Immunoblot)
Expression of rHSAin the field
Analysis ofaccumulation levels
Establisment of callusand cell suspension
cultures
Fermentation oftrasgenic tobaccosuspension cells
Purification of rHSA
Cloning of HSA-DTinto bacterial
expression vectors
Fusion of designer tailto HSA 3' end
Figure I.3 Schematic presentation of the thesis work packages.
Chapter II Material and Methods
22
II Materials and Methods
II.1 Materials
II.1.1 Chemicals and consumables
Laboratory chemicals used throughout the work were purchased from the following
companies: Bio-Rad (München), Boehringer (Mannheim), Fluka (Neu-Ulm), Gibco
BRL (Eggenstein), ICN (Eschwege), Merck (Darmstadt), MWG-Biotech (Ebersberg),
Pharmacia (Freiburg), Pierce (Rockford, IL, USA), Roche (Mannheim), Roth
(Karlsruhe), Serva (Heidelberg), Sigma (Deisenhofen). The consumables were
purchased from: Biozym (Hess, Oldendorf), Eppendorf (München), Greiner (Solingen),
Kodak (Stuttgart), Millipore (Eschborn), Nunc (Biebrich), Roth (Karlsruhe), Schott
Glaswerke (Mainz), Serva (Heidelberg), USB/Amersham (Braunschweig), Whatman
(Bender & Hobeim, Bruchsal) and Zeiss (Oberkochen).
II.1.2 Enzymes and reaction kits
Restriction enzymes either from New England Biolabs (Schwalbach) or Gibco BRL
were used for DNA digestion. ExpandTM high fidelity DNA Taq polymerase from
Boehringer Mannheim was used for PCR amplification (II.2.3.6). DNA Taq polymerase
from Gibco BRL was used for identification of recombinant bacteria by PCR
(II.2.3.6.1).
The following kits were used:
QIAprep spin Miniprep kit Qiagen (Hilden)
QIAquick gel extraction kit Qiagen
QIAquick PCR purification kit Qiagen
QIAquick plasmid Midi kit Qiagen
QIAquick plasmid Maxi kit Qiagen
Thermosequenase Cycle Sequencing Kit USB/Amersham (Braunschweig)
PCR 2.1 TOPO Cloning Kit Invitrogen
Chapter II Material and Methods
23
II.1.3 Media stock solutions and buffers
All buffers, media and solutions were prepared according to standard protocols, as
described (Sambrook, Fritsch and Maniatis 1996; Coligan, Kruisbeek and Margulies
1998) except special buffers listed at the end of the corresponding method description.
Heat-sensitive additives, such as antibiotics, were prepared as stock solutions, filter-
sterilized (pore size; 0.2µm) and added to the medium after cooling to 50°C. Plant cell
culture media and chromatography buffers were prepared with ultra pure water.
II.1.4 Antibodies and substrates
Mouse anti-human serum albumin (HSA) monoclonal antibody (Sigma) was used as the
primary antibody and alkaline phosphatase (AP) conjugated goat anti-mouse IgG (H+L)
(Jackson ImmunoResearch, West Grove, PA, USA; distributor: Dianova, Hamburg) as
secondary antibody for detection of HSA by immunoblot (II.4.8). AP conjugated rabbit
anti chicken (Fc) (Dianova, Hamburg) as primary antibodies and pNPP (Sigma) as
substrate tablets were used in the titer determination of polyclonal antibodies from
chicken egg yolk (II.4.9.1). Polyclonal affinity purified goat-anti-HSA antibody
(NatuTec, Frankfurt) was used for coating of ELISA plates (II.4.9.2). Peroxidase
conjugated IgG fraction of rabbit anti-HSA antibody (Rockland, USA) was used as the
primary antibody. For detection of peroxidase, ABTS substrate tablets and buffer were
purchased from Boehringer Mannheim.
II.1.5 Plasmid Vectors
II.1.5.1 pHSA36 and pHSA206
Human serum albumin cDNA that was obtained from in vitro translation of human liver
mRNA was cloned into two pBR322 plasmid vectors; (Dugaiczyk, Law et al. 1982)
pHSA36 and pHSA206. These two plasmids share 0.15 kilo base of homologous DNA.
Together they encode the entire sequence of HSA, starting with the CTT codon for Leu
at position 10 of the prepeptide and extending into the 3 untranslated region of polyA.
Chapter II Material and Methods
24
Plasmids pHSA36 and pHSA206 were a kind gift from Prof. Dr. Kreuzaler (RWTH
Aachen, Institute for Biology I).
II.1.5.2 PCR 2.1-TOPO
PCR 2.1-TOPO (Invitrogen) has a size of 3.9 kb and contains ampicillin and kanamycin
resistance markers, lacZ reporter gene, T7 promoter, EcoRI sites flanking the PCR
insertion site, and the f1 origin of replication. The vector has been engineered to be a
linearized plasmid with 3' deoxythymidine (T) overhangs that is activated by being
covalently bonded to topoisomerase I. The 3' A overhangs of the PCR product
complement the 3' T overhangs of the vector and allow for fast ligation with the already
present topoisomerase I. PCR 2.1-TOPO was used for cloning the plant codon
optimised HSA after SOE PCR amplification.
II.1.5.3 pGEM-3(zf)+
pGEM-3(zf)+ (Promega, GenBank: X65306) has a size of 3.2 kb and contains the origin
of replication of the filamentous phage f1. The pGEM-3Zf(+) vector contains SP6 and
T7 RNA polymerase promoters flanking a region of multiple cloning sites within the
alpha-peptide coding region of beta-galactosidase. pGEM-3zf was used for cloning and
amplification of foreign DNA in E.coli and thereby functioned as an intermediate vector
before cloning the plant expression cassettes into plant expression vector pSSH1 (Voss,
Niersbach et al. 1995).
II.1.5.4 pUC18
For cloning and amplification of foreign DNA in E.coli high copy number pUC18
vector was used (Yanisch-Perron, Vieira and Messing 1985). pUC18 is a derivative of
pBR322 vector with a size of 2.7 kb. The plasmid encodes resistance to ampicillin and
has a multiple cloning site within the lacZ alpha-fragment. Inserts cloned into this site
disrupt beta galactosidase activity and resulting in white colonies on X-Gal/IPTG plates.
II.1.5.5 pET 21d(+)
The pET21a(+) vector (Novagen, Madison WI, USA) has a size of 5.4 kb and contains
the origin of replication of the filamentous phage f1. It carries T7 promoter plus a C-
terminal his tag sequence with ampicillin resistance gene as a selectable marker.
Chapter II Material and Methods
25
pET21a(+) was used for the expression of human serum albumin (HSA) in the
cytoplasm of E. coli and his tag sequence allowed the purification of the recombinant
protein via immobilized metal affinity chromatography (II.6.1).
II.1.5.6 pET 22b(+)
The pET22b(+) vector (Novagen) has a size of 5.5 kB and contains the origin of
replication of the filamentous phage f1. It carries a T7 promoter an N-terminal pelB
signal sequence for periplasmic localization, plus C-terminal his tag sequence with
ampicillin resistance gene as a selectable marker. pET22b(+) was used for the
periplasmic expression of HSA and his tag sequence allowed the purification of the
recombinant protein via immobilized metal affinity chromatography (II.6.1).
II.1.5.7 pSSH1
For transformation of Agrobacterium tumefaciens and transient and stable expression of
rHSA in plants, plant expression vector pSSH1 (Voss, Niersbach et al. 1995) was
utilized. Vector pSSH1 (10.3 kB, AmpR, CarbR and KmR) is a derivative of the binary
vector pPCV002 (Koncz and Schell 1986)and contains the Cauliflower Mosaic Virus
(CaMV35S) expression cassette from pRT101 (Töpfer et al. 1988)with a duplicated 35S
enhancer region (Kay et al. 1987) and the termination and polyadenylation signal of the
CaMV35S.
II.1.5.8 pAL76
For particle bombardment of wheat, plant expression vector pAL76 was used. It
contains the ubiquitin 1 promoter and intron 1 from maize (Christensen and Quail
1996)and the nos terminator. Vector pAL76 was a kindly provided by Dr. Eva Stöger
(RWTH Aachen, Institute for Biology VII).
Chapter II Material and Methods
26
II.1.6 Oligonucleotides
All primers used in this study were synthesized and HPLC purified by MWG-Biotech.
Stock solutions of 100 pmol in autoclaved and filter sterilized (0.2µm) bidestilled water
was prepared and stored at -20°C.
• Primers used for SOE-PCR to combine two overlapping HSA cDNA
fragments derived from the recombinant plasmids pHSA36 and pHSA206
(III.1).
HSAforwardnew: 5- GGC GAA TTC CAT GGA TGC ACA CAA GAG TGA GGT TGC-3 (36 mer)
HSAbackward: 5-GCG AAG CTT GTC GAC TAA GCC TAA GGC AGC TTG ACT TG-3 (38 mer)
SOE-HSA-For: 5-GCC AGA AGA CAT CCT TAC TTT TAT GCC CCG-3 (30 mer)
SOE-HSA-Back: 5-CGG GGC ATA AAA GTA AGG ATG TCT TCT GGC-3 (30 mer)
• Primers used for DNA sequencing (II.2.3.7). Primers were labelled at the
5end with IRD 700 or IRD 800.
Universe: 5-GTT GTA AAA CGA CGG CCA GT-3 (20 mer)
Reverse: 5-ACA CAG GAA ACA GCT ATG AC-3 (20 mer)
PSS 5: 5-ATC CTT CGC AAG ACC CTT CCT CT-3 (23 mer)
PSS 3: 5-AGA GAG AGA TAG ATT TGT AGA GA-3 (23 mer)
HSAseqf1: 5- GAC TCA AAT GTG CCA GTC TCC- 3(21 mer)
HSAseqf2: 5 GTT ACA CCA AGA AAG TAC CCC AAG- 3 (24 mer)
HSAseqb1: 5- GGT GTA ACG AAC TAA TAG CG-3 (20 mer)
HSAseqb2: 5- GGC ACA TTT GAG TCT CTG TTT GG-3 (23 mer)
Modseqf1: 5- AGG CTT CCT CTG CCA AAC AGA GG-3 (23 mer)
Modseqb1: 5- TTG AGC CTC TGT TTG GCA GAG G-3 (22 mer)
Modseqf2: 5- ACC TCT TGT GGA AGA GCC TCA G-3 (22 mer)
Modseqb2: 5- CTG AGG CTC TTC CAC AAG AGG-3 (21 mer)
• Primers used for SOE-PCR to optimize codon usage of HSA cDNA (III.2)
In order to amplify plant codon optimised HSA via SOE PCR, 27- 83 nucleotides long
32 different primers were used as the building blocks. HSAmod1-16 as forward primers
Chapter II Material and Methods
27
and HSAmod7-32 as backward primers were used in the reaction mix. Forward and
backward primers have complementary sequences differing in length of 21-24
nucleotides. Sequences of HSAmod1- HSAmod32 are listed in the (VIII.2).
II.1.7 Biological Materials
II.1.7.1 Escherichia coli strains
Throughout this work, the following E.coli strains were used as recipient of foreign
DNA for the propagation and isolation of plasmid DNA and for protein expression.
Strain Source Genotype
DH5α
(Ausubel, Brent and Kingston 1994)
endA1hsdR17(rk-mk
+)supE44thi-IrecA 1gyrA(Nalr) relA1D (lacIZYA-argF) U169 deoR (phi80dlacD(lacZ)M15)
BL21(DE3) Stratagene F ompT gal [dcm] (Adang, Brody et al.) hsdSB (rB mB; an E. coli B strain) with DE3, a λ prophage carrying the T7 RNA polymerase gene
II.1.7.2 Agrobacterium tumefaciens
Agrobacterium tumefaciens strain GV3101 carrying the helper plasmid pMP90RK
(GMR, KMR, RifR) (Koncz and Schell 1986) was used for Agrobacterium-mediated
gene transfer.
II.1.7.3 Plants
N. tabacum L. cv. Petite Havana SR1, Badische Geudertheimer K.31, Virginia ITP,
Adonis Schwester, Barley Jupiter, Barley Saturn, Korso, Nicotine free tobacco (NFT)
51 and Maryland Mammoth were used for transient expression by agrobacterial vacuum
infiltration (II.2.2.5). Petite Havana SR1 plants were also used for the generation of
stably transformed plants (II.2.2.6).
N. tabacum L. cv. Bright Yellow 2 (BY-2) suspension cells were used for stable
expression of recombinant HSA (II.2.2.4).
Chapter II Material and Methods
28
Zucchini, Cucurbita maxima cv. Diamant 103 and bean, Phaseolus vulgaris cv. Marona
were used for transient expression of rHSA by agrobacterial vacuum infiltration
(II.2.2.5).
II.1.7.4 Animals
Polyclonal IgY-antisera were raised in adult, female, brown Leghorn-chicken under
approval of the Regierungspräsidium des Landes NRW (RP-Nr.: 23.203.2 AC 12,
21/95).
II.1.8 Chromatograhpy columns matrix and membranes
ImmobilonTM-P transfer membrane (PVDF) (0.45µm) from Millipore, HybondTM-C
nitrocellulose membrane (0.45µm) from Amersham Life Science (Braunschweig,
Germany) and Whatman no.1 paper from Whatman were used in the analysis. 1.4 ml of
Source 30S matrix (Pharmacia) as cation exchange medium in BioCart5 column
(Kronlab, Sinsheim) was utilized for ion exchange chromatography.
II.1.9 Equipment
1. Cameras: MP4 (Polaroid, Cambridge, MA, USA). E.A.S.Y 429K camera (Herolab,
Wiesloch).
2. Centrifuges: AvantiTM 30 and AvantiTMJ-25 (Beckman, California, USA), Biofuge
A (Heraeus, Hanau), Sigma 3-10 and Sigma 4-10 (Sigma, St. Louis, Missouri,
USA), RC5C and RC5B plus (Sorval instruments, Du Pont, Bad Homburg). Rotors:
F0650, F2402H, JLA 10.500 and JA 25.50 (Beckman), #1140 and #11222 (Sigma),
RLA-300, SS-34 and GS-3 (Du Pont).
3. Chromatography equipment: ÄKTA explorer 10xT (Pharmacia) or an Äkta Purifier
100 chromatography system (Pharmacia) with cation exchange columns, evaluation
and documentation software (Pharmacia).
4. DNA gel electrophoresis apparatus: wide mini and mini cells for DNA agarose
electrophoresis (BioRad, München) and power supplies (BioRad).
Chapter II Material and Methods
29
5. DNA-sequencing machine: LI-COR IR2-4200 Sequencer (LI-COR, Bad Homburg)
and Base ImageIRTM 4.0 software (LI-COR).
6. Electroporation apparatus: Gene pulserTM, Pulse controller unit, Extender unit
(BioRad) and 0.2 cm or 0.4 cm cuvettes (BioRad).
7. InnovaTM 4340 incubator shaker (New Brunswick scientific, Nürtingen).
8. PCR Thermocyclers: Primus and Primus 96 plus (MWG Biotech).
9. Photometers: Spectrophotometer Uvikon 930 (Kontron, Neufahrn) and Cuvettes #
67.742 (Sarstedt, Nürnbrecht), multi-channel spectrophotometer Spectromax 340
(Molecular Devices, Sunnyvale, California).
10. Probe sonicator (Braun, Melsungen).
11. Protein gel electrophoresis equipment: Mini PROTEAN IITM from BioRad. Phast
system: separation and control unit and the development unit for Phast protein gels
(Pharmacia). Gel Air Dryer (BioRad).
12. BioRad Protean IEF cell.
13. UV-Transilluminators: wavelength 302nm and UVT-20M (Herolab). UV-chamber
(Bio-Rad).
14. BioRad He2000 particle bombardment system.
15. Biobench 7, Applikon, Schiedam, The Netherlands.
16. Shaker: Innova 4430 (New Brunswick Scientific GmbH, Nürtingen).
17. Microwave: Micromat (AEG, Frankfurt).
18. Incubator: WTB binder (Tutlingen, Germany).
19. Balance: Sartorius BP 610, 1202 MP and BP 121 S (Santorius, Göttingen).
20. Vortex: K-550-GE (Bender and Hobein AG, Zürich).
21. Vacuum exicator (Glasswerk Wertheim).
Chapter II Material and Methods
30
II.2 Molecular Biology Methods
All work with recombinant DNA and genetically modified organisms was performed in
accordance with S1 safety regulations and was approved by the
Regierungspräsidium des Landes NRW [(AZ 521-K-1-8/98: AI3-04/1/0866/88 (S1)
and 55.8867/-4/93 (greenhouses)].
II.2.1 Transformation, selection and characterisation of
recombinant bacteria
II.2.1.1 Growth and maintenance of Escherichia coli
E. coli cells were grown at 37°C either in LB (amp) medium in a shaker incubator at
225 rpm, or on agar-solidified 1.5% (w/v) LB plates. For long-term storage, 600µL of
an overnight (o/n) liquid culture was mixed with an equal volume of 40% (v/v) glycerol
and stored at 80°C°.
LB medium Peptone 1 % (w/v) Yeast extract 0.5 % (w/v) NaCl 0.5% (w/v) pH 7.4
LB (amp) medium; LB medium +100 µg/ml Ampicillin.
II.2.1.2 Growth and maintenance of Agrobacterium tumefaciens
A. tumefaciens cells were grown in YEB medium after adding 100µg/ml rifampicin and
25µg/ml kanamycin at 28°C in a shaker incubator at 200 rpm. For selection of
recombinant bacteria 100µg/ml carbenicillin was added to the growth medium. For
long-term storage 600µL of an o/n liquid culture was mixed with an equal volume of
glycerol stock media (GSM) and stored at 80°C°.
YEB medium Nutrient broth or beef extract 0.5% (w/v) Yeast extract 0.1% (w/v) Peptone 0.5% (w/v) Sucrose 0.5% (w/v) pH 7.4
Chapter II Material and Methods
31
2 mM MgSO4, 25µg/ml kanamycin, 100µg/ml rifampicin and 100µg/ml carbenicillin
were added after autoclaving and cooling.
GSM Glycerol 50% (v/v) MgSO4 100 mM Tris-HCl 25 mM pH 7.4
II.2.1.3 Preparation of competent E. coli cells for heat-shock
transformation
E. coli strain DH5α competent cells were prepared for RbCl2-mediated heat shock
transformation. A single bacterial colony was inoculated in 5 ml of LB broth and
cultured at 37°C o/n. 0.5 ml of fresh o/n culture was transferred into 100 ml of LB
broth. The cells were cultured at 37°C for 3-4 hours until the OD600nm reached 0.4-0.5
and then transferred to an ice-cold tube. After placing on ice for 10 min, the cells were
recovered by centrifugation (2,000g/4°C/10 min). The pellets were gently dissolved in
30 ml ice-cold TfB-I solution and stored on ice for 10 min. The cells were recovered by
centrifugation as described above and resuspended in 4 ml ice-cold TfB-II. 200 µl-
aliquots of the suspension were dispensed into prechilled eppendorf tubes, frozen
immediately in liquid nitrogen and stored at -80°C.
TfB-I TfB-II RBCl 100 mM 10 mM MnCl2 75 mM - CaCl2 10 mM 75 mM LiCl 0.5 mM - K acetate 35 mM - glycerol 15% v/v) 15 % (v/v) MOPS - 10 mM pH 5.8 pH 6.8
II.2.1.4 Transformation of E. coli by heat-shock
As soon as the competent cells (II.2.1.3) were thawed, plasmid DNA (II.2.3.1) or
ligation products (II.2.3.5) were diluted 1:5 in sterile dH2O and mixed gently with the
competent cells then stored on ice for 30 min. The cells were incubated for 90 seconds
at 42°C and placed on ice for 2 min. 800 µl of SOC medium were added to the

Chapter II Material and Methods
32
eppendorf tubes and transformed cells were incubated at 37°C for 45 min. 200 µl of
cells were plated onto a LB-agar plate supplemented with appropriate antibiotics and
incubated at 37°C overnight.
SOC medium Bacto tryptone 1% (w/v)Yeast extract 0.5% (w/v) NaCl 10 mM KCl 2.5 mM autoclaved and added;
sterile MgCl2 1 M 10 ml sterile MgSO4 1 M 10 ml sterile glucose 1 M 20 ml filled up to 1 L and filter sterilized.
II.2.1.5 Preparation of competent E. coli cells for electroporation
E. coli strain DH5α or BL21λDE3 competent cells were prepared for electroporation as
described (Dower, Miller and Ragsdale 1988). Briefly, a single colony was cultured in
LB-broth at 37°C until the mid-log phase (OD600nm = 0.5-0.8); the cells were placed on
ice and harvested by centrifugation (3,000g/4°C/10 min). Cells were washed three times
with sterile water and suspended in ice-cold 10% (v/v) glycerol to a 300-fold
concentration from the original culture volume (at >1010 cells/ml). 40 µl aliquots were
stored at -80°C.
II.2.1.6 Transformation of E. coli by electroporation
Electrocompetent cells (II.2.1.5) were thawed on ice and 40 µl of the cells were mixed
with 1 pg to 300 ng of DNA in sterile dH2O. The cell/DNA mixture was transferred
into a prechilled electroporation cuvette (0.2 cm) and assembled into a safety chamber.
After application of the pulse (25 µF, 2.5 kV, 200 Ω), the cells were diluted in 1 ml of
SOC medium and incubated at 37°C with shaking for 1 h. Finally; 50-200 µl of the cells
were plated onto LB-agar containing appropriate antibiotics and incubated at 37°C o/n.
Chapter II Material and Methods
33
II.2.1.7 Preparation of competent A. tumefaciens cells for electroporation
A single colony of A. tumefaciens grown on a YEB-agar containing 100µg/ml
rifampicin (Rif) and 25 µg/ml kanamycin (Km) (YEB-Rif-Km) was inoculated in 5 ml
of YEB-Rif-Km medium in a 100 ml Erlenmeyer flask and incubated at 28°C for two
days with shaking (250 rpm). One ml of the culture was transferred into 100 ml of
YEB-Rif-Km medium and cultivated at 28°C for 15-20 h with shaking (250 rpm) until
the OD660 reached 1-1.5. The cells were chilled on ice for 15 min and spun down by
centrifugation (4,000g/4°C/5 min). The culture medium was decanted and the cells were
washed three times with 10 ml of dH2O by centrifugation and resuspended in 500 µl of
sterile 10% (v/v) glycerol. 45 µl-aliquots of the suspension were dispensed into
prechilled eppendorf tubes, frozen immediately in liquid nitrogen and stored at -80°C.
II.2.1.8 Transformation of Agrobacterium tumefaciens by electroporation
0.2-1.0 µg of plasmid DNA (II.2.3.1) in sterile dH2O was added to a thawed aliquot of
A. tumefaciens electrocompetent cells (II.2.1.7) and placed on ice for 3 min. The
cell/DNA mixture was transferred into a prechilled electroporation cuvette (0.2 cm) and
assembled into a safety chamber. After application of the pulse (25 µF, 2.5 kV, 200 Ω),
the cells were diluted in 1 ml of YEB medium in a 4.0-ml tube and incubated at 28°C
with shaking (250 rpm) for 1 h. Finally, 50-100 µl of the cells were plated on YEB-agar
containing 100µg/ml rifampicin (rif), 25µg/ml kanamycin (Km) and 100µg/ml
carbenicillin (carb) (YEB-Rif-Km-Carb) and incubated at 28°C for 2-3 days. As a
negative control, dH2O was used to transform competent Agrobacterium cells.
II.2.2 Transformation of plants and suspension cultures
II.2.2.1 Growth and maintenance of Nicotiana tabacum
Tobacco plants were grown in a greenhouse in ED73 standard soil (Patzer, Sinntal-
Jossa) with 0-30% (v/v) sand under supplementary illumination of 10 000 Lux (plus the
sun light), 70-90% humidity and 16h photoperiod) at 24°C (or higher depending on the

Chapter II Material and Methods
34
outside temperature). To prevent pollination from other plants, flowers were covered
with plastic bags with micro pores. Mature, dried seeds were stored in paper bags at RT.
II.2.2.2 Growth and maintenance of Nicotiana tabacum cv. BY-2 cells
N. tabacum cv. BY-2 suspension cells and calli were grown in MSMO medium. Liquid
medium was adjusted to pH 5.2, while medium solidified with 0.8% (w/v) agar was
adjusted to pH 5.8. Both suspension cells and calli were cultivated at 26°C in the dark.
Suspension cells were sub-cultured weekly using a 2% (v/v) inoculum while pinpoint-
sized clumps of callus cells were transferred to fresh plates monthly.
MSMO medium MSMO salts 4.4 g/L thiamin/HCl 0.4 mg/L 2,4-D 0.2 mg/L KH2PO4 0.2 g/L sucrose 30 g/L pH 5.2
II.2.2.3 Preparation of recombinant Agrobacterium. tumefaciens
A single colony of a positive clone was checked by Agrobacterium-control PCR
(II.2.3.6.1) and inoculated in 5 ml of YEB medium and cultivated at 28°C for 2-3 days
with shaking at 250 rpm. One ml was transferred into 100 ml of YEB-Rif-Km-Carb
medium (II.2.1.2) and cultivated o/n at 28°C with shaking at 250 rpm. The following
day the cells were pelleted by centrifugation at 5,000 g for 10 min at 15°C and
transferred into 250 ml of induction medium in a 500-ml flask and cultivated o/n at
28°C with shaking at 250 rpm. Bacterial cells were centrifuged (4,000g/15-25°C/15
min) and resuspended in 50 ml of MMA solution and kept for 2 h at RT. The cell
suspension was diluted to an OD600nm of 2.4 and 100 ml of the diluted cell suspension
was used for vacuum infiltration of plant leaves (II.2.2.5).
Chapter II Material and Methods
35
Induction medium YEB medium (pH 5.6) MES 10 mM pH 5.6
2 mM MgSO4, 25µg/ml kanamycin, 100µg/ml rifampicin, 100µg/ml carbenicillin, and
20µM acetosyringone were added after autoclaving and cooling.
MMA Buffer MS salts 0.43% (w/v)MES 10 mM Sucrose 2% (w/v) pH 5.6
200µM acetosyringone was added after autoclaving and cooling.
II.2.2.4 Transformation of Nicotiana tabacum cv. BY-2
N. tabacum cv. BY-2 cells were transformed by co-cultivation with recombinant
A. tumefaciens. Three ml of a 3 days old BY-2 culture in the log phase of growth were
mixed in an empty petri dish (5cm) with 150µl of an o/n culture of recombinant A.
tumefaciens. After incubation for 3 days in the dark at 24°C, the cells were transferred
to centrifuge tubes and sedimented (3min/100g/RT). The supernatant was removed and
the pelleted cells washed with 10ml MS medium (II.2.2.6). After three cycles of
sedimentation and washing in MS, the cells were resuspended in an equal volume of
MS medium and 200µl aliquots were plated on MS agar supplemented with 75µg/ml
kanamycin and 250µg/ml cefotaxime. The plates were incubated in the dark at 24°C.
Pinpoint-sized clumps of kanamycin-resistant cells were visible after 20-25 days and
were transferred to fresh plates containing the same medium and cultivation continued
until sufficient cell material for screening by immunoblot (II.4.8) was available.
II.2.2.5 Vacuum infiltration of intact plant leaves
For transient expression of recombinant proteins in different N. tabacum cultivars and
edible plants like zucchini and bean; young leaves (4 leaves for each construct) were
placed in 100 ml of recombinant A. tumefaciens (II.2.2.3) suspension in a Weck glass
and a continuous vacuum (60-80 mbar) was applied for 15-20 min. The vacuum was

Chapter II Material and Methods
36
released rapidly and the leaves were briefly rinsed in tap water and kept with adaxial
side upward on wet Whatman paper. After incubating the leaves at 22°C with a 16 h
photoperiod for 72 h in the plastic tray that was sealed with saran wrap, the central vein
of the leaves were removed. Remaining of the leaves were weighed, frozen in liquid
nitrogen and stored at -80°C until analysis (II.4.2).
II.2.2.6 Stable transformation of tobacco plants
Stable transformation of N. tabacum was performed with the help of Dr. Flora Schuster
(RWTH Aachen, Institute für Biology VII). Transgenic N. tabacum cv. Petite Havana
SR1 was generated by leaf disc transformation using recombinant A. tumefaciens
(II.2.1.8) and transgenic T0 plants were regenerated from transformed calli (Fraley et al.
1983; Horsch, Fry et al. 1985). Briefly, wild type plants were grown on MS medium in
Weck glasses and the youngest leaves (length up to 6 cm) were used for transformation.
The agrobacteria suspension was prepared as described (II.2.2.3) and the OD600 was
adjusted to at least 1.0 after dilution in MMA buffer. The leaves were cut into 8-10
pieces (without the central vein) and transferred into Weck glasses containing 50-100
ml of recombinant agrobacteria suspension and incubated for 30 min at RT. The leaf
pieces were then transferred onto sterile pre-wetted Whatman filters in petri dishes,
closed with saran wrap and incubated at 26-28°C in the dark for two days. Following
washing with distilled water containing 100µg/ml kanamycin, 200µg/ml claforan and
200µg/ml Betabactyl (Ticarcillin/Clavulanic acid, 25:1), leaf pieces were transferred
onto MS II-plates and incubated at 25°C in the dark for one week and with a 16 h
photoperiod for 2-3 weeks.
After shooting, the shoots were removed, transferred onto MS-III-plates and incubated
at 25°C with a 16 h photoperiod for 10-14 days until roots developed. The small plants
were transferred into Weck glasses containing MS-III medium and incubated at 25°C in
16 h light rhythm for 2 weeks until they were transferred into soil. Young leaves from
regenerated transgenic plants were used for extraction of total soluble proteins (II.4.2)
and for analysis of recombinant protein accumulation by immunoblot (II.4.8) and
ELISA (II.4.9).
Chapter II Material and Methods
37
MS medium MS-salts 0.43% (w/v) Myo-Inosite (SERVA) 0.1% (w/v) Sucrose 2% (w/v) Thiamin-HCl 0.4 mg/l A. bidest add to 1000 ml
The pH was adjusted to 5.8 with 1 N NaOH (for preparation of solid medium, 0.8%
(w/v) agar were added), autoclaved and 500 µl of vitamin solution I were added upon
cooling to 55°C.
MS-II medium MS medium supp. with BAP (in DMSO) 1 mg/l Kanamycin 100 mg/l Claforan 200-500 mg/l Betabactyl 200-250 mg/l
MS-III medium MS medium supp. with Kanamycin 100 mg/l Claforan 200-500 mg/l Betabactyl 200-250 mg/l
Vitamin solution I Glycine 0.4% (w/v) Nicotinic acid 0.1% (w/v) Pyridoxine 0.1% (w/v)
Filter sterilized and stored at 4°C.
II.2.2.7 Bombardment of wheat embryos
Immature wheat (Triticum aestivum L. cv. Bobwhite) embryos were used as explants
for the delivery of the HSA-KDEL gene integrated in pal76 vector (II.1.5.8). DNA for
particle bombardment was prepared by mixing plasmids containing the HSA-KDEL
gene with the selectable marker in equimolar ratios not exceeding 15 µg of total DNA
and 2.5 mg of gold particles (0.7 µm). Coating of DNA and bombardment of wheat
embryos in a BioRad He2000 apparatus at 900psi Helium pressure was done by Dr. Eva
Stöger (RWTH Aachen, Institute for Biology VII). Following selection of wheat on
PPT (2.5 mg/l), PPT resistant plant material was recovered.
Chapter II Material and Methods
38
II.2.3 Recombinant DNA techniques
II.2.3.1 Isolation of plasmid DNA
For simultaneous screening of numerous recombinant clones, TELT method was used
to prepare plasmid DNA on mini-scale. To prepare DNA for nucleotide sequence
analysis, Qiagen plasmid DNA Mini prep kit or Midi prep kit was used according
to manufacturers instructions.
II.2.3.1.1 TELT method
The TELT method was performed as described (Holmes and Quigley 1981). Briefly,
recombinant E. coli cells (II.2.1.3) from 3.0 ml overnight cultures were harvested by
centrifugation (13,000g/RT/30 sec). The cell pellet was resuspended in 100 µl of TELT
buffer followed by vigorous vortexing with the same volume of PCI
(phenol/chloroform/isoamyl alcohol, 25:24:1) and centrifugation (13,000g/RT/5 min).
The clear supernatant was transferred into an Eppendorf tube and plasmid DNA was
precipitated using 2.5 volumes of ice-cold 100% (v/v) ethanol. The DNA pellet was
washed twice with 70% (v/v) ethanol and air-dried for 10 min at room temperature.
Finally plasmid DNA was dissolved in 30 µl of sterile distilled water.
TELT Buffer Tris-HCl (pH 8.0) 50 mM EDTA 62.5 mM LiCl 2.5 mM Triton X-100 4% (v/v)
TELT buffer was stored at 4°C.
II.2.3.2 Restriction enzyme digestion and precipitation of DNA
Restriction enzyme digestions were carried in the buffer supplied with the enzyme and
in accordance with the suppliers recommendations for temperature and duration of the
digestion. 1 µg DNA was mixed with 1-2 units of the appropriate enzyme and incubated
for 1-3 hours at the enzymes optimal temperature. For double digestions, combination
of the two enzymes at the most suitable buffer was carried. If combination of the two
enzymes were not possible, DNA was digested and purified via the PCR purification kit

Chapter II Material and Methods
39
(Qiagen) prior to the digest with the second enzyme. Reactions were stopped by
freezing at 20°C until further processing.
For precipitation of plasmid DNA, DNA solution was mixed with 0.1 volumes of 0.3 M
NaAc (pH 5.2) and 2.5 volumes of absolute ethanol. After storing this mix at -20°C for
30 min, DNA was pelleted via centrifugation (10 min/13000g/4°C). Subsequently, the
DNA pellet was washed with 70% ethanol, air dried at room temperature and finally
suspended in 10 mM Tris-HCl (pH 8.5).
II.2.3.3 Agarose gel electrophoresis
Analytical as well as preparative gel electrophoresis of double-stranded DNA fragments
was performed as described (Sambrook, Fritsch et al. 1996)in 0.8-1.5% agarose gels
supplemented with ethidium bromide (0.1µg/ml). As marker, a defined amount of PstI
digested Lambda DNA or 100bp ladder (New England Biolabs) was included for
determination of fragment size and estimation of concentration. Bands were visualized
using a UV transilluminator at 302nm. For the documentation of the bands, the video
documentation system of the Herolab Company together with the Software Easy
Quant and was employed. In preparative electrophoresis, the desired fragment was
excised with a sterile scalpel directly on the transilluminator and the DNA was extracted
from the agarose gel using the Qiaex gel extraction kit (Qiagen). The yield of the
extraction was verified by analytical electrophoresis.
II.2.3.4 Determination of the DNA concentration
The concentration of the isolated and purified DNA was determined by
spectrophotometric measurement of concentration by measuring the absorbance of the
solution at 260 nm, the wavelength at which both DNA and RNA absorb maximally,
50µg/ml DNA gives an absorbance of 1 at 260 nm (Sambrook, Fritsch et al. 1996).
II.2.3.5 Ligation of DNA fragments
DNA ligations were carried out in a total volume of 20µl. The insert: vector molar ratio
was adjusted to 3:1 for sticky ends in 1 x T4 ligase buffer (New England Biolabs) and
0.1U of T4 DNA ligase was added. The reactions were incubated o/n at 16°C. Ligated
DNA was precipitated, washed with 70% (v/v) ethanol at RT, resuspended in 10µl of
sterile ultrapure water and stored at 20°C until transformation.
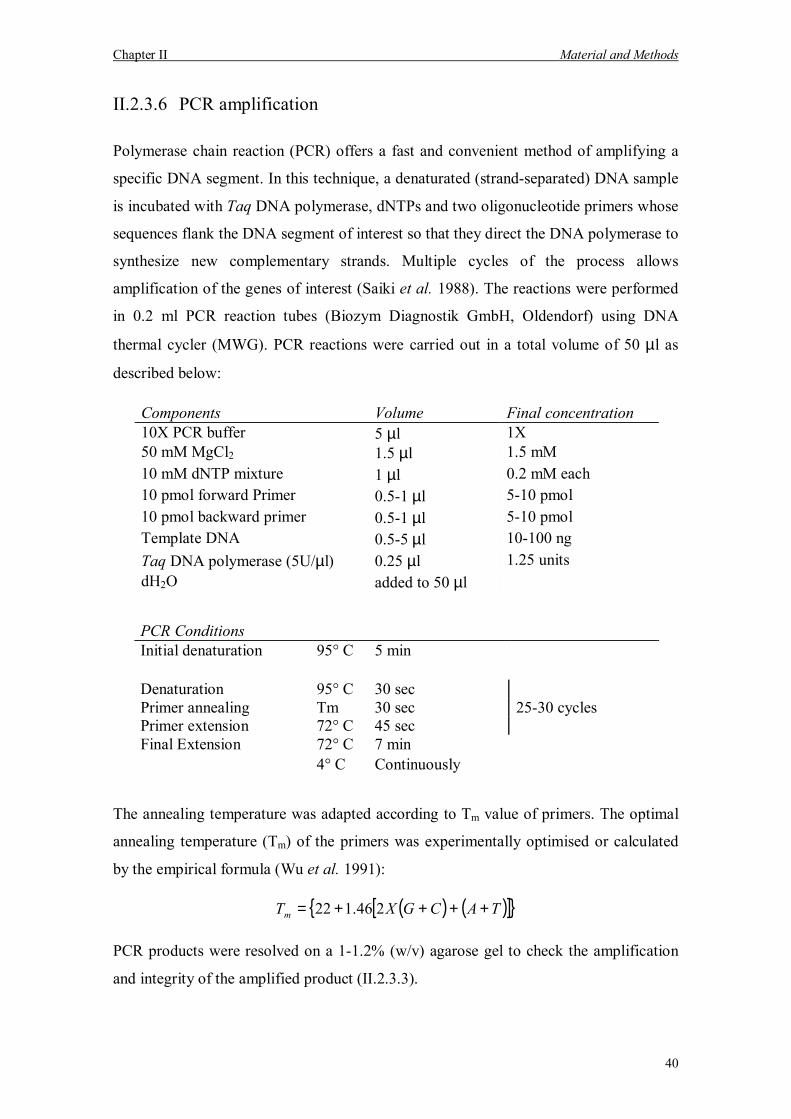
Chapter II Material and Methods
40
II.2.3.6 PCR amplification
Polymerase chain reaction (PCR) offers a fast and convenient method of amplifying a
specific DNA segment. In this technique, a denaturated (strand-separated) DNA sample
is incubated with Taq DNA polymerase, dNTPs and two oligonucleotide primers whose
sequences flank the DNA segment of interest so that they direct the DNA polymerase to
synthesize new complementary strands. Multiple cycles of the process allows
amplification of the genes of interest (Saiki et al. 1988). The reactions were performed
in 0.2 ml PCR reaction tubes (Biozym Diagnostik GmbH, Oldendorf) using DNA
thermal cycler (MWG). PCR reactions were carried out in a total volume of 50 µl as
described below:
Components Volume Final concentration 10X PCR buffer 5 µl 1X 50 mM MgCl2 1.5 µl 1.5 mM 10 mM dNTP mixture 1 µl 0.2 mM each 10 pmol forward Primer 0.5-1 µl 5-10 pmol 10 pmol backward primer 0.5-1 µl 5-10 pmol Template DNA 0.5-5 µl 10-100 ng Taq DNA polymerase (5U/µl) 0.25 µl 1.25 units dH2O added to 50 µl
PCR Conditions Initial denaturation 95° C 5 min Denaturation 95° C 30 sec Primer annealing Tm 30 sec 25-30 cycles Primer extension 72° C 45 sec Final Extension 72° C 7 min 4° C Continuously
The annealing temperature was adapted according to Tm value of primers. The optimal
annealing temperature (Tm) of the primers was experimentally optimised or calculated
by the empirical formula (Wu et al. 1991):
( ) ( )[ ] TACGXTm ++++= 246.122
PCR products were resolved on a 1-1.2% (w/v) agarose gel to check the amplification
and integrity of the amplified product (II.2.3.3).
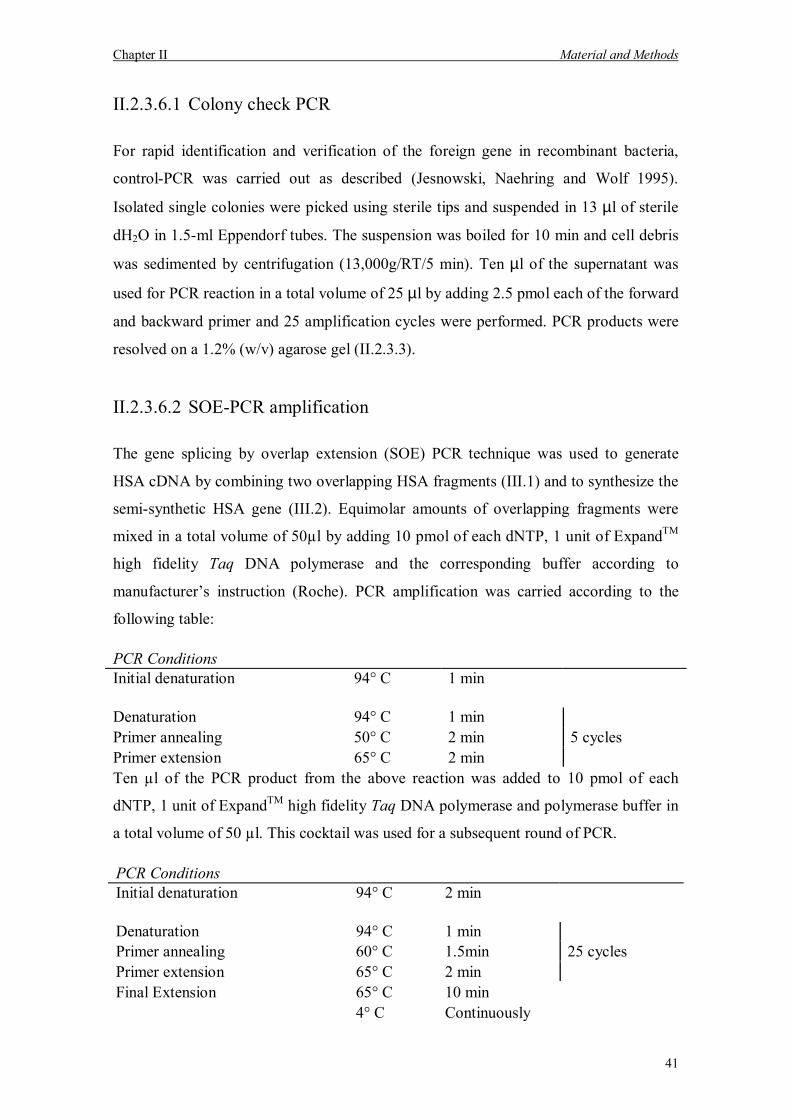
Chapter II Material and Methods
41
II.2.3.6.1 Colony check PCR
For rapid identification and verification of the foreign gene in recombinant bacteria,
control-PCR was carried out as described (Jesnowski, Naehring and Wolf 1995).
Isolated single colonies were picked using sterile tips and suspended in 13 µl of sterile
dH2O in 1.5-ml Eppendorf tubes. The suspension was boiled for 10 min and cell debris
was sedimented by centrifugation (13,000g/RT/5 min). Ten µl of the supernatant was
used for PCR reaction in a total volume of 25 µl by adding 2.5 pmol each of the forward
and backward primer and 25 amplification cycles were performed. PCR products were
resolved on a 1.2% (w/v) agarose gel (II.2.3.3).
II.2.3.6.2 SOE-PCR amplification
The gene splicing by overlap extension (SOE) PCR technique was used to generate
HSA cDNA by combining two overlapping HSA fragments (III.1) and to synthesize the
semi-synthetic HSA gene (III.2). Equimolar amounts of overlapping fragments were
mixed in a total volume of 50µl by adding 10 pmol of each dNTP, 1 unit of ExpandTM
high fidelity Taq DNA polymerase and the corresponding buffer according to
manufacturers instruction (Roche). PCR amplification was carried according to the
following table:
PCR Conditions Initial denaturation 94° C 1 min Denaturation 94° C 1 min Primer annealing 50° C 2 min 5 cycles Primer extension 65° C 2 min Ten µl of the PCR product from the above reaction was added to 10 pmol of each
dNTP, 1 unit of ExpandTM high fidelity Taq DNA polymerase and polymerase buffer in
a total volume of 50 µl. This cocktail was used for a subsequent round of PCR.
PCR Conditions Initial denaturation 94° C 2 min Denaturation 94° C 1 min Primer annealing 60° C 1.5min 25 cycles Primer extension 65° C 2 min Final Extension 65° C 10 min 4° C Continuously
Chapter II Material and Methods
42
II.2.3.7 DNA sequencing
The correct nucleotide sequence of cDNA fragments and expression constructs was
verified by DNA sequencing using a Thermosequenase sequencing kit
(USB/Amersham) and an LICOR 4200 IR2 automated DNA sequencer (MWG) using
fluorescently labelled primers. Extension reactions were terminated by incorporation of
dNTPs.
As described earlier, plasmid DNA was isolated (II.2.3.1) using one of the kits from
Qiagen. After determination of the DNA concentration (II.2.3.4), the purity and
integrity of the plasmid preparation was checked on an agarose gel (II.2.3.3) and was
added as the template plasmid DNA into the sequencing reactions. For the PCR
reactions, 1.5µl of the respective termination mix (1.25mM of each dNTP plus 1.25 mM
of one of the four ddNTPs) were pipetted into PCR reaction tubes. 4.5µl of sequencing
master mix (2 µl 10 x Taq DNA polymerase buffer, 2U Taq polymerase, 1µg plasmid-
DNA, 2.5 pM of each of the respective primers, 1µl DMSO, ultrapure H2O) were added
to each of the tubes and overlaid with a drop of PCR oil. After incubation in a PCR
thermocycler (initial denaturation 4min/94°C, followed by 35 cycles of annealing
(20sec/50°C), extension (30s/72°C) and denaturation (20s/95°C) the reactions were
stopped by adding 3 µl of stop buffer to each tube. The products were frozen at 20°C
and resolved on a denaturing (6M urea) polyacrylamide gel (4.66.0%). For evaluation
of sequencing data DNA analysis software package was used according to
manufacturers instructions.
II.3 Expression of recombinant proteins
II.3.1 Bacterial expression
Recombinant HSA and the fusion protein HSA-Designer Tail (III.3) were expressed in
the cytoplasm and periplasm of E.coli using different bacterial vector systems. A
general protocol for expression of proteins in E.coli is as follows: A single colony of E.
coli strain BL21 (Invitrogen, Leek, the Netherlands) harbouring recombinant plasmid
DNA was inoculated in 10 ml of 2YT medium containing 1% (w/v) glucose and 100
µg/ml ampicillin (LBGA) and cultivated o/n at 37°C. Five ml of the o/n culture was
Chapter II Material and Methods
43
transferred into 400 ml of LBGA medium and cultured at 37°C to OD600 of 0.5-1.0.
Expression of recombinant proteins was induced for 3-5 h at 28°C-30°C by addition of
IPTG to a final concentration of 1.0 mM. Cells were harvested by centrifugation (4,500
rpm/4°C/15 min) and processed either for cytoplasmic or periplasmic extraction of the
proteins from E.coli (II.4.1).
II.3.2 Expression of rHSA in the field
The field trial site was located on the AAFC-Delhi Research Station, 1 NTR, lot 40,
Township of Middleton, Region of Haldimand-Norfolk, Delhi, Ontario and field tests
were performed by Dr. Jim Brandle (Agriculture and AgriFood Canada). The trial was
transplanted by hand with greenhouse seedlings. One transgenic line, one
untransformed control was evaluated within a randomised complete block design with
four replications. The planting density was approximately 111,000 plants/ha and plots
had four rows with 32 plants in each plot. Approximately 30 days following
transplantation, the plots were harvested and the plant material bulked for evaluation of
dry matter yield and soluble protein concentration.
II.4 Protein analysis
II.4.1 Isolation of total soluble proteins from E. coli
For bacterial expression and purification, HSA constructs were subcloned into a
prokaryotic vector for cytosolic expression and transformed into E. coli Bl21λDE3
strain. Cells from induced cultures (II.3.1) were harvested by centrifugation (4,500
rpm/4°C/15 min) and washed with 80 ml of TEN buffer. The pellet was resuspended in
10 ml of ice-cold TEN buffer containing 10 mg/l lysozyme. After 30 min on ice the
suspension was sonicated to lyse the cells (120 W, 5 x 30sec with 1 min break interval).
The cell debris was pelleted by centrifugation (12,000g/4°C/30 min).
For periplasmic extraction, pelleted cells (II.3.1) were resuspended in 10 ml of
resuspension buffer (30 mM Tris-HCl, 20% (w/v) sucrose, pH 8.0) on ice. EDTA was
Chapter II Material and Methods
44
added to a final concentration of 1 mM. The suspension was incubated on ice with
gentle agitation for 10 min. After centrifugation (8,000g/4°C/20 min), the supernatant
(S1) was collected. The pellet was resuspended in 9 ml of cold 5 mM MgSO4, stirred
for 8-9 min at 4°C and EDTA to a final concentration of 1 mM was added to the mix.
After stirring the suspension for additional 3 min, the suspension was centrifuged
(8,000g/4°C/20 min). The supernatant (S2), known as the osmotic shock fraction, was
mixed with the first supernatant (S1) and dialysed against PBS prior to IMAC affinity
purification (II.6.1).
TEN Buffer Tris-HCl 10 mM EDTA 1 mM NaCl 0.14 mM pH 7.4
II.4.2 Isolation of total soluble proteins from plant leaves
For extraction of total soluble proteins, frozen leaves were ground in liquid nitrogen to a
fine powder with a mortar and pestle. Total soluble proteins were extracted using 2 ml
of extraction buffer per gram leaf material. Cell debris was removed by centrifugation
(16,000g/4°C/30 min) and the supernatant was used for expression analyses by SDS
PAGE, immunoblot and ELISA (II.4.8 and II.4.9).
Extraction Buffer Tris-HCl 200 mM EDTA 5 mM DTT 0.1 mM Tween 20 0.1% (v/v) pH 7.5
For isolation of protein prior to two dimensional gel electrophoresis (II.4.6.2), 2 g of
fresh transgenic leaf was ground in liquid nitrogen to a fine powder. The powder was
mixed with 2.5 volumes of 10 % (v/v) trichloro acetic acid (TCA) solution in acetone.
After storing this mix at -20°C for 60 min, soluble proteins were pelleted via
centrifugation (10 min/13000g/4°C). Subsequently, the protein pellet was washed with
2.5 volumes of 99% acetone; air dried at room temperature and stored at -20°C until
used.
Chapter II Material and Methods
45
II.4.3 Isolation of total soluble proteins from tobacco
suspension cultures
For extraction of total soluble proteins from N. tabacum cv BY-2 suspension cultures, a
5 ml aliquot of the culture was centrifuged (10min/5000rpm/4°C). The supernatant (2-
3ml) removed after centrifugation was further analysed by ELISA (II.4.9) and/or
immunoblot (II.4.8). For the extraction of intracellular proteins, 2 ml of extraction
buffer (II.4.2) was added to 1g (wet weight) of cells and sonicated on ice until the
membranes were disrupted (three times 2 min bursts separated by 1 min). After
sonication the sample was spun at 10.000rpm for 10 min to collect total soluble proteins
supernatant for ELISA or immunoblot analysis.
II.4.4 Isolation of total soluble proteins from wheat seeds
Extraction of the TSP from dry wheat seeds were done by squashing them between
glass plates and grinding to a fine powder in a mortar. Citrate buffer (pH 6) with 100
mM NaCl was used in a proportion of 1:3 (3 ml/g). TSP extract was analysed by ELISA
or immunoblot analysis.
II.4.5 Quantification of total soluble proteins
Bradford assay, (Bradford 1976) using BSA as a standard, was used for quantification
of protein concentration. The protein solution was diluted in the buffer used for
solubilization of the protein of interest and BSA was serially diluted in the same buffer.
Ten µl of each dilution was transferred into the wells of a low-protein-binding 96-well
microtiter plate (Greiner, Solingen). Ten µl of the buffer was used as a blank. 200 µl of
filtered Bradford colour reagent were added to each well, mixed with the proteins and
incubated at RT for 10 min followed by the measurement of OD595nm. For each dilution,
measurements were performed in duplicate and the average was taken for the
calculation of the protein concentration.

Chapter II Material and Methods
46
II.4.6 Gel electrophoresis of proteins
II.4.6.1 One-dimensional gel electrophoresis
Proteins were electrophoretically separated by discontinuous SDS-PAGE as described.
(Laemmli 1970) (Stacking gel: T = 4%, C =2.6%, pH 6.8; separating gel: T=12%, C =
2.6%, pH 8.8). Before loading, proteins were denaturated and solubilized in 1x SDS
sample buffer in a water bath at 100°C for 10 min. Separated proteins were revealed by
gel staining with Coomassie brilliant blue (II.4.7.1), or transferred onto nitrocellulose
membrane for immunoblot analysis (II.4.8).
SDS-PAGE running buffer pH 8.3 Tris-HCl 125 mM Glycine 960 mM SDS 0.5 % (w/v)
10x SDS Sample Buffer pH 8.3 Tris-HCl 0.35 M DTT 0.6 M SDS 10.3 % (w/v) Bromophenolblue 0.05 % /w/v) Glycerol 36 % (w/v)
II.4.6.2 Two-dimensional gel electrophoresis
The principle of high resolution 2-D gel electrophoresis was introduced by O´Farrell
(O'Farrell 1975). The method separates proteins according to the physico-chemical
parameters, charge (isoelectric point) in the first dimension and size (molecular weight)
in the second dimension. The BioRad Protean IEF cell was used to perform isoelectric
focusing of protein-containing samples using immobilized pH-gradient gel strips
(Ready Strip IPG strips, BioRad). Since IPG strips are dehydrated, for passive
rehydration, strips were placed in contact with the protein sample diluted in
rehydration/sample buffer. The strips were covered with mineral oil to prevent
evaporation and left overnight on the bench at RT according to manufacturers
instructions. Prior to SDS-PAGE the IEF strips were equilibrated in an equilibration
solution supplemented with 4.8% (v/v) iodoacetamide to prevent vertical gel spot
Chapter II Material and Methods
47
streaking. Samples were analysed in the first dimension on a pH 5-8 or 3-10 gradient
and further separated in the second dimension on a 10% or 12% SDS PAA gel
(II.4.6.1).
Rehydration /Sample Buffer Urea 9 M Chaps 4 % (w/v) Ampholyte (pH 3-10) 0.4 % (v/v) DTT 1 % (65 mM)
II.4.7 Staining of protein gels
II.4.7.1 Coomassie brilliant blue staining
Expressed and purified recombinant HSA separated on one-dimensional SDS-PAA gels
were visualized by Coomassie brilliant blue staining. Proteins were detected after
incubating the gel for 30 min in Coomassie staining solution at RT under constant
rocking. Coomassie staining was removed by destaining solution until the protein bands
was clearly visible. The gel was dried between cellophane sheets for documentation
purposes.
Coomassie staining solution Coomassie brillant blue G-250 0.25% (w/v)Methanol 50% (v/v) Glacial acetic acid 9% (v/v)
Coomassie destaining solution Methanol 10% (v/v) Glacial acetic acid 10% (v/v)
II.4.7.2 Silver Staining
For higher sensitivity and to detect small amounts of proteins, two-dimensional gels
were silver stained according to the Silver staining protocol for proteins from
Pharmacia. Initial fixation step was carried out overnight in order to reduce background
staining of polyacrylamide gels. The gels were sensitized by 30 min incubation in
prestain solution, and subsequently rinsed three times with bidistilled water for 5 min
each. After rinsing, the gels were submerged in 0.1% (w/v) silver nitrate solution for 20
min. The silver nitrate solution was discarded, gels were rinsed twice with water for 1
Chapter II Material and Methods
48
min and then developed in sodium carbonate solution containing formaldehyde. After
the desired intensity of staining was achieved (3-5 min), the development was
terminated by discarding the reagent, followed by washing the gels with water. The
development process was stopped with an aqueous EDTA solution. Silver-stained gels
were stored in a solution of 1% (v/v) acetic acid at 4°C until analyzed.
Fixation solution Ethanol 40% (v/v) Glacial acetic acid 10% (w/v)
Prestain solution (Sensitizing) Ethanol 30% (v/v) Glutardialdehyde 25% (w/v) Sodium thiosulphate 5% (w/v) Sodium acetate 6.8% (w/v)
Silver nitrate solution Silver nitrate 2.5% (w/v) Formaldehyde (37%) (w/v) 0.04% (v/v) Developing solution Sodium carbonate 2.5% (w/v) Formaldehyde (37%) (w/v) 0.02% (v/v)
Stop solution EDTA- Na2.2H2O 1.46% (w/v)
II.4.8 Immunoblot
Electrophoretically separated proteins were transferred from a SDS-PAA gel (II.4.6.1)
to a HybondTM-C nitrocellulose membrane (0.45 µm) in the presence of transfer buffer.
The membrane was blocked with PBS buffer containing 3% (w/v) skim milk (MPBS)
and blotted proteins probed with a primary antibody (II.1.4) that reacted specifically
with antigenic epitopes displayed by the target protein attached to the membrane. The
bound antibody was detected by addition of an appropriate secondary polyclonal
antibodies (II.1.4) coupled to alkaline phosphatase (AP). Both primary and secondary
antibodies were diluted in MPBS. The target protein was finally revealed by addition of
substrate NBT/ BCIP (BioRad).
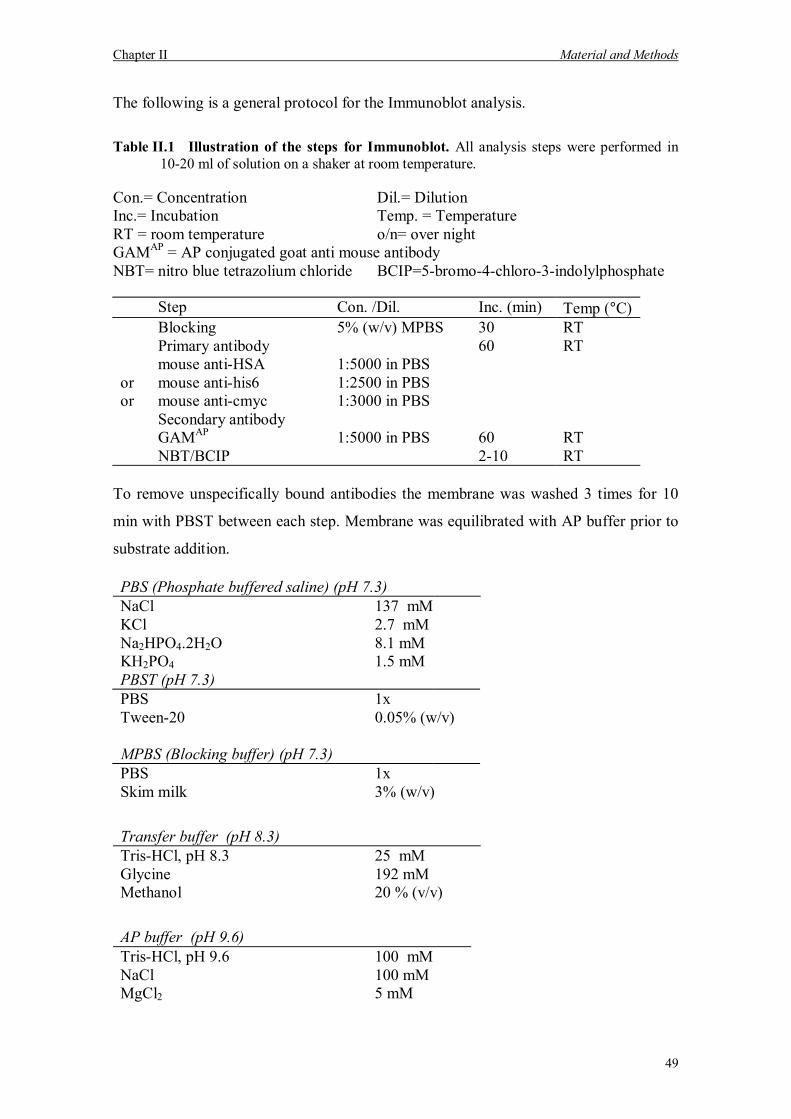
Chapter II Material and Methods
49
The following is a general protocol for the Immunoblot analysis.
Table II.1 Illustration of the steps for Immunoblot. All analysis steps were performed in 10-20 ml of solution on a shaker at room temperature.
Con.= Concentration Dil.= Dilution Inc.= Incubation Temp. = Temperature RT = room temperature o/n= over night GAMAP = AP conjugated goat anti mouse antibody NBT= nitro blue tetrazolium chloride BCIP=5-bromo-4-chloro-3-indolylphosphate Step Con. /Dil. Inc. (min) Temp (°C) Blocking 5% (w/v) MPBS 30 RT Primary antibody 60 RT mouse anti-HSA 1:5000 in PBS or mouse anti-his6 1:2500 in PBS or mouse anti-cmyc 1:3000 in PBS Secondary antibody GAMAP 1:5000 in PBS 60 RT NBT/BCIP 2-10 RT
To remove unspecifically bound antibodies the membrane was washed 3 times for 10
min with PBST between each step. Membrane was equilibrated with AP buffer prior to
substrate addition.
PBS (Phosphate buffered saline) (pH 7.3) NaCl 137 mM KCl 2.7 mM Na2HPO4.2H2O 8.1 mM KH2PO4 1.5 mM PBST (pH 7.3) PBS 1x Tween-20 0.05% (w/v) MPBS (Blocking buffer) (pH 7.3) PBS 1x Skim milk 3% (w/v)
Transfer buffer (pH 8.3) Tris-HCl, pH 8.3 25 mM Glycine 192 mM Methanol 20 % (v/v)
AP buffer (pH 9.6) Tris-HCl, pH 9.6 100 mM NaCl 100 mM MgCl2 5 mM
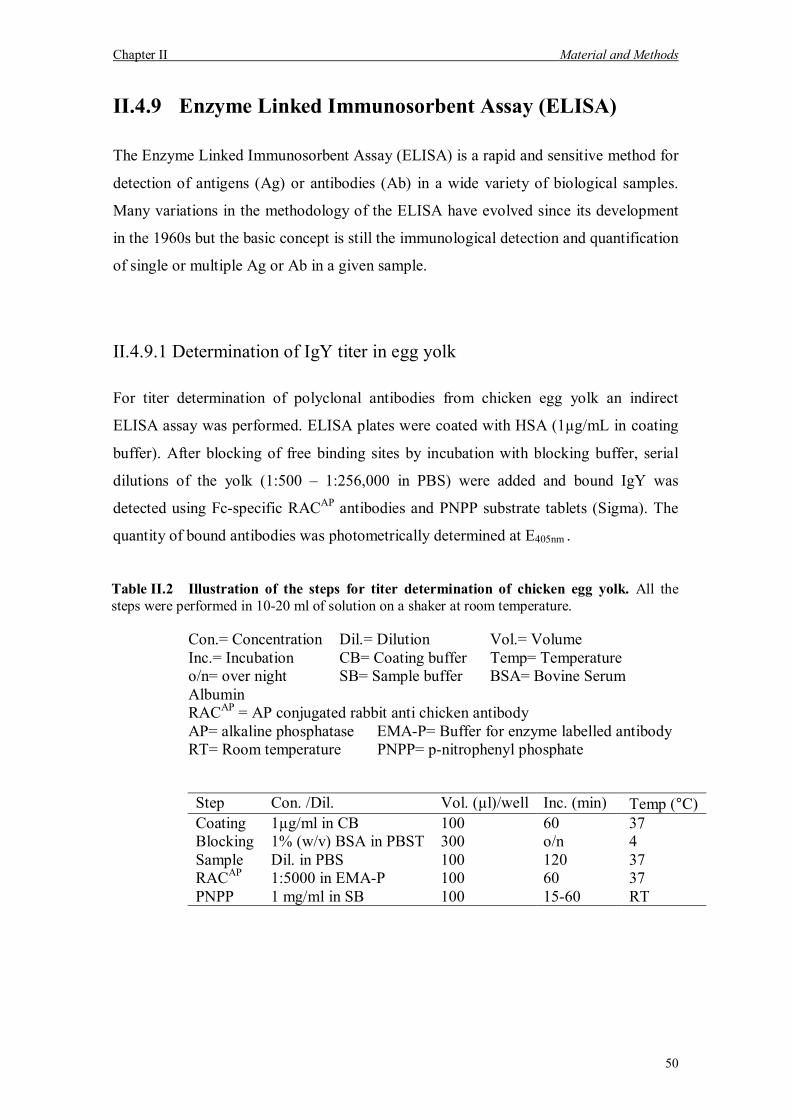
Chapter II Material and Methods
50
II.4.9 Enzyme Linked Immunosorbent Assay (ELISA)
The Enzyme Linked Immunosorbent Assay (ELISA) is a rapid and sensitive method for
detection of antigens (Ag) or antibodies (Ab) in a wide variety of biological samples.
Many variations in the methodology of the ELISA have evolved since its development
in the 1960s but the basic concept is still the immunological detection and quantification
of single or multiple Ag or Ab in a given sample.
II.4.9.1 Determination of IgY titer in egg yolk
For titer determination of polyclonal antibodies from chicken egg yolk an indirect
ELISA assay was performed. ELISA plates were coated with HSA (1µg/mL in coating
buffer). After blocking of free binding sites by incubation with blocking buffer, serial
dilutions of the yolk (1:500 1:256,000 in PBS) were added and bound IgY was
detected using Fc-specific RACAP antibodies and PNPP substrate tablets (Sigma). The
quantity of bound antibodies was photometrically determined at E405nm .
Table II.2 Illustration of the steps for titer determination of chicken egg yolk. All the steps were performed in 10-20 ml of solution on a shaker at room temperature.
Con.= Concentration Dil.= Dilution Vol.= Volume Inc.= Incubation CB= Coating buffer Temp= Temperature o/n= over night SB= Sample buffer BSA= Bovine Serum Albumin RACAP = AP conjugated rabbit anti chicken antibody AP= alkaline phosphatase EMA-P= Buffer for enzyme labelled antibody RT= Room temperature PNPP= p-nitrophenyl phosphate
Step Con. /Dil. Vol. (µl)/well Inc. (min) Temp (°C) Coating 1µg/ml in CB 100 60 37 Blocking 1% (w/v) BSA in PBST 300 o/n 4 Sample Dil. in PBS 100 120 37 RACAP 1:5000 in EMA-P 100 60 37 PNPP 1 mg/ml in SB 100 15-60 RT
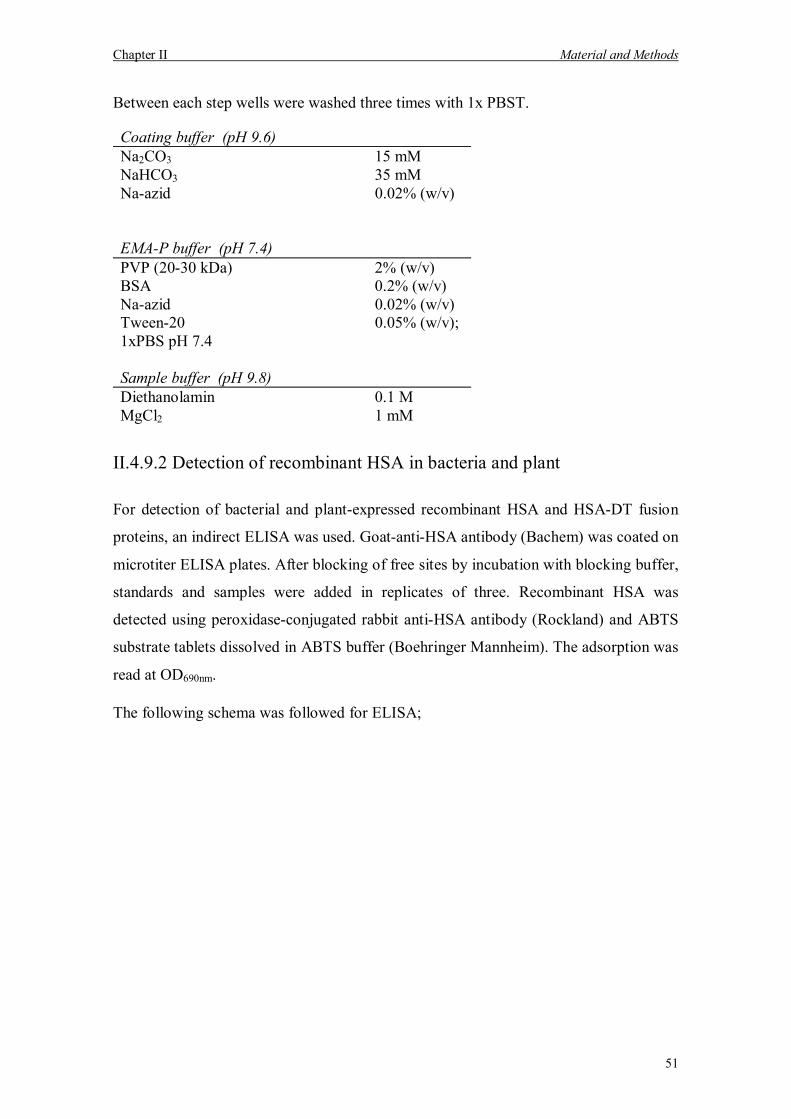
Chapter II Material and Methods
51
Between each step wells were washed three times with 1x PBST.
Coating buffer (pH 9.6) Na2CO3 15 mM NaHCO3 35 mM Na-azid 0.02% (w/v)
EMA-P buffer (pH 7.4) PVP (20-30 kDa) 2% (w/v) BSA 0.2% (w/v) Na-azid 0.02% (w/v) Tween-20 0.05% (w/v); 1xPBS pH 7.4
Sample buffer (pH 9.8) Diethanolamin 0.1 M MgCl2 1 mM
II.4.9.2 Detection of recombinant HSA in bacteria and plant
For detection of bacterial and plant-expressed recombinant HSA and HSA-DT fusion
proteins, an indirect ELISA was used. Goat-anti-HSA antibody (Bachem) was coated on
microtiter ELISA plates. After blocking of free sites by incubation with blocking buffer,
standards and samples were added in replicates of three. Recombinant HSA was
detected using peroxidase-conjugated rabbit anti-HSA antibody (Rockland) and ABTS
substrate tablets dissolved in ABTS buffer (Boehringer Mannheim). The adsorption was
read at OD690nm.
The following schema was followed for ELISA;
Chapter II Material and Methods
52
Table II.3 Illustration of the steps for HSA quantification in bacteria and plant. All the steps were performed in 10-20 ml of solution on a shaker at room temperature.
Con.= Concentration Dil.= Dilution Vol.= Volume Inc.= Incubation Temp= Temperature RT = room temperature o/n= over night α-GHSA = Goat anti-HSA antibody α-RHSAP = peroxidase-conjugated rabbit anti-HSA antibody ABTS = 3-ethylbenzthiazoline-6-sulfonic acid
Step Con. /Dil. Vol. (µl)/well
Inc. (min)
Temp (°C)
α-GHSA 1:500 in TBS 200 o/n 4 Blocking 3% (w/v) MTBS 200 30 RT Sample Dil. in TBS 100 60 RT α-RHSAP 1:20000 in TBS 100 60 RT ABTS 1 mg/ml in ABTS
buffer 100 1-10 RT
Between each step wells were washed three times with washing buffer.
TBS buffer (pH 8.0) Tris-HCl, pH 8.0 0.05 mM NaCl 0.138 M KCl 2.7 mM
Washing buffer (pH 8.0) TBS buffer Tween-20 0.05 %(v/v)
MTBS (Blocking buffer) (pH 8.0) TBS buffer non-fat dry milk 3 % (w/v)
II.5 Production of IgY anti sera
II.5.1 Immunization of chicken
The treatment and maintenance of laboratory animals was approved by the
Regierungspräsidium des Landes NRW (RP-Nr.: 23.203.2 AC 12, 21/95) and
supervised by Dr. Hirsch who is responsible for biological safety at the Institute for
Biology VII, RWTH Aachen. Initial chicken immunizations were performed with
100µg of pure HSA (Sigma, Catalogue number: A1653) in PBS emulsified with an
Chapter II Material and Methods
53
equal volume of complete Freunds adjuvant (GibcoBRL). Two 500µl aliquots were
injected at two different places of pectoral muscle. Three and six weeks after the initial
immunization, injections were repeated as above, except that incomplete Freunds
adjuvant (GibcoBRL) was used. Two weeks after the third immunization, eggs from the
immunized chicken were collected and the specific IgY antibody titer determined by
ELISA (II.4.9.1).
II.5.2 Isolation of chicken polyclonal antibodies from egg yolk
IgY antibodies were purified from egg-yolk by repeated precipitation with PEG-6000 as
described. (Polson et al. 1985). All centrifugations were at 20,000x g for 20 min at 4°C.
The yolk sacs were collected, washed with cold tap water, the yolk volume determined
and four volumes of cold PBS added. 3.5% (w/v) of solid PEG-6000 was added and
stirred until dissolved. After centrifugation the supernatant was filtered through
Miracloth and Whatman 3M paper, 8.5% (w/v) of PEG-6000 was added and re-
centrifuged. The pellet was resuspended in 2.5-fold of the original yolk volume of PBS,
treated with 12% (w/v) PEG-6000 and recentrifuged. The pellet was resuspended in
0.25-fold the original yolk volume of PBS containing 0.02% (w/v) NaN3, treated with
50% (v/v) ice-cold ethanol and centrifuged again to remove all PEG-6000. The
supernatant containing the purified IgY antibodies was filter-sterilized and stored in
aliquots at 20°C. An indirect ELISA was performed in order to determine the
concentration of polyclonal antibodies in egg yolk (II.4.9.1).
II.6 Recombinant protein purification
II.6.1 Immobilized Metal Affinity Chromatography (IMAC)
His-6 tagged secreted recombinant HSA was affinity purified by IMAC. Collected
periplasmic fractions from E.coli suspension were dialysed o/n against PBS (II.4.1). Ni-
NTA-agarose matrix was added in a disposable column, charged with 5 column
volumes (CV) of 50 mM NiSO4 and washed with 10 CV of 0.5 M acetic acid before
equilibration with 10-20 CV of binding buffer (1x PBS, 10 mM imidazol; 500 mM
Chapter II Material and Methods
54
NaCl). Imidazol and sodium chloride were added into the dialyzed periplasmic fraction
(II.4.1) to a final concentration of 10 mM and 500 mM, respectively. The sample was
passed twice through the pre-equilibrated Ni-NTA matrix. The column was washed
with 20 volumes of wash buffer (1x PBS, 30 mM imidazol; 500 mM NaCl) and the
proteins were eluted in three fractions with 700 µl of elution buffer (1x PBS, 250 mM
imidazol pH 4.5). Collected fractions were immediately dialysed against PBS (pH 7.4)
to remove imidazol and salt. To control the yield and purity of dialyzed recombinant
HSA, 5 µl were separated by SDS-PAGE (II.2.4.6.1).
II.6.2 Cation Exchange Chromatography
Total soluble proteins were extracted using 2 ml of extraction buffer (Acetate buffer;
pH: 4.5+5 mM EDTA) per gram leaf material. Cell debris was removed by
centrifugation (16,000g/4°C/30 min) and the supernatant was used for cation exchange
chromatography (CEX). Conventional chromatography in packed bed columns was
performed by Dr. J. Drossard (Institute for Biology VII, RWTH Aachen) using a Äkta
Explorer 10XT or a Äkta Purifier 100 chromatography system (Pharmacia) with cation
exchange columns. Chromatography was performed using either a 1.4 ml Source 30S
(Pharmacia) cation exchange medium in BioCart5 column (Kronlab, Sinsheim) or a
XK50/20 cation exchange column filled with 120 ml of Seppharose Big Beads
equilibrated with the respective loading buffer (20 mM acetate pH 4.0) with a linflow of
300 cm/h.
Chapter III Results
55
III Results
The objective of the present work was production of recombinant human serum albumin
(rHSA) in transgenic organisms. Therefore HSA cDNA was cloned into different bacterial
and plant expression vectors. Initial attempt was to express rHSA in E. coli. After
confirmation of bacterial expression, different plant species were evaluated for high level
production of rHSA. Transient expression of rHSA was carried via Agrobacterium mediated
gene transfer using tobacco leaves and leaves from edible plants like zucchini and bean
leaves. The same expression cassettes developed for agroinfiltration were used to generate
stable transgenic tobacco plants. High level expressors were selected and evaluated for
several generations in the greenhouse. Moreover T2 generation was analysed to confirm
rHSA accumulation in the field. In addition, stable transformation of wheat was performed by
bombarding wheat embryos using a HSA expression construct downstream to ubiquitin
promoter. Stable expression of rHSA in transgenic tobacco suspension cells was performed.
Secreted rHSA to the BY2 culture medium was analysed and stability of the secreted protein
was improved by addition of stabilizing agents. For downstream processing of the transgenic
tobacco plants producing rHSA, cation exchange chromatography was experienced.
Conditions for the partial purification of rHSA from tobacco leaves were optimised.
III.1 Production of polyclonal anti-HSA serum
To detect rHSA accumulation in protein extracts of different production organisms
polyclonal antibodies against HSA were prepared. For the generation of these antibodies,
chicken were immunized by injecting 100µg of commercial HSA (Sigma) (II.5.1). Two
weeks after the third boost, polyclonal chicken IgY antibodies were purified from chicken
egg yolk (II.5.2). IgY was purified by repeated PEG precipitation (Polson, Coetzer et al.
1985) with an average yield of 8 mg IgY per ml yolk, determined by spectrophotometry. As
shown in Fig III.1A (lane 1) the purification of IgY antibodies resulted in some weak
additional protein bands visible at ~40kDa. It was not determined if these bands were
contaminants or IgY degradation products produced during purification and storage. The
antibody titer referring to the highest dilution at which antigen-specific binding is visible by
an E405nm of 0.2 after 1 hour substrate induction (II.4.9.1). The titer of HSA specific
antibodies in egg yolk was determined to be 1: 130,000 by indirect ELISA (Figure III.1B).
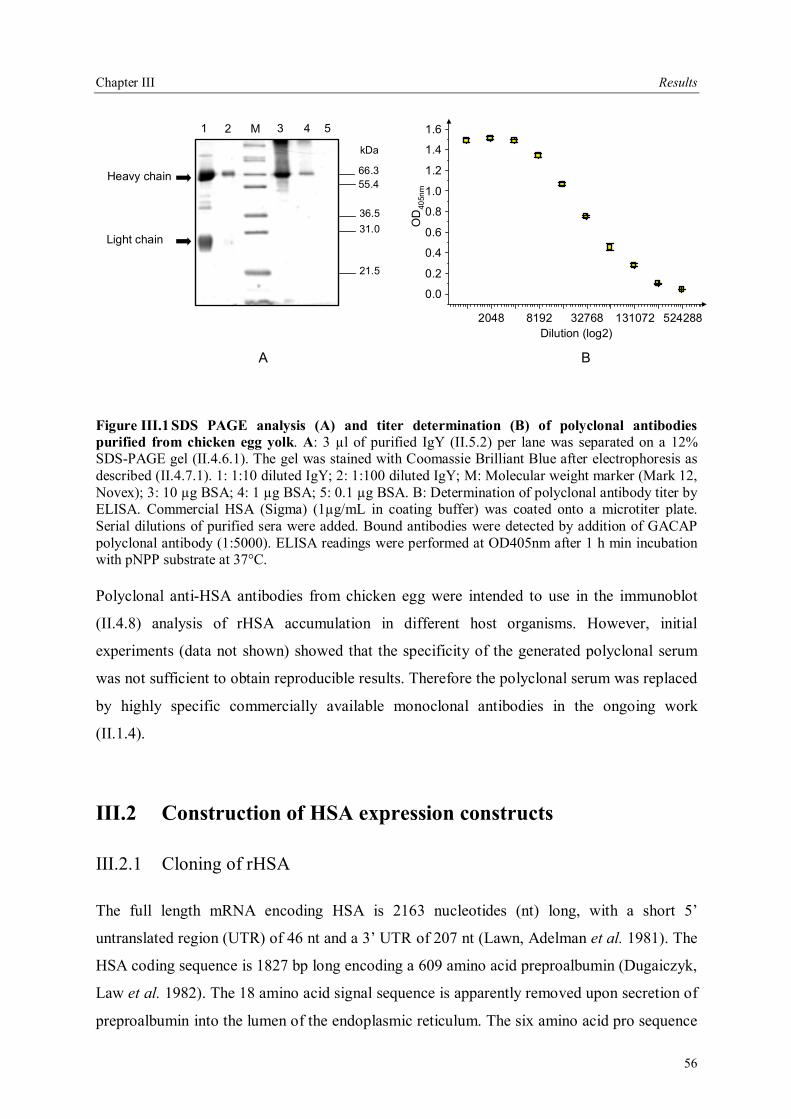
Chapter III Results
56
2048 8192 32768 131072 524288
0.0
0.2
0.4
0.6
0.8
1.0
1.2
1.4
1.6
OD
405n
m
Dilution (log2)
A B
Heavy chain
Light chain
1 2 M 3 4 5
66.3
21.5
36.5
55.4
31.0
kDa
Figure III.1 SDS PAGE analysis (A) and titer determination (B) of polyclonal antibodies purified from chicken egg yolk. A: 3 µl of purified IgY (II.5.2) per lane was separated on a 12% SDS-PAGE gel (II.4.6.1). The gel was stained with Coomassie Brilliant Blue after electrophoresis as described (II.4.7.1). 1: 1:10 diluted IgY; 2: 1:100 diluted IgY; M: Molecular weight marker (Mark 12, Novex); 3: 10 µg BSA; 4: 1 µg BSA; 5: 0.1 µg BSA. B: Determination of polyclonal antibody titer by ELISA. Commercial HSA (Sigma) (1µg/mL in coating buffer) was coated onto a microtiter plate. Serial dilutions of purified sera were added. Bound antibodies were detected by addition of GACAP polyclonal antibody (1:5000). ELISA readings were performed at OD405nm after 1 h min incubation with pNPP substrate at 37°C. Polyclonal anti-HSA antibodies from chicken egg were intended to use in the immunoblot
(II.4.8) analysis of rHSA accumulation in different host organisms. However, initial
experiments (data not shown) showed that the specificity of the generated polyclonal serum
was not sufficient to obtain reproducible results. Therefore the polyclonal serum was replaced
by highly specific commercially available monoclonal antibodies in the ongoing work
(II.1.4).
III.2 Construction of HSA expression constructs
III.2.1 Cloning of rHSA
The full length mRNA encoding HSA is 2163 nucleotides (nt) long, with a short 5
untranslated region (UTR) of 46 nt and a 3 UTR of 207 nt (Lawn, Adelman et al. 1981). The
HSA coding sequence is 1827 bp long encoding a 609 amino acid preproalbumin (Dugaiczyk,
Law et al. 1982). The 18 amino acid signal sequence is apparently removed upon secretion of
preproalbumin into the lumen of the endoplasmic reticulum. The six amino acid pro sequence
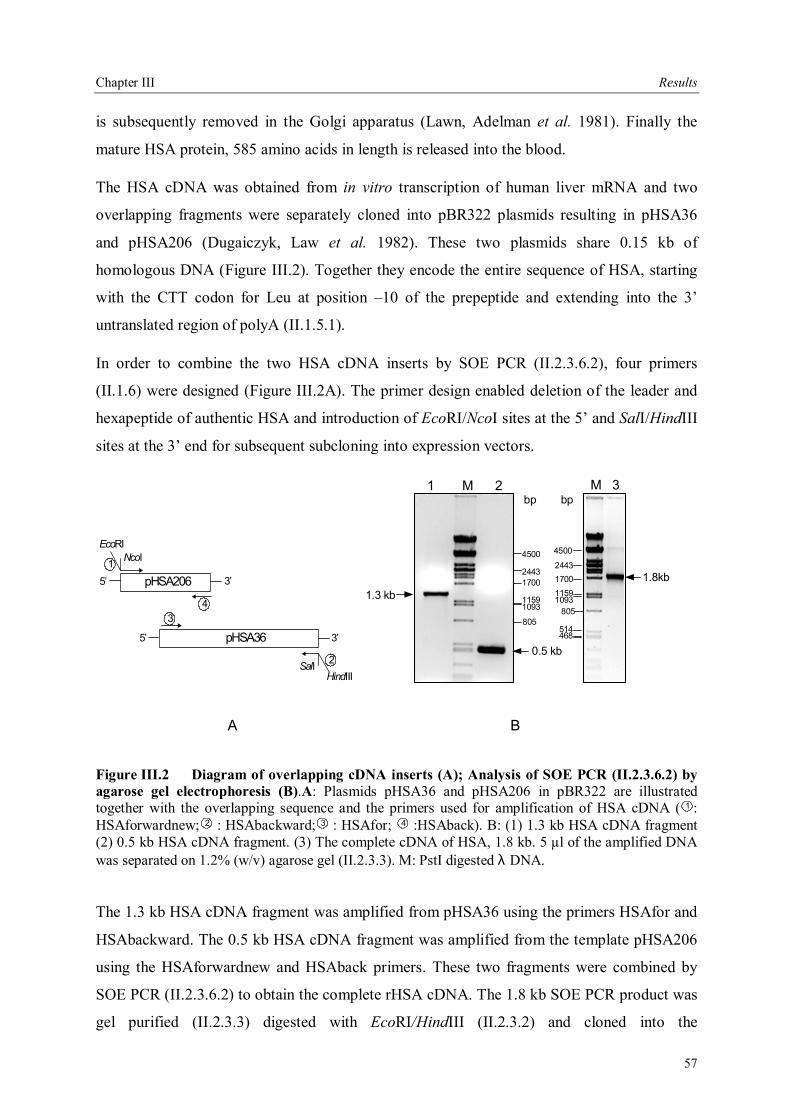
Chapter III Results
57
is subsequently removed in the Golgi apparatus (Lawn, Adelman et al. 1981). Finally the
mature HSA protein, 585 amino acids in length is released into the blood.
The HSA cDNA was obtained from in vitro transcription of human liver mRNA and two
overlapping fragments were separately cloned into pBR322 plasmids resulting in pHSA36
and pHSA206 (Dugaiczyk, Law et al. 1982). These two plasmids share 0.15 kb of
homologous DNA (Figure III.2). Together they encode the entire sequence of HSA, starting
with the CTT codon for Leu at position 10 of the prepeptide and extending into the 3
untranslated region of polyA (II.1.5.1).
In order to combine the two HSA cDNA inserts by SOE PCR (II.2.3.6.2), four primers
(II.1.6) were designed (Figure III.2A). The primer design enabled deletion of the leader and
hexapeptide of authentic HSA and introduction of EcoRI/NcoI sites at the 5 and SalI/HindIII
sites at the 3 end for subsequent subcloning into expression vectors.
EcoRI
pHSA206
NcoI
351
4
pHSA36
SalI
5 3
HindIII
3
2
1 2 M
1.8kb
M 3
11591093
17002443
4500
805
bp
11591093
17002443
4500
805
514
bp
468
1.3 kb
0.5 kb
A B
Figure III.2 Diagram of overlapping cDNA inserts (A); Analysis of SOE PCR (II.2.3.6.2) by agarose gel electrophoresis (B).A: Plasmids pHSA36 and pHSA206 in pBR322 are illustrated together with the overlapping sequence and the primers used for amplification of HSA cDNA ( 1 : HSAforwardnew; 2 : HSAbackward; 3 : HSAfor; 4 :HSAback). B: (1) 1.3 kb HSA cDNA fragment (2) 0.5 kb HSA cDNA fragment. (3) The complete cDNA of HSA, 1.8 kb. 5 µl of the amplified DNA was separated on 1.2% (w/v) agarose gel (II.2.3.3). M: PstI digested λ DNA.
The 1.3 kb HSA cDNA fragment was amplified from pHSA36 using the primers HSAfor and
HSAbackward. The 0.5 kb HSA cDNA fragment was amplified from the template pHSA206
using the HSAforwardnew and HSAback primers. These two fragments were combined by
SOE PCR (II.2.3.6.2) to obtain the complete rHSA cDNA. The 1.8 kb SOE PCR product was
gel purified (II.2.3.3) digested with EcoRI/HindIII (II.2.3.2) and cloned into the

Chapter III Results
58
EcoRI/HindIII site of the pGEM-3zf vector (II.1.5.3). Sequencing was done using the forward
and backward primers specific for the vector DNA and/or specific for HSA (II.1.6).
Nucleotide sequence of rHSA cDNA was identical to the sequence published by Dugaizyck et
al. (1982).
III.2.2 Construction of plant codon optimized rHSA
The codon usage pattern applied in different organisms varies. Presence of high contents of
rare codons that are used at low frequencies in a host organism often leads to low levels of
foreign protein expression or truncated products because of the premature termination in
protein translation (Chen and Inouye 1990; Hannig and Makrides 1998). To overcome this
problem, a novel plant codon optimised semi-synthetic gene for high-level HSA expression
was generated. The frequencies of amino acid coding sequences (CDSs) for 8792 different
organisms were compiled from the taxonomical divisions of the GenBank DNA sequence
database (Nakamura, Gojobori and Ikemura 2000), source: http://www.kazusa.or.jp/codon/.
By the help of this codon usage database it was possible to replace the codons that are poorly
(less than 1%) presented in the tobacco, wheat and rice genome by the codons that are
preferred.
The albumin cDNA consists of 585 amino acids and the gene contains 18.3% rare codons for
tobacco, wheat and rice plants expression that are distributed throughout the entire sequence.
Distribution of rare codons in HSA sequence is illustrated in Appendix VIII.3. The DNA
sequence of the rHSA was altered to match the plant preferred pattern of codon usage by
codon replacement (VIII.4), while maintaining the identical amino acid sequence for
expression of the recombinant protein. The plant codon optimised HSA was synthesized via
PCR. The final product after PCR assembly was 1755 bp long, 1138 of which are made of the
primers used for the amplification. This corresponds to 65% of the total sequence.
To assemble the plant codon optimised HSA, 32 different primers (VIII.2) differing in length
were designed. They did not cover all the HSA sequence for a complete synthetic gene rather
only parts of the sequence were modified and only for those parts primer addition was
required. The reason for this strategy was to reduce the complexity and cost of the PCR
assembly for amplification of a totally synthetic gene, which would require at least 50
primers. Since only the regions with rare codons were replaced, the rest of the sequence was
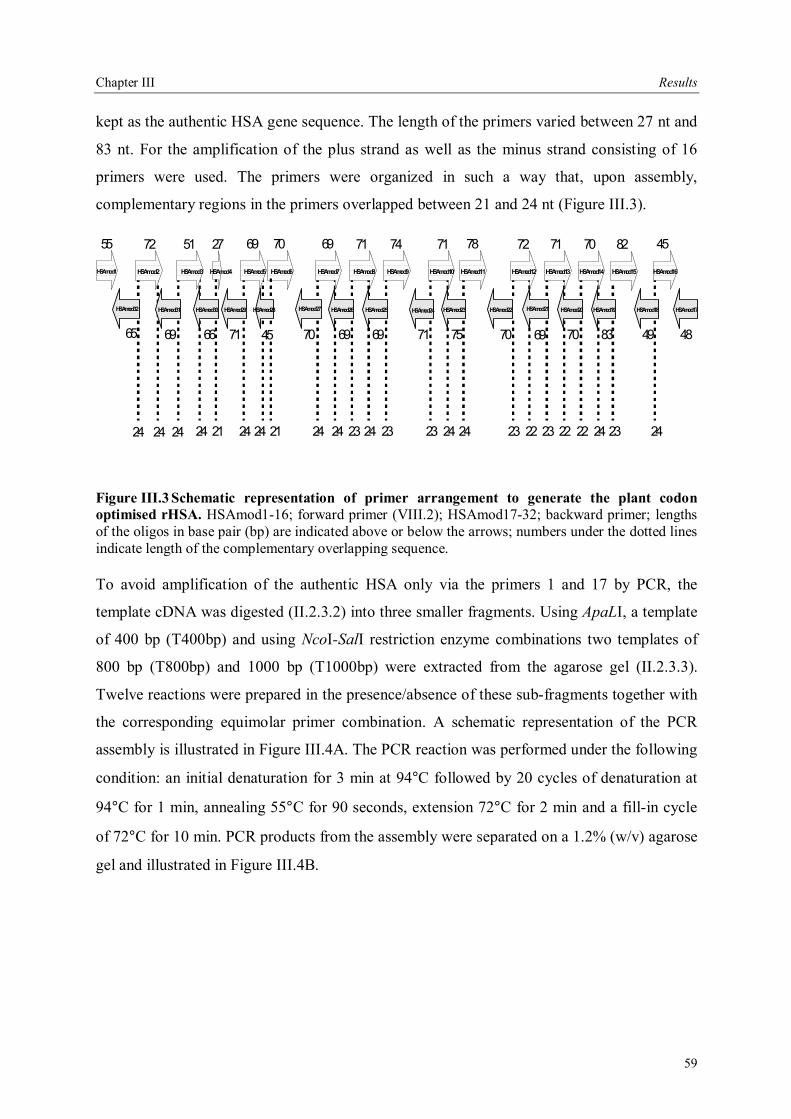
Chapter III Results
59
kept as the authentic HSA gene sequence. The length of the primers varied between 27 nt and
83 nt. For the amplification of the plus strand as well as the minus strand consisting of 16
primers were used. The primers were organized in such a way that, upon assembly,
complementary regions in the primers overlapped between 21 and 24 nt (Figure III.3).
55
49
45
24
48
HSAmod18 HSAmod17
70
69
24
69
24 23
71
69
24
74
23
HSAmod27 HSAmod26 HSAmod25
71
24
69 70
24
45
21
HSAmod29 HSAmod28
71
71
23
75
24
78
24
HSAmod24 HSAmod23 HSAmod22
70
72
23
69
22 23
71
70
22
70
22
83
24
82
23
HSAmod21 HSAmod20 HSAmod19
66
24
27
21
65
72
2424
69
51
HSAmod31 HSAmod30
24
HSAmod32
HSAmod1 HSAmod16HSAmod7 HSAmod8 HSAmod9HSAmod5 HSAmod6 HSAmod10 HSAmod11 HSAmod12 HSAmod13 HSAmod14 HSAmod15HSAmod2 HSAmod3 HSAmod4
Figure III.3 Schematic representation of primer arrangement to generate the plant codon optimised rHSA. HSAmod1-16; forward primer (VIII.2); HSAmod17-32; backward primer; lengths of the oligos in base pair (bp) are indicated above or below the arrows; numbers under the dotted lines indicate length of the complementary overlapping sequence. To avoid amplification of the authentic HSA only via the primers 1 and 17 by PCR, the
template cDNA was digested (II.2.3.2) into three smaller fragments. Using ApaLI, a template
of 400 bp (T400bp) and using NcoI-SalI restriction enzyme combinations two templates of
800 bp (T800bp) and 1000 bp (T1000bp) were extracted from the agarose gel (II.2.3.3).
Twelve reactions were prepared in the presence/absence of these sub-fragments together with
the corresponding equimolar primer combination. A schematic representation of the PCR
assembly is illustrated in Figure III.4A. The PCR reaction was performed under the following
condition: an initial denaturation for 3 min at 94°C followed by 20 cycles of denaturation at
94°C for 1 min, annealing 55°C for 90 seconds, extension 72°C for 2 min and a fill-in cycle
of 72°C for 10 min. PCR products from the assembly were separated on a 1.2% (w/v) agarose
gel and illustrated in Figure III.4B.
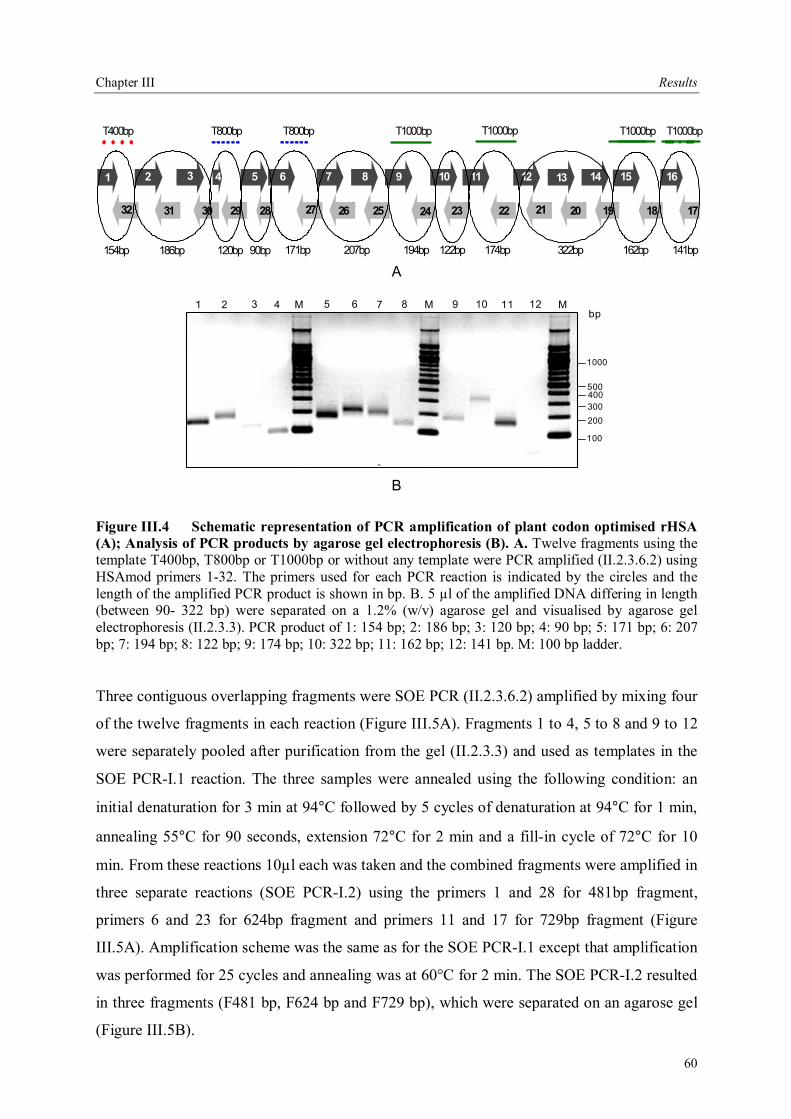
Chapter III Results
60
1 16
18 17
7 8 9
27 26 25
5 6
29 28
10 11
24 23 22
12 13 14 15
21 20 19
2 3 4
31 3032
207bp 194bp171bp 122bp 322bp 162bp 141bp174bp
T400bp T800bp T800bp T1000bp T1000bp T1000bp
186bp 120bp154bp 90bp
T1000bp
A
1 2 3 4 M 5 6 7 8 M 9 10 11 12 M
100
200300400500
1000
bp
B
Figure III.4 Schematic representation of PCR amplification of plant codon optimised rHSA (A); Analysis of PCR products by agarose gel electrophoresis (B). A. Twelve fragments using the template T400bp, T800bp or T1000bp or without any template were PCR amplified (II.2.3.6.2) using HSAmod primers 1-32. The primers used for each PCR reaction is indicated by the circles and the length of the amplified PCR product is shown in bp. B. 5 µl of the amplified DNA differing in length (between 90- 322 bp) were separated on a 1.2% (w/v) agarose gel and visualised by agarose gel electrophoresis (II.2.3.3). PCR product of 1: 154 bp; 2: 186 bp; 3: 120 bp; 4: 90 bp; 5: 171 bp; 6: 207 bp; 7: 194 bp; 8: 122 bp; 9: 174 bp; 10: 322 bp; 11: 162 bp; 12: 141 bp. M: 100 bp ladder.
Three contiguous overlapping fragments were SOE PCR (II.2.3.6.2) amplified by mixing four
of the twelve fragments in each reaction (Figure III.5A). Fragments 1 to 4, 5 to 8 and 9 to 12
were separately pooled after purification from the gel (II.2.3.3) and used as templates in the
SOE PCR-I.1 reaction. The three samples were annealed using the following condition: an
initial denaturation for 3 min at 94°C followed by 5 cycles of denaturation at 94°C for 1 min,
annealing 55°C for 90 seconds, extension 72°C for 2 min and a fill-in cycle of 72°C for 10
min. From these reactions 10µl each was taken and the combined fragments were amplified in
three separate reactions (SOE PCR-I.2) using the primers 1 and 28 for 481bp fragment,
primers 6 and 23 for 624bp fragment and primers 11 and 17 for 729bp fragment (Figure
III.5A). Amplification scheme was the same as for the SOE PCR-I.1 except that amplification
was performed for 25 cycles and annealing was at 60°C for 2 min. The SOE PCR-I.2 resulted
in three fragments (F481 bp, F624 bp and F729 bp), which were separated on an agarose gel
(Figure III.5B).
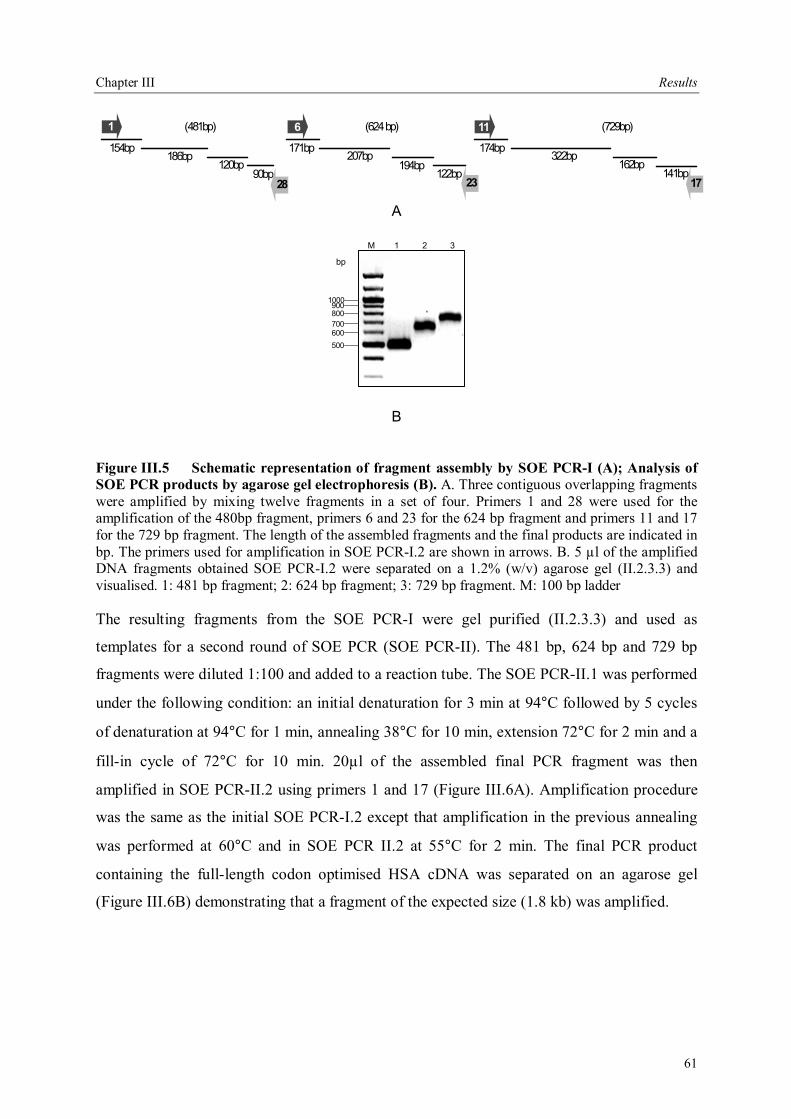
Chapter III Results
61
154bp186bp
120bp90bp
1
28 23
11
17
207bp194bp
171bp
122bp322bp
162bp141bp
174bp
6(481bp) (624 bp) (729bp)
A
M 1 2 3
1000900800
600700
500
bp
B
Figure III.5 Schematic representation of fragment assembly by SOE PCR-I (A); Analysis of SOE PCR products by agarose gel electrophoresis (B). A. Three contiguous overlapping fragments were amplified by mixing twelve fragments in a set of four. Primers 1 and 28 were used for the amplification of the 480bp fragment, primers 6 and 23 for the 624 bp fragment and primers 11 and 17 for the 729 bp fragment. The length of the assembled fragments and the final products are indicated in bp. The primers used for amplification in SOE PCR-I.2 are shown in arrows. B. 5 µl of the amplified DNA fragments obtained SOE PCR-I.2 were separated on a 1.2% (w/v) agarose gel (II.2.3.3) and visualised. 1: 481 bp fragment; 2: 624 bp fragment; 3: 729 bp fragment. M: 100 bp ladder
The resulting fragments from the SOE PCR-I were gel purified (II.2.3.3) and used as
templates for a second round of SOE PCR (SOE PCR-II). The 481 bp, 624 bp and 729 bp
fragments were diluted 1:100 and added to a reaction tube. The SOE PCR-II.1 was performed
under the following condition: an initial denaturation for 3 min at 94°C followed by 5 cycles
of denaturation at 94°C for 1 min, annealing 38°C for 10 min, extension 72°C for 2 min and a
fill-in cycle of 72°C for 10 min. 20µl of the assembled final PCR fragment was then
amplified in SOE PCR-II.2 using primers 1 and 17 (Figure III.6A). Amplification procedure
was the same as the initial SOE PCR-I.2 except that amplification in the previous annealing
was performed at 60°C and in SOE PCR II.2 at 55°C for 2 min. The final PCR product
containing the full-length codon optimised HSA cDNA was separated on an agarose gel
(Figure III.6B) demonstrating that a fragment of the expected size (1.8 kb) was amplified.
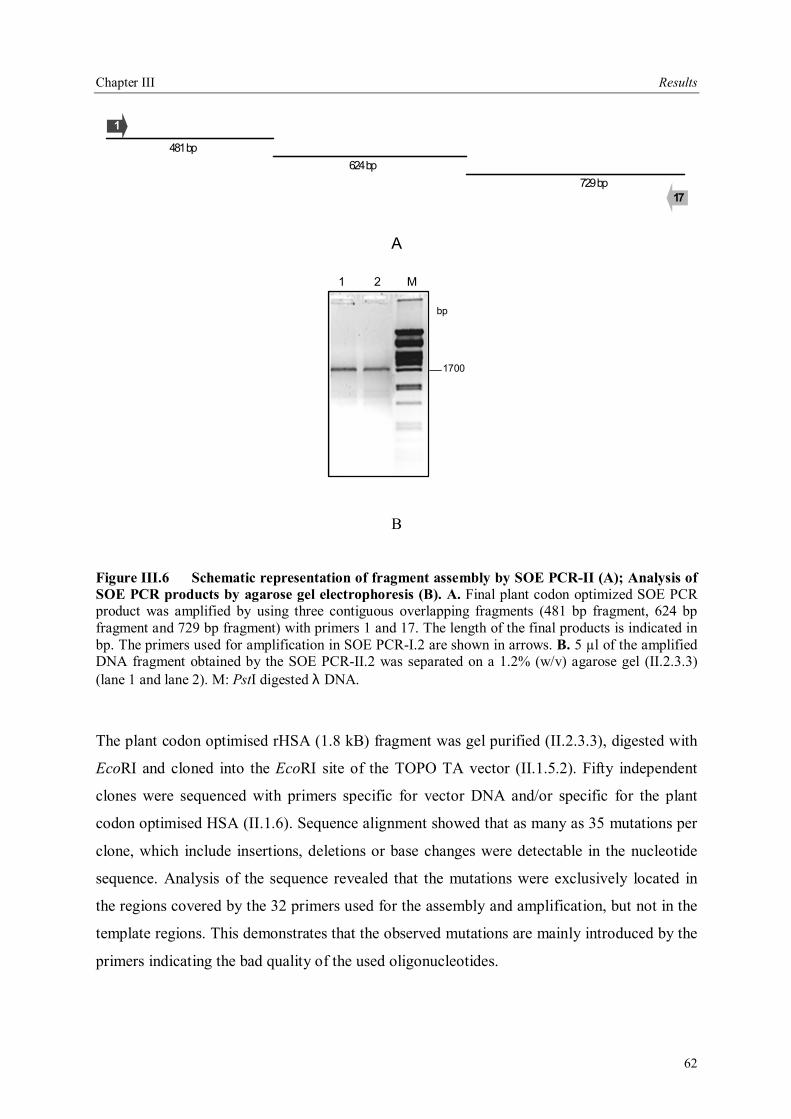
Chapter III Results
62
481 bp624 bp
729 bp
1
17
A
1 2 M
1700
bp
B
Figure III.6 Schematic representation of fragment assembly by SOE PCR-II (A); Analysis of SOE PCR products by agarose gel electrophoresis (B). A. Final plant codon optimized SOE PCR product was amplified by using three contiguous overlapping fragments (481 bp fragment, 624 bp fragment and 729 bp fragment) with primers 1 and 17. The length of the final products is indicated in bp. The primers used for amplification in SOE PCR-I.2 are shown in arrows. B. 5 µl of the amplified DNA fragment obtained by the SOE PCR-II.2 was separated on a 1.2% (w/v) agarose gel (II.2.3.3) (lane 1 and lane 2). M: PstI digested λ DNA.
The plant codon optimised rHSA (1.8 kB) fragment was gel purified (II.2.3.3), digested with
EcoRI and cloned into the EcoRI site of the TOPO TA vector (II.1.5.2). Fifty independent
clones were sequenced with primers specific for vector DNA and/or specific for the plant
codon optimised HSA (II.1.6). Sequence alignment showed that as many as 35 mutations per
clone, which include insertions, deletions or base changes were detectable in the nucleotide
sequence. Analysis of the sequence revealed that the mutations were exclusively located in
the regions covered by the 32 primers used for the assembly and amplification, but not in the
template regions. This demonstrates that the observed mutations are mainly introduced by the
primers indicating the bad quality of the used oligonucleotides.
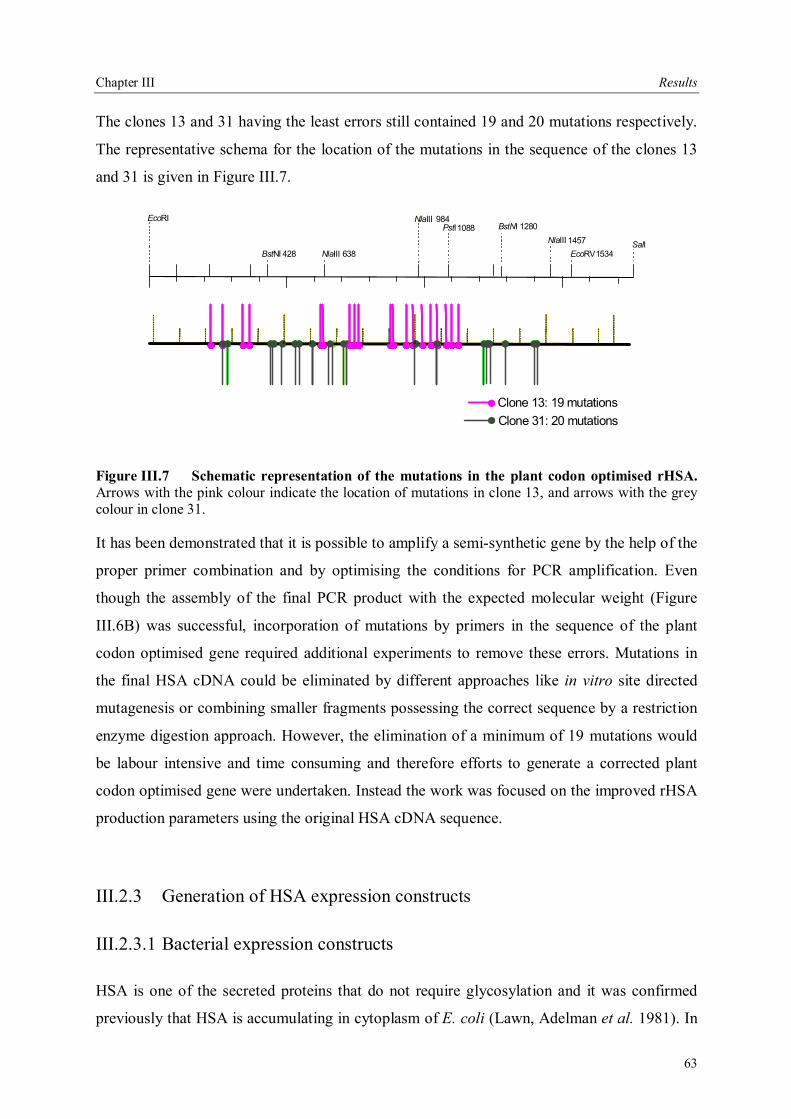
Chapter III Results
63
The clones 13 and 31 having the least errors still contained 19 and 20 mutations respectively.
The representative schema for the location of the mutations in the sequence of the clones 13
and 31 is given in Figure III.7.
BstNI 428, NlaIII 638
NlaIII 984PstI1088 BstNI 1280
NlaIII 1457EcoRV1534
Clone 13: 19 mutationsClone 31: 20 mutations
500 1000 1500 bp500 1000 1500 bp500 1000 1500 bp500 1000 1500 bp500 1000 1500 bp
EcoRI
SalI
Figure III.7 Schematic representation of the mutations in the plant codon optimised rHSA. Arrows with the pink colour indicate the location of mutations in clone 13, and arrows with the grey colour in clone 31.
It has been demonstrated that it is possible to amplify a semi-synthetic gene by the help of the
proper primer combination and by optimising the conditions for PCR amplification. Even
though the assembly of the final PCR product with the expected molecular weight (Figure
III.6B) was successful, incorporation of mutations by primers in the sequence of the plant
codon optimised gene required additional experiments to remove these errors. Mutations in
the final HSA cDNA could be eliminated by different approaches like in vitro site directed
mutagenesis or combining smaller fragments possessing the correct sequence by a restriction
enzyme digestion approach. However, the elimination of a minimum of 19 mutations would
be labour intensive and time consuming and therefore efforts to generate a corrected plant
codon optimised gene were undertaken. Instead the work was focused on the improved rHSA
production parameters using the original HSA cDNA sequence.
III.2.3 Generation of HSA expression constructs
III.2.3.1 Bacterial expression constructs
HSA is one of the secreted proteins that do not require glycosylation and it was confirmed
previously that HSA is accumulating in cytoplasm of E. coli (Lawn, Adelman et al. 1981). In

Chapter III Results
64
this thesis, two approaches for expression of HSA in E. coli were examined. The HSA cDNA
was cloned into the vectors pET21d (II.1.5.5) and pET22b (II.1.5.6) via NcoI and SalI
restriction enzyme sites. Both expression vectors contain the T7 promoter, pBR322 origin,
ampicillin resistance gene as selective marker and a C-terminal his-tag sequence for
purification. The pET22b vector (II.1.5.6) carries additionally a pelB leader sequence for
targeting the heterologous expressed protein to the periplasm. Recombinant plasmids
pET21d-HSA (cytoplasmic expression) and pET22b-HSA (periplasmic expression) were
transformed separately into E. coli strain BL21λDE3 and used for bacterial expression
(III.4.1).
III.2.3.2 Plant expression constructs
For generation of the HSA-APO construct enabling secretion of rHSA into apoplastic space
of plant cells, HSA in the pGEM-3zf vector (III.2.1) was digested with SalI and partially with
NcoI. Subsequently, the hemoglobin gene (HEME) in the HEME-APO construct was
replaced by the HSA cDNA in the pUC18 vector containing chalchone synthase
5 untranslated region (CHS) and the plant codon optimised signal sequence (LPL*) at the
5 and cmyc and his6 tag at the 3 end. Finally the HSA cassette was cut from HSA-APO in
pUC18 including CHS and LPL* via EcoRI and SalI enzymes and cloned into the pSSH1
vectors containing either cmyc-his6 (HSA-APO) or KDEL tag (HSA-KDEL) at the 3
terminus. The resulting HSA-APO and HSA-KDEL constructs in pSSH1 plant expression
vector were transformed into E. coli and DNA from independent clones was sequenced
(II.2.3.7) in order to verify the expected sequence.
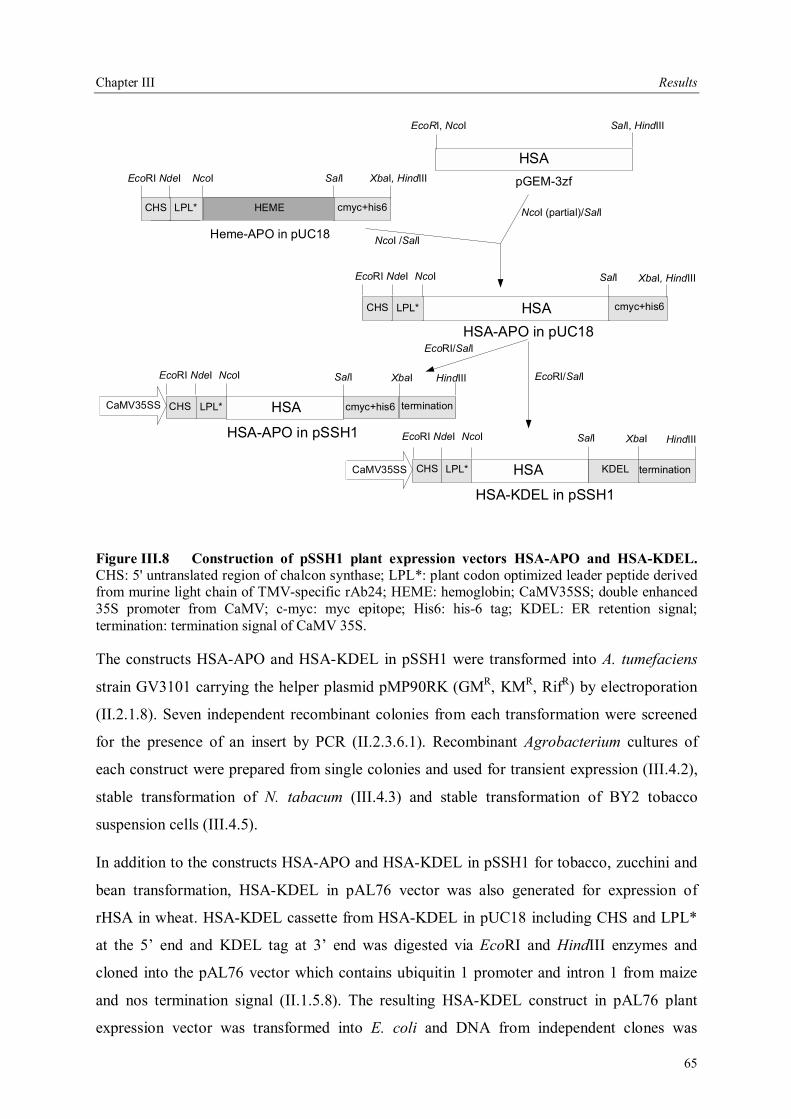
Chapter III Results
65
HSApGEM-3zf
SalI, HindIIIEcoRI, NcoI
Heme-APO in pUC18
cmyc+his6LPL*CHS
EcoRI NdeI NcoI SalI XbaI, HindIII
NcoI (partial)/SalI
NcoI /SalI
EcoRI NdeI NcoI SalI
HSA cmyc+his6
EcoRI/SalIHSA-APO in pUC18
LPL*CHS cmyc+his6HSA
LPL*CHS KDELHSA
EcoRI/SalI
HSA-APO in pSSH1
HSA-KDEL in pSSH1
HEME
LPL*CHS
XbaI, HindIII
EcoRI NdeI NcoI SalI XbaI
EcoRI NdeI NcoI SalI XbaI
CaMV35SS termination
HindIII
HindIII
CaMV35SS termination
Figure III.8 Construction of pSSH1 plant expression vectors HSA-APO and HSA-KDEL. CHS: 5' untranslated region of chalcon synthase; LPL*: plant codon optimized leader peptide derived from murine light chain of TMV-specific rAb24; HEME: hemoglobin; CaMV35SS; double enhanced 35S promoter from CaMV; c-myc: myc epitope; His6: his-6 tag; KDEL: ER retention signal; termination: termination signal of CaMV 35S.
The constructs HSA-APO and HSA-KDEL in pSSH1 were transformed into A. tumefaciens
strain GV3101 carrying the helper plasmid pMP90RK (GMR, KMR, RifR) by electroporation
(II.2.1.8). Seven independent recombinant colonies from each transformation were screened
for the presence of an insert by PCR (II.2.3.6.1). Recombinant Agrobacterium cultures of
each construct were prepared from single colonies and used for transient expression (III.4.2),
stable transformation of N. tabacum (III.4.3) and stable transformation of BY2 tobacco
suspension cells (III.4.5).
In addition to the constructs HSA-APO and HSA-KDEL in pSSH1 for tobacco, zucchini and
bean transformation, HSA-KDEL in pAL76 vector was also generated for expression of
rHSA in wheat. HSA-KDEL cassette from HSA-KDEL in pUC18 including CHS and LPL*
at the 5 end and KDEL tag at 3 end was digested via EcoRI and HindIII enzymes and
cloned into the pAL76 vector which contains ubiquitin 1 promoter and intron 1 from maize
and nos termination signal (II.1.5.8). The resulting HSA-KDEL construct in pAL76 plant
expression vector was transformed into E. coli and DNA from independent clones was
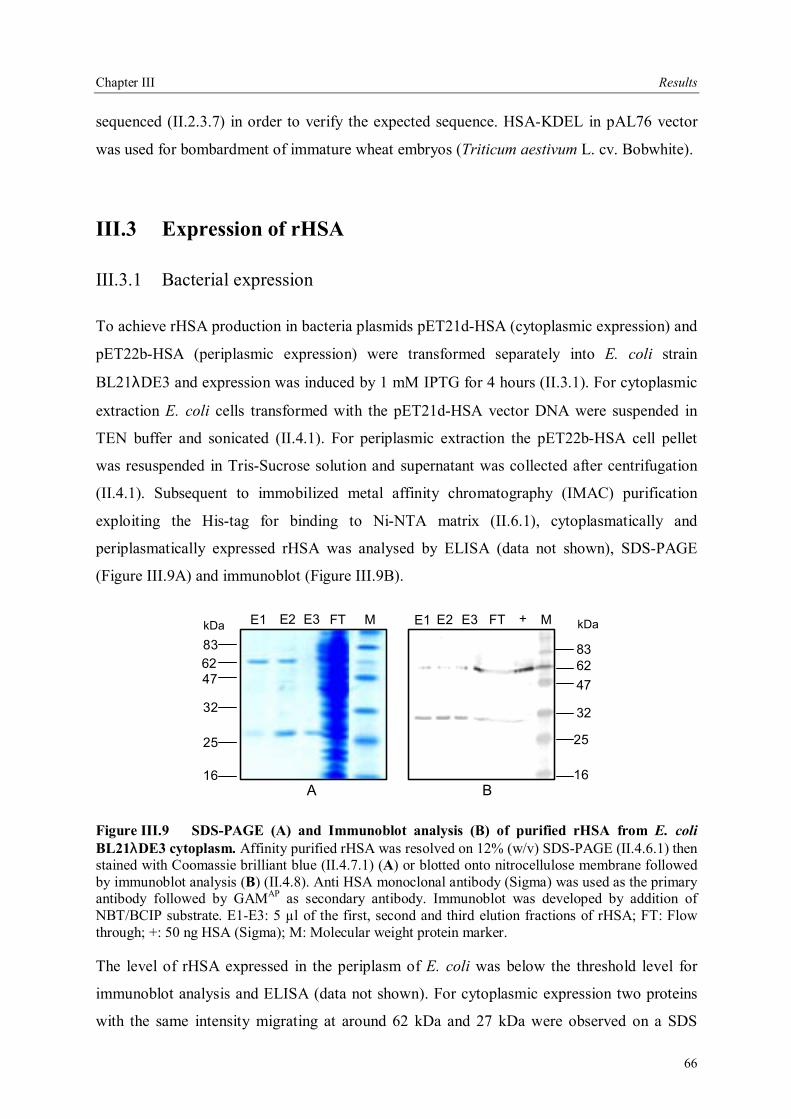
Chapter III Results
66
sequenced (II.2.3.7) in order to verify the expected sequence. HSA-KDEL in pAL76 vector
was used for bombardment of immature wheat embryos (Triticum aestivum L. cv. Bobwhite).
III.3 Expression of rHSA
III.3.1 Bacterial expression
To achieve rHSA production in bacteria plasmids pET21d-HSA (cytoplasmic expression) and
pET22b-HSA (periplasmic expression) were transformed separately into E. coli strain
BL21λDE3 and expression was induced by 1 mM IPTG for 4 hours (II.3.1). For cytoplasmic
extraction E. coli cells transformed with the pET21d-HSA vector DNA were suspended in
TEN buffer and sonicated (II.4.1). For periplasmic extraction the pET22b-HSA cell pellet
was resuspended in Tris-Sucrose solution and supernatant was collected after centrifugation
(II.4.1). Subsequent to immobilized metal affinity chromatography (IMAC) purification
exploiting the His-tag for binding to Ni-NTA matrix (II.6.1), cytoplasmatically and
periplasmatically expressed rHSA was analysed by ELISA (data not shown), SDS-PAGE
(Figure III.9A) and immunoblot (Figure III.9B).
E1 E2 FTE3 M
836247
32
25
16
836247
32
25
16
E1 E2 E3 FT + M
BA
kDa kDa
Figure III.9 SDS-PAGE (A) and Immunoblot analysis (B) of purified rHSA from E. coli BL21λDE3 cytoplasm. Affinity purified rHSA was resolved on 12% (w/v) SDS-PAGE (II.4.6.1) then stained with Coomassie brilliant blue (II.4.7.1) (A) or blotted onto nitrocellulose membrane followed by immunoblot analysis (B) (II.4.8). Anti HSA monoclonal antibody (Sigma) was used as the primary antibody followed by GAMAP as secondary antibody. Immunoblot was developed by addition of NBT/BCIP substrate. E1-E3: 5 µl of the first, second and third elution fractions of rHSA; FT: Flow through; +: 50 ng HSA (Sigma); M: Molecular weight protein marker.
The level of rHSA expressed in the periplasm of E. coli was below the threshold level for
immunoblot analysis and ELISA (data not shown). For cytoplasmic expression two proteins
with the same intensity migrating at around 62 kDa and 27 kDa were observed on a SDS
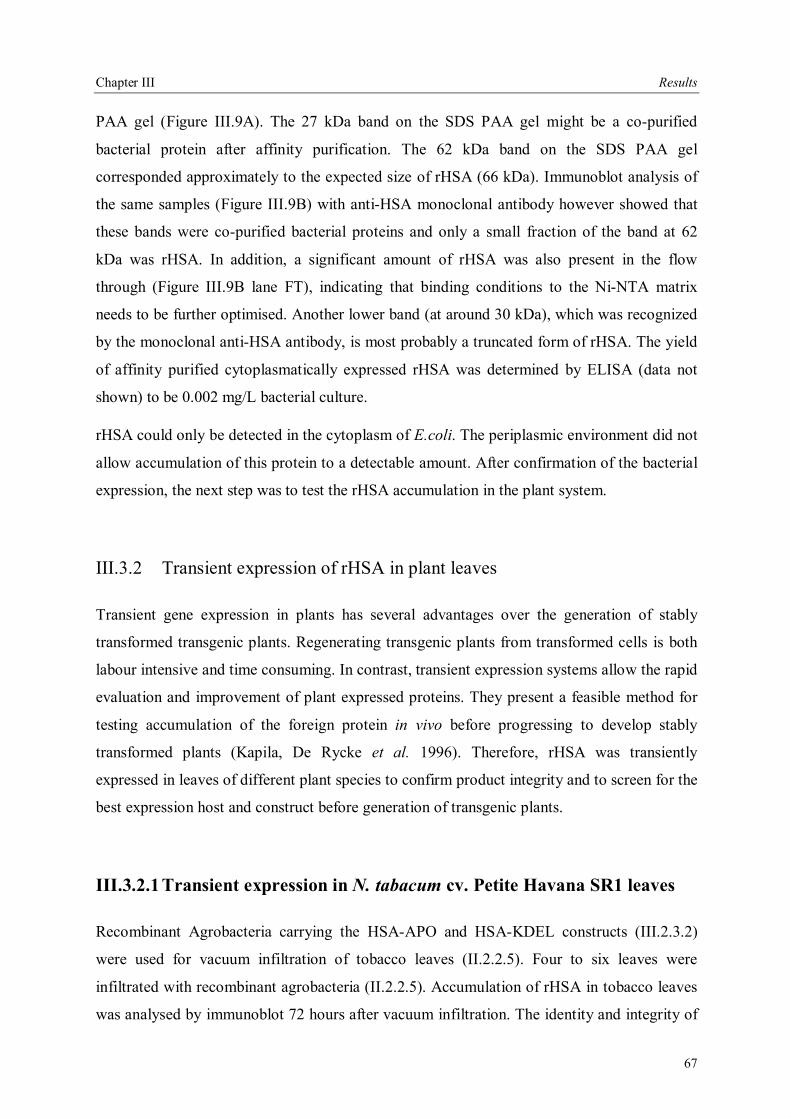
Chapter III Results
67
PAA gel (Figure III.9A). The 27 kDa band on the SDS PAA gel might be a co-purified
bacterial protein after affinity purification. The 62 kDa band on the SDS PAA gel
corresponded approximately to the expected size of rHSA (66 kDa). Immunoblot analysis of
the same samples (Figure III.9B) with anti-HSA monoclonal antibody however showed that
these bands were co-purified bacterial proteins and only a small fraction of the band at 62
kDa was rHSA. In addition, a significant amount of rHSA was also present in the flow
through (Figure III.9B lane FT), indicating that binding conditions to the Ni-NTA matrix
needs to be further optimised. Another lower band (at around 30 kDa), which was recognized
by the monoclonal anti-HSA antibody, is most probably a truncated form of rHSA. The yield
of affinity purified cytoplasmatically expressed rHSA was determined by ELISA (data not
shown) to be 0.002 mg/L bacterial culture.
rHSA could only be detected in the cytoplasm of E.coli. The periplasmic environment did not
allow accumulation of this protein to a detectable amount. After confirmation of the bacterial
expression, the next step was to test the rHSA accumulation in the plant system.
III.3.2 Transient expression of rHSA in plant leaves
Transient gene expression in plants has several advantages over the generation of stably
transformed transgenic plants. Regenerating transgenic plants from transformed cells is both
labour intensive and time consuming. In contrast, transient expression systems allow the rapid
evaluation and improvement of plant expressed proteins. They present a feasible method for
testing accumulation of the foreign protein in vivo before progressing to develop stably
transformed plants (Kapila, De Rycke et al. 1996). Therefore, rHSA was transiently
expressed in leaves of different plant species to confirm product integrity and to screen for the
best expression host and construct before generation of transgenic plants.
III.3.2.1 Transient expression in N. tabacum cv. Petite Havana SR1 leaves
Recombinant Agrobacteria carrying the HSA-APO and HSA-KDEL constructs (III.2.3.2)
were used for vacuum infiltration of tobacco leaves (II.2.2.5). Four to six leaves were
infiltrated with recombinant agrobacteria (II.2.2.5). Accumulation of rHSA in tobacco leaves
was analysed by immunoblot 72 hours after vacuum infiltration. The identity and integrity of
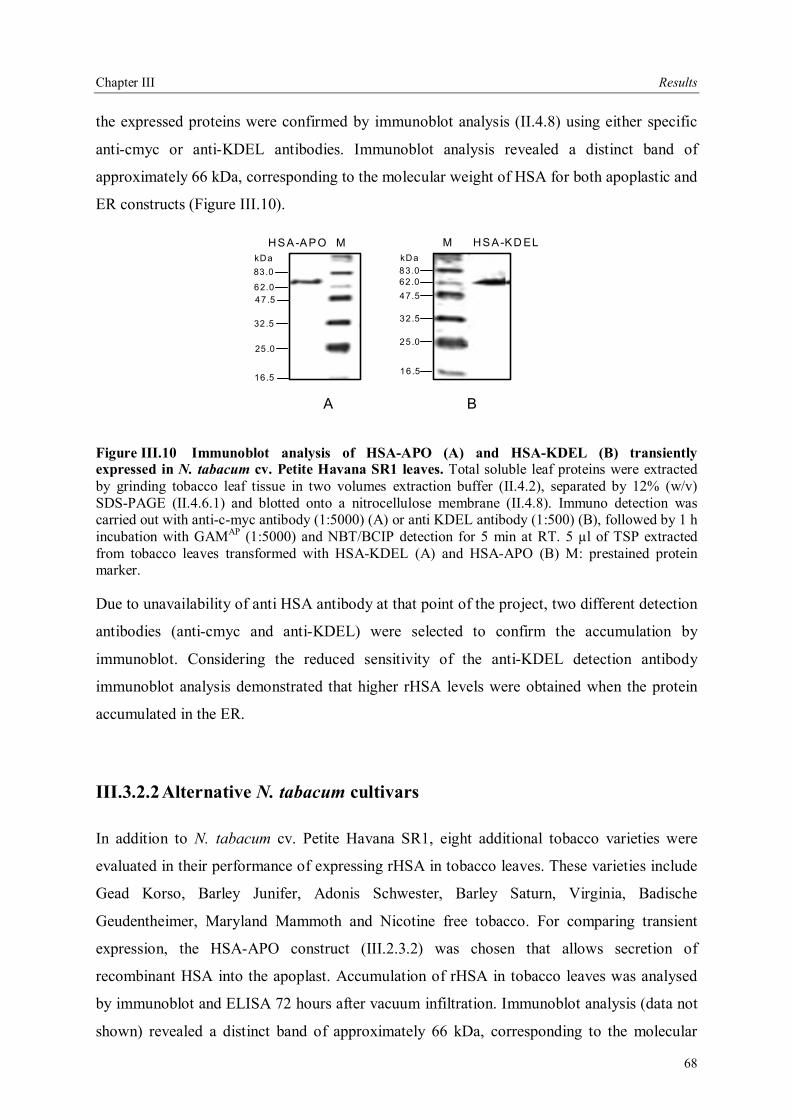
Chapter III Results
68
the expressed proteins were confirmed by immunoblot analysis (II.4.8) using either specific
anti-cmyc or anti-KDEL antibodies. Immunoblot analysis revealed a distinct band of
approximately 66 kDa, corresponding to the molecular weight of HSA for both apoplastic and
ER constructs (Figure III.10).
M
83.0
62.047.5
32.5
25.0
16.5
HSA-APOkDa
M
83.062.047.5
32.5
25.0
16.5
HSA-KD ELkDa
A B
Figure III.10 Immunoblot analysis of HSA-APO (A) and HSA-KDEL (B) transiently expressed in N. tabacum cv. Petite Havana SR1 leaves. Total soluble leaf proteins were extracted by grinding tobacco leaf tissue in two volumes extraction buffer (II.4.2), separated by 12% (w/v) SDS-PAGE (II.4.6.1) and blotted onto a nitrocellulose membrane (II.4.8). Immuno detection was carried out with anti-c-myc antibody (1:5000) (A) or anti KDEL antibody (1:500) (B), followed by 1 h incubation with GAMAP (1:5000) and NBT/BCIP detection for 5 min at RT. 5 µl of TSP extracted from tobacco leaves transformed with HSA-KDEL (A) and HSA-APO (B) M: prestained protein marker.
Due to unavailability of anti HSA antibody at that point of the project, two different detection
antibodies (anti-cmyc and anti-KDEL) were selected to confirm the accumulation by
immunoblot. Considering the reduced sensitivity of the anti-KDEL detection antibody
immunoblot analysis demonstrated that higher rHSA levels were obtained when the protein
accumulated in the ER.
III.3.2.2 Alternative N. tabacum cultivars
In addition to N. tabacum cv. Petite Havana SR1, eight additional tobacco varieties were
evaluated in their performance of expressing rHSA in tobacco leaves. These varieties include
Gead Korso, Barley Junifer, Adonis Schwester, Barley Saturn, Virginia, Badische
Geudentheimer, Maryland Mammoth and Nicotine free tobacco. For comparing transient
expression, the HSA-APO construct (III.2.3.2) was chosen that allows secretion of
recombinant HSA into the apoplast. Accumulation of rHSA in tobacco leaves was analysed
by immunoblot and ELISA 72 hours after vacuum infiltration. Immunoblot analysis (data not
shown) revealed a distinct band of approximately 66 kDa, corresponding to the molecular
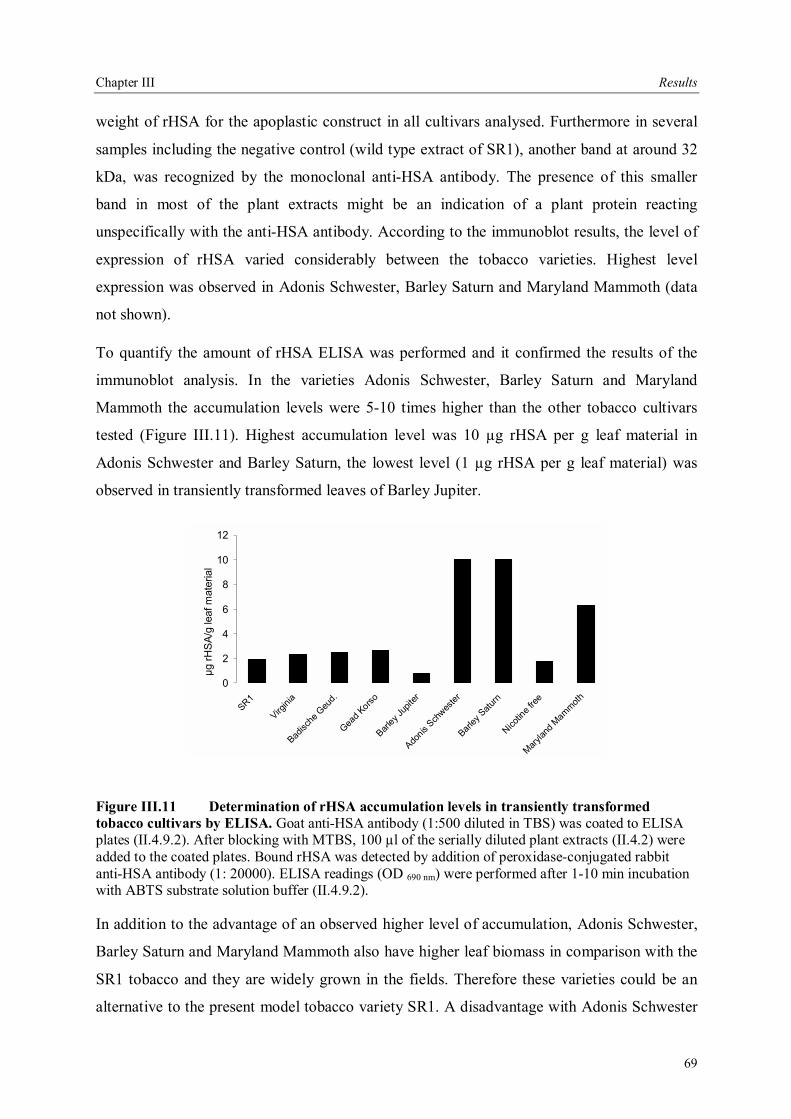
Chapter III Results
69
weight of rHSA for the apoplastic construct in all cultivars analysed. Furthermore in several
samples including the negative control (wild type extract of SR1), another band at around 32
kDa, was recognized by the monoclonal anti-HSA antibody. The presence of this smaller
band in most of the plant extracts might be an indication of a plant protein reacting
unspecifically with the anti-HSA antibody. According to the immunoblot results, the level of
expression of rHSA varied considerably between the tobacco varieties. Highest level
expression was observed in Adonis Schwester, Barley Saturn and Maryland Mammoth (data
not shown).
To quantify the amount of rHSA ELISA was performed and it confirmed the results of the
immunoblot analysis. In the varieties Adonis Schwester, Barley Saturn and Maryland
Mammoth the accumulation levels were 5-10 times higher than the other tobacco cultivars
tested (Figure III.11). Highest accumulation level was 10 µg rHSA per g leaf material in
Adonis Schwester and Barley Saturn, the lowest level (1 µg rHSA per g leaf material) was
observed in transiently transformed leaves of Barley Jupiter.
0
2
4
6
8
10
12
SR1
Virgini
a
Badisc
he G
eud.
Gead K
orso
Barley
Jupit
er
Adonis
Sch
wester
Barley
Saturn
Nicotin
e free
Marylan
d Mam
moth
µg rH
SA
/g le
af m
ater
ial
Figure III.11 Determination of rHSA accumulation levels in transiently transformed tobacco cultivars by ELISA. Goat anti-HSA antibody (1:500 diluted in TBS) was coated to ELISA plates (II.4.9.2). After blocking with MTBS, 100 µl of the serially diluted plant extracts (II.4.2) were added to the coated plates. Bound rHSA was detected by addition of peroxidase-conjugated rabbit anti-HSA antibody (1: 20000). ELISA readings (OD 690 nm) were performed after 1-10 min incubation with ABTS substrate solution buffer (II.4.9.2).
In addition to the advantage of an observed higher level of accumulation, Adonis Schwester,
Barley Saturn and Maryland Mammoth also have higher leaf biomass in comparison with the
SR1 tobacco and they are widely grown in the fields. Therefore these varieties could be an
alternative to the present model tobacco variety SR1. A disadvantage with Adonis Schwester
Chapter III Results
70
and Barley Saturn varieties is the unavailability of seeds from the adult plants for the new
generation.
Table III.1 Production levels of rHSA in plants. HSA-APO; plant expression construct carrying double enhanced 35S promoter from
CaMV(CaMV35SS), 5 untranslated region of chalcon synthase (CHS) and plant codon optimized leader peptide derived from murine light chain of TMV-specific rAb24 (LPL*) at 5 end and cmyc and his6 epitopes (cmyc/his6) for detection and purification at 3 end. HSA-KDEL; plant expression construct carrying double enhanced 35S promoter from CaMV(CaMV35SS), 5 untranslated region of chalcon synthase (CHS) and plant codon optimized leader peptide derived from murine light chain of TMV-specific rAb24 (LPL*) at 5 end and KDEL retention signal of proteins in the endoplasmic reticulum (ER) at 3 end.
plant species localisation cultivation expression system maximum accumulation
N. tabacum cv. Petite Havana SR1 apoplast greenhouse transient 2 µg/g leaf material
N. tabacum cv. Virginia apoplast greenhouse transient 2.3µg/g leaf material
N. tabacum cv. Badische Geudentheimer apoplast greenhouse transient 2.4µg/g leaf material
N. tabacum cv. Gead Korso apoplast greenhouse transient 2.6µg/g leaf material
N. tabacum cv. Barley Jupiter apoplast greenhouse transient 0.76µg/g leaf material
N. tabacum cv. Adonis Schwester apoplast greenhouse transient 10µg/g leaf material
N. tabacum cv. Barley Saturn apoplast greenhouse transient 10µg/g leaf material
N. tabacum cv. Nicotine free apoplast greenhouse transient 1.7µg/g leaf material
N. tabacum cv. Maryland Mammoth apoplast greenhouse transient 6.3µg/g leaf material
III.3.2.3 Transient expression of rHSA in zucchini and bean leaves
In order to test the feasibility of other plant varieties for the transient expression of rHSA,
expression of the HSA-APO construct was analysed in zucchini and bean leaves.
Accumulation of rHSA in leaves was analyzed by immunoblot (data not shown) and ELISA
72 hours after vacuum infiltration (Figure III.12).
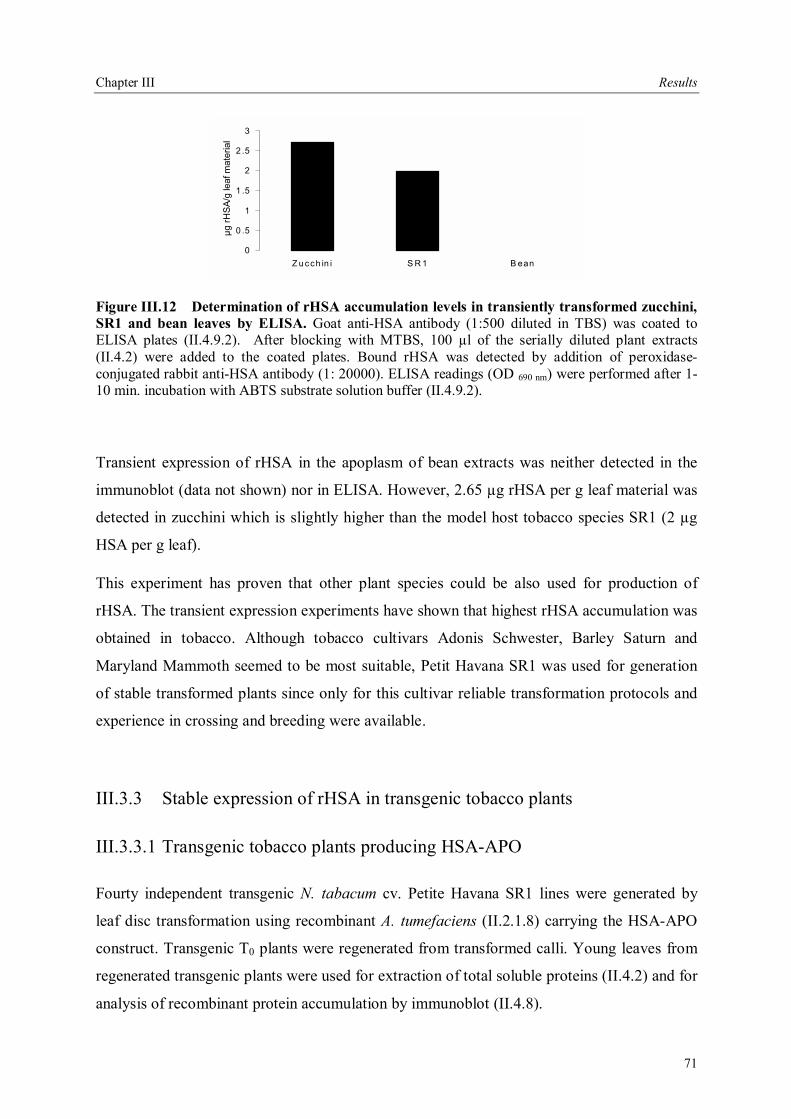
Chapter III Results
71
0
0 .5
1
1 .5
2
2 .5
3
Z u cch in i S R 1 B ean
µg rH
SA/g
leaf
mat
eria
l
Figure III.12 Determination of rHSA accumulation levels in transiently transformed zucchini, SR1 and bean leaves by ELISA. Goat anti-HSA antibody (1:500 diluted in TBS) was coated to ELISA plates (II.4.9.2). After blocking with MTBS, 100 µl of the serially diluted plant extracts (II.4.2) were added to the coated plates. Bound rHSA was detected by addition of peroxidase-conjugated rabbit anti-HSA antibody (1: 20000). ELISA readings (OD 690 nm) were performed after 1-10 min. incubation with ABTS substrate solution buffer (II.4.9.2).
Transient expression of rHSA in the apoplasm of bean extracts was neither detected in the
immunoblot (data not shown) nor in ELISA. However, 2.65 µg rHSA per g leaf material was
detected in zucchini which is slightly higher than the model host tobacco species SR1 (2 µg
HSA per g leaf).
This experiment has proven that other plant species could be also used for production of
rHSA. The transient expression experiments have shown that highest rHSA accumulation was
obtained in tobacco. Although tobacco cultivars Adonis Schwester, Barley Saturn and
Maryland Mammoth seemed to be most suitable, Petit Havana SR1 was used for generation
of stable transformed plants since only for this cultivar reliable transformation protocols and
experience in crossing and breeding were available.
III.3.3 Stable expression of rHSA in transgenic tobacco plants
III.3.3.1 Transgenic tobacco plants producing HSA-APO
Fourty independent transgenic N. tabacum cv. Petite Havana SR1 lines were generated by
leaf disc transformation using recombinant A. tumefaciens (II.2.1.8) carrying the HSA-APO
construct. Transgenic T0 plants were regenerated from transformed calli. Young leaves from
regenerated transgenic plants were used for extraction of total soluble proteins (II.4.2) and for
analysis of recombinant protein accumulation by immunoblot (II.4.8).
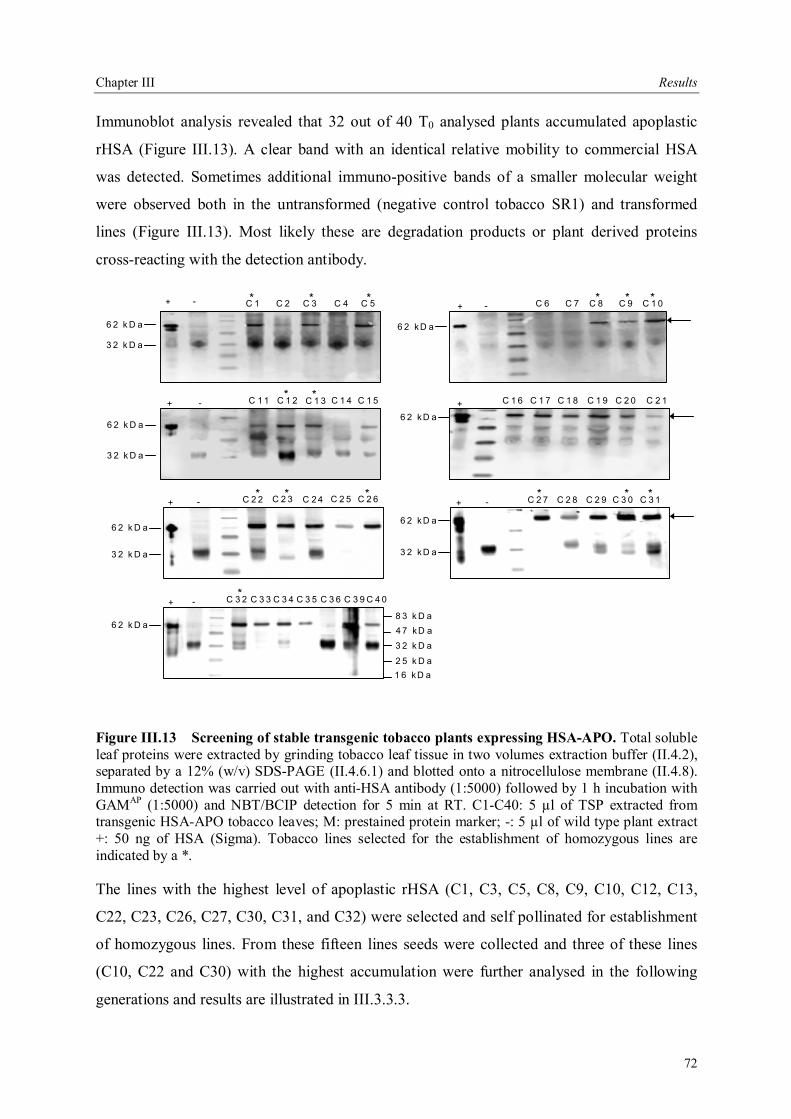
Chapter III Results
72
Immunoblot analysis revealed that 32 out of 40 T0 analysed plants accumulated apoplastic
rHSA (Figure III.13). A clear band with an identical relative mobility to commercial HSA
was detected. Sometimes additional immuno-positive bands of a smaller molecular weight
were observed both in the untransformed (negative control tobacco SR1) and transformed
lines (Figure III.13). Most likely these are degradation products or plant derived proteins
cross-reacting with the detection antibody.
C 1 C 2 C 3 C 4 C 5+ - C 6 C 7 C 8 C 9 C 1 0
+ - C 1 1 C 1 2 C 1 3 C 1 4 C 1 5 C 1 7 C 1 8 C 1 9 C 2 0 C 2 1C 1 6
C 2 3 C 2 4 C 2 5 C 2 6C 2 2
+
+ - C 2 8 C 2 9 C 3 0 C 3 1C 2 7+ -
C 3 3 C 3 4 C 3 5 C 3 6C 3 2+ - C 3 9 C 4 0
+ -* * * * * *
* *
* * * * * *
*
6 2 k D a
3 2 k D a
6 2 k D a
3 2 k D a
6 2 k D a
3 2 k D a
6 2 k D a
6 2 kD a
3 2 kD a
6 2 kD a
6 2 kD a
8 3 k D a4 7 kD a
3 2 k D a
2 5 k D a1 6 kD a
Figure III.13 Screening of stable transgenic tobacco plants expressing HSA-APO. Total soluble leaf proteins were extracted by grinding tobacco leaf tissue in two volumes extraction buffer (II.4.2), separated by a 12% (w/v) SDS-PAGE (II.4.6.1) and blotted onto a nitrocellulose membrane (II.4.8). Immuno detection was carried out with anti-HSA antibody (1:5000) followed by 1 h incubation with GAMAP (1:5000) and NBT/BCIP detection for 5 min at RT. C1-C40: 5 µl of TSP extracted from transgenic HSA-APO tobacco leaves; M: prestained protein marker; -: 5 µl of wild type plant extract +: 50 ng of HSA (Sigma). Tobacco lines selected for the establishment of homozygous lines are indicated by a *.
The lines with the highest level of apoplastic rHSA (C1, C3, C5, C8, C9, C10, C12, C13,
C22, C23, C26, C27, C30, C31, and C32) were selected and self pollinated for establishment
of homozygous lines. From these fifteen lines seeds were collected and three of these lines
(C10, C22 and C30) with the highest accumulation were further analysed in the following
generations and results are illustrated in III.3.3.3.
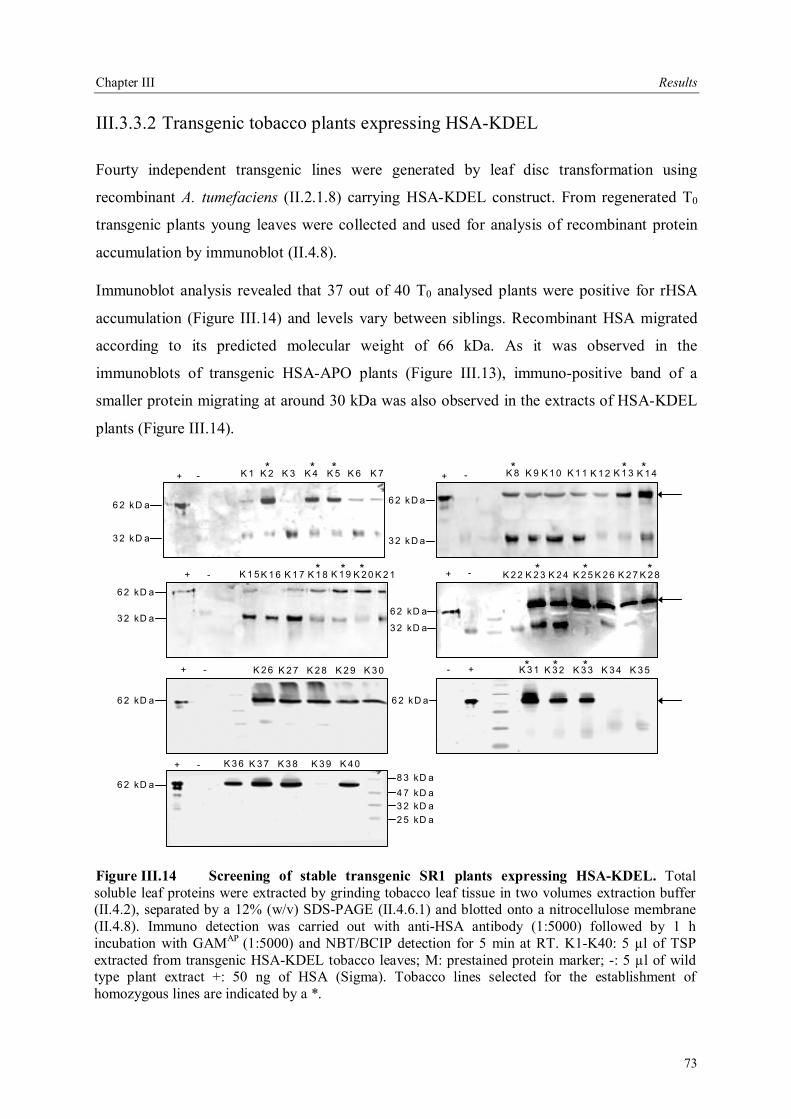
Chapter III Results
73
III.3.3.2 Transgenic tobacco plants expressing HSA-KDEL
Fourty independent transgenic lines were generated by leaf disc transformation using
recombinant A. tumefaciens (II.2.1.8) carrying HSA-KDEL construct. From regenerated T0
transgenic plants young leaves were collected and used for analysis of recombinant protein
accumulation by immunoblot (II.4.8).
Immunoblot analysis revealed that 37 out of 40 T0 analysed plants were positive for rHSA
accumulation (Figure III.14) and levels vary between siblings. Recombinant HSA migrated
according to its predicted molecular weight of 66 kDa. As it was observed in the
immunoblots of transgenic HSA-APO plants (Figure III.13), immuno-positive band of a
smaller protein migrating at around 30 kDa was also observed in the extracts of HSA-KDEL
plants (Figure III.14).
K 1 K 2 K 3 K 4 K 5 K 6 K 7+ - K 8 K 9 K 1 0 K 1 1 K 1 2 K 1 3 K 1 4+ -
K 1 5 K 1 6 K 1 7 K 1 8 K 1 9 K 2 0 K 2 1+ - K 2 8
K 2 6 K 2 7 K 2 8 K 2 9 K 3 0+ - K 3 1 K 3 2 K 3 3 K 3 4 K 3 5- +
K 3 6 K 3 7 K 3 8 K 3 9 K 4 0+ -
K 2 2 K 2 3 K 2 4 K 2 5 K 2 6 K 2 7+ -
* * * * * *
* * * * * *
* * *
6 2 kD a
3 2 kD a
6 2 kD a
3 2 kD a
6 2 kD a
3 2 kD a
6 2 kD a
3 2 kD a
6 2 kD a 6 2 kD a
6 2 kD a8 3 kD a4 7 kD a3 2 kD a2 5 kD a
Figure III.14 Screening of stable transgenic SR1 plants expressing HSA-KDEL. Total soluble leaf proteins were extracted by grinding tobacco leaf tissue in two volumes extraction buffer (II.4.2), separated by a 12% (w/v) SDS-PAGE (II.4.6.1) and blotted onto a nitrocellulose membrane (II.4.8). Immuno detection was carried out with anti-HSA antibody (1:5000) followed by 1 h incubation with GAMAP (1:5000) and NBT/BCIP detection for 5 min at RT. K1-K40: 5 µl of TSP extracted from transgenic HSA-KDEL tobacco leaves; M: prestained protein marker; -: 5 µl of wild type plant extract +: 50 ng of HSA (Sigma). Tobacco lines selected for the establishment of homozygous lines are indicated by a *.
Chapter III Results
74
The lines with the highest levels (K2, K4, K5, K8; K13, K14, K18, K19, K20, K23, K25,
K28, K31, K32 and K33) were selected and self pollinated for establishment of homozygous
lines. From these fifteen lines seeds were collected and three of these lines (K2, K31 and
K32) with the highest accumulation were analysed in the next generation and results are
illustrated in III.3.3.3.
In general, immunoblots are not as amenable as ELISA to determine the level of
accumulation of a foreign protein. However, band intensities are usually compared with
known amount of a standard protein to get a rough estimate of the level of accumulation. In
the immunoblots of HSA-APO (Figure III.13) and HSA-KDEL (Figure III.14), the intensity
of the rHSA bands was comparable. Using this rough estimation, although variation between
different siblings are observed, in general rHSA levels were higher in the HSA-KDEL
producing plants when compared to the HSA-APO plants.
III.3.3.3 Analysis of rHSA accumulation in the T1 generation
From transgenic T0 plants 15 lines for each construct (HSA-APO and HSA-KDEL) were
selfed and their seeds were collected. Transgenic T0 plants with the highest accumulation of
rHSA (C10, C22 and C30 for HSA-APO, K2, K31 and K32 for HSA-KDEL) were selected
for further analysis. Seeds of these lines were germinated in the greenhouse and, young leaves
of the T1 plants were collected. Total soluble protein (TSP) from leaves of nine plants per line
was extracted for Bradford protein determination and recombinant protein accumulation
analysis by immunoblot. Bradford total protein quantification revealed that TSP content
varied between 11.6-19.84 mg per g leaf (data not shown). Accumulation of the recombinant
protein in tobacco leaves was analysed by immunoblot using crude extracts of total soluble
leaf protein. Immunoblot experiments revealed that 7 out of 9 carrying the HSA-APO
construct and 9 out of 9 plants with integrated HSA-KDEL construct were positive (data not
shown). Recombinant HSA migrated according to its predicted molecular weight of 66 kDa.
The T1 progeny was analysed for a 3:1 Mendelian segregation ratio on kanamycin selection
plates (II.2.2.6), indicating the events of T-DNA integration at different genetic loci. Results
were tabulated as the ratio of tolerant to susceptible seedlings and tested if they segrated in a
3:1 ratio. Chi-square values are calculated according to the following formula:

Chapter III Results
75
Table III.2 Segregation analysis of the transgenic T1 lines expressing rHSA either in the ER (KDEL 2, 31, 32) or in the apoplast (APO 30, 22, 10).
Transgenic Resistant Susceptible Chi square*
HSA-APO
APO-30 55 18 0.0045
APO-22 46 16 0.0215 APO-10 36 10 0.26
HSA-KDEL KDEL-2 32 7 1.0256
KDEL-31 27 9 0 KDEL-32 73 20 1.0533
(* Values less than 3.83 indicate a good fit to a 3 resistant: 1 susceptible ratio at the P = 0.05 level of probability with degree of freedom = 1.) Number of resistant and susceptible plants is tabulated and Chi-square values are calculated.
Chi-square values of less than 3.84 fit a 3:1 segregation ratio and indicate a single dominant
Mendelian locus with 95% of confidence. Mendelian segregation analyses indicate that more
likely single integration of the transgenes (HSA-APO or HSA-KDEL) into the chromosomal
DNA of all analysed transgenic line has taken place.
III.3.3.4 Analysis of rHSA accumulation in homozygous T2 lines
To obtain individuals homozygous lines, seeds from T1 plants were collected and from five
positive T1 lines, at least 15 T2 plants were grown until young leaves for analysis were
available. All seeds from that parent for which no recessive segregants were seen should be
homozygous, and it should be possible to propagate this line indefinitely with no loss of the
transgene due to segregation. Seeds from transgenic lines were collected, grown in
greenhouse and leaf extracts were analysed until the homozygous generation could be
obtained. Total soluble protein was extracted from leaves of homozygous T2 lines producing
HSA-APO and HSA-KDEL and used for immunoblot analysis. It revealed that rHSA
migrated according to its predicted molecular weight of 66 kDa. As in the transiently
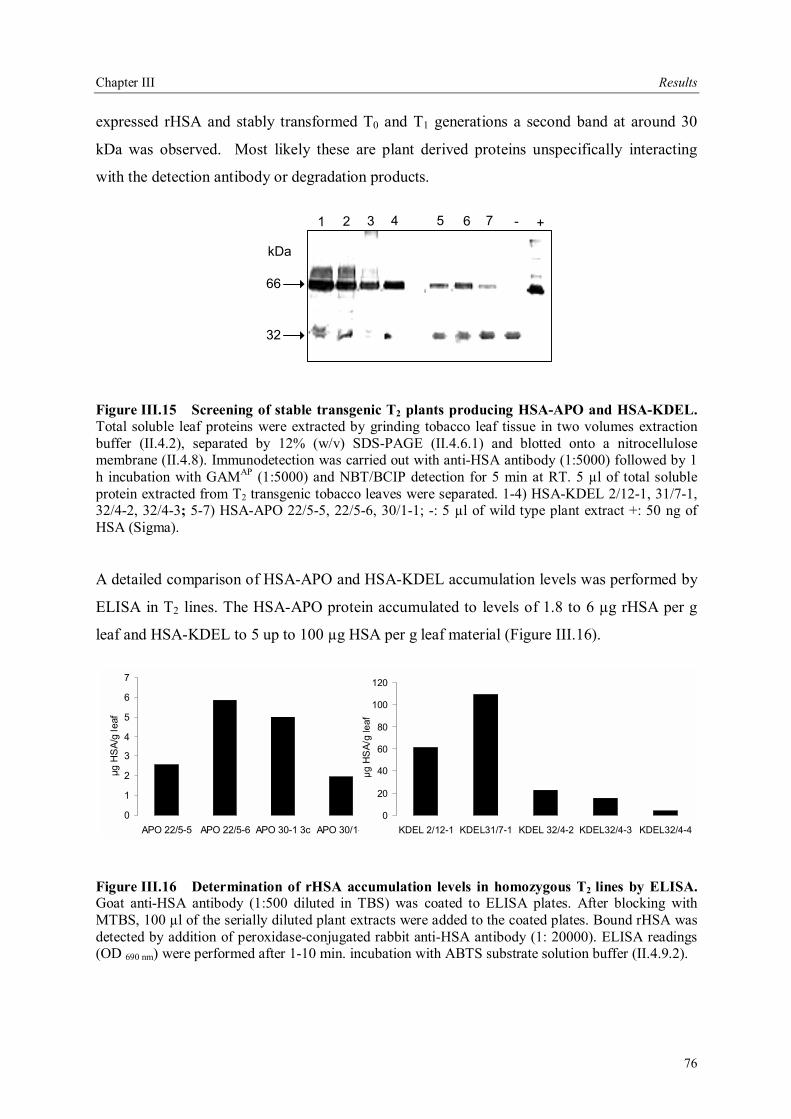
Chapter III Results
76
expressed rHSA and stably transformed T0 and T1 generations a second band at around 30
kDa was observed. Most likely these are plant derived proteins unspecifically interacting
with the detection antibody or degradation products.
1 2 3 4 5 6 - +7
66
32
kDa
Figure III.15 Screening of stable transgenic T2 plants producing HSA-APO and HSA-KDEL. Total soluble leaf proteins were extracted by grinding tobacco leaf tissue in two volumes extraction buffer (II.4.2), separated by 12% (w/v) SDS-PAGE (II.4.6.1) and blotted onto a nitrocellulose membrane (II.4.8). Immunodetection was carried out with anti-HSA antibody (1:5000) followed by 1 h incubation with GAMAP (1:5000) and NBT/BCIP detection for 5 min at RT. 5 µl of total soluble protein extracted from T2 transgenic tobacco leaves were separated. 1-4) HSA-KDEL 2/12-1, 31/7-1, 32/4-2, 32/4-3; 5-7) HSA-APO 22/5-5, 22/5-6, 30/1-1; -: 5 µl of wild type plant extract +: 50 ng of HSA (Sigma).
A detailed comparison of HSA-APO and HSA-KDEL accumulation levels was performed by
ELISA in T2 lines. The HSA-APO protein accumulated to levels of 1.8 to 6 µg rHSA per g
leaf and HSA-KDEL to 5 up to 100 µg HSA per g leaf material (Figure III.16).
0
1
2
3
4
5
6
7
APO 22/5-5 APO 22/5-6 APO 30-1 3c APO 30/1-1
µg H
SA/
g le
af
0
20
40
60
80
100
120
KDEL 2/12-1 KDEL31/7-1 KDEL 32/4-2 KDEL32/4-3 KDEL32/4-4
µg H
SA/
g le
af
Figure III.16 Determination of rHSA accumulation levels in homozygous T2 lines by ELISA. Goat anti-HSA antibody (1:500 diluted in TBS) was coated to ELISA plates. After blocking with MTBS, 100 µl of the serially diluted plant extracts were added to the coated plates. Bound rHSA was detected by addition of peroxidase-conjugated rabbit anti-HSA antibody (1: 20000). ELISA readings (OD 690 nm) were performed after 1-10 min. incubation with ABTS substrate solution buffer (II.4.9.2).
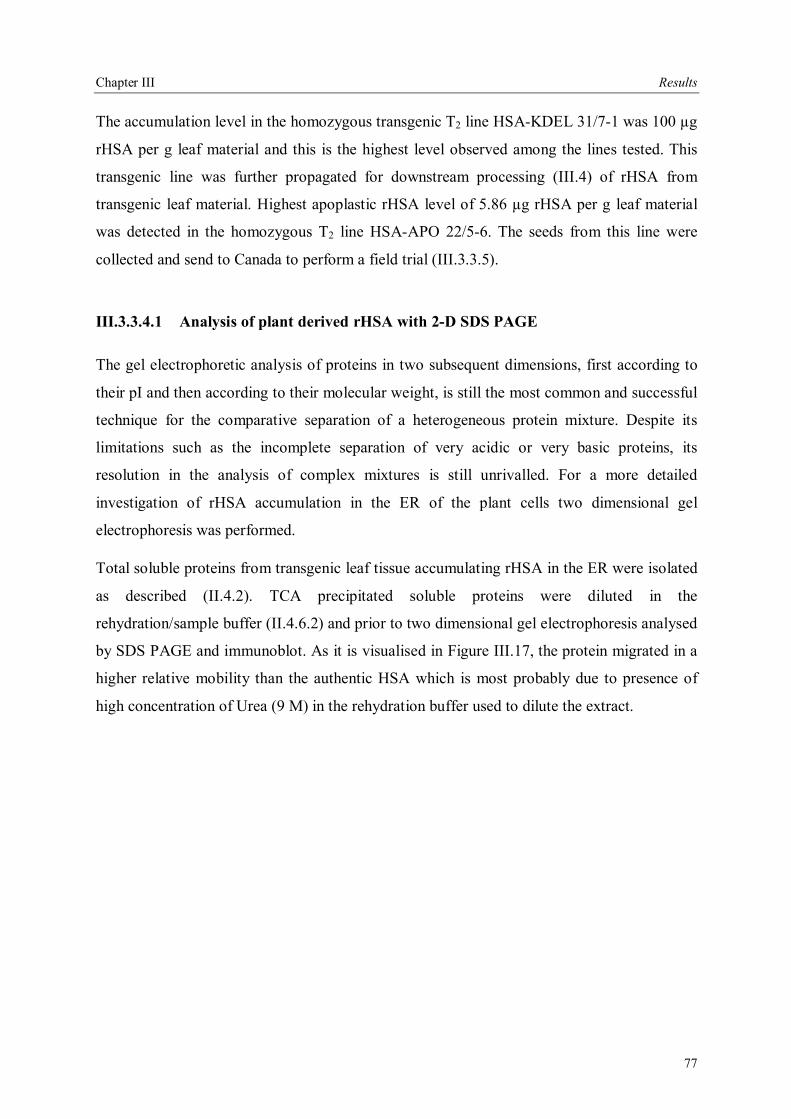
Chapter III Results
77
The accumulation level in the homozygous transgenic T2 line HSA-KDEL 31/7-1 was 100 µg
rHSA per g leaf material and this is the highest level observed among the lines tested. This
transgenic line was further propagated for downstream processing (III.4) of rHSA from
transgenic leaf material. Highest apoplastic rHSA level of 5.86 µg rHSA per g leaf material
was detected in the homozygous T2 line HSA-APO 22/5-6. The seeds from this line were
collected and send to Canada to perform a field trial (III.3.3.5).
III.3.3.4.1 Analysis of plant derived rHSA with 2-D SDS PAGE
The gel electrophoretic analysis of proteins in two subsequent dimensions, first according to
their pI and then according to their molecular weight, is still the most common and successful
technique for the comparative separation of a heterogeneous protein mixture. Despite its
limitations such as the incomplete separation of very acidic or very basic proteins, its
resolution in the analysis of complex mixtures is still unrivalled. For a more detailed
investigation of rHSA accumulation in the ER of the plant cells two dimensional gel
electrophoresis was performed.
Total soluble proteins from transgenic leaf tissue accumulating rHSA in the ER were isolated
as described (II.4.2). TCA precipitated soluble proteins were diluted in the
rehydration/sample buffer (II.4.6.2) and prior to two dimensional gel electrophoresis analysed
by SDS PAGE and immunoblot. As it is visualised in Figure III.17, the protein migrated in a
higher relative mobility than the authentic HSA which is most probably due to presence of
high concentration of Urea (9 M) in the rehydration buffer used to dilute the extract.
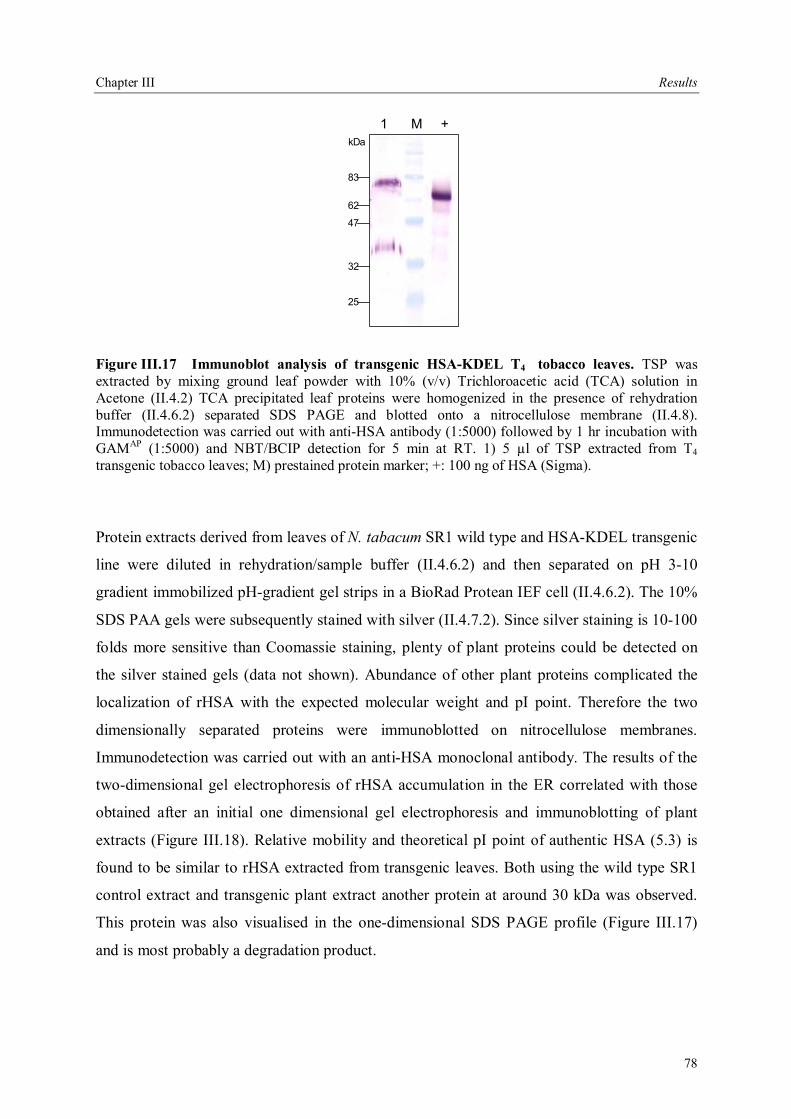
Chapter III Results
78
1 M +kDa
83
62
47
32
25
Figure III.17 Immunoblot analysis of transgenic HSA-KDEL T4 tobacco leaves. TSP was extracted by mixing ground leaf powder with 10% (v/v) Trichloroacetic acid (TCA) solution in Acetone (II.4.2) TCA precipitated leaf proteins were homogenized in the presence of rehydration buffer (II.4.6.2) separated SDS PAGE and blotted onto a nitrocellulose membrane (II.4.8). Immunodetection was carried out with anti-HSA antibody (1:5000) followed by 1 hr incubation with GAMAP (1:5000) and NBT/BCIP detection for 5 min at RT. 1) 5 µl of TSP extracted from T4 transgenic tobacco leaves; M) prestained protein marker; +: 100 ng of HSA (Sigma).
Protein extracts derived from leaves of N. tabacum SR1 wild type and HSA-KDEL transgenic
line were diluted in rehydration/sample buffer (II.4.6.2) and then separated on pH 3-10
gradient immobilized pH-gradient gel strips in a BioRad Protean IEF cell (II.4.6.2). The 10%
SDS PAA gels were subsequently stained with silver (II.4.7.2). Since silver staining is 10-100
folds more sensitive than Coomassie staining, plenty of plant proteins could be detected on
the silver stained gels (data not shown). Abundance of other plant proteins complicated the
localization of rHSA with the expected molecular weight and pI point. Therefore the two
dimensionally separated proteins were immunoblotted on nitrocellulose membranes.
Immunodetection was carried out with an anti-HSA monoclonal antibody. The results of the
two-dimensional gel electrophoresis of rHSA accumulation in the ER correlated with those
obtained after an initial one dimensional gel electrophoresis and immunoblotting of plant
extracts (Figure III.18). Relative mobility and theoretical pI point of authentic HSA (5.3) is
found to be similar to rHSA extracted from transgenic leaves. Both using the wild type SR1
control extract and transgenic plant extract another protein at around 30 kDa was observed.
This protein was also visualised in the one-dimensional SDS PAGE profile (Figure III.17)
and is most probably a degradation product.
Chapter III Results
79
83
62
47
32
25
16
kDa
3 10 3 10pI
M
A B
Figure III.18 Comparative two dimensional gel electrophoresis and Immunoblot analysis of wild type (A) and transgenic (B) T4 stable tobacco expressing rHSA in ER. TSP was extracted by mixing ground leaf powder with 10% (v/v) Trichloroacetic acid (TCA) solution in Acetone (II.4.2) TCA precipitated leaf proteins were homogenized in the presence of rehydration buffer separated by 2-D SDS PAGE (II.4.6.2) and blotted onto a nitrocellulose membrane (II.4.8). Immunodetection was carried out with anti-HSA antibody (1:5000) followed by 1 hr incubation with GAMAP (1:5000) and NBT/BCIP detection for 5 min at RT. 5 µl of TSP extracted from the leaves of A) Wild type SR1; B) HSA-KDEL; M) prestained protein marker.
III.3.3.5 Field trials of transgenic tobacco plants producing rHSA
Greenhouse observations of the transgenic plants at different cultivation stages indicated that
the general phenotypic characteristics of the plants were similar to wild type plants. Rarely
negative phenotypic changes are observed in some agronomic characteristics of plants upon
transformation and regeneration. These changes are often caused by the regeneration
procedure and tend to create reduced fitness (Dr. Jim Brandle, personal communication).
Such possible changes in fitness can be determined in transgenic plants after greenhouse
observations and field testing has taken place. Furthermore, amount of rHSA obtained in the
greenhouse plants and field grown plants could be compared to get an idea for the
performance of the transgenic plants under field conditions.
The seeds from the T2 line HSA-APO-22/5-6 were used for the field trial. The site was
located in Canada and field tests were performed by Dr. Jim Brandle (Agriculture and
AgriFood Canada) (II.3.3). Trial area was approximately 15 m2. Around 30 days following
transplantation of greenhouse seedlings, the plots were harvested and the plant material
bulked for evaluation of dry matter yield and soluble protein concentration. The accumulation
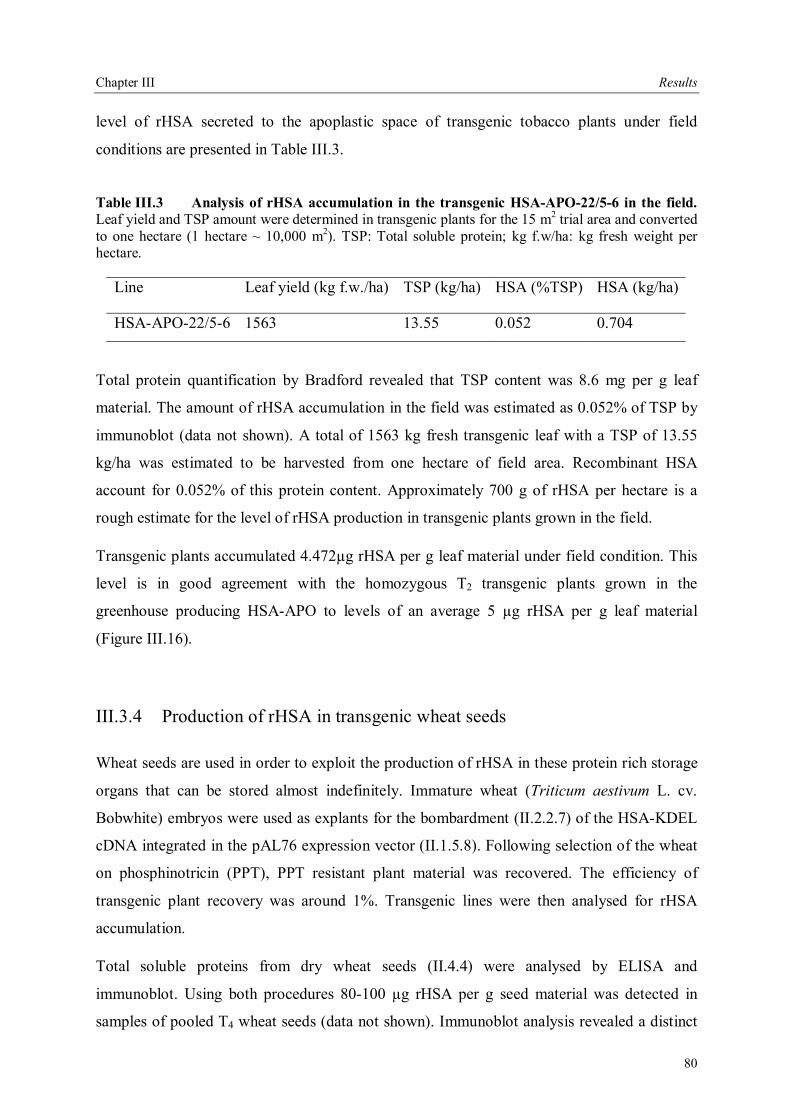
Chapter III Results
80
level of rHSA secreted to the apoplastic space of transgenic tobacco plants under field
conditions are presented in Table III.3.
Table III.3 Analysis of rHSA accumulation in the transgenic HSA-APO-22/5-6 in the field. Leaf yield and TSP amount were determined in transgenic plants for the 15 m2 trial area and converted to one hectare (1 hectare ~ 10,000 m2). TSP: Total soluble protein; kg f.w/ha: kg fresh weight per hectare.
Line Leaf yield (kg f.w./ha) TSP (kg/ha) HSA (%TSP) HSA (kg/ha)
HSA-APO-22/5-6 1563 13.55 0.052 0.704
Total protein quantification by Bradford revealed that TSP content was 8.6 mg per g leaf
material. The amount of rHSA accumulation in the field was estimated as 0.052% of TSP by
immunoblot (data not shown). A total of 1563 kg fresh transgenic leaf with a TSP of 13.55
kg/ha was estimated to be harvested from one hectare of field area. Recombinant HSA
account for 0.052% of this protein content. Approximately 700 g of rHSA per hectare is a
rough estimate for the level of rHSA production in transgenic plants grown in the field.
Transgenic plants accumulated 4.472µg rHSA per g leaf material under field condition. This
level is in good agreement with the homozygous T2 transgenic plants grown in the
greenhouse producing HSA-APO to levels of an average 5 µg rHSA per g leaf material
(Figure III.16).
III.3.4 Production of rHSA in transgenic wheat seeds
Wheat seeds are used in order to exploit the production of rHSA in these protein rich storage
organs that can be stored almost indefinitely. Immature wheat (Triticum aestivum L. cv.
Bobwhite) embryos were used as explants for the bombardment (II.2.2.7) of the HSA-KDEL
cDNA integrated in the pAL76 expression vector (II.1.5.8). Following selection of the wheat
on phosphinotricin (PPT), PPT resistant plant material was recovered. The efficiency of
transgenic plant recovery was around 1%. Transgenic lines were then analysed for rHSA
accumulation.
Total soluble proteins from dry wheat seeds (II.4.4) were analysed by ELISA and
immunoblot. Using both procedures 80-100 µg rHSA per g seed material was detected in
samples of pooled T4 wheat seeds (data not shown). Immunoblot analysis revealed a distinct
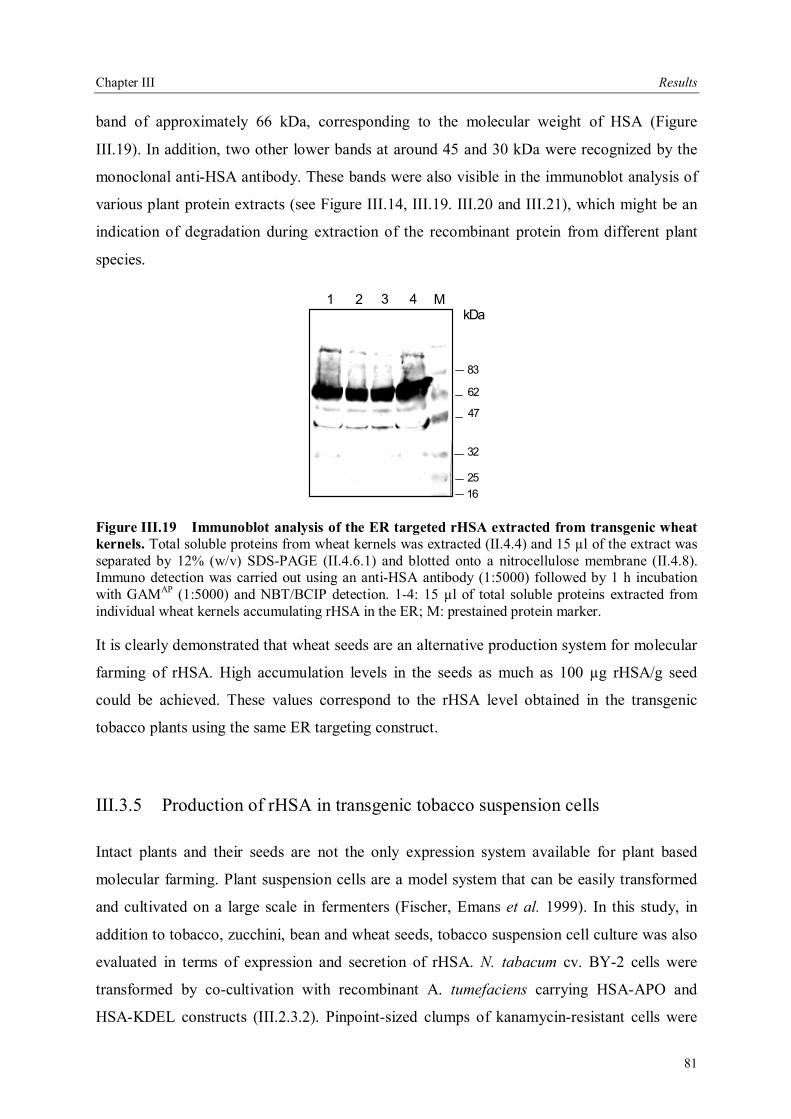
Chapter III Results
81
band of approximately 66 kDa, corresponding to the molecular weight of HSA (Figure
III.19). In addition, two other lower bands at around 45 and 30 kDa were recognized by the
monoclonal anti-HSA antibody. These bands were also visible in the immunoblot analysis of
various plant protein extracts (see Figure III.14, III.19. III.20 and III.21), which might be an
indication of degradation during extraction of the recombinant protein from different plant
species.
1 2 3 4 M
83
62
47
32
2516
kDa
Figure III.19 Immunoblot analysis of the ER targeted rHSA extracted from transgenic wheat kernels. Total soluble proteins from wheat kernels was extracted (II.4.4) and 15 µl of the extract was separated by 12% (w/v) SDS-PAGE (II.4.6.1) and blotted onto a nitrocellulose membrane (II.4.8). Immuno detection was carried out using an anti-HSA antibody (1:5000) followed by 1 h incubation with GAMAP (1:5000) and NBT/BCIP detection. 1-4: 15 µl of total soluble proteins extracted from individual wheat kernels accumulating rHSA in the ER; M: prestained protein marker.
It is clearly demonstrated that wheat seeds are an alternative production system for molecular
farming of rHSA. High accumulation levels in the seeds as much as 100 µg rHSA/g seed
could be achieved. These values correspond to the rHSA level obtained in the transgenic
tobacco plants using the same ER targeting construct.
III.3.5 Production of rHSA in transgenic tobacco suspension cells
Intact plants and their seeds are not the only expression system available for plant based
molecular farming. Plant suspension cells are a model system that can be easily transformed
and cultivated on a large scale in fermenters (Fischer, Emans et al. 1999). In this study, in
addition to tobacco, zucchini, bean and wheat seeds, tobacco suspension cell culture was also
evaluated in terms of expression and secretion of rHSA. N. tabacum cv. BY-2 cells were
transformed by co-cultivation with recombinant A. tumefaciens carrying HSA-APO and
HSA-KDEL constructs (III.2.3.2). Pinpoint-sized clumps of kanamycin-resistant cells were
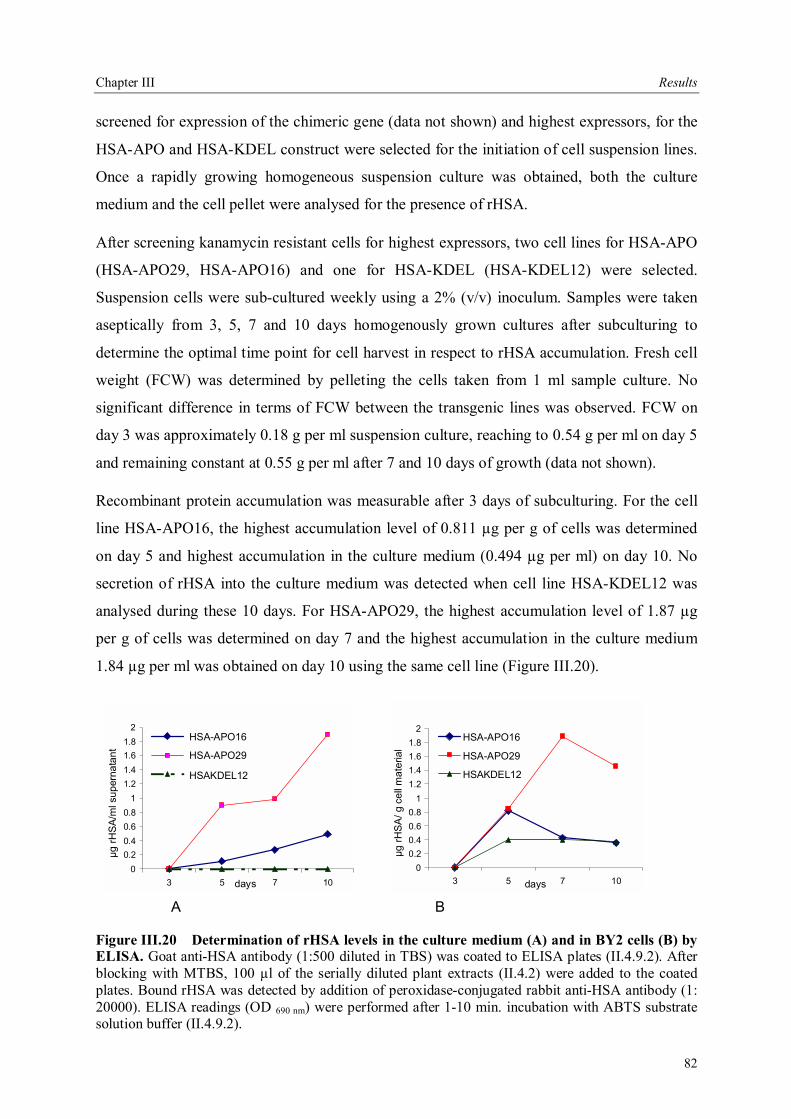
Chapter III Results
82
screened for expression of the chimeric gene (data not shown) and highest expressors, for the
HSA-APO and HSA-KDEL construct were selected for the initiation of cell suspension lines.
Once a rapidly growing homogeneous suspension culture was obtained, both the culture
medium and the cell pellet were analysed for the presence of rHSA.
After screening kanamycin resistant cells for highest expressors, two cell lines for HSA-APO
(HSA-APO29, HSA-APO16) and one for HSA-KDEL (HSA-KDEL12) were selected.
Suspension cells were sub-cultured weekly using a 2% (v/v) inoculum. Samples were taken
aseptically from 3, 5, 7 and 10 days homogenously grown cultures after subculturing to
determine the optimal time point for cell harvest in respect to rHSA accumulation. Fresh cell
weight (FCW) was determined by pelleting the cells taken from 1 ml sample culture. No
significant difference in terms of FCW between the transgenic lines was observed. FCW on
day 3 was approximately 0.18 g per ml suspension culture, reaching to 0.54 g per ml on day 5
and remaining constant at 0.55 g per ml after 7 and 10 days of growth (data not shown).
Recombinant protein accumulation was measurable after 3 days of subculturing. For the cell
line HSA-APO16, the highest accumulation level of 0.811 µg per g of cells was determined
on day 5 and highest accumulation in the culture medium (0.494 µg per ml) on day 10. No
secretion of rHSA into the culture medium was detected when cell line HSA-KDEL12 was
analysed during these 10 days. For HSA-APO29, the highest accumulation level of 1.87 µg
per g of cells was determined on day 7 and the highest accumulation in the culture medium
1.84 µg per ml was obtained on day 10 using the same cell line (Figure III.20).
00.20.40.60.8
11.21.41.61.8
2
3 5 7 10days
µg rH
SA/m
l sup
erna
tant
HSA-APO16
HSA-APO29
HSAKDEL12
00.20.40.60.8
11.21.41.61.8
2
3 5 7 10days
µg rH
SA/ g
cel
l mat
eria
l
HSA-APO16
HSA-APO29
HSAKDEL12
A B
Figure III.20 Determination of rHSA levels in the culture medium (A) and in BY2 cells (B) by ELISA. Goat anti-HSA antibody (1:500 diluted in TBS) was coated to ELISA plates (II.4.9.2). After blocking with MTBS, 100 µl of the serially diluted plant extracts (II.4.2) were added to the coated plates. Bound rHSA was detected by addition of peroxidase-conjugated rabbit anti-HSA antibody (1: 20000). ELISA readings (OD 690 nm) were performed after 1-10 min. incubation with ABTS substrate solution buffer (II.4.9.2).
Chapter III Results
83
Expression of rHSA in the transgenic BY2 cells and secretion to the supernatant were also
compared at different stages of growth in the suspension cells by immunoblot. In addition to
the expected size of rHSA with variable accumulation levels of HSA-APO and HSA-KDEL
at 3, 5, 7 and 10 days, degradation bands at around 30 kDa were also observed (data not
shown). As shown in ELISA (Figure III.20), and immunoblot highest levels of rHSA
accumulation and secretion was observed using HSA-APO29 cell line. Therefore this line
was chosen for the further experiments with the transgenic BY2 suspension cells.
III.3.5.1 Analysis of rHSA secreted to the culture medium
HSA-APO29 BY2 cell suspension culture was grown for 7 days. After separating the cells
from the culture medium the amount of secreted rHSA was determined to be 1-1.5 µg per ml
culture supernatant. Bradford analysis of the total soluble proteins in the supernatant revealed
the amount in the medium to be 0.3-0.5 mg per ml. Therefore the amount of recombinant
HSA secreted to the medium is in the range of 3-5 µg per mg total secreted protein, which is
at least 15 times more than the secretion level obtained by Sijmons et al. (1990).
III.3.5.2 Improving rHSA stability in the culture medium
Due to the occurrence of unfavourable environmental conditions, the loss of proteins due to
product instability during plant cell culture and subsequent purification significantly
influences product yields. Protein stability following secretion can be improved with the
addition of appropriate chemical agents (or stabilizers) to the growth media or storage
solution (James and Lee 2001). By using this strategy, protein yields can be increased
significantly with the addition of inexpensive chemical agents. Polyvinyl pyrrolidone (PVP)
(Magnuson et al. 1996), DMSO (Wahl, An and Lee 1995), gelatine (Lee et al. 2002) have
been used to protect extracellular proteins in transgenic plant cell and organ cultures.
In order to test the effect of additional compounds to transgenic BY2 cultures, HSA-APO29
suspension cell culture was cocultivated starting from the first day of subculture in the
presence of 10 mM glutamine or PVP 40.000 (0.8 g/L). A third batch of culture was initiated
to investigate the effect of increasing the sucrose concentration in the MS medium from 3%
to 5%. Use of glutamine or increasing the sucrose content in the suspension culture media
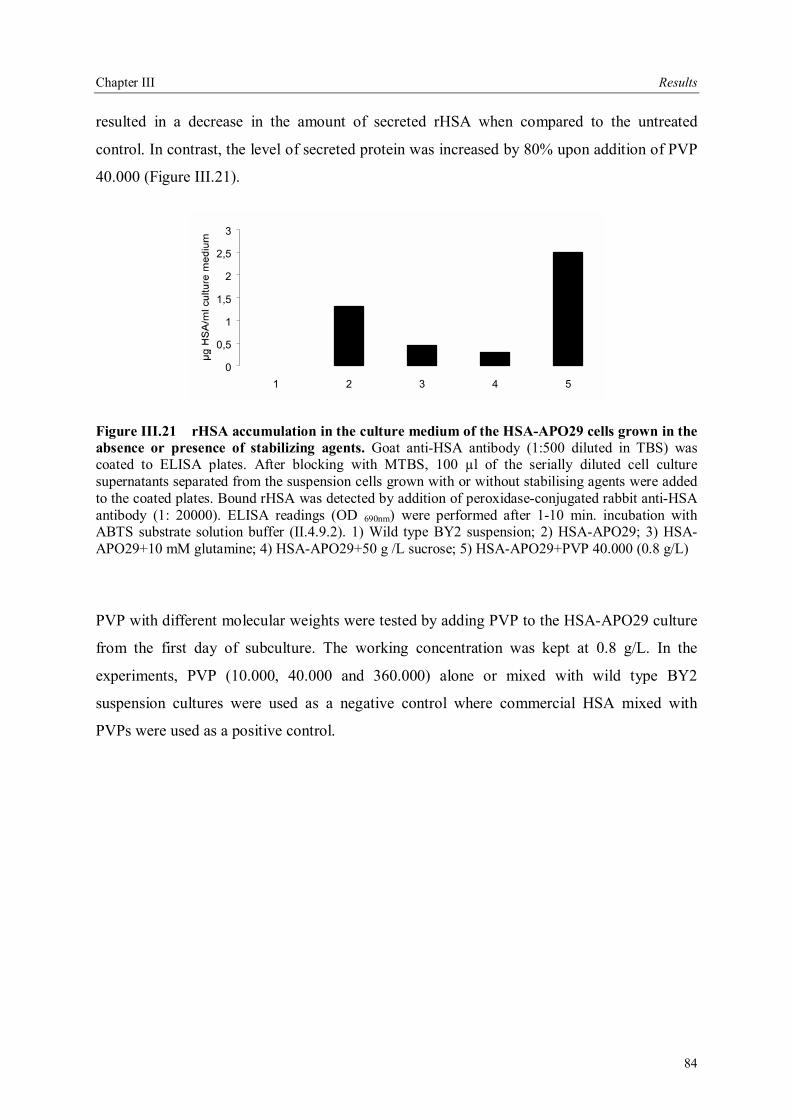
Chapter III Results
84
resulted in a decrease in the amount of secreted rHSA when compared to the untreated
control. In contrast, the level of secreted protein was increased by 80% upon addition of PVP
40.000 (Figure III.21).
0
0,5
1
1,5
2
2,5
3
1 2 3 4 5
Figure III.21 rHSA accumulation in the culture medium of the HSA-APO29 cells grown in the absence or presence of stabilizing agents. Goat anti-HSA antibody (1:500 diluted in TBS) was coated to ELISA plates. After blocking with MTBS, 100 µl of the serially diluted cell culture supernatants separated from the suspension cells grown with or without stabilising agents were added to the coated plates. Bound rHSA was detected by addition of peroxidase-conjugated rabbit anti-HSA antibody (1: 20000). ELISA readings (OD 690nm) were performed after 1-10 min. incubation with ABTS substrate solution buffer (II.4.9.2). 1) Wild type BY2 suspension; 2) HSA-APO29; 3) HSA-APO29+10 mM glutamine; 4) HSA-APO29+50 g /L sucrose; 5) HSA-APO29+PVP 40.000 (0.8 g/L)
PVP with different molecular weights were tested by adding PVP to the HSA-APO29 culture
from the first day of subculture. The working concentration was kept at 0.8 g/L. In the
experiments, PVP (10.000, 40.000 and 360.000) alone or mixed with wild type BY2
suspension cultures were used as a negative control where commercial HSA mixed with
PVPs were used as a positive control.

Chapter III Results
85
0
0.5
1
1.5
2
2.5
3
3.5
4
1 2 3 4 5
µg H
SA
/ml c
ultu
re m
ediu
m
Figure III.22 rHSA accumulation in the culture medium of the HSA-APO29 cells grown in the absence or presence of PVP with varying molecular weight. Goat anti-HSA antibody (1:500 diluted in TBS) was coated to ELISA plates. After blocking with MTBS, 100 µl of the serially diluted cell culture supernatants separated from the suspension cells grown with or without PVP were added to the coated plates. Bound rHSA was detected by addition of peroxidase-conjugated rabbit anti-HSA antibody (1: 20000). ELISA readings (OD 690nm) were performed after 1-10 min. incubation with ABTS substrate solution buffer (II.4.9.2). 1) Wild type BY2 suspension; 2) HSA-APO29; 3) HSA-APO29+PVP 10.000; 4) HSA-APO29+PVP 40.000; 5) HSA-APO29+PVP 360.000.
The presence of PVP increased the level of accumulated rHSA in the culture medium at least
2-fold from 1.5 µg HSA per ml to 3.0 µg HSA per ml independent of the molecular weight of
PVP tested. The highest level of secretion (3.75 µg rHSA per ml culture medium) was
achieved using PVP 40.000 (Figure III.22).
The ELISA results were also confirmed by immunoblot analysis of the secreted rHSA (Figure
III.27). Although there is an increased recovery of secreted rHSA by using PVP 40.000, two
lower bands (at around 25 and 32 kDa) were recognized by the monoclonal anti-HSA
antibody as well. These smaller truncated forms of rHSA were present in the supernatant of
suspension culture cocultivated in the presence or absence of PVP. This was an indication
that additional PVP might result in enhanced recovery of the product from the suspension
culture but did not lead to an increased stability of the recombinant protein.
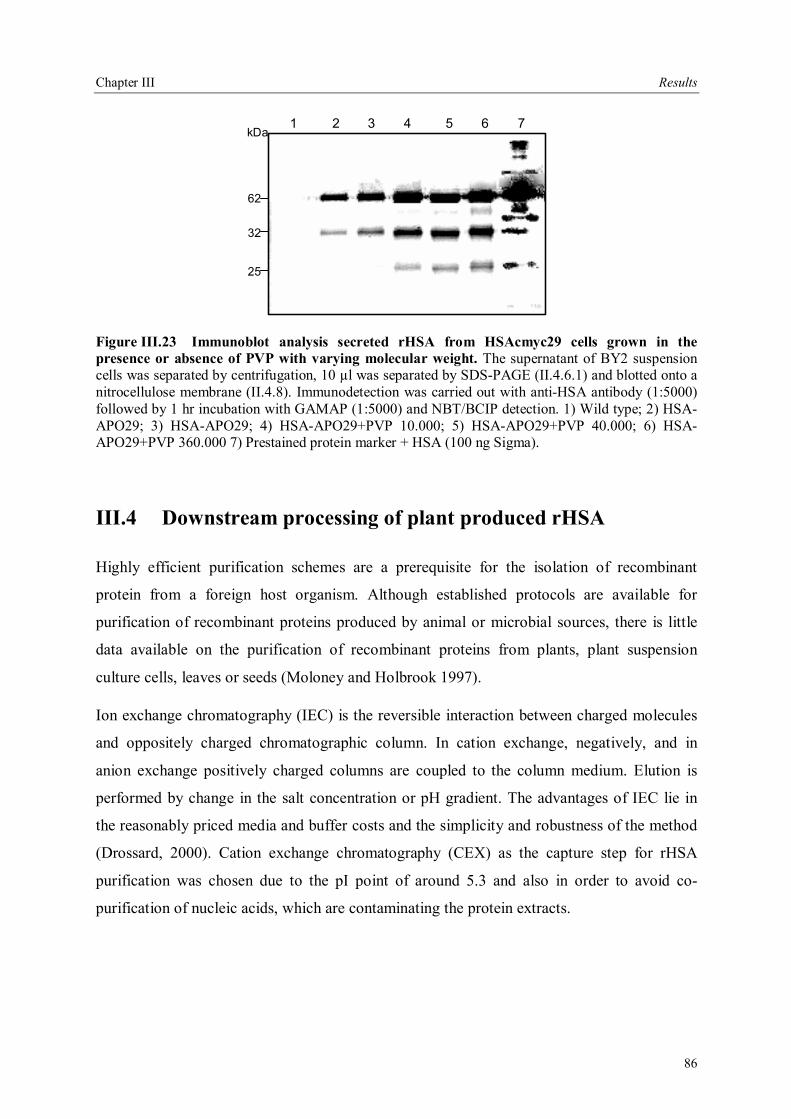
Chapter III Results
86
62
32
25
kDa1 2 3 4 5 6 7
Figure III.23 Immunoblot analysis secreted rHSA from HSAcmyc29 cells grown in the presence or absence of PVP with varying molecular weight. The supernatant of BY2 suspension cells was separated by centrifugation, 10 µl was separated by SDS-PAGE (II.4.6.1) and blotted onto a nitrocellulose membrane (II.4.8). Immunodetection was carried out with anti-HSA antibody (1:5000) followed by 1 hr incubation with GAMAP (1:5000) and NBT/BCIP detection. 1) Wild type; 2) HSA-APO29; 3) HSA-APO29; 4) HSA-APO29+PVP 10.000; 5) HSA-APO29+PVP 40.000; 6) HSA-APO29+PVP 360.000 7) Prestained protein marker + HSA (100 ng Sigma).
III.4 Downstream processing of plant produced rHSA
Highly efficient purification schemes are a prerequisite for the isolation of recombinant
protein from a foreign host organism. Although established protocols are available for
purification of recombinant proteins produced by animal or microbial sources, there is little
data available on the purification of recombinant proteins from plants, plant suspension
culture cells, leaves or seeds (Moloney and Holbrook 1997).
Ion exchange chromatography (IEC) is the reversible interaction between charged molecules
and oppositely charged chromatographic column. In cation exchange, negatively, and in
anion exchange positively charged columns are coupled to the column medium. Elution is
performed by change in the salt concentration or pH gradient. The advantages of IEC lie in
the reasonably priced media and buffer costs and the simplicity and robustness of the method
(Drossard, 2000). Cation exchange chromatography (CEX) as the capture step for rHSA
purification was chosen due to the pI point of around 5.3 and also in order to avoid co-
purification of nucleic acids, which are contaminating the protein extracts.
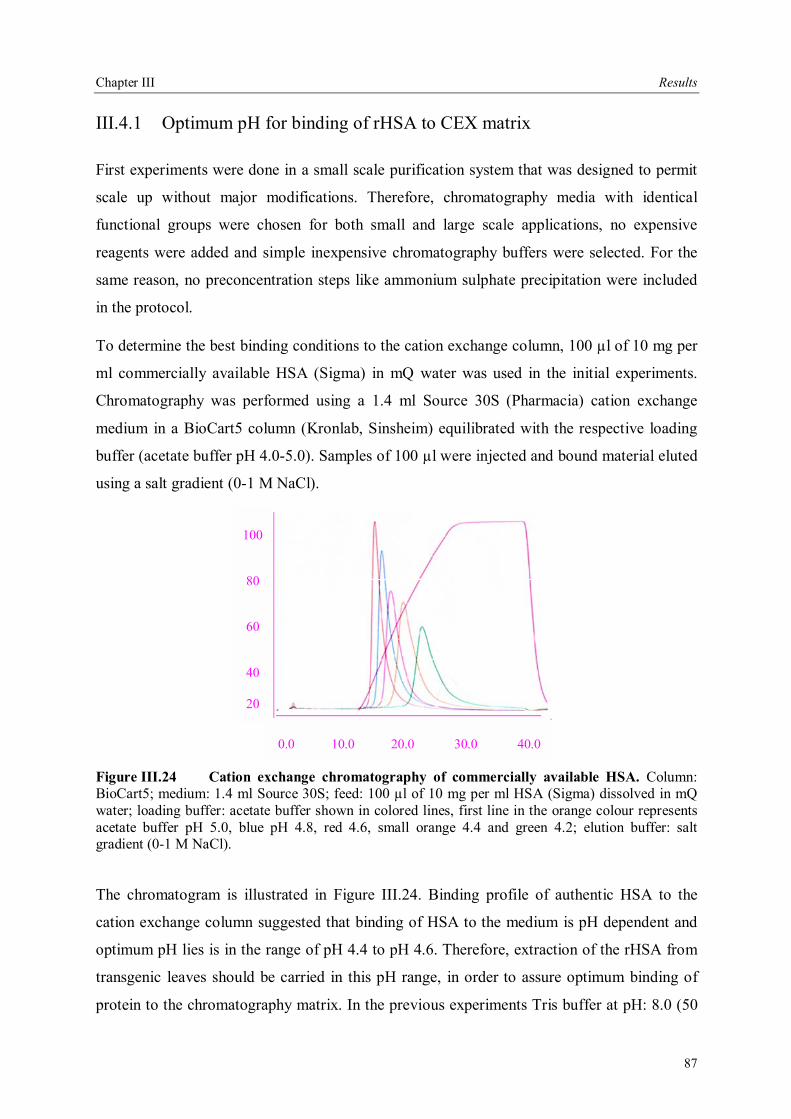
Chapter III Results
87
III.4.1 Optimum pH for binding of rHSA to CEX matrix
First experiments were done in a small scale purification system that was designed to permit
scale up without major modifications. Therefore, chromatography media with identical
functional groups were chosen for both small and large scale applications, no expensive
reagents were added and simple inexpensive chromatography buffers were selected. For the
same reason, no preconcentration steps like ammonium sulphate precipitation were included
in the protocol.
To determine the best binding conditions to the cation exchange column, 100 µl of 10 mg per
ml commercially available HSA (Sigma) in mQ water was used in the initial experiments.
Chromatography was performed using a 1.4 ml Source 30S (Pharmacia) cation exchange
medium in a BioCart5 column (Kronlab, Sinsheim) equilibrated with the respective loading
buffer (acetate buffer pH 4.0-5.0). Samples of 100 µl were injected and bound material eluted
using a salt gradient (0-1 M NaCl).
Figure III.24 Cation exchange chromatography of commercially available HSA. Column: BioCart5; medium: 1.4 ml Source 30S; feed: 100 µl of 10 mg per ml HSA (Sigma) dissolved in mQ water; loading buffer: acetate buffer shown in colored lines, first line in the orange colour represents acetate buffer pH 5.0, blue pH 4.8, red 4.6, small orange 4.4 and green 4.2; elution buffer: salt gradient (0-1 M NaCl).
The chromatogram is illustrated in Figure III.24. Binding profile of authentic HSA to the
cation exchange column suggested that binding of HSA to the medium is pH dependent and
optimum pH lies is in the range of pH 4.4 to pH 4.6. Therefore, extraction of the rHSA from
transgenic leaves should be carried in this pH range, in order to assure optimum binding of
protein to the chromatography matrix. In the previous experiments Tris buffer at pH: 8.0 (50
0.0 10.0 20.0 30.0 40.0
100 80 60 40 20
Chapter III Results
88
mM Tris-HCl (pH 8.0) + 100 mM NaCl + 5 mM EDTA + 0.1% (v/v) Tween 20 + 10 mM
DTT) for extraction of the rHSA was taken.
III.4.2 Purification of rHSA from transgenic leaves
III.4.2.1 Optimisation of extraction buffer
In order to evaluate different buffer compositions for extraction of rHSA from transgenic
tobacco plants prior to purification, total soluble protein from 1 g of transgenic leaf material
(HSAKDEL31) was extracted in the extraction buffers 1, 2, 3 and 6 in the following list.
After extracting total soluble proteins with these buffers pH was adjusted to 4.0 in 4, 5, 7 and
8. The typical buffer used for extracting rHSA from transient and stable transformed plants
was buffer 3.
1. Acetate buffer (pH 4.0) + 5 mM EDTA
2. Acetate buffer (pH 4.0) + 5 mM EDTA + CompleteTM protease inhibitor (ROCHE)
3. 50 mM Tris-HCl (pH 8.0) + 100 mM NaCl + 5 mM EDTA + 0.1% (v/v) Tween 20 + 10 mM DTT
4. 50 mM Tris-HCl (pH 8.0) + 100 mM NaCl + 5 mM EDTA + 0.1% (v/v) Tween 20 + 10 mM DTT with a pH shift to 4.0
5. 50 mM Tris-HCl (pH 8.0) + 100 mM NaCl + 5 mM EDTA + 0.1% (v/v) Tween 20 + 10 mM DTT with a pH shift to 4.0 + CompleteTM protease inhibitor (ROCHE)
6. PBS + 100 mM NaCl at pH 6.0
7. PBS + 100 mM NaCl at pH 6.0 with a pH shift to 4.0
8. PBS + 100 mM NaCl at pH 7.0 with a pH shift to 4.0 + CompleteTM protease inhibitor (ROCHE)
EDTA and CompleteTM protease inhibitor (ROCHE) were added only for small scale test
purposes in order to check if these additives are playing any role for increasing the stability of
the protein during extraction protocol. The amount of rHSA extracted from stable transgenic
plants using different buffers was evaluated by ELISA (Figure III.25).
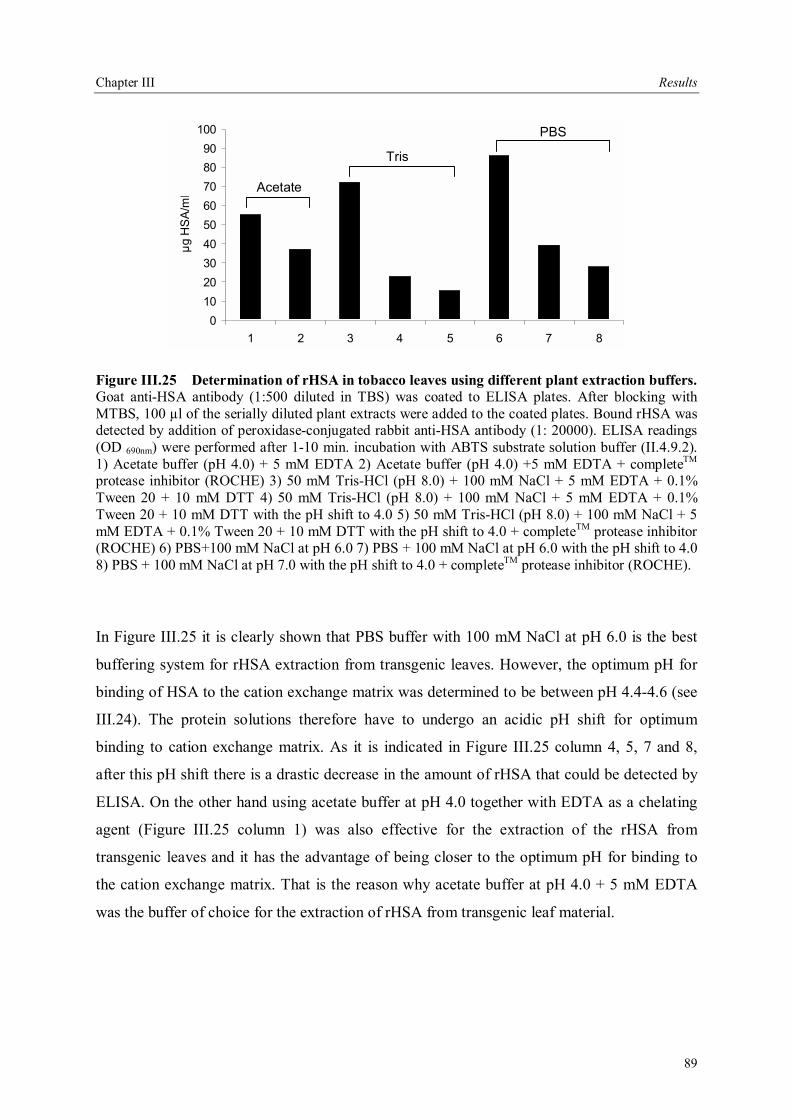
Chapter III Results
89
0102030405060708090
100
1 2 3 4 5 6 7 8
µg H
SA
/ml Acetate
Tris
PBS
Figure III.25 Determination of rHSA in tobacco leaves using different plant extraction buffers. Goat anti-HSA antibody (1:500 diluted in TBS) was coated to ELISA plates. After blocking with MTBS, 100 µl of the serially diluted plant extracts were added to the coated plates. Bound rHSA was detected by addition of peroxidase-conjugated rabbit anti-HSA antibody (1: 20000). ELISA readings (OD 690nm) were performed after 1-10 min. incubation with ABTS substrate solution buffer (II.4.9.2). 1) Acetate buffer (pH 4.0) + 5 mM EDTA 2) Acetate buffer (pH 4.0) +5 mM EDTA + completeTM protease inhibitor (ROCHE) 3) 50 mM Tris-HCl (pH 8.0) + 100 mM NaCl + 5 mM EDTA + 0.1% Tween 20 + 10 mM DTT 4) 50 mM Tris-HCl (pH 8.0) + 100 mM NaCl + 5 mM EDTA + 0.1% Tween 20 + 10 mM DTT with the pH shift to 4.0 5) 50 mM Tris-HCl (pH 8.0) + 100 mM NaCl + 5 mM EDTA + 0.1% Tween 20 + 10 mM DTT with the pH shift to 4.0 + completeTM protease inhibitor (ROCHE) 6) PBS+100 mM NaCl at pH 6.0 7) PBS + 100 mM NaCl at pH 6.0 with the pH shift to 4.0 8) PBS + 100 mM NaCl at pH 7.0 with the pH shift to 4.0 + completeTM protease inhibitor (ROCHE).
In Figure III.25 it is clearly shown that PBS buffer with 100 mM NaCl at pH 6.0 is the best
buffering system for rHSA extraction from transgenic leaves. However, the optimum pH for
binding of HSA to the cation exchange matrix was determined to be between pH 4.4-4.6 (see
III.24). The protein solutions therefore have to undergo an acidic pH shift for optimum
binding to cation exchange matrix. As it is indicated in Figure III.25 column 4, 5, 7 and 8,
after this pH shift there is a drastic decrease in the amount of rHSA that could be detected by
ELISA. On the other hand using acetate buffer at pH 4.0 together with EDTA as a chelating
agent (Figure III.25 column 1) was also effective for the extraction of the rHSA from
transgenic leaves and it has the advantage of being closer to the optimum pH for binding to
the cation exchange matrix. That is the reason why acetate buffer at pH 4.0 + 5 mM EDTA
was the buffer of choice for the extraction of rHSA from transgenic leaf material.
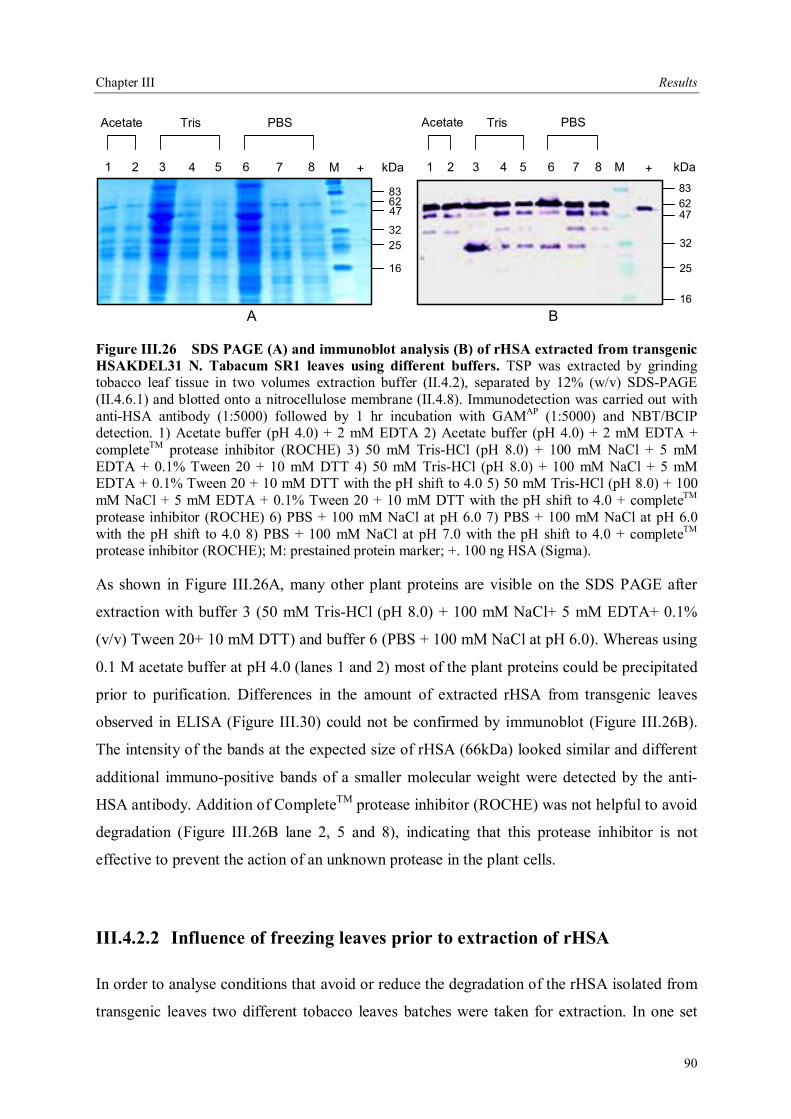
Chapter III Results
90
1 2 3 4 5 6 7 8 M +
836247
3225
16
kDa 1 2 3 4 5 6 7 8 M +836247
32
25
16
kDa
TrisAcetate PBS TrisAcetate PBS
A B
Figure III.26 SDS PAGE (A) and immunoblot analysis (B) of rHSA extracted from transgenic HSAKDEL31 N. Tabacum SR1 leaves using different buffers. TSP was extracted by grinding tobacco leaf tissue in two volumes extraction buffer (II.4.2), separated by 12% (w/v) SDS-PAGE (II.4.6.1) and blotted onto a nitrocellulose membrane (II.4.8). Immunodetection was carried out with anti-HSA antibody (1:5000) followed by 1 hr incubation with GAMAP (1:5000) and NBT/BCIP detection. 1) Acetate buffer (pH 4.0) + 2 mM EDTA 2) Acetate buffer (pH 4.0) + 2 mM EDTA + completeTM protease inhibitor (ROCHE) 3) 50 mM Tris-HCl (pH 8.0) + 100 mM NaCl + 5 mM EDTA + 0.1% Tween 20 + 10 mM DTT 4) 50 mM Tris-HCl (pH 8.0) + 100 mM NaCl + 5 mM EDTA + 0.1% Tween 20 + 10 mM DTT with the pH shift to 4.0 5) 50 mM Tris-HCl (pH 8.0) + 100 mM NaCl + 5 mM EDTA + 0.1% Tween 20 + 10 mM DTT with the pH shift to 4.0 + completeTM protease inhibitor (ROCHE) 6) PBS + 100 mM NaCl at pH 6.0 7) PBS + 100 mM NaCl at pH 6.0 with the pH shift to 4.0 8) PBS + 100 mM NaCl at pH 7.0 with the pH shift to 4.0 + completeTM protease inhibitor (ROCHE); M: prestained protein marker; +. 100 ng HSA (Sigma).
As shown in Figure III.26A, many other plant proteins are visible on the SDS PAGE after
extraction with buffer 3 (50 mM Tris-HCl (pH 8.0) + 100 mM NaCl+ 5 mM EDTA+ 0.1%
(v/v) Tween 20+ 10 mM DTT) and buffer 6 (PBS + 100 mM NaCl at pH 6.0). Whereas using
0.1 M acetate buffer at pH 4.0 (lanes 1 and 2) most of the plant proteins could be precipitated
prior to purification. Differences in the amount of extracted rHSA from transgenic leaves
observed in ELISA (Figure III.30) could not be confirmed by immunoblot (Figure III.26B).
The intensity of the bands at the expected size of rHSA (66kDa) looked similar and different
additional immuno-positive bands of a smaller molecular weight were detected by the anti-
HSA antibody. Addition of CompleteTM protease inhibitor (ROCHE) was not helpful to avoid
degradation (Figure III.26B lane 2, 5 and 8), indicating that this protease inhibitor is not
effective to prevent the action of an unknown protease in the plant cells.
III.4.2.2 Influence of freezing leaves prior to extraction of rHSA
In order to analyse conditions that avoid or reduce the degradation of the rHSA isolated from
transgenic leaves two different tobacco leaves batches were taken for extraction. In one set

Chapter III Results
91
the leaves were collected from greenhouse and used immediately for extraction, in the second
set the leaves that were collected, frozen in liquid N2 and stored for 6 months at 80°C were
taken for extraction. Furthermore as a control the commercial HSA was mixed with the wild
type tobacco extract. This was done to examine if the above mentioned unknown protease in
the plant cell is also able to degrade the commercial HSA.
All samples were extracted in acetate buffer (pH 4.0) plus 5 mM EDTA. The transgenic
HSAKDEL31 tobacco leaves were used for these experiments. As a control SR1 wild type
plant leaves were extracted in the same buffer and during extraction, the extracts were
supplemented with the 200 ng of commercially available HSA (Sigma).
1 2 3 4 5 6 M + 1 2 3 4 5 6 M +
836247
32
16
25
kDa
83
6247
32
16
25
kDa
SR1+comm. HSA
FreshHSAKDEL31
FrozenHSAKDEL31
FreshHSAKDEL31
FrozenHSAKDEL31
SR1+comm. HSA
A B
Figure III.27 SDS PAGE (A) and immunoblot analysis (B) of rHSA extracted from fresh and frozen transgenic HSAKDEL31 leaves. Total soluble proteins were extracted by grinding tobacco leaf tissue in two (1, 3 and 5) or four volumes (2, 4 and 6) of extraction buffer (acetate buffer pH 4.0+ 5 mm EDTA), separated by SDS-PAGE (II.4.6.1) and blotted onto a nitrocellulose membrane (II.4.8). Immuno detection was carried out with anti-HSA antibody (1:5000) followed by 1 h incubation with GAMAP (1:5000) and NBT/BCIP detection for 5 min at RT. 1). Wild type (SR1) 1:2 diluted extract +200 ng HSA (Sigma); 2) Wild type (SR1) 1:4 diluted extract+ 200 ng HSA (Sigma) 3) Fresh HSAKDEL31 1:2 diluted extract; 4) Fresh HSAKDEL31 1:4 diluted extract; 5) -80°C frozen HSAKDEL31 1:2 diluted extract; 6) -80°C frozen HSAKDEL31 1:4 diluted extract; M) prestained protein marker; +) 100 ng HSA (Sigma).
In Figure III.27A on the Coomassie stained SDS PAA gel much less total soluble proteins
were visible in lane 5 (frozen transgenic leaf extract) when compared with the fresh leaf
extracts (lane 3). On the immunoblot (Figure III.27B), in addition to the expected size of
rHSA (66kDa), additional immuno-positive bands almost in all the lanes including the control
(wild type SR1 extract +200 ng HSA) was recognized by the monoclonal anti-HSA antibody.
The presence of these smaller bands in all of the plant extracts investigated in this study is an
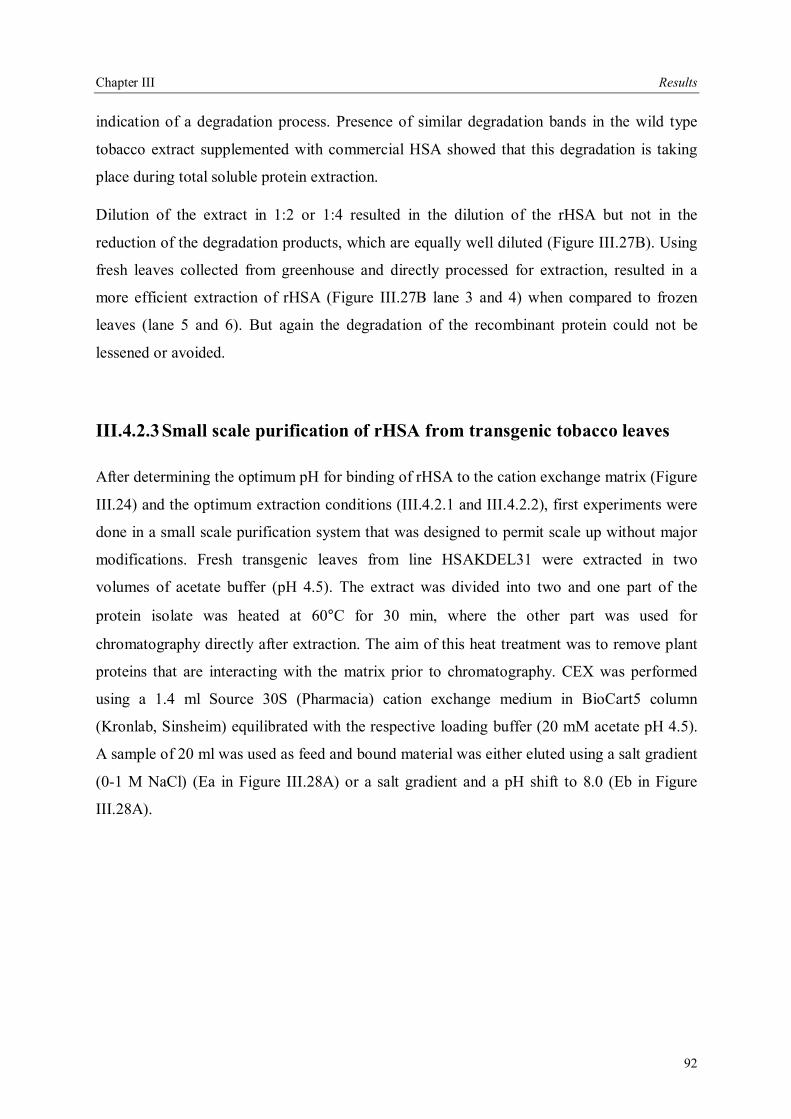
Chapter III Results
92
indication of a degradation process. Presence of similar degradation bands in the wild type
tobacco extract supplemented with commercial HSA showed that this degradation is taking
place during total soluble protein extraction.
Dilution of the extract in 1:2 or 1:4 resulted in the dilution of the rHSA but not in the
reduction of the degradation products, which are equally well diluted (Figure III.27B). Using
fresh leaves collected from greenhouse and directly processed for extraction, resulted in a
more efficient extraction of rHSA (Figure III.27B lane 3 and 4) when compared to frozen
leaves (lane 5 and 6). But again the degradation of the recombinant protein could not be
lessened or avoided.
III.4.2.3 Small scale purification of rHSA from transgenic tobacco leaves
After determining the optimum pH for binding of rHSA to the cation exchange matrix (Figure
III.24) and the optimum extraction conditions (III.4.2.1 and III.4.2.2), first experiments were
done in a small scale purification system that was designed to permit scale up without major
modifications. Fresh transgenic leaves from line HSAKDEL31 were extracted in two
volumes of acetate buffer (pH 4.5). The extract was divided into two and one part of the
protein isolate was heated at 60°C for 30 min, where the other part was used for
chromatography directly after extraction. The aim of this heat treatment was to remove plant
proteins that are interacting with the matrix prior to chromatography. CEX was performed
using a 1.4 ml Source 30S (Pharmacia) cation exchange medium in BioCart5 column
(Kronlab, Sinsheim) equilibrated with the respective loading buffer (20 mM acetate pH 4.5).
A sample of 20 ml was used as feed and bound material was either eluted using a salt gradient
(0-1 M NaCl) (Ea in Figure III.28A) or a salt gradient and a pH shift to 8.0 (Eb in Figure
III.28A).
Chapter III Results
93
+ 2 3 4 5 6 7 M Ea Eb + 2 3 4 5 6 7 M Ea Eb
83
6247
32
25
16
83
62
47
32
25
16
kDa kDa
A B
Figure III.28 SDS PAGE (A) and immunoblot analysis (B) of rHSA after partial purification by CEX. Total soluble proteins were extracted by grinding tobacco leaf tissue in two volumes of extraction buffer (acetate buffer pH 4.5), separated by SDS-PAGE (II.4.6.1) and blotted onto a nitrocellulose membrane (II.4.8). Immuno detection was carried out with anti-HSA antibody (1:5000) followed by 1 h incubation with GAMAP (1:5000) and NBT/BCIP detection for 5 min at RT. +) 100 ng HSA (Sigma) 2) HSAKDEL31 transgenic leaves extracted in acetate buffer (pH 4.5); 3) SR1 leaves extracted in acetate buffer (pH 4.5); 4) protein extract #2 heated at 60°C for 30 min 5) protein extract #3 heated at 60°C for 30 min; 6) Flow through (salt gradient); 7) Flow through from heated extract (salt gradient and pH shift to 8.0); 8) M: prestained protein marker; 9) Ea) Eluate (salt gradient); 10) Eb) Eluate (salt gradient and pH shift to 8.0)
As shown by SDS PAGE analysis (Figure III.28A), there is a huge decrease in the amount of
plant protein when the leaf extract was heated at 60 °C for 30 min. Amount of rHSA seemed
to be similar both in the heated and non-heated samples (Figure III.28B lanes 2 and 4
respectively). However, ELISA results showed that almost one half of the rHSA was lost
when the extract was heated (Table III.4, initial feed). Although, heating the extract resulted
in the reduction of the contaminating plant protein concentration, it resulted in a huge loss of
the rHSA in the initial feed prior to purification. Consequently extract heating was not
included into the extraction protocol.
In addition, ELISA results confirmed that elution of rHSA from the cation exchange matrix
was also a very important step to optimise. Salt gradient alone or in combination with a pH
shift to 8.0 were investigated during the elution step. As illustrated in the Table III.4, using
salt gradient and a pH shift to 8.0 was more effective (115 µg rHSA per ml eluate) for elution
of rHSA than using salt gradient alone (62 µg rHSA per ml eluate).
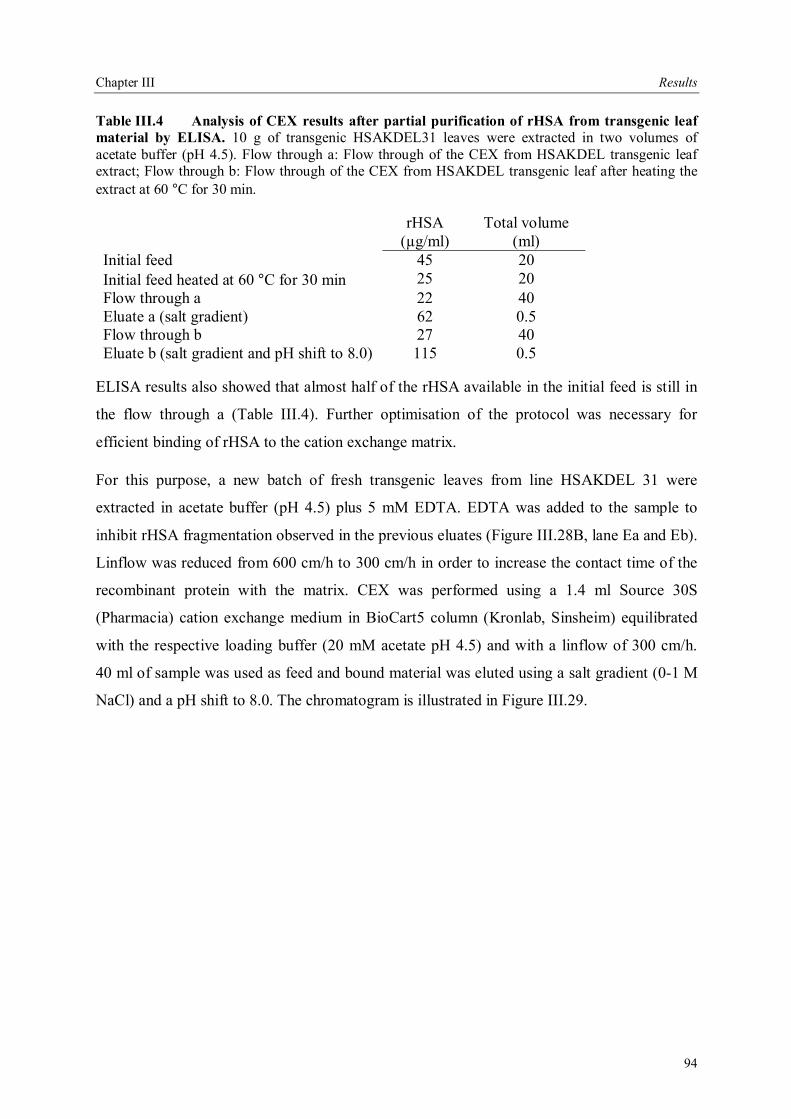
Chapter III Results
94
Table III.4 Analysis of CEX results after partial purification of rHSA from transgenic leaf material by ELISA. 10 g of transgenic HSAKDEL31 leaves were extracted in two volumes of acetate buffer (pH 4.5). Flow through a: Flow through of the CEX from HSAKDEL transgenic leaf extract; Flow through b: Flow through of the CEX from HSAKDEL transgenic leaf after heating the extract at 60 °C for 30 min.
rHSA (µg/ml)
Total volume (ml)
Initial feed 45 20 Initial feed heated at 60 °C for 30 min 25 20 Flow through a 22 40 Eluate a (salt gradient) 62 0.5 Flow through b 27 40 Eluate b (salt gradient and pH shift to 8.0) 115 0.5
ELISA results also showed that almost half of the rHSA available in the initial feed is still in
the flow through a (Table III.4). Further optimisation of the protocol was necessary for
efficient binding of rHSA to the cation exchange matrix.
For this purpose, a new batch of fresh transgenic leaves from line HSAKDEL 31 were
extracted in acetate buffer (pH 4.5) plus 5 mM EDTA. EDTA was added to the sample to
inhibit rHSA fragmentation observed in the previous eluates (Figure III.28B, lane Ea and Eb).
Linflow was reduced from 600 cm/h to 300 cm/h in order to increase the contact time of the
recombinant protein with the matrix. CEX was performed using a 1.4 ml Source 30S
(Pharmacia) cation exchange medium in BioCart5 column (Kronlab, Sinsheim) equilibrated
with the respective loading buffer (20 mM acetate pH 4.5) and with a linflow of 300 cm/h.
40 ml of sample was used as feed and bound material was eluted using a salt gradient (0-1 M
NaCl) and a pH shift to 8.0. The chromatogram is illustrated in Figure III.29.
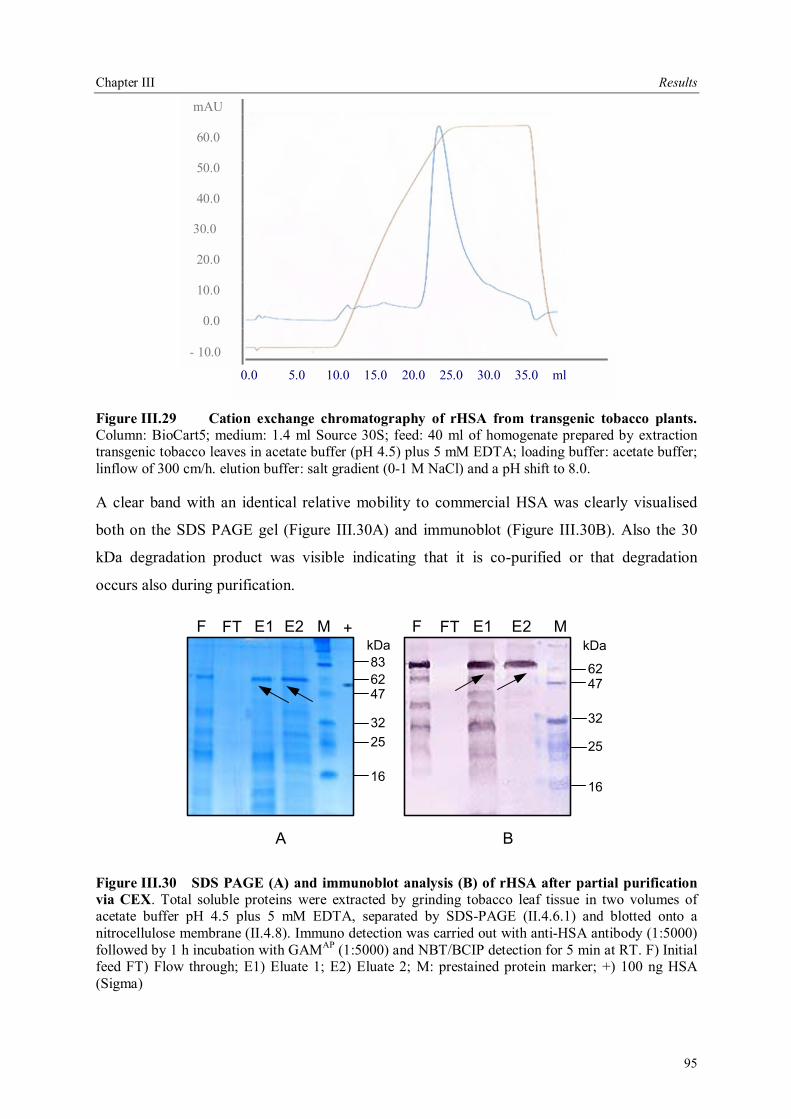
Chapter III Results
95
Figure III.29 Cation exchange chromatography of rHSA from transgenic tobacco plants. Column: BioCart5; medium: 1.4 ml Source 30S; feed: 40 ml of homogenate prepared by extraction transgenic tobacco leaves in acetate buffer (pH 4.5) plus 5 mM EDTA; loading buffer: acetate buffer; linflow of 300 cm/h. elution buffer: salt gradient (0-1 M NaCl) and a pH shift to 8.0.
A clear band with an identical relative mobility to commercial HSA was clearly visualised
both on the SDS PAGE gel (Figure III.30A) and immunoblot (Figure III.30B). Also the 30
kDa degradation product was visible indicating that it is co-purified or that degradation
occurs also during purification.
F FT E1 E2 M F FT E1 E2 M
836247
3225
16
kDa
6247
32
25
16
kDa+
A B
Figure III.30 SDS PAGE (A) and immunoblot analysis (B) of rHSA after partial purification via CEX. Total soluble proteins were extracted by grinding tobacco leaf tissue in two volumes of acetate buffer pH 4.5 plus 5 mM EDTA, separated by SDS-PAGE (II.4.6.1) and blotted onto a nitrocellulose membrane (II.4.8). Immuno detection was carried out with anti-HSA antibody (1:5000) followed by 1 h incubation with GAMAP (1:5000) and NBT/BCIP detection for 5 min at RT. F) Initial feed FT) Flow through; E1) Eluate 1; E2) Eluate 2; M: prestained protein marker; +) 100 ng HSA (Sigma)
0.0 5.0 10.0 15.0 20.0 25.0 30.0 35.0 ml
mAU 60.0 50.0 40.0 30.0 20.0 10.0 0.0 - 10.0
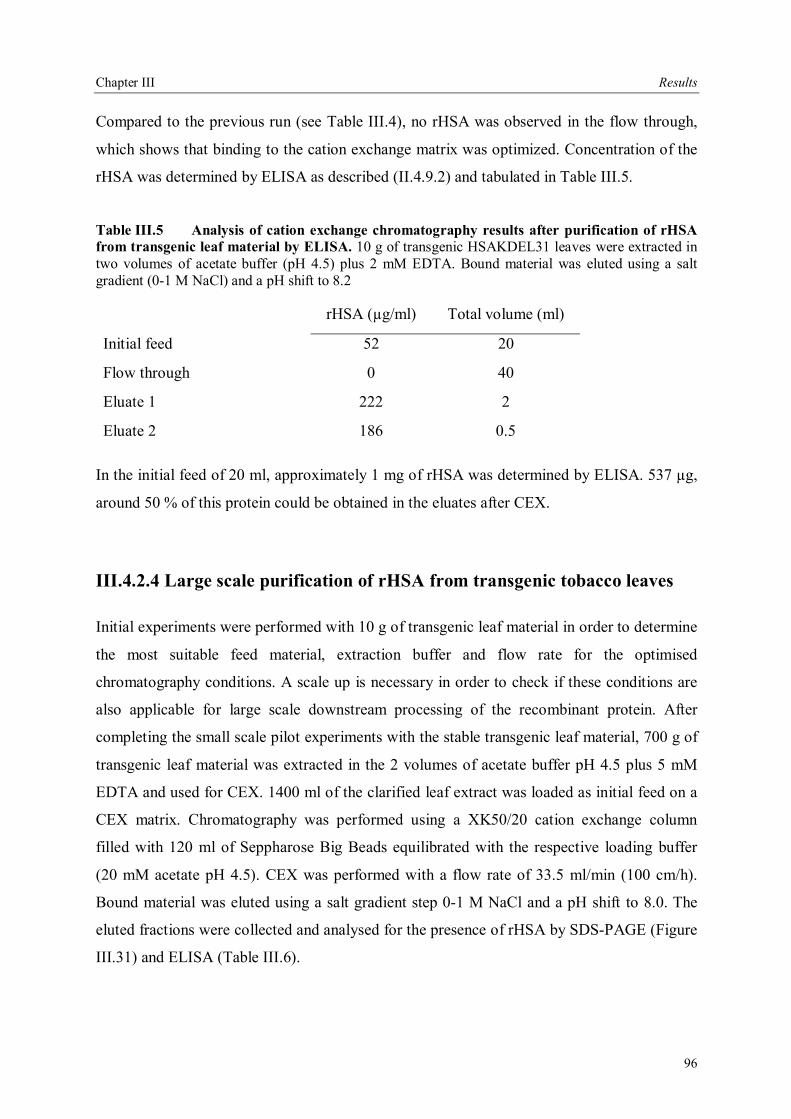
Chapter III Results
96
Compared to the previous run (see Table III.4), no rHSA was observed in the flow through,
which shows that binding to the cation exchange matrix was optimized. Concentration of the
rHSA was determined by ELISA as described (II.4.9.2) and tabulated in Table III.5.
Table III.5 Analysis of cation exchange chromatography results after purification of rHSA from transgenic leaf material by ELISA. 10 g of transgenic HSAKDEL31 leaves were extracted in two volumes of acetate buffer (pH 4.5) plus 2 mM EDTA. Bound material was eluted using a salt gradient (0-1 M NaCl) and a pH shift to 8.2
rHSA (µg/ml) Total volume (ml)
Initial feed 52 20
Flow through 0 40
Eluate 1 222 2
Eluate 2 186 0.5
In the initial feed of 20 ml, approximately 1 mg of rHSA was determined by ELISA. 537 µg,
around 50 % of this protein could be obtained in the eluates after CEX.
III.4.2.4 Large scale purification of rHSA from transgenic tobacco leaves
Initial experiments were performed with 10 g of transgenic leaf material in order to determine
the most suitable feed material, extraction buffer and flow rate for the optimised
chromatography conditions. A scale up is necessary in order to check if these conditions are
also applicable for large scale downstream processing of the recombinant protein. After
completing the small scale pilot experiments with the stable transgenic leaf material, 700 g of
transgenic leaf material was extracted in the 2 volumes of acetate buffer pH 4.5 plus 5 mM
EDTA and used for CEX. 1400 ml of the clarified leaf extract was loaded as initial feed on a
CEX matrix. Chromatography was performed using a XK50/20 cation exchange column
filled with 120 ml of Seppharose Big Beads equilibrated with the respective loading buffer
(20 mM acetate pH 4.5). CEX was performed with a flow rate of 33.5 ml/min (100 cm/h).
Bound material was eluted using a salt gradient step 0-1 M NaCl and a pH shift to 8.0. The
eluted fractions were collected and analysed for the presence of rHSA by SDS-PAGE (Figure
III.31) and ELISA (Table III.6).
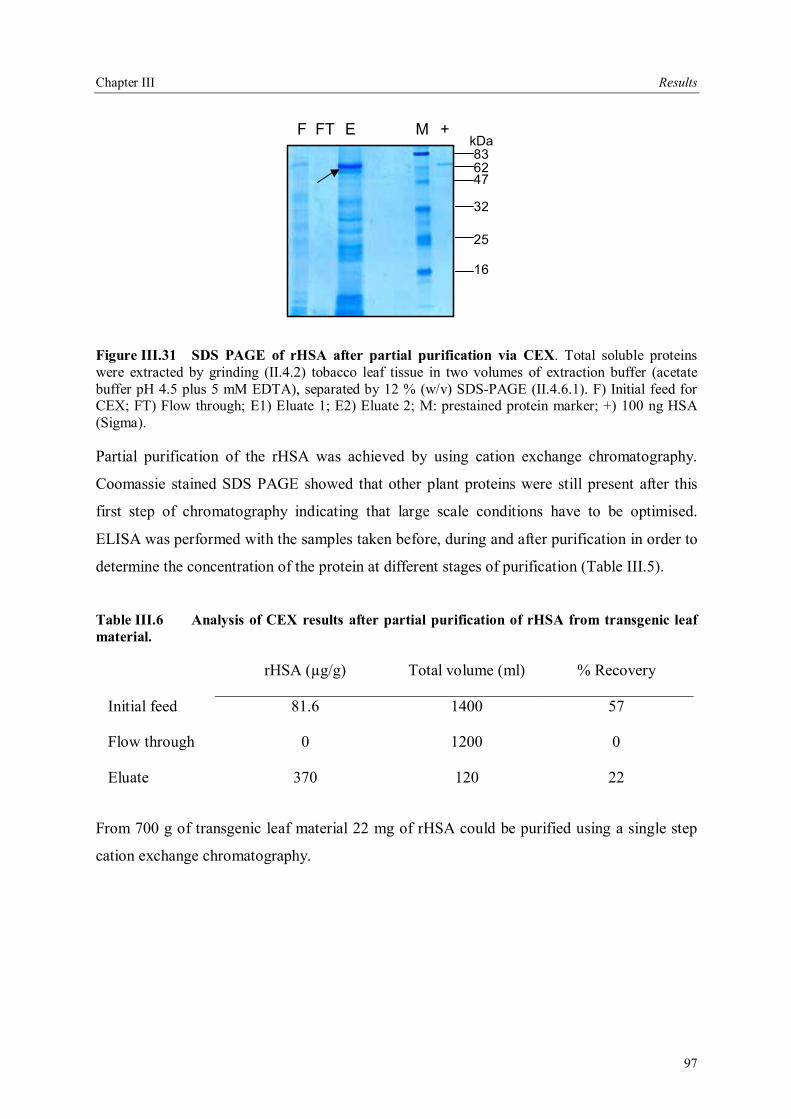
Chapter III Results
97
F FT ME +836247
32
25
16
kDa
Figure III.31 SDS PAGE of rHSA after partial purification via CEX. Total soluble proteins were extracted by grinding (II.4.2) tobacco leaf tissue in two volumes of extraction buffer (acetate buffer pH 4.5 plus 5 mM EDTA), separated by 12 % (w/v) SDS-PAGE (II.4.6.1). F) Initial feed for CEX; FT) Flow through; E1) Eluate 1; E2) Eluate 2; M: prestained protein marker; +) 100 ng HSA (Sigma).
Partial purification of the rHSA was achieved by using cation exchange chromatography.
Coomassie stained SDS PAGE showed that other plant proteins were still present after this
first step of chromatography indicating that large scale conditions have to be optimised.
ELISA was performed with the samples taken before, during and after purification in order to
determine the concentration of the protein at different stages of purification (Table III.5).
Table III.6 Analysis of CEX results after partial purification of rHSA from transgenic leaf material.
rHSA (µg/g) Total volume (ml) % Recovery
Initial feed 81.6 1400 57
Flow through 0 1200 0
Eluate 370 120 22
From 700 g of transgenic leaf material 22 mg of rHSA could be purified using a single step
cation exchange chromatography.
Chapter IV Discussion
98
IV Discussion
IV.1. The variability of the HSA cDNA
The human serum albumin gene is present as a single copy (Takahashi et al. 1987) coding for
585 amino acids (Peters 1985). Sequences for HSA have been published by Meloun et al.
(1975), Lawn et al. (1981) and Minghetti et al. (1986). These published protein sequences of
HSA have the same length but differ in about 20 amino acids. In this work, HSA cDNA was
amplified from two overlapping cDNA fragments (Dugaiczyk et al. 1982) and sequence was
verified. Among the published reports of HSA sequences, the Dugaiczyk sequence is most
similar to that of Minghetti et al. (1986), with only one amino acid change (Glu to Gly) at
position 294.
At all discrepant positions the nucleotide sequencing has been carefully confirmed and it is
unlikely that DNA sequencing errors are the cause of these reported differences. The
possibility of artefacts introduced by cDNA cloning cannot be ruled out. However, other
likely explanations exist for the amino acid sequence differences among various reports.
These include changes in amidation that occurs either in vivo or during protein sequencing
(Lawn et al. 1981). Polymorphism in HSA may also account for differences in the sequence.
About 100 variant forms of the albumin molecule (alloalbumins) have been described
(Nicholson et al. 2000) as well as two mutations that cause nearly 30 cases of
analbuminaemia have been detected by protein electrophoresis (Weitkamp et al. 1973). Most
alloalbumins have a single amino acid substitution, resulting from a point mutation; a few
alloalbumins have a truncated and altered carboxyl terminus (Madison et al. 1991; Watkins et
al. 1994). Therefore, rather than cloning artefacts or sequencing errors, changes observed in
this work and some of the published sequences are more likely genetic variants of HSA
present in the nature.
IV.2 Construction of the plant codon optimized HSA
Heterologous genes containing high levels of rare codons that are used in low frequency in
the host organism often show low levels of recombinant protein expression or truncated
products because of premature stops in protein translation (Chen et al. 1990; Hannig et al.
Chapter IV Discussion
99
1998; Kang et al. 2004). Many instances of poor expression of foreign genes in plants have
been investigated, and several post-transcriptional events that led to low levels of expression,
such as improper codon usage, (Perlak et al. 1991) abnormal splicing, (Haseloff et al. 1997)
premature polyadenylation (Jarvis et al. 1997) and mRNA instability (Murray et al. 1989)
have been described. The authentic HSA cDNA contains 18.3 % rare codons, dispersed over
the entire sequence. Therefore, it was decided to adapt the codon usage in the rHSA sequence
to the one in wheat and rice plants to optimise the plant expression.
The protein coding sequence can be optimised by various strategies like oligonucleotide
ligation, (Heyneker et al. 1976) self priming PCR (Dillon et al. 1990) or cloning of large
(approx. 100 bp long) inserts into a plasmid using a technique of oligo-directed double-strand
break repair (the FokI method) (Mandecki et al. 1988). A particularly attractive method, due
to its inherent simplicity, is assembly PCR (Stemmer et al. 1995). This involves the
generation of overlapping oligonucleotides which, when assembled, form the template for the
gene of interest. The oligonucleotides are repetitively extended by PCR to assemble the full-
length gene.
Based on a similar assembly PCR approach, a semi-synthetic HSA gene was amplified.
Authentic HSA cDNA was digested in three smaller fragments in order to avoid amplification
of the template HSA by the two external primers. These three templates, T400, T800 and
T1000 were used in the assembly PCR together with 32 different primers designed for the
exchange of rare codons in wheat and rice. Primers did not cover the complete synthetic gene
rather only the modified sequence fragments. In this way complexity of the PCR could be
reduced and only the regions with the rare codons were replaced while the rest was kept as
authentic HSA sequence. After four rounds of PCR, a fragment of the expected size of 1.8 kb
PCR was assembled and the product was subsequently purified and cloned. A pre-screen of
the received clones by analysing a characteristic enzymatic activity of the expressed protein
was hampered due to the absence of such an activity test for HSA. In order to identify a PCR
assembled semi-synthetic HSA cDNA, 50 individual clones were sequenced either using
HSA or vector specific primers. Computer-based sequence alignment of these clones revealed
that the rHSA was successfully assembled in the right order. However, as many as 35
mutations including deletions, insertions and base changes were detected. Clones 13 and 31
having the lowest error rate still contained 19 and 20 base pair exchanges, respectively.
Analysis of the plant codon optimised HSA showed that the mutations were exclusively in the
primer regions of the final product. Therefore the observed mutations in the sequence are
Chapter IV Discussion
100
more likely due to bad quality of the primers used in the assembly. The frequencies of the
nucleotide errors are largely dependent on the quality of the nucleotides, rather than the
fidelity of the polymerase (Hoover et al. 2002). The primers were synthesized and purified
using standard procedures by MWG Biotech and delivered in the lyophilised form.
One approach to remove these mutations is to use site directed mutagenesis (Ishii et al. 1998).
In vitro site-directed mutagenesis is an invaluable technique for the modification of a given
sequence. It involves (1) cloning the DNA of interest into a plasmid vector, (2) denaturing the
plasmid DNA to produce single strands, (3) annealing synthetic oligonucleotide with desired
mutation (point mutation, deletion, or insertion) to the target region, (4) extending the mutant
oligonucleotide using a plasmid DNA strand as the template and (5) propagating the
heteroduplex by transformation in E. coli. In theory, after propagation, about 50% of the
transformants will carry a heteroduplex in which the desired mutation is incorporated.
Although some commercial mutagenesis kits guarantee a mutation efficiency of 90 % like for
example with Stratagenes QuikChange® site-directed mutagenesis kit, it suffers from the
following disadvantages; (i) in general, mutations are introduced at only one site at a time
(Kirsch et al. 1998); introduction of more than one mutation at different sites takes longer,
since it requires a transformation and a DNA preparation step between consecutive rounds of
mutagenesis; (ii) two complementary mutagenic oligonucleotide primers are needed for a
mutation site. To correct clones 13 and 31 comprising 19 and 20 mutations respectively, 40
mutagenic oligonucleotide primers are required and mutations should have been eliminated
once at a time with following transformation and DNA preparations steps. The final products
should have been sequenced for verification of the sequence changes. The accomplishments
of these mutagenesis experiments were out of the scope of this present work and therefore the
efforts to generate a synthetic plant codon optimized human serum albumin cDNA were
stopped.
In the retrospective, the assembly of the full-length HSA cDNA could have been modified.
To reduce the possibility of errors during oligonucleotide synthesis, the oligonucleotides
should be rather short, yet they must still be long enough to provide stable priming overlaps.
In this work, the primer length for assembly of the semi-synthetic HSA cDNA varied between
27 nt and 83 nt and they overlapped between 21 and 24 nt (Figure III.3). While assembly
PCR approach is simple in principle, in practice numerous complications can lead to errors in
the synthesis (Hoover et al. 2002). For example, a 1.1-kb fragment containing the TEM-1
beta-lactamase-encoding gene (bla) was assembled in a single reaction from a total of 56

Chapter IV Discussion
101
oligos, each 40 nucleotides (nt) in length. Five silent point mutations were introduced creating
five new restriction sites, to differentiate the synthetic gene from the naturally occurring bla
gene in pBR322. At the end of assembly the bla gene was sequenced and three additional
point mutations were detected (Stemmer et al. 1995). Insertion of additional restriction sites
into the sequence enables the removal of mutations by exchanging the mutated against the
expected sequences. Larger genes can be divided in subfragments that are assembled
separately. After sequence verification of the cloned subfragments, they can be assembled to
the full-length construct. It may be an advantage to design the oligonucleotide sequences to
generate unique restriction sites within the assembled gene to allow subsequent manipulations
by recombinant DNA techniques. This way it could be possible to exchange the smaller
subfragments containing mutated sequence with a subfragment containing the expected
sequence. By combination of these two parameters, the nucleotide sequence of a major
industrial lipase, lip1 gene was first subdivided into four separately synthesized segments of
ca. 400 bp. Unique restriction sites were strategically positioned throughout the gene to
facilitate the analysis of primary subclones containing the four blocks and the construction of
the gene by their assembly. The final codon optimised version of the gene was 1688 bp in
length and had a 77 % nucleotide sequence identity with the natural gene using P. pastoris
cells, the synthetic gene was functionally overexpressed, allowing for the first time to produce
recombinant lip1 of high purity at a level of 150 U/mL culture medium (Brocca et al. 1998).
In plant system, several examples of codon optimization strategies are present. The gene
encoding green fluorescent protein (GFP) from Aequorea victoria was resynthesized to adapt
its codon usage for expression in plants by increasing the frequency of codons with a C or a G
in the third position from 32 to 60 %. A comparison of GFP production in transgenics with
the wild type and the synthetic gfp gene under the control of the enhanced CaMV 35S
promoter showed that the large-scale alterations in the gfp gene increased the frequency of
high expressors in the transgenic population but hardly changed the maximum GFP
concentrations. The authors attributed this to a reduced regeneration capacity of transformed
cells with higher GFP concentrations (Rouwendal et al. 1997). Similarly, another marker
gene, luciferase was also codon optimized for high level expression in plants (Lonsdale et al.
1998). In tobacco cells, a codon modified form of the luciferase gene (luc+) available from
Promega, shows no significant enhancement of activity over that of the wild-type gene,
although there are 53- to 59- and 14- to 23-fold enhancements of activity in wheat scutellum
Chapter IV Discussion
102
and Black Mexican Sweet (BMS) maize cells, respectively. Lonsdate et al., (1998) attributed
these differences to the different tRNA pools present in different tissues and species.
Recently, the coding sequence of the cholera toxin B subunit (CTB) was optimized, based on
the modification of codon usage to that of tobacco plant genes and the removal of mRNA-
destabilizing sequences (Kang et al. 2004). The recombinant CTB protein constituted
approximately 1.5 % of the total soluble protein in transgenic tobacco leaves. This level of
CTB production was approximately 15-fold higher than that in tobacco plants that were
transformed with the bacterial CTB gene.
These studies in heterologous expression hosts have shown that codon usage can influence
the expression of foreign proteins. However, in general the increase in protein levels that may
be obtained by codon optimization is relatively modest and it is in a few fold range. In
conclusion, mindful attention to cryptic features like codon bias changes to correctly match
the tRNA complement of the new host, investigation of accumulating sequence motifs that
would be recognized as premature polyadenylation signals or cryptic intron splice sites in
plants can lead to improvement of these strategies. Similarly, consideration of mRNA
secondary structures that might hinder expression or RNA stability in the transgenic host can
lead to development of modified trangenes whose expression increases several hundred folds.
IV.3 Production of recombinant HSA in bacteria and plant cells
HSA is a monomeric globular pre-protein whose mature form consists of a single polypeptide
chain of 585 amino acids (66.5 kDa with 17 disulfide bonds). It is highly susceptible to
proteolytic degradation in recombinant systems and is expensive to purify. Estimates by
industry suggest that the cost-effective yield for pharmaceutical production in plants is 0.1 mg
of rHSA per g of fresh weight (Fernandez-San Millan et al. 2003). In addition, good
recombinant systems are still not available for many human proteins that are expensive to
purify or highly susceptible to proteolytic degradation. It is known that traditional purification
of biopharmaceuticals using columns accounts for 30 % of the production cost and 70 % of
the setup cost (Daniell 2003).
The increasing production of proteins in heterologous hosts through the use of recombinant
DNA technology has brought the problem of proteolytic degradation into focus; heterologous
proteins appear to be more prone to proteolysis. Recombinant proteins are often regarded by a
Chapter IV Discussion
103
cell as foreign, and therefore are degraded much faster than most endogenous proteins.
Proteolytic stability of recombinant proteins is a significant factor influencing the final yield.
In this work bacterial and plant production platforms were evaluated for the expression of
rHSA.
IV.3.1 Bacterial expression
HSA is characterized by a low content of tryptophan and methionine and a high content of
cysteine and the charged amino acids, aspartic and glutamic acids, lysine and arginine. In this
work, two different constructs were used for expression of rHSA in the cytoplasm or
periplasm of E. coli. Expression of rHSA was achieved in the cytoplasm but in very low
amounts. The concentration of the affinity purified cytoplasmic rHSA was determined to be
0.002 mg per liter bacterial culture (III.3.1). In nature, the presence of 17 disulphide bridges
is the unique feature of the albumin molecule (Carter et al. 1990). HSA cDNA was cloned
into the pET21d vector, allowing expression in the cytoplasm. It is a reducing environment
and due to this reason it might be difficult to ensure proper disulphide bond formation.
The change of compartment can lead to better protein folding resulting in higher expression
levels. Therefore, the second approach was to secrete HSA into the periplasm by means of the
pelB leader sequence. Secretion of the target protein to the periplasm has a number of distinct
advantages like the oxidizing environment of the periplasm allows for the formation of
disulfide bonds, which does not occur in the reducing environment of the cytoplasm. Also,
the periplasm contains two foldases that catalyze the formation and isomerization of disulfide
bonds. Since the periplasm contains only 4 % of the total cellular proteins, the target protein
is effectively concentrated and can be purified with less contaminant. In addition protein
degradation in the periplasm is also less extensive in the periplasm (Talmadge et al. 1982).
However, capacity for secretion and post-translational modification are usually limited
Hannig et al. 1998 and not all expressed protein are secreted into the periplasm but also
found in the medium, the cytoplasm or the cytoplasmic membrane.
To our knowledge there is no published report describing high level expression of rHSA in E.
coli. For a successful bacterial expression system either in E. coli or in another strain,
optimization of culture conditions must be carried out. The expression of the recombinant
protein can be optimized by doing a time course of induction, altering induction temperature
or screening growth media. For each test, the recombinant protein should be analyzed by
Chapter IV Discussion
104
ELISA, SDS-PAGE and/or Western blot to determine optimal conditions for protein
production. Instead of optimizing conditions for bacterial expression, the thesis was focused
on the expression of rHSA in plant cell and suspension cultures.
IV.3.2 Expression of rHSA in plants
Molecular farming in plants has the potential to provide virtually unlimited quantities of
recombinant proteins for use as diagnostic and therapeutic tools in health care and the life
sciences (Twyman et al. 2003). Plants produce a large amount of biomass and protein
production can be increased using plant suspension cell culture or by the propagation of
stably transformed plant lines in the field.
In this work, we have used nuclear transformation of various plant species to enable targeting
of recombinant HSA to the secretory pathway, which should ensure proper folding and
formation of the disulfide-bridges. Transgenic tobacco and wheat plants as well as tobacco
suspension cells were generated using appropriate targeting signals to achieve subcellular
HSA localisation in the plant cell apoplast or ER. Transient gene expression system offer
several advantages over analyses of stable expression, for example initiation of gene
expression, and synthesis of the protein can be analyzed within a very short time and is not
affected by position effects (Vaquero et al. 1999). The results can be evaluated before
initiating stable transformation of plants and experimental procedure does not require
sophisticated equipment and is inexpensive. Therefore this system is suitable for the
development and initial characterization of new recombinant protein.
Tobacco is a non-food and non-feed crop and an ideal choice for the production of therapeutic
proteins because of its relative tractability to genetic manipulation and an impending need to
explore alternate uses for this crop. Tobacco is an excellent biomass producer (in excess of 40
tons of leaf fresh weight/acre, based on multiple cuttings per season) and a prolific seed
producer (up to one million seeds produced per plant), thus hastening the time in which a
product can be scaled up and brought to market. Tobacco is widely used as a model system to
test the suitability of plant-based expression systems for production of therapeutic proteins
and other transgenes (Daniell 2003). More transgenes have been introduced into the tobacco
chloroplast or nuclear genome than all other crop species combined. Both nuclear and
chloroplast genomes of tobacco have been transformed with relative ease. Tobacco is a self-
Chapter IV Discussion
105
pollinating crop and there are no known wild or cultivated relatives in North America.
Several studies have established that transgenes are maternally inherited when introduced via
the chloroplast genome in tobacco. In addition, both male sterility and seed sterility
techniques have been developed already for tobacco. Thus, advanced technology is readily
available for containment of gene flow through pollen and seeds.
In this study, eight different tobacco cultivars were evaluated by transient expression and the
maximum accumulation levels obtained was compiled in Table III.1. For six of the cultivars
tested, expression levels varied between 0.76 to 6.3 µg per g leaf material. For the cultivars
Adonis Schwester and Barley Saturn, accumulation levels of 10 µg per g leaf material were
achieved in the apoplasm. Although leaf size in these varieties is bigger than the model Petit
Havana SR1 tobacco plants, which is an advantage for molecular farming purposes, a
disadvantage of these cultivars is the unavailability of the seeds for the next generation which
will be a major drawback for the stable transformation.
Clearly, transient expression is a prerequisite to stable transformation because it allows both
the expression vectors and protein stability to be tested. For stably transforming tobacco
plants, HSA gene was cloned into a binary vector that can be moved between E. coli and A.
tumefaciens. Transformation was followed by selection for cells with stably integrated copies
of the rHSA by following a selectable marker resistance gene that is introduced in the
expression vector. Using plant extracts from stably transformed tobacco plants, correct size of
the recombinant protein was confirmed by immunoblot analysis and the quantity of protein
was estimated by ELISA. Maximum accumulation level of 100 µg per gram plant material
(0.51 % of TSP) was obtained when the recombinant protein was targeted to the ER. These
levels are at least 2.5 fold higher than those reported in the literature for nuclear
transformation of potato by Farran et al. (2002). By including the appropriate signal peptide
sequence or fusion responsible for directing expression and deposition, it is possible to target
recombinant proteins to the lumen of the ER, vacuole or other cellular compartments. These
type of targeting signals can be used to protect the foreign protein from proteolytic
degradation, preserve their integrity and to increase accumulation levels (Moloney et al.
1997). In this work, usage of KDEL retention signal boosted the production of rHSA in
tobacco plants. Although it is conceivable that the different transcripts are translated with
different efficiencies, a more plausible explanation for the differences in the protein yield is
that rHSA is more stable, or more rHSA is correctly folded in the ER than in the apoplast, as
reported for the scFv expression in other plant species (Artsaenko et al. 1995). Schouten et al.
Chapter IV Discussion
106
(1997) have demonstrated the addition of a C-terminal KDEL peptide increased cytosolic
expression level of a scFv fragment. Maximum expression levels of up to 0.2% of the total
soluble protein were measured, whereas the same scFv fragments without KDEL did not
show any accumulation in the cytosol of transgenic plants. They suggested that short
polypeptides such as KDEL sequence may protect the scFv antibody from proteolytic
degradation (Schouten et al. 1997).
Besides different tobacco varieties three edible plants, zucchini, bean and wheat were also
used for expression of rHSA (Table III.1). In bean leaves, accumulation levels were below
detection levels for ELISA and western blot. In zucchini and in model tobacco SR1, transient
accumulation levels of 2.65 µg per g and 2 µg per g leaf material were achieved, respectively.
Besides intact tobacco plants, immature wheat embryos were also used for bombardment of
HSA-KDEL construct containing ubiquitin promoter. Expression levels in dry wheat seeds
were determined as 100 µg per gram seed. The use of transgenic wheat seeds enables the
storage of rHSA in seeds for long time periods. We have stored transgenic wheat seeds for
more than 12 months without significant loss of product yield. Stöger et al. (2000)
investigated the expression of a construct containing scFvT84.66 tagged with a C-terminal
KDEL sequence in wheat and rice (Stöger et al. 2000). The highest expression levels of 29 µg
per g in leaves and 32 µg per g in seeds were detected using ubiquitin promoter. In our study,
although the expression levels were much higher than this, it should be possible to enhance
production levels further, for example by testing a range of alternative promoters, including
seed-specific promoters.
In addition to these studies using the plants grown in the greenhouse, in year 2000 a field trial
has been performed in Canada using transgenic N. tabacum cv. Petite Havana SR1 plants
producing rHSA accumulating in the plant apoplast. The analyses revealed that similar levels
were obtained when compared to plants cultivated in the greenhouse demonstrating that these
transgenic plants are suitable for production of rHSA in the field at large scale. In the
literature, performance comparison of greenhouse and field grown plants were done mainly
for herbicide resistance transgenic plants. Ramachandran et al. (1998) evaluated the
performance of selected transgenic herbicide resistance canola lines under greenhouse and
field conditions. Tested transgenic lines provided high levels of resistance against
diamondback at all growth stages under greenhouse conditions. Transgenic canola also
provided excellent control of diamondback moth under field conditions both as a pure stand
and in mixtures (Ramachandran et al. 1998).
Chapter IV Discussion
107
Sijmons et al. made the first reported attempt to express rHSA in transgenic plants in 1990,
but very low expression levels were obtained (0.02% of TSP). Later in 2002, Farrran et al.
showed that rHSA was accumulated in the tubers of transgenic potato plants with the highest
accumulation level reaching to 0.2% of the tuber soluble protein. Recently, Fernandez-San
Millan et al. (2003) reported a more efficient method of rHSA production via a novel
approach, chloroplast genetic engineering. Modification of HSA regulatory sequences using
chloroplast untranslated regions (UTRs) resulted in rHSA accumulation of up to 11.1% of
TSP, compensating for excessive proteolytic degradation. This is 500-fold higher than
previous reports on rHSA expression upon nuclear transformation (Daniell 2003). However,
rHSA accumulated in inclusion bodies, which facilitated purification, but solubilization with
Gu-HCl and subsequent refolding was necessary for extraction. No data for functionality of
the resolubilised HSA has been reported so far. Since HSA has 17 disulfide-bridges
resolubilisation under reducing conditions and subsequent oxidative refolding is not expected
to be capable of producing high quantities of correctly folded and biologically active HSA.
This is evident from the fact that all platforms currently used for production are eucaryotic
systems and this is required to ensure proper disulfide-bridge formation. Therefore,
chloroplast expression with equal properties to procaryotic production systems seems not to
be a viable option for HSA production.
Estimates by industry suggest that the cost-effective yield for pharmaceutical production is
0.1 mg of HSA per g of fresh weight (Fernandez-San Millan et al. 2003). In this study the
highest expression level 100 µg rHSA per g leaf material could be achieved in stably
transformed tobacco plants and 100 µg rHSA per g in wheat seed, in bombarded wheat
embryos. Two different technologies were used in order to generate these transgenic plants.
Agrobacterium mediated gene transfer has a restricted host range and does not efficiently
infect monocots, where for monocots, biolistic delivery of genes is the method in use
(Christou 1995).
In conclusion, new techniques for producing transgenic plants will improve the efficiency of
the process and will help resolve some of the environmental and health concerns. Among the
expected changes are the following:
• More efficient transformation that is a higher percentage of plant cells will
successfully incorporate the transgene.
• Better marker genes to replace the usage of antibiotic genes
Chapter IV Discussion
108
• Better control of gene expression through more specific promoters, so that the inserted
gene will be active only when and where needed.
• Transfer of multi-gene DNA fragments to modify more complex traits.
IV.3.3 Expression of rHSA in plant cell suspension cultures
Culture cells are convenient for the controlled production of heterologous proteins, especially
for pharmacological application. Although most interest during the past 15-20 years has
focused on microbial and animal cell cultures, plant cells are now considered to be useful
systems for large-scale protein production (Lee et al. 2002). Plant cell cultures have several
advantages compared with microbial and animal cell cultures. They have a reduced risk of
mammalian viral contaminants, oncogenes and bacterial toxins, and they can also produce
correctly folded proteins and assemble multimeric proteins such as antibodies (Fischer et al.
1999).
In this thesis, production of rHSA in plant cells followed by secretion into the culture medium
was achieved using transgenic BY2 suspension cell culture. Accumulation levels in the cells
varied between 0.4-1.87 µg per g of cells and secretion into the culture supernatant was
0.494-1.84 µg per ml culture medium.
The human milk protein sCD14 was expressed in tobacco BY2 plant cell cultures. Tobacco
cells were transformed with either the native human signal peptide (SP) or a plant SP, under
the control of the CaMV35S promoter. The protein was detected by western blot analysis at
an estimated level of 5 µg per L in a non-soluble fraction of the culture medium (Girard et al.
2004).
Expression of rHSA in tobacco suspension culture and secretion by the cultured plant cells
into the culture medium was previously shown by Sijmons et al. (1990). The construct used
for transformation of the tobacco suspension cells contained a fusion of mature HSA with the
presequence from the pathogenesis related signal (PR-S) protein from tobacco, which is used
as the signal sequence for secretion of HSA across the plant plasma membrane. Recombinant
HSA was found to be correctly processed and indistinguishable from the authentic human
protein. It was detected in the culture medium at a level of 0.25 µg per mg protein when
compared with the cellular HSA concentration in the immunoblot and appeared to represent
the majority of the synthesized protein, suggesting almost all of it was secreted (Sijmons et al.
Chapter IV Discussion
109
1990). The highest rHSA level reported in this work, 1.87 µg per ml culture supernatant is
higher than the previously described report of Sijmons et al., although in both of the works
same CaMV35SS promoter was used. The expression cassettes used differ in two ways (i)
tobacco PR-S signal peptide versus plant codon optimized leader peptide derived from
murine light chain of TMV (ii) NOS terminator versus termination signal of CaMV35S.
Sijmons et al in his work compared usage of human and plant signal sequences and found
that only the plant-derived signal generates the authentic mature protein in plants. The human
prepro-sequence gives rise to proper targeting to the extracellular space, but yields an
intermediate precursor protein. Therefore these results prove that it was necessary to delete
the leader and hexapeptide of authentic HSA prior to cloning into expression vectors.
Foreign proteins produced in plant cell cultures are harvested from plant biomass or from
culture supernatant. Despite the dilution of the secreted protein to low concentrations in a
relatively large liquid volume, plant cell culture of foreign protein can be advantageous.
However, accumulation of the protein in the cell and in the culture medium depends largely
on its stability in the extracellular environment and this is of particular importance for
proteins with complicated structures like HSA.
During the Second World War, polyvinylpyrrolidone (PVP) was used to dilute the limited
blood supply and therefore PVP was analysed as a stabilizer in the tobacco suspension
cultures secreting rHSA. PVP with varying molecular weights were added to the HSA-
APO29 culture from the first day of subculture. Although 2.5 fold more secretion of rHSA in
to the culture medium could be achieved, increase in the stability of the protein was not
observed. Smaller truncated forms of rHSA were present in the supernatant of suspension
culture cocultivated in the presence or absence of PVP (III.3.5.2). Change in working
concentration (0.8 g/L) or addition of PVP at different time intervals was not investigated.
The use of protein stabilizing agents such as PVP has been shown to improve antibody
production in suspension cultures, suggesting that the medium is the site of antibody
degradation (La Count et al. 1997). Similarly, studies with bioactive hGM-CSF production in
tobacco suspension culture shown that, accumulation of hGM-CSF was drastically reduced
during the exponential phase of cell growth. In order to improve the yield of hGM-CSF in
tobacco suspension cultures three different polymer stabilizing agents were tested. Addition
of PVP (0.05%) and PEG (2%) could not stabilize hGM-CSF and all hGM-CSF was degraded
in 1 day. Following gelatine (2%) addition, about 90% of hGM-CSF remained stable up to
day 5, however most of the protein was degraded rapidly (Lee et al. 2002).

Chapter IV Discussion
110
In conclusion, a great advantage of plant cell suspension cultures is that recombinant protein
can be produced under certified conditions (GMP, GLP) (Torres et al. 1999). Recent
improvement in the design of novel promoters and gene targeting will lead to significant
improvements in recombinant product yields in plant cell lines that are devoid of noxious
compounds. However, media optimisation, improvement of nutrient supply, (Sato et al. 1996)
feeding of precursors or elicitors, (Yukimune et al. 1996) improved fermenter design and
agitation conditions (Böhme et al. 1997) need to be evaluated to obtain higher productivity
during extended use of plant cell suspension cultures in recombinant protein production.
IV.4 Production systems for rHSA, system of choice
Recombinant HSA production has been examined in bacteria, yeast, plant cells and transgenic
animals. Among these systems, rHSA production by Sacharomyces cerevisiae, Pichia
pastoris and Kluyveromyces lactis are being followed up to develop a commercially viable
technology. Amersham Pharmacia Biotech invented a manufacturing process to make HSA
by genetic manipulation of P. pastoris on a commercial scale. Application for government
approval of the process was lodged in 1997. The application was made under the brand name
Albrec. Typical production levels in yeast cultures are approximately 150 mg per L.
Yet the rHSA production in plants remains a reasonable strategy in view of the high
production volume with low cost (Giddings et al. 2000; Hood et al. 2002; Fischer et al.
2003). The advantages of intact plants lie in the fast biomass build-up, the low cultivation
costs and the easy storage and distribution of transgenic seed material. In this work, different
transgenic plants and tobacco suspension cultures were tested in terms of their performance in
expressing a recombinant human protein. Among these systems, tobacco and wheat were
determined to be the best producers for rHSA. In stably transformed tobacco plants,
expression levels reached 100 µg rHSA/g leaf material and in bombarded wheat embryos 100
µg rHSA/g wheat seed. Consequently, these two alternative plants represent a viable
alternative to mammalian and prokaryotic expression systems for the production of rHSA.
Chapter IV Discussion
111
IV.5 Downstream processing
HSA has been used clinically to treat a number of diseases with high dosage. It is currently
used in greater volume than any other biopharmaceutical solution that is available
(Matejtschuk et al. 2000). Extremely pure product is required in large-scale production.
Albumin is now predominantly derived from human plasma, although both time-expired
blood and in some countries, placental material have been used as sources in the past.
The classic cold ethanol precipitation method developed and it has been used for the
production of albumin from human plasma since 1946 (Cohn et al. 1946). Since then, some
pharmaceutical providers have chosen to supplement this process with additional purification
steps (Adcock et al. 1998). However, chromatographic purification of HSA has been
increasingly studied in the last few years. Application of chromatography, especially ion
exchange, affinity, and size-exclusion, has opened a new area in the production of pHSA
(plasma derived HSA). Ion exchange chromatography and hydrophobic chromatography play
a central role in the purification scheme. Integration with other chromatographic techniques
such as size-exclusion, metal chelate, and affinity gives improved purification results.
In this work, a single cation exchange chromatography step resulted in removal of most of the
plant proteins. The purification of HSA is challenging since this protein binds to various
compounds which makes it difficult to separate contaminants during downstream processing.
According to our results (III.4.1), the optimum pH lies in the range of pH 4.4 to 4.6 for cation
exchange chromatography using commercially available HSA, the optimum buffer is
determined as 0.1 M acetate buffer at pH 4.0 for extraction of rHSA from transgenic tobacco
leaves. Besides, using fresh leaves collected from greenhouse and directly processed for
extraction resulted in higher amounts of rHSA when compared with the shock frozen leaves.
In order to remove contaminating plant proteins, heating of the extract was also evaluated
however a huge loss in the recombinant protein was observed and therefore this step was not
pursued any further.
In order to verify both a correct processing of the rHSA signal peptide and an N-terminal end
identical to native HSA, Farran et al. (2002) partially purified rHSA from fresh transgenic
potato tubers. Extraction scheme included homogenization in phosphate buffer (pH 7.4), an
initial purification using DEAE Seppharose FF column, a linear gradient salt elution,
desalting using HiPrep column and affinity purification using Blue Seppharose FF column.
Chapter IV Discussion
112
Partial purification achieved this way was sufficient for amino terminal sequencing of the
rHSA.
In this study, a single step chromatography was performed by using 700 g of transgenic
tobacco leaf material. 22 mg of rHSA could be partially purified. Additional steps like salt
precipitation and affinity purification using rHSA itself or different tags must be added to the
purification protocol in order to achieve a higher level of purification. Time and cost
investments are two important factors to consider in the protocol. It is known that traditional
purification of biopharmaceuticals using columns accounts for 30% of the production cost
and 70% of the setup cost (Daniell 2003).
Recombinant HSA produced in P. pastoris yielded up to 150 mg per L broth of culture
supernatant. The rHSA was isolated and purified by hollow-fiber ultrafiltration, Phenyl-
Seppharose hydrophobic chromatography and antibody-immunoadsorbent chromatography.
And finally rHSA was purified to electrophoretic purity (Qiu et al. 2000). Kobayashi et al.
(1998) used Pichia host system as well. Fermentation process involved methanol feeding for
the secretion of rHSA into the culture broth. After optimizing the physiological and
environmental aspects of the fermentation, the production level of rHSA exceeded 10 g rHSA
per L (Kobayashi et al. 1998). The purification process employed STREAMLINE
expanded bed adsorption for direct capture of the target product. Recombinant HSA was
adsorbed to the column, while yeast cells and impurities passed through.
A combined method, whereby chromatographic purification steps supplement the cold
ethanol fractionation process has been adopted by a number of manufacturers for blood
plasma derived HSA. Addition of a single anion exchange chromatography by preparation of
the product Zenalb® markedly improved the quality of the product. Similarly, using
transgenic tobacco plants different polishing approaches like gel filtration or anion exchange
chromatography needs to be further investigated. Optimum design of these steps will lead to a
recombinant product which can then be tested for various clinical tests.
IV.6 Conclusions and future perspectives
Plants have many advantages compared with traditional systems for the molecular farming of
pharmaceutical proteins. These include the low cost of production, rapid scalability, the
absence of human pathogens and the ability to fold and assemble complex proteins accurately
(Ma et al. 2003).
Chapter IV Discussion
113
In this work it could be shown that rHSA can be produced in different organisms including
bacteria, plants and plant cell suspension cultures with varying production levels. Estimates
by industry suggest that the cost-effective yield for pharmaceutical production in plants is 0.1
mg of rHSA per g of fresh weight (Fernandez-San Millan et al. 2003). This level was
achieved when rHSA was expressed stably in the ER of N. tabacum cv. Petite Havana SR1
plants. In recent experiments we have transformed the tobacco cultivar Maryland Mammoth
that produces more biomass per hectare than Petite Havana SR1. Transient expression
analyses showed that rHSA levels were comparable to that obtained in the cultivar Petite
Havana SR1. Currently, stable transformation of this line is ongoing. These levels could be
improved by selfing and crossing elite plant lines. It has been demonstrated that recombinant
protein levels can be significantly increased using these breeding procedures (Zimmermann et
al. 1998; Hood et al. 2002). In addition to tobacco plants, wheat seeds are determined as an
alternative high- expression system and further advantage is the easy storage of the seed
kernels for prolonged time. Transgenic wheat seeds accumulating rHSA were stored for more
than 12 months without the significant loss of product yield.
Recent approvals for the commercialization of GM crops containing antibiotic resistance
markers have raised concern in Europe about the risk of spreading antibiotic resistance genes
to previously unsusceptible microbes and hence making them resistant to antibiotics used. As
a consequence governments in the European Union have recommended phasing out GM
crops containing antibiotic resistance markers by 2005 (web site
http://biosafety.ihe.be/ARGMO/Documents/EFB_AntibioticRM_English.pdf). Therefore in
order to commercialise rHSA expressed in a host organism, marker free crops should be
generated. For this purpose design of a marker free system has been carried out and a project
for the expression of this protein is ongoing.
In this thesis it could be also shown that an alternative production technology is the use of
plant cells followed by secretion into the culture medium. Fermentations of transgenic
tobacco cell lines were performed at 5 L working volume and in batch fermentation. It has
been shown that the system is productive for more than 30 days. Improvement of the batch
and continued fermentation system parameters are in progress in order to have superior
accumulation of rHSA in the culture medium.
Independent of the expression system of choice, downstream processing of the protein should
be carried in the most cost-effective way with highest percent recovery. Experiments carried
out during this study proved the importance of optimising the purification conditions. It has
Chapter IV Discussion
114
been shown that with proper extraction conditions, a single cation exchange chromatography
step led to removal of most of the plant proteins.
Further improvement in the purification strategies is necessary in order to efficiently purify
rHSA from the host organism. Purified rHSA can be than evaluated for structural identity and
function by comparing its biochemical properties to the human counterpart. Biochemical
characterization could be done using by fluorometric methods or by surface plasmon
resonance technology in order to study known interactions between various drugs (e.g.
warfarin, salicylate ion, and bilirubin) and rHSA.
Chapter V Summary
115
V Summary
Human serum albumin (HSA) is the most abundant protein in the circulatory system. The
principal function of HSA is to transport fatty acids, but it is also capable of binding a great
variety of metabolites and drugs. The potential of HSA in various applications, like usage as a
plasma expander, stabilizing agent, drug delivery protein and as an adjunct in insulin action
prolongation demands a great supply of pure HSA. Presently HSA is manufactured from the
blood pooled from commercial blood donors. There is no guarantee regarding contamination
of the product by viral pathogens and prions, causing dreadful diseases. The annual world
need exceeds 500 tons, representing a market value of more than 1.5 billion US$ (Fernandez-
San Millan et al. 2003). Considering the amount of plasma expanders required in critically ill
patients, the use of albumin represents a significant cost (Nicholson et al. 2000).
Such a huge demand can not longer be met by merely purifying HSA from original sources,
as the supply of human blood is limited. Alternative ways to obtain HSA are highly attractive
both to decrease the dependence on blood banks and to reduce possible health hazards, such
as AIDS and hepatitis that may be transmitted during/by infusion of products derived of
contaminated blood.
The initial attempt was to generate a novel plant codon optimised semi-synthetic HSA gene
by PCR amplification. The strategy was to eliminate the rare codons that are used at low
frequencies in the plant host system resulting in an optimized codon usage pattern for high-
level expression of recombinant HSA (rHSA). Sequence analysis revealed the presence of
high number mutations in the final product, including insertions and deletions of several
bases which could not be eliminated.
The main focus of the work was to establish an alternative expression system for the
production of the authentic HSA cDNA. Further analysis included expression and
characterization of rHSA in E. coli, transient expression in leaves of tobacco, zucchini and
bean, stable expression in (intact) tobacco and wheat plants and tobacco cell suspension
culture. For bacterial expression of rHSA, cytoplasmic and periplasmic expression vectors
were generated. After verifying expression in E. coli, purification of the recombinant protein
was carried out. Tobacco, zucchini and bean host systems were assessed for expression of
rHSA. No difference in transient accumulation levels were observed when the protein was
either secreted to the apoplast or targeted to endoplasmic reticulum (ER). Further analysis
Chapter V Summary
116
included stable transformation of tobacco plants via Agrobacterium mediated gene transfer.
Accumulation of rHSA in the ER and secretion into the apoplast were confirmed by
immunoblot analysis. In parallel to the expression studies in intact plants, tobacco suspension
cultures were initiated and both intracellular and secreted protein could be detected in batch
culture of the transgenic BY2 cells. Protein stability following secretion could be improved
with the addition of appropriate chemical agents (stabilizers) to the growth media. The results
achieved by all expression systems and their comparison were performed.
Finally downstream processing of the rHSA from transgenic tobacco leaves was investigated.
Conditions for an efficient extraction of the recombinant protein from plant system were
optimised and cation exchange chromatography to partially purify rHSA was carried out.
Chapter VI References
117
VI References
Adang, M. J., M. S. Brody, G. Cardineau, N. Eagan, R. T. Roush, C. K. Shewmaker, A. Jones, J. V. Oakes and K. E. McBride (1993). "The reconstruction and expression of a Bacillus thrungiensis cryIIIA gene in protoplasts and potato plants." Plant Mol Biol 21(6): 1131-45.
Adcock, W. L., A. MacGregor, J. R. Davies, M. Hattarki, D. A. Anderson and N. H. Goss (1998). "Chromatographic removal and heat inactivation of hepatitis A virus during manufacture of human albumin." Biotechnol Appl Biochem 28 ( Pt 1): 85-94.
Ali, S. and W. C. Taylor (2001). "The 3' non-coding region of a C4 photosynthesis gene increases transgene expression when combined with heterologous promoters." Plant Mol Biol 46(3): 325-33.
Artsaenko, O., M. Peisker, U. zur Nieden, U. Fiedler, E. W. Weiler, K. Muntz and U. Conrad (1995). "Expression of a single-chain Fv antibody against abscisic acid creates a wilty phenotype in transgenic tobacco." Plant J 8(5): 745-50.
Ausubel, F. M., R. Brent and R. E. Kingston (1994). Current Protocols in Molecular Biology. New York, Wiley Interscience.
Bakker, H., M. Bardor, J. W. Molthoff, V. Gomord, I. Elbers, L. H. Stevens, W. Jordi, A. Lommen, L. Faye, P. Lerouge, D. Bosch (2001). "Galactose-extended glycans of antibodies produced by transgenic plants." Proc Natl Acad Sci U S A 98(5): 2899-904
Benfey, P. N., L. Ren and N. H. Chua (1990). "Tissue-specific expression from CaMV 35S enhancer subdomains in early stages of plant development." Embo J 9(6): 1677-84.
Bernstein, B. A., R. H. Lowe and S. J. Sheen (1982). "Biomass and protein yield of tobacco grown at three plant densities." Tobacco Research 8: 1-12.
Böhme, C., M. B. Schröder, H. Jung-Heiler and J. Lehmann (1997). "Plant cell suspension culture in a bench-scale fermenter with a newly designed membrane stirrer for bubble-free aeration." Applied Microbial Biotechnology 48: 149-154.
Bradford, M. M. (1976). "A rapid and sensitive method for the quantitation of microgram quantities of protein utilizing the principle of protein-dye binding." Anal Biochem 72: 248-254.
Brocca, S., C. Schmidt-Dannert, M. Lotti, L. Alberghina and R. D. Schmid (1998). "Design, total synthesis, and functional overexpression of the Candida rugosa lip1 gene coding for a major industrial lipase." Protein Sci 7(6): 1415-22.
Brousseau, R., R. Scarpulla, W. Sung, H. M. Hsiung, S. A. Narang and R. Wu (1982). "Synthesis of a human insulin gene. V. Enzymatic assembly, cloning and characterization of the human proinsulin DNA." Gene 17(3): 279-89.
Cabanes-Macheteau, M., A. C. Fitchette-Laine, C. Loutelier-Bourhis, C. Lange, N. D. Vine, J. K. Ma, P. Lerouge and L. Faye (1999). "N-Glycosylation of a mouse IgG expressed in transgenic tobacco plants." Glycobiology 9(4): 365-72.
Carter, D. C. and X. M. He (1990). "Structure of human serum albumin." Science 249(4966): 302-3.
Chakraborty, S., N. Chakraborty and A. Datta (2000). "Increased nutritive value of transgenic potato by expressing a nonallergenic seed albumin gene from Amaranthus hypochondriacus." Proc Natl Acad Sci U S A 97(7): 3724-9.
Chavez-Barcenas, A. T., J. J. Valdez-Alarcon, M. Martinez-Trujillo, L. Chen, B. Xoconostle-Cazares, W. J. Lucas and L. Herrera-Estrella (2000). "Tissue-specific and developmental pattern of expression of the rice sps1 gene." Plant Physiol 124(2): 641-54.
Chapter VI References
118
Chen, G. F. and M. Inouye (1990). "Suppression of the negative effect of minor arginine codons on gene expression; preferential usage of minor codons within the first 25 codons of the Escherichia coli genes." Nucleic Acids Res 18(6): 1465-73.
Christensen, A. H. and P. H. Quail (1996). "Ubiquitin promoter-based vectors for high-level expression of selectable and/or screenable marker genes in monocotyledonous plants." Transgenic Res 5(3): 213-8.
Christou, P. (1995). "Particle bombardment." Methods Cell Biol 50: 375-82. Chu, L. and D. K. Robinson (2001). "Industrial choices for protein production by large-scale
cell culture." Curr Opin Biotechnol 12(2): 180-7. Cohn, E. J., L. E. Strong, W. L. Hughes, D. J. Mulford, J. N. Ashworth and M. Melin (1946).
"Preparation and properties of serum and plasma proteins. IV. A system for the separation into fractions of the protein and lipoprotein components of biological tissues and fluids." J. Am. Chem. Soc. 68: 459-475.
Coligan, J. E., A. M. Kruisbeek and D. H. Margulies (1998). Current Protocols in Immunology. New York, Wiley Interscience.
Conrad, U. and U. Fiedler (1998). "Compartment-specific accumulation of recombinant immunoglobulins in plant cells: an essential tool for antibody production and immunomodulation of physiological functions and pathogen activity." Plant Mol Biol 38(1-2): 101-9.
Cramer, C. L., J. G. Boothe and K. K. Oishi (1999). "Transgenic plants for therapeutic proteins: linking upstream and downstream strategies." Curr Top Microbiol Immunol 240: 95-118.
Cramer, C. L., D. L. Weissenborn, K. K. Oishi, E. A. Grabau, S. Bennett, E. Ponce, G. A. Grabowski and D. N. Radin (1996). "Bioproduction of human enzymes in transgenic tobacco." Ann N Y Acad Sci 792: 62-71.
Daniell, H. (2003). "Production of human serum albumin in transgenic crops withoug interfering with food or feed production." ISB NEWS REPORT.
Daniell, H., S. B. Lee, T. Panchal and P. O. Wiebe (2001). "Expression of the native cholera toxin B subunit gene and assembly as functional oligomers in transgenic tobacco chloroplasts." J Mol Biol 311(5): 1001-9.
Devinoy, E., D. Thepot, M. G. Stinnakre, M. L. Fontaine, H. Grabowski, C. Puissant, A. Pavirani and L. M. Houdebine (1994). "High level production of human growth hormone in the milk of transgenic mice: the upstream region of the rabbit whey acidic protein (WAP) gene targets transgene expression to the mammary gland." Transgenic Res 3(2): 79-89.
Dieryck, W., J. Pagnier, C. Poyart, M. C. Marden, V. Gruber, P. Bournat, S. Baudino and B. Merot (1997). "Human haemoglobin from transgenic tobacco." Nature 386(6620): 29-30.
Dillon, P. J. and C. A. Rosen (1990). "A rapid method for the construction of synthetic genes using the polymerase chain reaction." Biotechniques 9(3): 298, 300.
Doran, P. M. (2000). "Foreign protein production in plant tissue cultures." Curr Opin Biotechnol 11(2): 199-204.
Dower, W. J., J. F. Miller and C. W. Ragsdale (1988). "High efficiency transformation of E. coli by high voltage electroporation." Nucleic Acids Res 16(13): 6127-45.
Drakakaki, G., P. Christou and E. Stoger (2000). "Constitutive expression of soybean ferritin cDNA in transgenic wheat and rice results in increased iron levels in vegetative tissues but not in seeds." Transgenic Res 9(6): 445-52.
Dugaiczyk, A., S. W. Law and O. E. Dennison (1982). "Nucleotide sequence and the encoded amino acids of human serum albumin mRNA." Proc Natl Acad Sci U S A 79(1): 71-5.
Chapter VI References
119
Echelard, Y. (1996). "Recombinant protein production in transgenic animals." Curr Opin Biotechnol 7(5): 536-40.
Farran, I., J. J. Sanchez-Serrano, J. F. Medina, J. Prieto and A. M. Mingo-Castel (2002). "Targeted expression of human serum albumin to potato tubers." Transgenic Res 11(4): 337-46.
Fernandez-San Millan, A., A. Mingo-Castel, M. Miller and H. Daniell (2003). "A chloroplast transgenic approach to hyper-express and purify Human Serum Albumin, a protein highly susceptible to proteolytic degradation." Plant Biotechnology J. 1(2): 71-79.
Fischer, R., N. Emans, F. Schuster, S. Hellwig and J. Drossard (1999). "Towards molecular farming in the future: using plant-cell-suspension cultures as bioreactors." Biotechnol Appl Biochem 30(Pt 2): 109-12.
Fischer, R., Y. C. Liao and J. Drossard (1999). "Affinity-purification of a TMV-specific recombinant full-size antibody from a transgenic tobacco suspension culture." J Immunol Methods 226(1-2): 1-10.
Fischer, R., D. Schumann, S. Zimmermann, J. Drossard, M. Sack and S. Schillberg (1999). "Expression and characterization of bispecific single-chain Fv fragments produced in transgenic plants." Eur J Biochem 262(3): 810-6.
Fischer, R., R. M. Twyman and S. Schillberg (2003). "Production of antibodies in plants and their use for global health." Vaccine 21(7-8): 820-5.
Fischer, R., Y. C. Liao, K. Hoffmann, S. Schillberg and N. Emans (1999). "Molecular farming of recombinant antibodies in plants." Biol Chem 380(7-8): 825-39.
Fraley, R. T., S. G. Rogers, R. B. Horsch, P. R. Sanders, J. S. Flick, S. P. Adams, M. L. Bittner, L. A. Brand, C. L. Fink, J. S. Fry, G. R. Galluppi, S. B. Goldberg, N. L. Hoffmann and S. C. Woo (1983). "Expression of bacterial genes in plant cells." Proc Natl Acad Sci U S A 80(15): 4803-7.
Fromm, M., L. P. Taylor and V. Walbot (1985). "Expression of genes transferred into monocot and dicot plant cells by electroporation." Proc Natl Acad Sci U S A 82(17): 5824-8.
Geisse, S., H. Gram, B. Kleuser and H. P. Kocher (1996). "Eukaryotic expression systems: a comparison." Protein Expr Purif 8(3): 271-82.
Gelamo, E. L., C. H. Silva, H. Imasato and M. Tabak (2002). "Interaction of bovine (BSA) and human (HSA) serum albumins with ionic surfactants: spectroscopy and modelling." Biochim Biophys Acta 1594(1): 84-99.
Georges, F., M. Saleem and A. J. Cutler (1990). "Design and cloning of a synthetic gene for the flounder antifreeze protein and its expression in plant cells." Gene 91(2): 159-65.
Giddings, G., G. Allison, D. Brooks and A. Carter (2000). "Transgenic plants as factories for biopharmaceuticals." Nat Biotechnol 18(11): 1151-5.
Girard, L. i. c. S. e. p., M. Bastin and D. Courtois (2004). "Expression of the Human Milk Protein sCD14 in Tobacco Plant Cell Culture." Plant Cell, Tissue and Organ Culture 78(3): 253-260.
Gleave, A. P. (1992). "A versatile binary vector system with a T-DNA organisational structure conducive to efficient integration of cloned DNA into the plant genome." Plant Mol Biol 20(6): 1203-7.
Goodey, A. R. (1993). "The production of heterologous plasma proteins." Trends Biotechnol 11(10): 430-3.
Hannig, G. and S. C. Makrides (1998). "Strategies for optimizing heterologous protein expression in Escherichia coli." Trends Biotechnol 16(2): 54-60.
Hansen, G., R. D. Shillito and M. D. Chilton (1997). "T-strand integration in maize protoplasts after codelivery of a T-DNA substrate and virulence genes." Proc Natl Acad Sci U S A 94(21): 11726-30.
Chapter VI References
120
Hansen, G., D. Vaubert, D. Clerot and J. Brevet (1997). "Wound-inducible and organ-specific expression of ORF13 from Agrobacterium rhizogenes 8196 T-DNA in transgenic tobacco plants." Mol Gen Genet 254(3): 337-43.
Harvey, A. J., G. Speksnijder, L. R. Baugh, J. A. Morris and R. Ivarie (2002). "Expression of exogenous protein in the egg white of transgenic chickens." Nat Biotechnol 20(4): 396-9.
Haseloff, J., K. R. Siemering, D. C. Prasher and S. Hodge (1997). "Removal of a cryptic intron and subcellular localization of green fluorescent protein are required to mark transgenic Arabidopsis plants brightly." Proc Natl Acad Sci U S A 94(6): 2122-7.
He, X. M. and D. C. Carter (1992). "Atomic structure and chemistry of human serum albumin." Nature 358(6383): 209-15.
Heyneker, H. L., J. Shine, H. M. Goodman, H. W. Boyer, J. Rosenberg, R. E. Dickerson, S. A. Narang, K. Itakura, S. Lin and A. D. Riggs (1976). "Synthetic lac operator DNA is functional in vivo." Nature 263(5580): 748-52.
Holmes, D. S. and M. Quigley (1981). "A rapid boiling method for the preparation of bacterial plasmids." Anal Biochem 114(1): 193-7.
Hood, E. E., S. L. Woodard and M. E. Horn (2002). "Monoclonal antibody manufacturing in transgenic plants - myths and realities." Curr Opin Biotechnol 13(6): 630-5.
Hoover, D. M. and J. Lubkowski (2002). "DNAWorks: an automated method for designing oligonucleotides for PCR- based gene synthesis." Nucleic Acids Res 30(10): e43.
Horsch, R., J. E. Fry, N. Hoffman, D. Eicholtz, S. Rogers and R. Fraley (1985). "A simple and general method for transferring genes into plants." Science 227: 1229-1231.
Horvath, H., J. Huang, O. Wong, E. Kohl, T. Okita, C. G. Kannangara and D. von Wettstein (2000). "The production of recombinant proteins in transgenic barley grains." Proc Natl Acad Sci U S A 97(4): 1914-9.
Hsu, J. H., E. Harms and H. E. Umbarger (1985). "Leucine regulation of the ilvGEDA operon of Serratia marcescens by attenuation is modulated by a single leucine codon." J Bacteriol 164(1): 217-22.
Huang, J., T. D. Sutliff, L. Wu, S. Nandi, K. Benge, M. Terashima, A. H. Ralston, W. Drohan, N. Huang and R. L. Rodriguez (2001). "Expression and purification of functional human alpha-1-Antitrypsin from cultured plant cells." Biotechnol Prog 17(1): 126-33.
Ishii, T. M., P. Zerr, X. M. Xia, C. T. Bond, J. Maylie and J. P. Adelman (1998). "Site-directed mutagenesis." Methods Enzymol 293: 53-71.
James, E. and J. M. Lee (2001). "The production of foreign proteins from genetically modified plant cells." Adv Biochem Eng Biotechnol 72: 127-56.
James, E. A., C. Wang, Z. Wang, R. Reeves, J. H. Shin, N. S. Magnuson and J. M. Lee (2000). "Production and characterization of biologically active human GM-CSF secreted by genetically modified plant cells." Protein Expr Purif 19(1): 131-8.
Jarvis, P., F. Belzile and C. Dean (1997). "Inefficient and incorrect processing of the Ac transposase transcript in iae1 and wild-type Arabidopsis thaliana." Plant J 11(5): 921-31.
Jeong, K. J. and S. Y. Lee (1999). "High-level production of human leptin by fed-batch cultivation of recombinant Escherichia coli and its purification." Appl Environ Microbiol 65(7): 3027-32.
Jesnowski, R., J. Naehring and K. Wolf (1995). "A rapid and reliable method for PCR-based amplification of chromosomal and mitochondrial DNA from intact yeast cells." Curr Genet 27(4): 318-9.
Chapter VI References
121
Kang, T.-J., N.-H. Loc, M.-O. Jang and M.-S. Yang (2004). "Modification of the cholera toxin B subunit coding sequence to enhance expression in plants." Molecular Breeding 13: 143153.
Kang, H. A., E. S. Choi, W. K. Hong, J. Y. Kim, S. M. Ko, J. H. Sohn and S. K. Rhee (2000). "Proteolytic stability of recombinant human serum albumin secreted in the yeast Saccharomyces cerevisiae." Appl Microbiol Biotechnol 53(5): 575-82.
Kapila, J., R. De Rycke, M. Van Montagu and G. Angenom (1996). "An Agrobacterium-mediated transient gene expression system for intact leaves." Plant Science 122: 101-108.
Kay, R., A. Chan, M. Daly and J. McPherson (1987). "Duplication of CaMV 35S promoter sequences creates a strong enhancer for plant genes." Science 236: 1299-1302.
Kirsch, R. D. and E. Joly (1998). "An improved PCR-mutagenesis strategy for two-site mutagenesis or sequence swapping between related genes." Nucleic Acids Res 26(7): 1848-50.
Kobayashi, K., N. Nakamura, A. Sumi, T. Ohmura and K. Yokoyama (1998). "The development of recombinant human serum albumin." Ther Apher 2(4): 257-62.
Koncz, C. and J. Schell (1986). "The promoter of TL-DNA gene 5 controls the tissue specific expression of chimeric genes carried by a novel type of Agrobacterium binary vector." Mol. Gen. Genet. 204: 383-396.
Koosha, F., R. H. Muller and S. S. Davis (1989). "Polyhydroxybutyrate as a drug carrier." Crit Rev Ther Drug Carrier Syst 6(2): 117-30.
Kost, T. A. and J. P. Condreay (2002). "Recombinant baculoviruses as mammalian cell gene-delivery vectors." Trends Biotechnol 20(4): 173-80.
Koziel, M. G., N. B. Carozzi and N. Desai (1996). "Optimizing expression of transgenes with an emphasis on post- transcriptional events." Plant Mol Biol 32(1-2): 393-405.
Kragh-Hansen, U. (1990). "Structure and ligand binding properties of human serum albumin." Dan Med Bull 37(1): 57-84.
Kumagai, M. H., J. Donson, G. della-Cioppa and L. K. Grill (2000). "Rapid, high-level expression of glycosylated rice alpha-amylase in transfected plants by an RNA viral vector." Gene 245(1): 169-74.
LaCount, W., G. An and J. M. Lee (1997). "The effect of polyvinylpyrrolidone (PVP) on the heavy chain monoclonal antibody production from plant suspension cultures." Biotechnology Letters 19(1): 93-96.
Laemmli, U. K. (1970). "Cleavage of structural protein during assembly of the head of bacteriophage T4." Nature 227: 680-685.
Latta, M., M. Philit, I. Maury, F. Soubrier, P. Denefle and J. F. Mayaux (1990). "Tryptophan promoter derivatives on multicopy plasmids: a comparative analysis of expression potentials in Escherichia coli." DNA Cell Biol 9(2): 129-37.
Lawn, R. M., J. Adelman, S. C. Bock, A. E. Franke, C. M. Houck, R. C. Najarian, P. H. Seeburg and K. L. Wion (1981). "The sequence of human serum albumin cDNA and its expression in E. coli." Nucleic Acids Res 9(22): 6103-114.
Lee, J. H., N. S. Kim, T. H. Kwon, Y. S. Jang and M. S. Yang (2002). "Increased production of human granulocyte-macrophage colony stimulating factor (hGM-CSF) by the addition of stabilizing polymer in plant suspension cultures." J Biotechnol 96(3): 205-11.
Lee, J. S., S. J. Choi, H. S. Kang, W. G. Oh, K. H. Cho, T. H. Kwon, D. H. Kim, Y. S. Jang and M. S. Yang (1997). "Establishment of a transgenic tobacco cell suspension culture system for producing murine granulocyte-macrophage colony stimulating factor." Mol Cells 7(6): 783-7.
Chapter VI References
122
Lepri, O., L. Bassie, G. Safwat, P. Thu-Hang, P. Trung-Nghia, E. Holtta, P. Christou and T. Capell (2001). "Over-expression of a cDNA for human ornithine decarboxylase in transgenic rice plants alters the polyamine pool in a tissue-specific manner." Mol Genet Genomics 266(2): 303-12.
Liu, S., R. C. Bugos, N. Dharmasiri and W. W. Su (2001). "Green fluorescent protein as a secretory reporter and a tool for process optimization in transgenic plant cell cultures." J Biotechnol 87(1): 1-16.
Longo, E. and F. Vezinhet (1993). "Chromosomal rearrangements during vegetative growth of a wild strain of Saccharomyces cerevisiae." Appl Environ Microbiol 59(1): 322-6.
Lonsdale, D. M., L. J. Moisan and A. J. Harvey (1998). "The effect of altered codon usage on luciferase activity in tobacco, maize and wheat." Plant Cell Reports 17: 396399.
MacFarlane, S. A. and A. H. Popovich (2000). "Efficient expression of foreign proteins in roots from tobravirus vectors." Virology 267(1): 29-35.
Madison, J., K. Arai, Y. Sakamoto, R. D. Feld, R. A. Kyle, S. Watkins, E. Davis, Y. Matsuda, I. Amaki and F. W. Putnam (1991). "Genetic variants of serum albumin in Americans and Japanese." Proc Natl Acad Sci U S A 88(21): 9853-7.
Magnuson, N. S., P. M. Linzmaier, J. W. Gao, R. Reeves, G. An and J. M. Lee (1996). "Enhanced recovery of a secreted mammalian protein from suspension culture of genetically modified tobacco cells." Protein Expr Purif 7(2): 220-8.
Magnuson, N. S., P. M. Linzmaier, R. Reeves, G. An, K. HayGlass and J. M. Lee (1998). "Secretion of biologically active human interleukin-2 and interleukin-4 from genetically modified tobacco cells in suspension culture." Protein Expr Purif 13(1): 45-52.
Mandecki, W. and T. J. Bolling (1988). "FokI method of gene synthesis." Gene 68(1): 101-7. Matejtschuk, P., C. H. Dash and E. W. Gascoigne (2000). "Production of human albumin
solution: a continually developing colloid." Br J Anaesth 85(6): 887-95. Moloney, M. M. and L. A. Holbrook (1997). "Subcellular targeting and purification of
recombinant proteins in plant production systems." Biotechnol Genet Eng Rev 14: 321-36.
Murray, E. E., J. Lotzer and M. Eberle (1989). "Codon usage in plant genes." Nucleic Acids Res 17(2): 477-98.
Nakamura, Y., T. Gojobori and T. Ikemura (2000). "Codon usage tabulated from international DNA sequence databases: status for the year 2000." Nucleic Acids Res 28(1): 292.
Newell, C. A. (2000). "Plant transformation technology. Developments and applications." Mol Biotechnol 16(1): 53-65.
Nicholson, J. P., M. R. Wolmarans and G. R. Park (2000). "The role of albumin in critical illness." Br J Anaesth 85(4): 599-610.
O'Farrell, P. H. (1975). "High resolution two-dimensional electrophoresis of proteins." J Biol Chem 250(10): 4007-21.
Ohi, H., N. Okazaki, S. Uno, M. Miura and R. Hiramatsu (1998). "Chromosomal DNA patterns and gene stability of Pichia pastoris." Yeast 14(10): 895-903.
Ohtani, W., Y. Nawa, K. Takeshima, H. Kamuro, K. Kobayashi and T. Ohmura (1998). "Physicochemical and immunochemical properties of recombinant human serum albumin from Pichia pastoris." Anal Biochem 256(1): 56-62.
Ohtsubo, N. and M. Iwabuchi (1994). "The conserved 3'-flanking sequence, AATGGAAATG, of the wheat histone H3 gene is necessary for the accurate 3'-end formation of mRNA." Nucleic Acids Res 22(6): 1052-8.
Okabayashi, K., Y. Nakagawa, N. Hayasuke, H. Ohi, M. Miura, Y. Ishida, M. Shimizu, K. Murakami, K. Hirabayashi, H. Minamino and et al. (1991). "Secretory expression of
Chapter VI References
123
the human serum albumin gene in the yeast, Saccharomyces cerevisiae." J Biochem (Tokyo) 110(1): 103-10.
Ozer, I. and O. Tacal (2001). "Method dependence of apparent stoichiometry in the binding of salicylate ion to human serum albumin: a comparison between equilibrium dialysis and fluorescence titration." Anal Biochem 294(1): 1-6.
Park, Y. and H. Cheong (2002). "Expression and production of recombinant human interleukin-2 in potato plants." Protein Expr Purif 25(1): 160-5.
Parmenter, D. L., J. G. Boothe, G. J. van Rooijen, E. C. Yeung and M. M. Moloney (1995). "Production of biologically active hirudin in plant seeds using oleosin partitioning." Plant Mol Biol 29(6): 1167-80.
Perlak, F. J., R. L. Fuchs, D. A. Dean, S. L. McPherson and D. A. Fischhoff (1991). "Modification of the coding sequence enhances plant expression of insect control protein genes." Proc Natl Acad Sci U S A 88(8): 3324-8.
Perrin, Y., C. Vaquero, G. I., M. Sack, J. Drossard, E. Stoeger, P. Christou and R. Fisher (2000). "Transgenic pea seeds as bioreactors for the production of a single-chain Fv fragment (scFV) antibody used in cancer diagnosis and therapy." Mol Breed 6: 345-352.
Peters, T., Jr. (1985). "Serum albumin." Adv Protein Chem 37: 161-245. Petersen, C. E., C. E. Ha, K. Harohalli, J. B. Feix and N. V. Bhagavan (2000). "A dynamic
model for bilirubin binding to human serum albumin." J Biol Chem 275(28): 20985-95.
Petitpas, I., A. A. Bhattacharya, S. Twine, M. East and S. Curry (2001). "Crystal structure analysis of warfarin binding to human serum albumin: anatomy of drug site I." J Biol Chem 276(25): 22804-9.
Polson, A., T. Coetzer, J. Kruger, E. v. Maltzahn and K. J. v. d. Merwe (1985). "Improvements in the isolation of IgY from the yolks of eggs laid by immunized hens." Immunol Invest 14: 323-327.
Porta, C. and G. P. Lomonossoff (1996). "Use of viral replicons for the expression of genes in plants." Mol Biotechnol 5(3): 209-21.
Poul, M. A., M. Cerutti, H. Chaabihi, G. Devauchelle, M. Kaczorek and M. P. Lefranc (1995). "Design of cassette baculovirus vectors for the production of therapeutic antibodies in insect cells." Immunotechnology 1(3-4): 189-96.
Qiu, R. D., S. Y. Li, J. G. Chen, X. F. Wu and Z. Y. Yuan (2000). "High Expression and Purification of Recombinant Human Serum Albumin from Pichia pastoris." Sheng Wu Hua Xue Yu Sheng Wu Wu Li Xue Bao (Shanghai) 32(1): 59-62.
Quirk, A. V., M. J. Geisow, J. R. Woodrow, S. J. Burton, P. C. Wood, A. D. Sutton, R. A. Johnson and N. Dodsworth (1989). "Production of recombinant human serum albumin from Saccharomyces cerevisiae." Biotechnol Appl Biochem 11(3): 273-87.
Ramachandran, S., G. D. Buntin, J. N. All, P. L. Raymer and J. C. N. Stewart (1998). "Greenhouse and field evaluations of transgenic canola against diamondback moth, Plutella xylostella, and corn earworm, Helicoverpa zea." Entomol. Exp. Appl 88: 17-24.
Rouwendal, G. J., O. Mendes, E. J. Wolbert and A. Douwe de Boer (1997). "Enhanced expression in tobacco of the gene encoding green fluorescent protein by modification of its codon usage." Plant Mol Biol 33(6): 989-99.
Rathus, C., R. Bower and R. G. Birch (1993). "Effects of promoter, intron and enhancer elements on transient gene expression in sugar-cane and carrot protoplasts." Plant Mol Biol 23(3): 613-8.
Chapter VI References
124
Saiki, R. K., D. H. Gelfand, S. Stoffel, S. J. Scharf, R. Higuchi, G. T. Horn, K. B. Mullis and H. A. Erlich (1988). "Primer-directed enzymatic amplification of DNA with a thermostable DNA polymerase." Science 239(4839): 487-91.
Saliola, M., C. Mazzoni, N. Solimando, A. Crisa, C. Falcone, G. Jung and R. Fleer (1999). "Use of the KlADH4 promoter for ethanol-dependent production of recombinant human serum albumin in Kluyveromyces lactis." Appl Environ Microbiol 65(1): 53-60.
Sambrook, J., E. F. Fritsch and T. Maniatis (1996). Molecular Cloning - A Laboratory Manual.
Sato, K., M. Nakayama and S. J. (1996). "Culturing conditions of affecting the production of anthocyanin in suspended cell cultures of strawberry." Plant Science 113: 91-98.
Saunders, C. W., B. J. Schmidt, R. L. Mallonee and M. S. Guyer (1987). "Secretion of human serum albumin from Bacillus subtilis." J Bacteriol 169(7): 2917-25.
Schillberg, S., E. N. and F. R. (2002). "Antibody molecular farming in plants and plant cells." Phytochemistry Reviews 1: 45-54.
Scholthof, H., K. Scholthof and A. Jackson (1996). "Plant virus gene vectors for transient expression of foreign proteins in plants." Annu. Rev. Phytopathol. 34: 299-323.
Schouten, A., J. Roosien, J. M. de Boer, A. Wilmink, M. N. Rosso, D. Bosch, W. J. Stiekema, F. J. Gommers, J. Bakker and A. Schots (1997). "Improving scFv antibody expression levels in the plant cytosol." FEBS Lett 415(2): 235-41.
Sijmons, P. C., B. M. Dekker, B. Schrammeijer, T. C. Verwoerd, P. J. van den Elzen and A. Hoekema (1990). "Production of correctly processed human serum albumin in transgenic plants." Biotechnology (N Y) 8(3): 217-21.
Sleep, D., G. P. Belfield and A. R. Goodey (1990). "The secretion of human serum albumin from the yeast Saccharomyces cerevisiae using five different leader sequences." Biotechnology (N Y) 8(1): 42-6.
Staub, J. M., B. Garcia, J. Graves, P. T. Hajdukiewicz, P. Hunter, N. Nehra, V. Paradkar, M. Schlittler, J. A. Carroll, L. Spatola, D. Ward, G. Ye and D. A. Russell (2000). "High-yield production of a human therapeutic protein in tobacco chloroplasts." Nat Biotechnol 18(3): 333-8.
Stemmer, W. P., A. Crameri, K. D. Ha, T. M. Brennan and H. L. Heyneker (1995). "Single-step assembly of a gene and entire plasmid from large numbers of oligodeoxyribonucleotides." Gene 164(1): 49-53.
Stöger, E., C. Vaquero, E. Torres, M. Sack, L. Nicholson, J. Drossard, S. Williams, D. Keen, Y. Perrin, P. Christou and R. Fischer (2000). "Cereal crops as viable production and storage systems for pharmaceutical scFv antibodies." Plant Mol Biol 42(4): 583-90.
Sugio, S., A. Kashima, S. Mochizuki, M. Noda and K. Kobayashi (1999). "Crystal structure of human serum albumin at 2.5 A resolution." Protein Eng 12(6): 439-46.
Takahashi, N., Y. Takahashi, B. S. Blumberg and F. W. Putnam (1987). "Amino acid substitutions in genetic variants of human serum albumin and in sequences inferred from molecular cloning." Proc Natl Acad Sci U S A 84(13): 4413-7.
Talmadge, K. and W. Gilbert (1982). "Cellular location affects protein stability in Escherichia coli." Proc Natl Acad Sci U S A 79(6): 1830-3.
Terashima, M., Y. Murai, M. Kawamura, S. Nakanishi, T. Stoltz, L. Chen, W. Drohan, R. L. Rodriguez and S. Katoh (1999). "Production of functional human alpha 1-antitrypsin by plant cell culture." Appl Microbiol Biotechnol 52(4): 516-23.
Terzaghi, W. B. and A. R. Cashmore (1997). "Plant cell transfection by electroporation." Methods Mol Biol 62: 453-62.
Chapter VI References
125
Torres, E., C. Vaquero, L. Nicholson, M. Sack, E. Stoger, J. Drossard, P. Christou, R. Fischer and Y. Perrin (1999). "Rice cell culture as an alternative production system for functional diagnostic and therapeutic antibodies." Transgenic Res 8(6): 441-9.
Toth, R. L., S. Chapman, F. Carr and S. Santa Cruz (2001). "A novel strategy for the expression of foreign genes from plant virus vectors." FEBS Lett 489(2-3): 215-9.
Töpfer, R., M. Pröls, J. Schell and H.-H. Steinbiß (1988). "Transient gene expression in tobacco protoplasts: II. Comparison of the reporter gene system for CAT, NPTII and GUS." Plant Cell Rep 7: 225-228.
Trexler, M. M., K. A. McDonald and A. P. Jackman (2002). "Bioreactor production of human alpha(1)-antitrypsin using metabolically regulated plant cell cultures." Biotechnol Prog 18(3): 501-8.
Twyman, R. M., E. Stoger, S. Schillberg, P. Christou and R. Fischer (2003). "Molecular farming in plants: host systems and expression technology." Trends Biotechnol 21(12): 570-8.
van Hoof, A. and P. J. Green (1997). "Rare codons are not sufficient to destabilize a reporter gene transcript in tobacco." Plant Mol Biol 35(3): 383-7.
Vaquero, C., M. Sack, J. Chandler, J. Drossard, F. Schuster, M. Monecke, S. Schillberg and R. Fischer (1999). "Transient expression of a tumor-specific single-chain fragment and a chimeric antibody in tobacco leaves." Proc Natl Acad Sci U S A 96(20): 11128-33.
Velander, W. H., J. L. Johnson, R. L. Page, C. G. Russell, A. Subramanian, T. D. Wilkins, F. C. Gwazdauskas, C. Pittius and W. N. Drohan (1992). "High-level expression of a heterologous protein in the milk of transgenic swine using the cDNA encoding human protein C." Proc Natl Acad Sci U S A 89(24): 12003-7.
Voss, A., M. Niersbach, R. Hain, H. J. Hirsch, Y. C. Liao, F. Kreuzaler and R. Fischer (1995). "Reduced virus infectivity in N. tabacum secreting a TMV-specific full-size antibody." Molecular breeding 1: 39-50.
Wahl, M. F., G. An and J. M. Lee (1995). "Effects of Dimethyl Sulfoxide on heavy chain monoclonal antibody production from plant cell culture." Biotechnology Letters 17(5): 463-468.
Watkins, S., J. Madison, M. Galliano, L. Minchiotti and F. W. Putnam (1994). "Analbuminemia: three cases resulting from different point mutations in the albumin gene." Proc Natl Acad Sci U S A 91(20): 9417-21.
Weisiger, R. A., J. D. Ostrow, R. K. Koehler, C. C. Webster, P. Mukerjee, L. Pascolo and C. Tiribelli (2001). "Affinity of human serum albumin for bilirubin varies with albumin concentration and buffer composition: results of a novel ultrafiltration method." J Biol Chem 276(32): 29953-60.
Weitkamp, L. R., E. M. McDermid, J. V. Neel, J. M. Fine, C. Petrini, L. Bonazzi, V. Ortali, F. Porta, R. Tanis, D. J. Harris, T. Peters, G. Ruffini and E. Johnston (1973). "Additional data on the population distribution of human serum albumin genes; three new variants." Ann Hum Genet 37(2): 219-26.
Wu, D. Y., L. Ugozzoli, B. K. Pal, J. Qian and R. B. Wallace (1991). "The effect of temperature and oligonucleotide primer length on the specificity and efficiency of amplification by the polymerase chain reaction." DNA Cell Biol 10(3): 233-8.
Yanisch-Perron, C., J. Vieira and J. Messing (1985). "Improved M13 phage cloning vectors and host strains: nucleotide sequences of the M13mp18 and pUC19 vectors." Gene 33(1): 103-19.
Yanofsky, C. (2000). "Transcription attenuation: once viewed as a novel regulatory strategy." J Bacteriol 182(1): 1-8.
Chapter VI References
126
Yukimune, Y., H. Tabata, Y. Higashi and Y. Hara (1996). "Methyl jasmonate-induced overproduction of paclitaxel and baccatin III in Taxus cell suspension cultures." Nat Biotechnol 14(9): 1129-32
Zimmermann, S., S. Schillberg, Y. C. Liao and R. Fischer (1998). "Intracellular expression of TMV-specific single-chain Fv fragments leads to improved virus resistance in Nicotiana tabacum." Mol Breeding 4: 369-379.
Zupan, J., T. R. Muth, O. Draper and P. Zambryski (2000). "The transfer of DNA from agrobacterium tumefaciens into plants: a feast of fundamental insights." Plant J 23(1): 11-28.
Zupan, J., D. Ward and P. Zambryski (2002). "Inter-kingdom DNA transfer decoded." Nat Biotechnol 20(2): 129-31.
Chapter VII Appendices
127
VII Appendices
VII.1 Abbreviations
ABTS 2,2-Azino-di-(3-ethylbenzthiazoline sulphonate) diamonium salt
Ab Antibody
Ag Antigen
Amp Ampicillin
AP Alkaline phosphatase
BCIP 5-Bromo-4-Chloro-3-Indolyl-Phosphat
bp Base pair
BSA Bovine serum albumin
CaCl2 Calcium chloride
CaMV Cauliflower mosaic virus
Carb Carbenicillin
cDNA Complementary DNA
CHS Chalchone synthase
CI Chloroform/isoamyl alcohol (24:1)
Cys Cysteine
cv. Cultivar
DMSO Dimethyl sulfoxide
DNA Deoxyribonucleic acid
DNTP Deoxyribonucleoside triphosphate
DTT 1, 4-dithiothreitol
E. coli Escherichia coli
EDTA Ethylenediamine tetraacetic acid
ELISA Enzyme-linked Immunosorbent assay
ER Endoplasmic reticulum
Chapter VII Appendices
128
EtOH Ethanol
EtBr Ethidium bromide
Fc Fragment crystalline
g Relative centrifugal force (RCF)
GAM Goat anti-mouse antibody
GAMAP Alkaline phosphatase conjugated goat anti mouse antibody
GAR Goat anti-rabbit antibody
GSM Agrobacteria glycerol stock media
h Hour(s)
HCl Hydrochloric acid
his Histidine
HSA Human serum albumin
IEF Isoelectric focusing
IPTG Isopropyl B-D-thiogalactopyranoside
IMAC Immobilized metal ion affinity chromatography
iv intravenous
kb Kilobase pair
kDa Kilodalton
KDEL KDEL (Lys-Asp-Glu-leu) ER retention signal
Km Kanamycin
λ Lambda
L Liter
µ Micro
m Mili
M Molar
MgSO4 Magnesium sulphate
MES 2-(N-morpholino)-ethanesulphonic acid
min Minute(s)
Chapter VII Appendices
129
MPBS Non-fat skim milk powder in PBS
MgSO4 Magnesium sulphate
MOPS 3-(morpholino)propanesulfonic acid
mRNA Messenger RNA
Mw Molecular weight
N nano
nd. not detectable
nt nucleotide
NaCl Sodium chloride
NBT p-nitro blue tetrazolium chloride
Ω Ohm
OD Optical density
o/n Overnight
ORF Open reading frame
Ori Origin of replication
PAA Polyacrylamide
PAGE Polyacrylamide gel electrophoresis
PBS Phosphate buffered saline
PBST 0.1% (v/v) Tween-20 in PBS
PCI Phenol/chloroform/isoamyl alcohol (25:24:1)
PCR Polymerase chain reaction
PEG Polyethylene glycol
pH A logarithmic measure of hydrogen ion concentration
pNPP para-nitrophenyl phosphate
poly A Polyadenylation signal
PVP Polyvinyl pyrrolidone
RAC rabbit anti chicken antibodies
rHSA recombinant human serum albumin
Chapter VII Appendices
130
rif Rifampicilin
RNA Ribonucleic acid
Rnase Ribonuclease
rpm Rounds per minute
RT Reverse transcription
sec second(s)
SDS-PAGE Sodium dodecyl sulphate-polyacrylamide gel electrophoresis
Taq Thermus aquaticus
TBE Tris borate EDTA
TEMED N, N, N, N-tetramethylene-ethylenediamine
Tris Tris (Hydroxymethyl) aminomethane
Tween 20 Polyoxyethylene sorbitan monolaureate
UTR untranslated region
UV Ultraviolet
Vol. volume
v/v Volume per volume
w/v Weight per volume
w/w Weight per weight
VII.2 List of primers used for the amplification of plant
codon optimised HSA
HSAmod1-16 as forward primers and HSAmod7-32 as backward primers were used in the
reaction mix. Forward and backward primers have complementary sequences differing in
length of 21-24 nucleotides. Schematic representation of arrangement of primers for SOE
PCR of plant codon optimised HSA are given in Figure III.2.

Chapter VII Appendices
131
HSAmod1
5 GCG GAA TTC CAT GGA TGC ACA CAA GAG CGA GGT TGC TCA CCG CTT
TAA AGA TTT G 3
HSAmod2
5 GTG AAA TTG GTG AAT GAA GTC ACT GAA TTT GCA AAA ACC TGC GTG
GCT GAT GAG TCC GCT GAA AAT TGC GAC 3
HSAmod3
5 GGA GAC AAA TTG TGC ACC GTT GCA ACT CTT CGC GAA ACC TAC GGT
GAA ATG 3
HSAmod4
5 CAA GAA CCT GAG AGG AAT GAA TGC TTC 3
HSAmod5
5 GCT TTT CAC GAC AAT GAA GAG ACC TTT TTG AAA AAA TAC TTG TAC
GAA ATT GCC AGG AGG CAC CCT TAC 3
HSAmod6
5 TTT TAC GCC CCG GAA CTC CTT TTC TTT GCT AAA AGG TAC AAA GCT GCT
TTT ACC GAA TGC TGC CAA GCT G 3
HSAmod7
5 CTC AAA TGC GCC AGC CTC CAA AAA TTT GGA GAA AGG GCT TTC AAA
GCA TGG GCA GTG GCT CGC CTG AGC 3
HSAmod8
5 TTG CAG AAG TTT CCA AGT TGG TGA CCG ATC TTA CCA AAG TCC ACA
CCG AAT GCT GCC ACG GAG ATC TGC TT 3
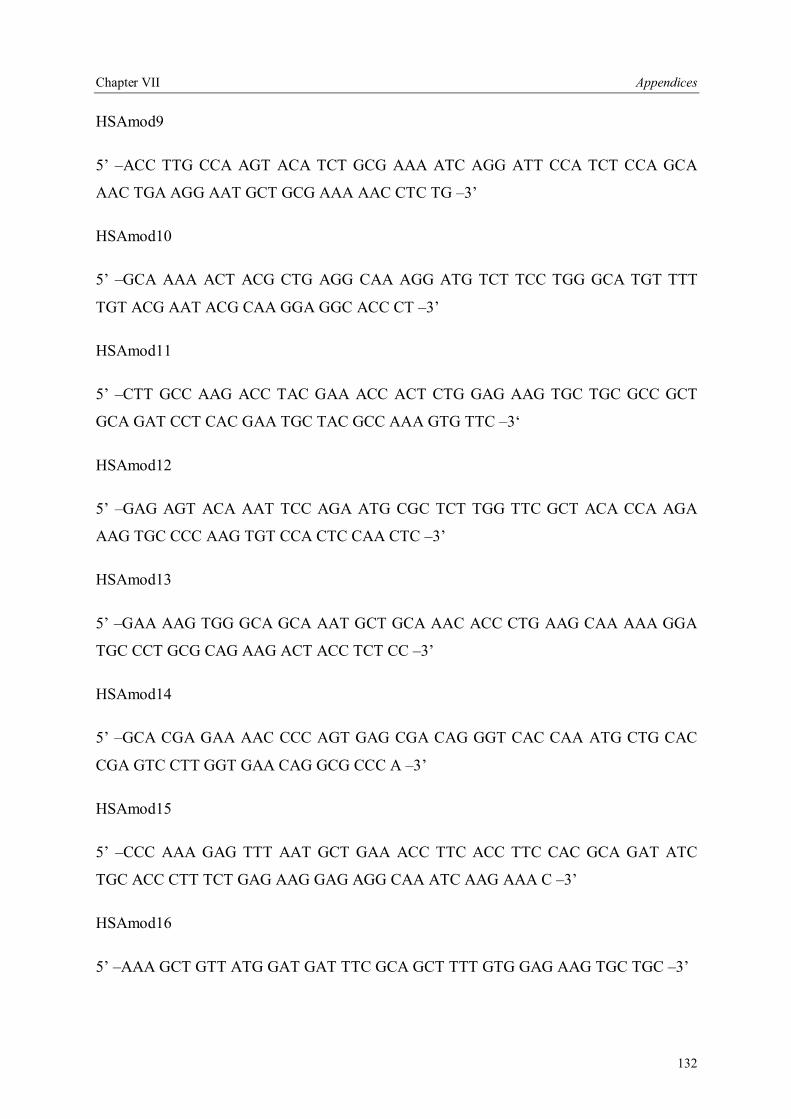
Chapter VII Appendices
132
HSAmod9
5 ACC TTG CCA AGT ACA TCT GCG AAA ATC AGG ATT CCA TCT CCA GCA
AAC TGA AGG AAT GCT GCG AAA AAC CTC TG 3
HSAmod10
5 GCA AAA ACT ACG CTG AGG CAA AGG ATG TCT TCC TGG GCA TGT TTT
TGT ACG AAT ACG CAA GGA GGC ACC CT 3
HSAmod11
5 CTT GCC AAG ACC TAC GAA ACC ACT CTG GAG AAG TGC TGC GCC GCT
GCA GAT CCT CAC GAA TGC TAC GCC AAA GTG TTC 3
HSAmod12
5 GAG AGT ACA AAT TCC AGA ATG CGC TCT TGG TTC GCT ACA CCA AGA
AAG TGC CCC AAG TGT CCA CTC CAA CTC 3
HSAmod13
5 GAA AAG TGG GCA GCA AAT GCT GCA AAC ACC CTG AAG CAA AAA GGA
TGC CCT GCG CAG AAG ACT ACC TCT CC 3
HSAmod14
5 GCA CGA GAA AAC CCC AGT GAG CGA CAG GGT CAC CAA ATG CTG CAC
CGA GTC CTT GGT GAA CAG GCG CCC A 3
HSAmod15
5 CCC AAA GAG TTT AAT GCT GAA ACC TTC ACC TTC CAC GCA GAT ATC
TGC ACC CTT TCT GAG AAG GAG AGG CAA ATC AAG AAA C 3
HSAmod16
5 AAA GCT GTT ATG GAT GAT TTC GCA GCT TTT GTG GAG AAG TGC TGC 3
Chapter VII Appendices
133
HSAmod17
5 GCC TTC GAA CAG CTG CAA GCC CAA GGC AGC TTG GCT TGC AGC AAC
AAG 3
HSAmod18
5 TGC GAA ATC ATC CAT AAC AGC TTT CAG TTG CTC TTT GGT TGC CTT GGG
C 3
HSAmod19
5 GTT TCA GCA TTA AAC TCT TTG GGA ACG TAG GTT TCA TCG ACT TCC AGA
GCG GAA AAG CAT GGG CGC CTG TTC ACC AAG GAG TC 3
HSAmod20
5 GCT CAC TGG GGT TTT CTC GTC CAA CAC GCA CAA CTG GTT CAG GAC
CAC GGA GAG GTA GTC TTC TGC GCA G 3
HSAmod21
5 GCA GCA TTT GCT GCC CAC TTT TCC GAG GTT CCT GGA GAC CTC CAC
AAG AGT TGG AGT GGA CAC TTG GGG 3
HSAmod22
5 CGC ATT CTG GAA TTT GTA CTC TCC AAG CTG CTT AA AAG CTC GCA GTT
TTG TTT GAT CAA ATT CTG AGG C 3
HSAmod23
5 AGT GGT TTC GTA GGT CTT GGC AAG CCT CAG CAG CAG CAC GAC AGA
GTA ATC AGG GTG CCT CCT TGC GTA TTC GTA 3
HSAmod24
5 CTT TGC CTC AGC GTA GTT TTT GCA AAC ATC CTT GCT TTC AAC AAA ATC
AGC AGC CAA GGA AGG CAA GTC AG 3
Chapter VII Appendices
134
HSAmod25
5 TTC GCA GAT GTA CTT GGC AAG GTC CGC CCT GTC ATC AGC GCA TTC
AAG CAG ATC TCC GTG GCA GCA TTC 3
HSAmod26
5 CAC CAA CTT GGA AAC TTC TGC AAA CTC AGC TTT GGG AAA CCT CTG
GCT CAG GCG AGC CAC TGC CCA TGC 3
HSAmod27
5 TTT TTG GAG GCT GGC GCA TTT GAG CCT CTG TTT GGC AGA GGA AGC
CTT CCC TTC ATC GCG AAG TTC ATC G 3
HSAmod28
5 AAG GAG TTC CGG GGC GTA AAA GTA AGG GTG CCT CCT GGC AAT TTC 3
HSAmod29
5 GGT CTC TTC ATT GTC GTG AAA AGC AGT GCA CAT CAC ATC AAC CTC
TGG CCT CAC CAA GCG GGG GAG GTT TG 3
HSAmod30
5 GCA TTC ATT CCT CTC AGG TTC TTG TTT TGC GCA GCA GTC AGC CAT TTC
ACC GTA GGT TTC GCG AAG 3
HSAmod31
5 TGC AAC GGT GCA CAA TTT GTC TCC AAA AAG GGT GTG AAG AGA TTT
GTC GCA ATT TTC AGC GGA CTC ATC 3
HSAmod32
5 AGT GAC TTC ATT CAC CAA TTT CAC GTG ATC TTC AAA TGG GCA CTG CTG
AAG GTA CTG AGC AAA GG 3
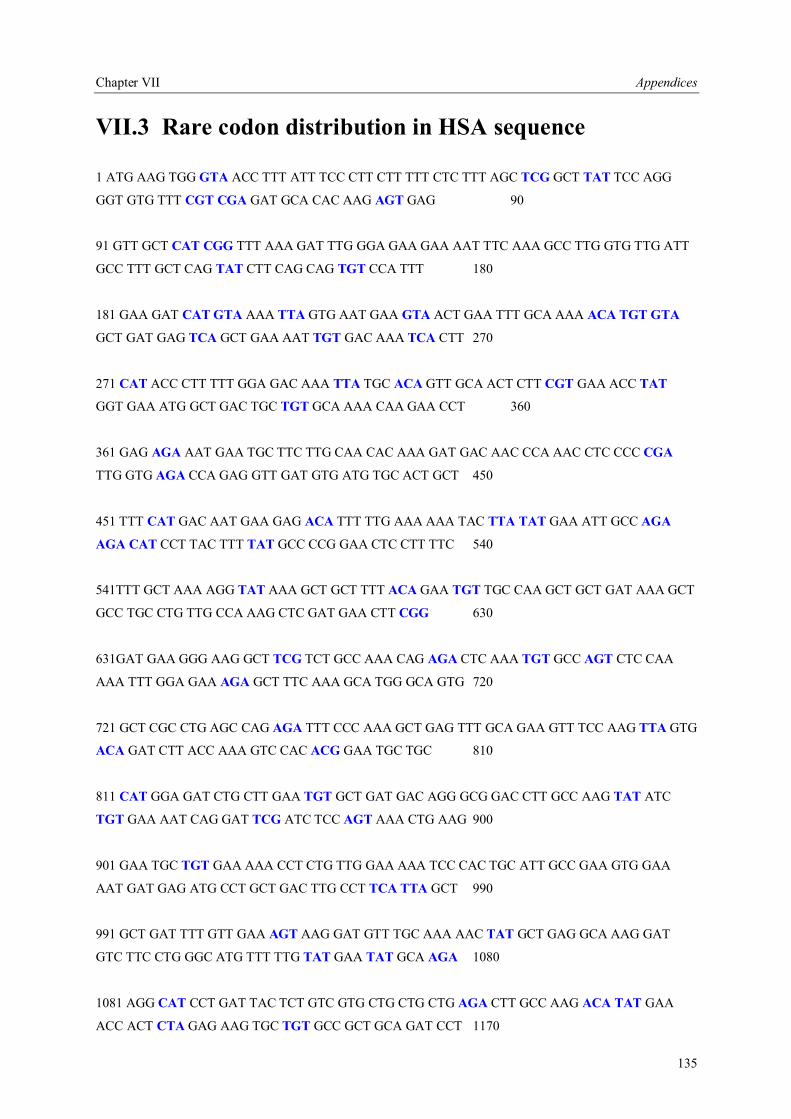
Chapter VII Appendices
135
VII.3 Rare codon distribution in HSA sequence
1 ATG AAG TGG GTA ACC TTT ATT TCC CTT CTT TTT CTC TTT AGC TCG GCT TAT TCC AGG
GGT GTG TTT CGT CGA GAT GCA CAC AAG AGT GAG 90
91 GTT GCT CAT CGG TTT AAA GAT TTG GGA GAA GAA AAT TTC AAA GCC TTG GTG TTG ATT
GCC TTT GCT CAG TAT CTT CAG CAG TGT CCA TTT 180
181 GAA GAT CAT GTA AAA TTA GTG AAT GAA GTA ACT GAA TTT GCA AAA ACA TGT GTA
GCT GAT GAG TCA GCT GAA AAT TGT GAC AAA TCA CTT 270
271 CAT ACC CTT TTT GGA GAC AAA TTA TGC ACA GTT GCA ACT CTT CGT GAA ACC TAT
GGT GAA ATG GCT GAC TGC TGT GCA AAA CAA GAA CCT 360
361 GAG AGA AAT GAA TGC TTC TTG CAA CAC AAA GAT GAC AAC CCA AAC CTC CCC CGA
TTG GTG AGA CCA GAG GTT GAT GTG ATG TGC ACT GCT 450
451 TTT CAT GAC AAT GAA GAG ACA TTT TTG AAA AAA TAC TTA TAT GAA ATT GCC AGA
AGA CAT CCT TAC TTT TAT GCC CCG GAA CTC CTT TTC 540
541TTT GCT AAA AGG TAT AAA GCT GCT TTT ACA GAA TGT TGC CAA GCT GCT GAT AAA GCT
GCC TGC CTG TTG CCA AAG CTC GAT GAA CTT CGG 630
631GAT GAA GGG AAG GCT TCG TCT GCC AAA CAG AGA CTC AAA TGT GCC AGT CTC CAA
AAA TTT GGA GAA AGA GCT TTC AAA GCA TGG GCA GTG 720
721 GCT CGC CTG AGC CAG AGA TTT CCC AAA GCT GAG TTT GCA GAA GTT TCC AAG TTA GTG
ACA GAT CTT ACC AAA GTC CAC ACG GAA TGC TGC 810
811 CAT GGA GAT CTG CTT GAA TGT GCT GAT GAC AGG GCG GAC CTT GCC AAG TAT ATC
TGT GAA AAT CAG GAT TCG ATC TCC AGT AAA CTG AAG 900
901 GAA TGC TGT GAA AAA CCT CTG TTG GAA AAA TCC CAC TGC ATT GCC GAA GTG GAA
AAT GAT GAG ATG CCT GCT GAC TTG CCT TCA TTA GCT 990
991 GCT GAT TTT GTT GAA AGT AAG GAT GTT TGC AAA AAC TAT GCT GAG GCA AAG GAT
GTC TTC CTG GGC ATG TTT TTG TAT GAA TAT GCA AGA 1080
1081 AGG CAT CCT GAT TAC TCT GTC GTG CTG CTG CTG AGA CTT GCC AAG ACA TAT GAA
ACC ACT CTA GAG AAG TGC TGT GCC GCT GCA GAT CCT 1170
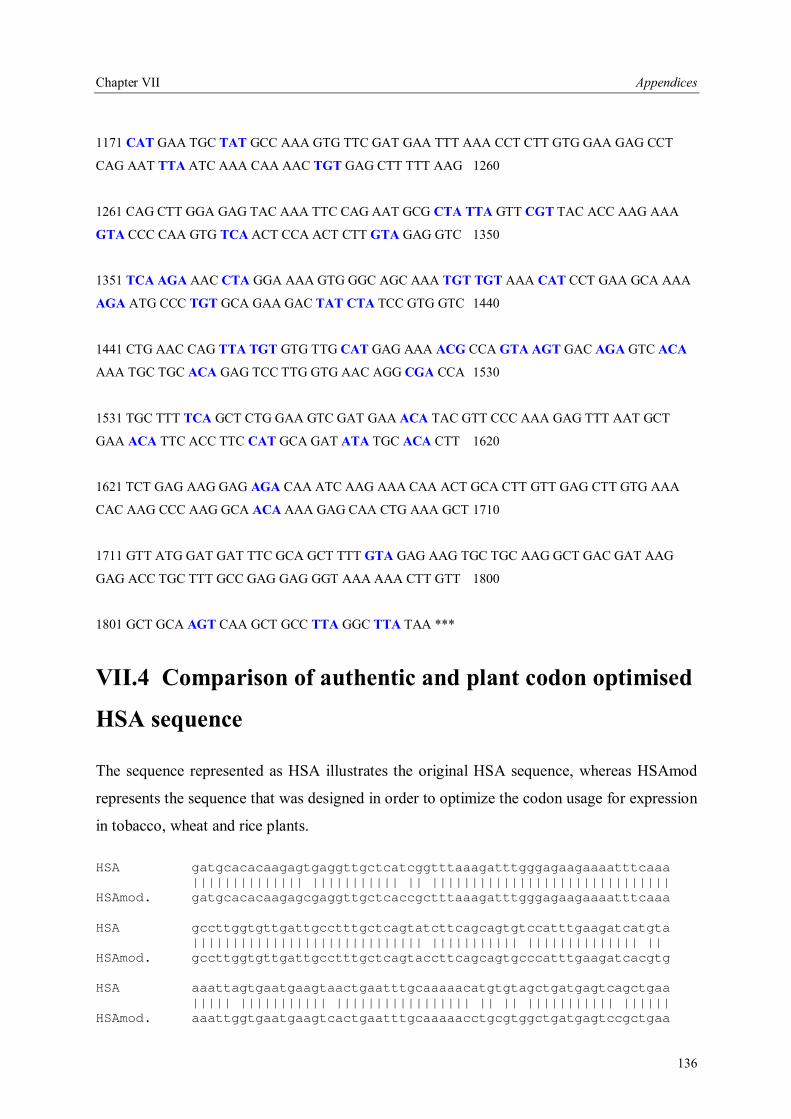
Chapter VII Appendices
136
1171 CAT GAA TGC TAT GCC AAA GTG TTC GAT GAA TTT AAA CCT CTT GTG GAA GAG CCT
CAG AAT TTA ATC AAA CAA AAC TGT GAG CTT TTT AAG 1260
1261 CAG CTT GGA GAG TAC AAA TTC CAG AAT GCG CTA TTA GTT CGT TAC ACC AAG AAA
GTA CCC CAA GTG TCA ACT CCA ACT CTT GTA GAG GTC 1350
1351 TCA AGA AAC CTA GGA AAA GTG GGC AGC AAA TGT TGT AAA CAT CCT GAA GCA AAA
AGA ATG CCC TGT GCA GAA GAC TAT CTA TCC GTG GTC 1440
1441 CTG AAC CAG TTA TGT GTG TTG CAT GAG AAA ACG CCA GTA AGT GAC AGA GTC ACA
AAA TGC TGC ACA GAG TCC TTG GTG AAC AGG CGA CCA 1530
1531 TGC TTT TCA GCT CTG GAA GTC GAT GAA ACA TAC GTT CCC AAA GAG TTT AAT GCT
GAA ACA TTC ACC TTC CAT GCA GAT ATA TGC ACA CTT 1620
1621 TCT GAG AAG GAG AGA CAA ATC AAG AAA CAA ACT GCA CTT GTT GAG CTT GTG AAA
CAC AAG CCC AAG GCA ACA AAA GAG CAA CTG AAA GCT 1710
1711 GTT ATG GAT GAT TTC GCA GCT TTT GTA GAG AAG TGC TGC AAG GCT GAC GAT AAG
GAG ACC TGC TTT GCC GAG GAG GGT AAA AAA CTT GTT 1800
1801 GCT GCA AGT CAA GCT GCC TTA GGC TTA TAA ***
VII.4 Comparison of authentic and plant codon optimised
HSA sequence
The sequence represented as HSA illustrates the original HSA sequence, whereas HSAmod
represents the sequence that was designed in order to optimize the codon usage for expression
in tobacco, wheat and rice plants.
HSA gatgcacacaagagtgaggttgctcatcggtttaaagatttgggagaagaaaatttcaaa |||||||||||||| ||||||||||| || |||||||||||||||||||||||||||||| HSAmod. gatgcacacaagagcgaggttgctcaccgctttaaagatttgggagaagaaaatttcaaa HSA gccttggtgttgattgcctttgctcagtatcttcagcagtgtccatttgaagatcatgta ||||||||||||||||||||||||||||| ||||||||||| |||||||||||||| || HSAmod. gccttggtgttgattgcctttgctcagtaccttcagcagtgcccatttgaagatcacgtg HSA aaattagtgaatgaagtaactgaatttgcaaaaacatgtgtagctgatgagtcagctgaa ||||| ||||||||||| ||||||||||||||||| || || ||||||||||| |||||| HSAmod. aaattggtgaatgaagtcactgaatttgcaaaaacctgcgtggctgatgagtccgctgaa
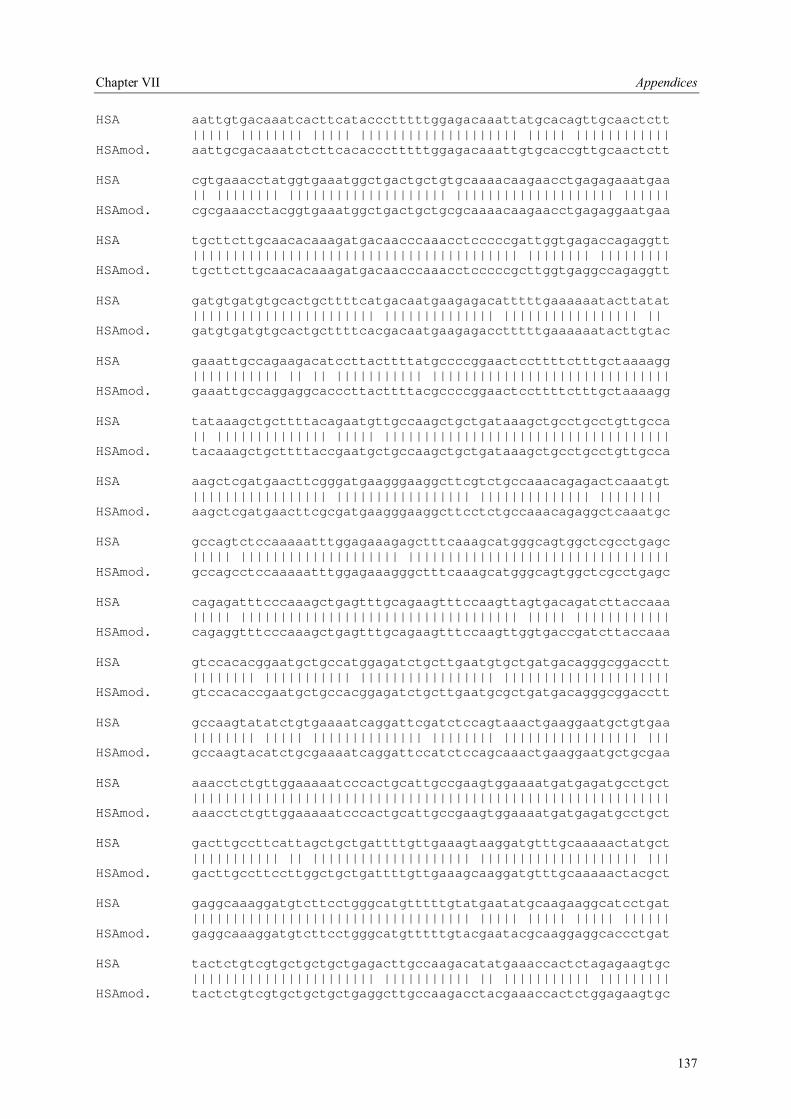
Chapter VII Appendices
137
HSA aattgtgacaaatcacttcataccctttttggagacaaattatgcacagttgcaactctt ||||| |||||||| ||||| |||||||||||||||||||| ||||| |||||||||||| HSAmod. aattgcgacaaatctcttcacaccctttttggagacaaattgtgcaccgttgcaactctt HSA cgtgaaacctatggtgaaatggctgactgctgtgcaaaacaagaacctgagagaaatgaa || |||||||| |||||||||||||||||||| |||||||||||||||||||| |||||| HSAmod. cgcgaaacctacggtgaaatggctgactgctgcgcaaaacaagaacctgagaggaatgaa HSA tgcttcttgcaacacaaagatgacaacccaaacctcccccgattggtgagaccagaggtt ||||||||||||||||||||||||||||||||||||||||| |||||||| ||||||||| HSAmod. tgcttcttgcaacacaaagatgacaacccaaacctcccccgcttggtgaggccagaggtt HSA gatgtgatgtgcactgcttttcatgacaatgaagagacatttttgaaaaaatacttatat ||||||||||||||||||||||| |||||||||||||| ||||||||||||||||| || HSAmod. gatgtgatgtgcactgcttttcacgacaatgaagagacctttttgaaaaaatacttgtac HSA gaaattgccagaagacatccttacttttatgccccggaactccttttctttgctaaaagg ||||||||||| || || ||||||||||| |||||||||||||||||||||||||||||| HSAmod. gaaattgccaggaggcacccttacttttacgccccggaactccttttctttgctaaaagg HSA tataaagctgcttttacagaatgttgccaagctgctgataaagctgcctgcctgttgcca || |||||||||||||| ||||| |||||||||||||||||||||||||||||||||||| HSAmod. tacaaagctgcttttaccgaatgctgccaagctgctgataaagctgcctgcctgttgcca HSA aagctcgatgaacttcgggatgaagggaaggcttcgtctgccaaacagagactcaaatgt ||||||||||||||||| ||||||||||||||||| |||||||||||||| |||||||| HSAmod. aagctcgatgaacttcgcgatgaagggaaggcttcctctgccaaacagaggctcaaatgc HSA gccagtctccaaaaatttggagaaagagctttcaaagcatgggcagtggctcgcctgagc ||||| |||||||||||||||||||| ||||||||||||||||||||||||||||||||| HSAmod. gccagcctccaaaaatttggagaaagggctttcaaagcatgggcagtggctcgcctgagc HSA cagagatttcccaaagctgagtttgcagaagtttccaagttagtgacagatcttaccaaa ||||| ||||||||||||||||||||||||||||||||||| ||||| |||||||||||| HSAmod. cagaggtttcccaaagctgagtttgcagaagtttccaagttggtgaccgatcttaccaaa HSA gtccacacggaatgctgccatggagatctgcttgaatgtgctgatgacagggcggacctt |||||||| ||||||||||| ||||||||||||||||| ||||||||||||||||||||| HSAmod. gtccacaccgaatgctgccacggagatctgcttgaatgcgctgatgacagggcggacctt HSA gccaagtatatctgtgaaaatcaggattcgatctccagtaaactgaaggaatgctgtgaa |||||||| ||||| |||||||||||||| |||||||| ||||||||||||||||| ||| HSAmod. gccaagtacatctgcgaaaatcaggattccatctccagcaaactgaaggaatgctgcgaa HSA aaacctctgttggaaaaatcccactgcattgccgaagtggaaaatgatgagatgcctgct |||||||||||||||||||||||||||||||||||||||||||||||||||||||||||| HSAmod. aaacctctgttggaaaaatcccactgcattgccgaagtggaaaatgatgagatgcctgct HSA gacttgccttcattagctgctgattttgttgaaagtaaggatgtttgcaaaaactatgct ||||||||||| || |||||||||||||||||||| |||||||||||||||||||| ||| HSAmod. gacttgccttccttggctgctgattttgttgaaagcaaggatgtttgcaaaaactacgct HSA gaggcaaaggatgtcttcctgggcatgtttttgtatgaatatgcaagaaggcatcctgat ||||||||||||||||||||||||||||||||||| ||||| ||||| ||||| |||||| HSAmod. gaggcaaaggatgtcttcctgggcatgtttttgtacgaatacgcaaggaggcaccctgat HSA tactctgtcgtgctgctgctgagacttgccaagacatatgaaaccactctagagaagtgc ||||||||||||||||||||||| ||||||||||| || ||||||||||| ||||||||| HSAmod. tactctgtcgtgctgctgctgaggcttgccaagacctacgaaaccactctggagaagtgc
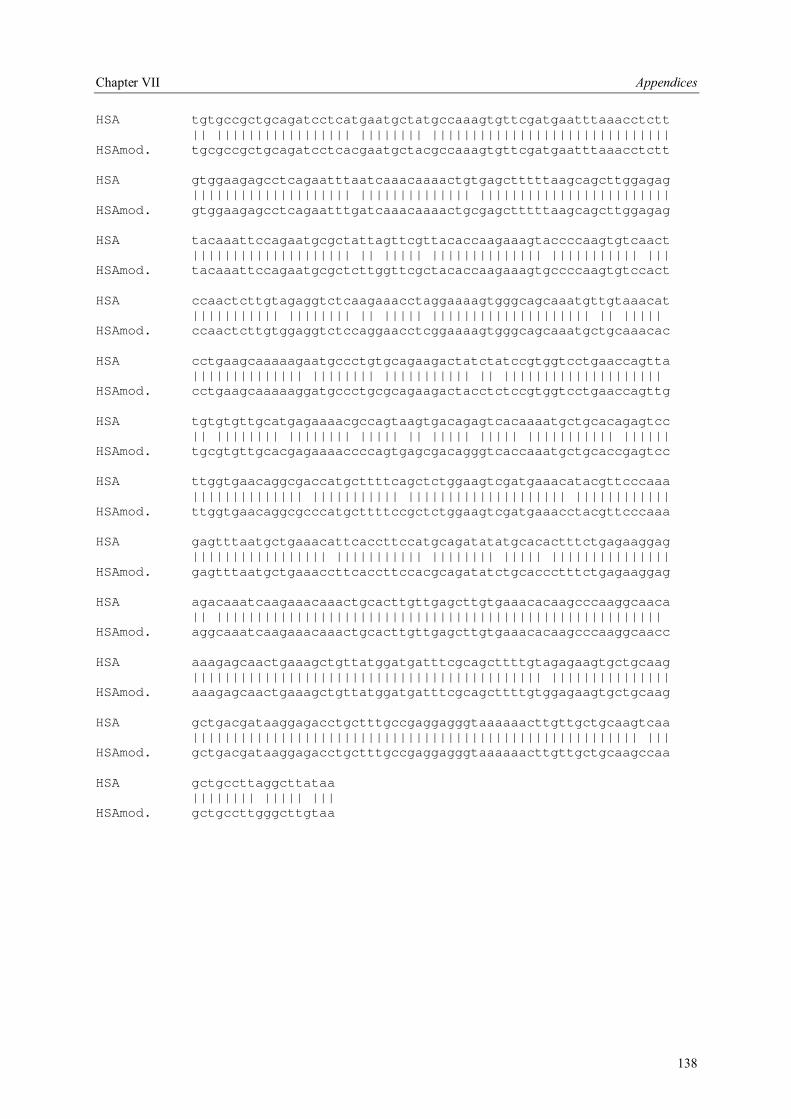
Chapter VII Appendices
138
HSA tgtgccgctgcagatcctcatgaatgctatgccaaagtgttcgatgaatttaaacctctt || ||||||||||||||||| |||||||| |||||||||||||||||||||||||||||| HSAmod. tgcgccgctgcagatcctcacgaatgctacgccaaagtgttcgatgaatttaaacctctt HSA gtggaagagcctcagaatttaatcaaacaaaactgtgagctttttaagcagcttggagag |||||||||||||||||||| |||||||||||||| |||||||||||||||||||||||| HSAmod. gtggaagagcctcagaatttgatcaaacaaaactgcgagctttttaagcagcttggagag HSA tacaaattccagaatgcgctattagttcgttacaccaagaaagtaccccaagtgtcaact |||||||||||||||||||| || ||||| |||||||||||||| ||||||||||| ||| HSAmod. tacaaattccagaatgcgctcttggttcgctacaccaagaaagtgccccaagtgtccact HSA ccaactcttgtagaggtctcaagaaacctaggaaaagtgggcagcaaatgttgtaaacat ||||||||||| |||||||| || ||||| |||||||||||||||||||| || ||||| HSAmod. ccaactcttgtggaggtctccaggaacctcggaaaagtgggcagcaaatgctgcaaacac HSA cctgaagcaaaaagaatgccctgtgcagaagactatctatccgtggtcctgaaccagtta |||||||||||||| |||||||| ||||||||||| || |||||||||||||||||||| HSAmod. cctgaagcaaaaaggatgccctgcgcagaagactacctctccgtggtcctgaaccagttg HSA tgtgtgttgcatgagaaaacgccagtaagtgacagagtcacaaaatgctgcacagagtcc || |||||||| |||||||| ||||| || ||||| ||||| ||||||||||| |||||| HSAmod. tgcgtgttgcacgagaaaaccccagtgagcgacagggtcaccaaatgctgcaccgagtcc HSA ttggtgaacaggcgaccatgcttttcagctctggaagtcgatgaaacatacgttcccaaa |||||||||||||| ||||||||||| |||||||||||||||||||| |||||||||||| HSAmod. ttggtgaacaggcgcccatgcttttccgctctggaagtcgatgaaacctacgttcccaaa HSA gagtttaatgctgaaacattcaccttccatgcagatatatgcacactttctgagaaggag ||||||||||||||||| ||||||||||| |||||||| ||||| ||||||||||||||| HSAmod. gagtttaatgctgaaaccttcaccttccacgcagatatctgcaccctttctgagaaggag HSA agacaaatcaagaaacaaactgcacttgttgagcttgtgaaacacaagcccaaggcaaca || |||||||||||||||||||||||||||||||||||||||||||||||||||||||| HSAmod. aggcaaatcaagaaacaaactgcacttgttgagcttgtgaaacacaagcccaaggcaacc HSA aaagagcaactgaaagctgttatggatgatttcgcagcttttgtagagaagtgctgcaag |||||||||||||||||||||||||||||||||||||||||||| ||||||||||||||| HSAmod. aaagagcaactgaaagctgttatggatgatttcgcagcttttgtggagaagtgctgcaag HSA gctgacgataaggagacctgctttgccgaggagggtaaaaaacttgttgctgcaagtcaa |||||||||||||||||||||||||||||||||||||||||||||||||||||||| ||| HSAmod. gctgacgataaggagacctgctttgccgaggagggtaaaaaacttgttgctgcaagccaa HSA gctgccttaggcttataa |||||||| ||||| ||| HSAmod. gctgccttgggcttgtaa
Chapter VII Appendices
139
VII.5 Figures
Figure I.1 Schematic presentation of the production of a recombinant protein of
therapeutic interest in transgenic tobacco plants, suspension cell cultures and transiently
transformed tobacco leaves. ............................................................................................... 5
Figure I.2 The 3 dimensional structure of HSA............................................................ 14
Figure I.3 Schematic presentation of the thesis work packages. ................................... 21
Figure III.1 SDS PAGE analysis (A) and titer determination (B) of polyclonal antibodies
purified from chicken egg yolk............................................................................................ 56
Figure III.2 Diagram of overlapping cDNA inserts (A); Analysis of SOE PCR (II.2.3.6.2)
by agarose gel electrophoresis (B). ...................................................................................... 57
Figure III.3 Schematic representation of primer arrangement to generate the plant codon
optimized rHSA. ................................................................................................................. 59
Figure III.4 Schematic representation of PCR amplification of plant codon optimized
rHSA (A); Analysis of PCR products by agarose gel electrophoresis (B)............................. 60
Figure III.5 Schematic representation of fragment assembly by SOE PCR-I (A); Analysis
of SOE PCR products by agarose gel electrophoresis (B). ................................................... 61
Figure III.6 Schematic representation of fragment assembly by SOE PCR-II (A); Analysis
of SOE PCR products by agarose gel electrophoresis (B). ................................................... 62
Figure III.7 Schematic representation of the mutations in the plant codon optimized
rHSA .................................................................................................................... 63
Figure III.8 Construction of pSSH1 plant expression vectors HSA-APO and
HSA-KDEL .................................................................................................................... 65
Figure III.9 SDS-PAGE (A) and Immunoblot analysis (B) of purified rHSA from E. coli
BL21λDE3 cytoplasm. ........................................................................................................ 66
Figure III.10 Immunoblot analysis of HSA-APO (A) and HSA-KDEL (B) transiently
expressed in N. tabacum cv. Petite Havana SR1 leaves........................................................ 68
Figure III.11 Determination of rHSA accumulation levels in transiently transformed
tobacco cultivars by ELISA................................................................................................. 69
Figure III.12 Determination of rHSA accumulation levels in transiently transformed
zucchini, SR1 and bean leaves by ELISA............................................................................ 71
Figure III.13 Screening of stable transgenic tobacco plants expressing HSA-APO. .......... 72
Figure III.14 Screening of stable transgenic SR1 plants expressing HSA-KDEL. ............. 73
Chapter VII Appendices
140
Figure III.15 Screening of stable transgenic T2 plants producing HSA-APO and HSA-
KDEL .................................................................................................................... 76
Figure III.16 Determination of rHSA accumulation levels in homozygous T2 lines by
ELISA .................................................................................................................... 76
Figure III.17 Immunoblot analysis of transgenic HSA-KDEL T4 tobacco leaves. ............. 78
Figure III.18 Comparative two dimensional gel electrophoresis and Immunoblot analysis of
wild type (A) and transgenic (B) T4 stable tobacco expressing rHSA in ER. ....................... 79
Figure III.19 Immunoblot analysis of the ER targeted rHSA extracted from transgenic
wheat kernels. .................................................................................................................... 81
Figure III.20 Determination of rHSA levels in the culture medium (A) and in BY2 cells (B)
by ELISA. .................................................................................................................... 82
Figure III.21 rHSA accumulation in the culture medium of the HSA-APO29 cells grown in
the absence or presence of stabilizing agents. ...................................................................... 84
Figure III.22 rHSA accumulation in the culture medium of the HSA-APO29 cells grown in
the absence or presence of PVP with varying molecular weight........................................... 85
Figure III.23 Immunoblot analysis secreted rHSA from HSAcmyc29 cells grown in the
presence or absence of PVP with varying molecular weight. ............................................... 86
Figure III.24 Cation exchange chromatography of commercially available HSA. ............. 87
Figure III.25 Determination of rHSA in tobacco leaves using different plant extraction
buffers. .................................................................................................................... 89
Figure III.26 SDS PAGE (A) and immunoblot analysis (B) of rHSA extracted from
transgenic HSAKDEL31 N. Tabacum SR1 leaves using different buffers............................ 90
Figure III.27 SDS PAGE (A) and immunoblot analysis (B) of rHSA extracted from fresh
and frozen transgenic HSAKDEL31 leaves. ........................................................................ 91
Figure III.28 SDS PAGE (A) and immunoblot analysis (B) of rHSA after partial
purification by CEX. ........................................................................................................... 93
Figure III.29 Cation exchange chromatography of rHSA from transgenic tobacco plants. 95
Figure III.30 SDS PAGE (A) and immunoblot analysis (B) of rHSA after partial
purification via CEX. .......................................................................................................... 95
Figure III.31 SDS PAGE of rHSA after partial purification via CEX................................ 97
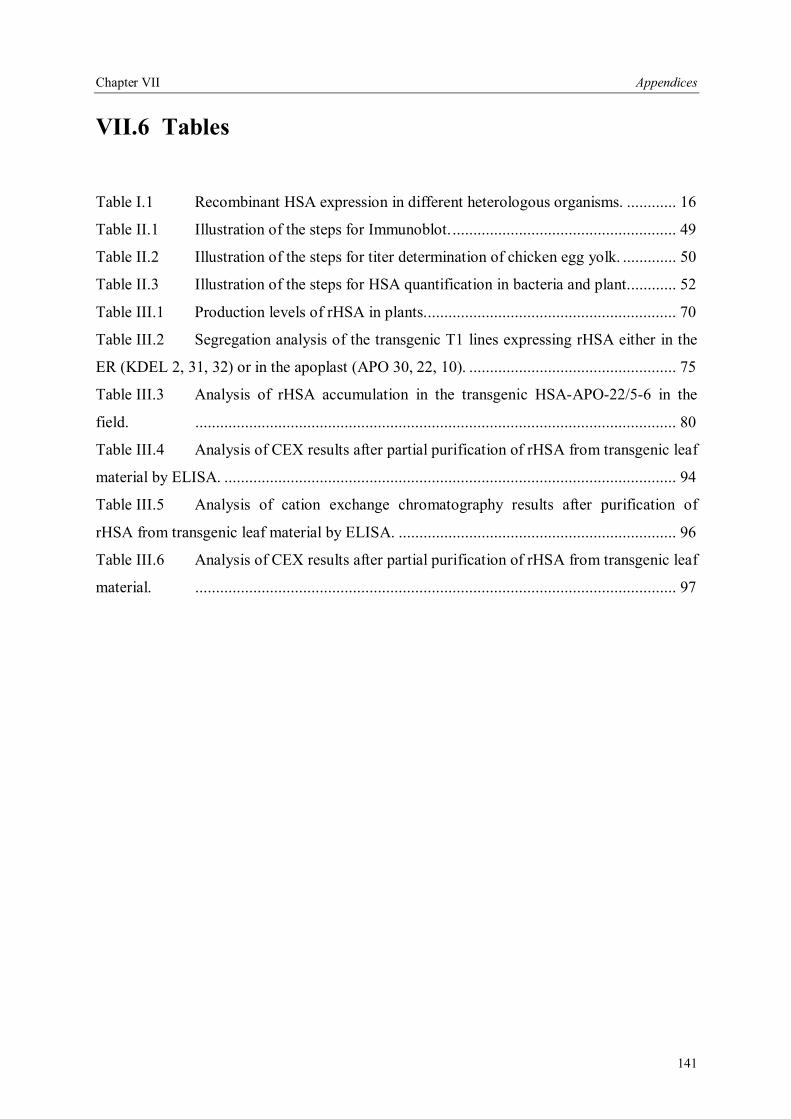
Chapter VII Appendices
141
VII.6 Tables
Table I.1 Recombinant HSA expression in different heterologous organisms. ............ 16
Table II.1 Illustration of the steps for Immunoblot. ...................................................... 49
Table II.2 Illustration of the steps for titer determination of chicken egg yolk. ............. 50
Table II.3 Illustration of the steps for HSA quantification in bacteria and plant............ 52
Table III.1 Production levels of rHSA in plants............................................................. 70
Table III.2 Segregation analysis of the transgenic T1 lines expressing rHSA either in the
ER (KDEL 2, 31, 32) or in the apoplast (APO 30, 22, 10). .................................................. 75
Table III.3 Analysis of rHSA accumulation in the transgenic HSA-APO-22/5-6 in the
field. .................................................................................................................... 80
Table III.4 Analysis of CEX results after partial purification of rHSA from transgenic leaf
material by ELISA. ............................................................................................................. 94
Table III.5 Analysis of cation exchange chromatography results after purification of
rHSA from transgenic leaf material by ELISA. ................................................................... 96
Table III.6 Analysis of CEX results after partial purification of rHSA from transgenic leaf
material. .................................................................................................................... 97
142
Acknowledgement It gives me great pleasure to acknowledge the people who contributed directly and indirectly to the completion of this thesis. I am greatly indebted to my supervisor, Professor Dr. Rainer Fisher for providing me this thesis and giving me a chance to work in Department of Molecular Biology at the Institute for Biology VII in Aachen. His support during my difficult times has been of great value for me. I am also thankful to him for the critical reading of the manuscript and his availability as an examiner. I am deeply grateful to Professor Dr. F. Kreuzaler, Head of the Botanical Institute, Aachen Technical University for reviewing the thesis and agreeing to be the co-examiner. I express sincere gratitude to Professor Dr. A. M. Gressner, Head of the Clinical Chemistry in University Hospital Aachen, for his encouragement and agreement to act as a co-examiner. I owe my most special thanks to Dr. Stefan Schillberg for entrusting me with this project. His understanding, encouraging and personal guidance have provided a good basis for the present thesis. I am also thankful to him for his detailed review, constructive criticism and excellent advice during the preparation of this thesis. He was the person I could always turn to. I also like to thank to Dr. Simone Dorfmüller for her valuable friendship. I appreciate her very much for her correction of this thesis, her helpful comments and also encouragement during the course of my doctoral work and writing this thesis. During this work I had to chance to work with many colleagues of different nationalities for whom I have great regard, and I wish to extend my warmest thanks to all those who have supported me. Without this people, listed in alphabetical order here, life inside and outside of the lab could be much more difficult. So, thank you for being a friend and a colleague; Adel, Carmen, Flora, Greta, Hatice, Holger, Kerstin, Markus, Neil, Rajan, Richa, Sabine, Siham, Simone, Sonal and Stefano. Furthermore I like to thank to all members of the Institute for Biology VII. I am very grateful for the cooperative spirit and the excellent working atmosphere, creating a unique setting for intellectual explorations. Not only the international friends but also my national friends were always supporting me during all these years in Aachen. So thank you Türkisch Mafia including the members of Hatice, Atalay, Ahmet, Canan, Ercüment, Sevgi, Ümit, Nursen, Perihan, Ali, Erdal and Gönül. Dostluğumuzun kollarõ birbirimizi dünyanõn bir ucundan bir ucuna kucaklayabilecek kadar uzundur. Most of all Hatice for her untiring support, love and the unlimited belief in me. Kedicigim biliyorum derdimde hep yanimdasin, sevincimde sen de mutlu. Hep böyle tatli kal canim arkadasim. Last, but not least I want to thank my brother Riza Mavituna and his wife and my new sister Rahsan Mavituna, for their love and support from my first day till this achievement. This thesis is dedicated to a very special woman who unfortunately could not read these sentences. But I am sure she is somewhere proud of her little daughter finally by getting her degree. Without her, none of this would have been possible at all.
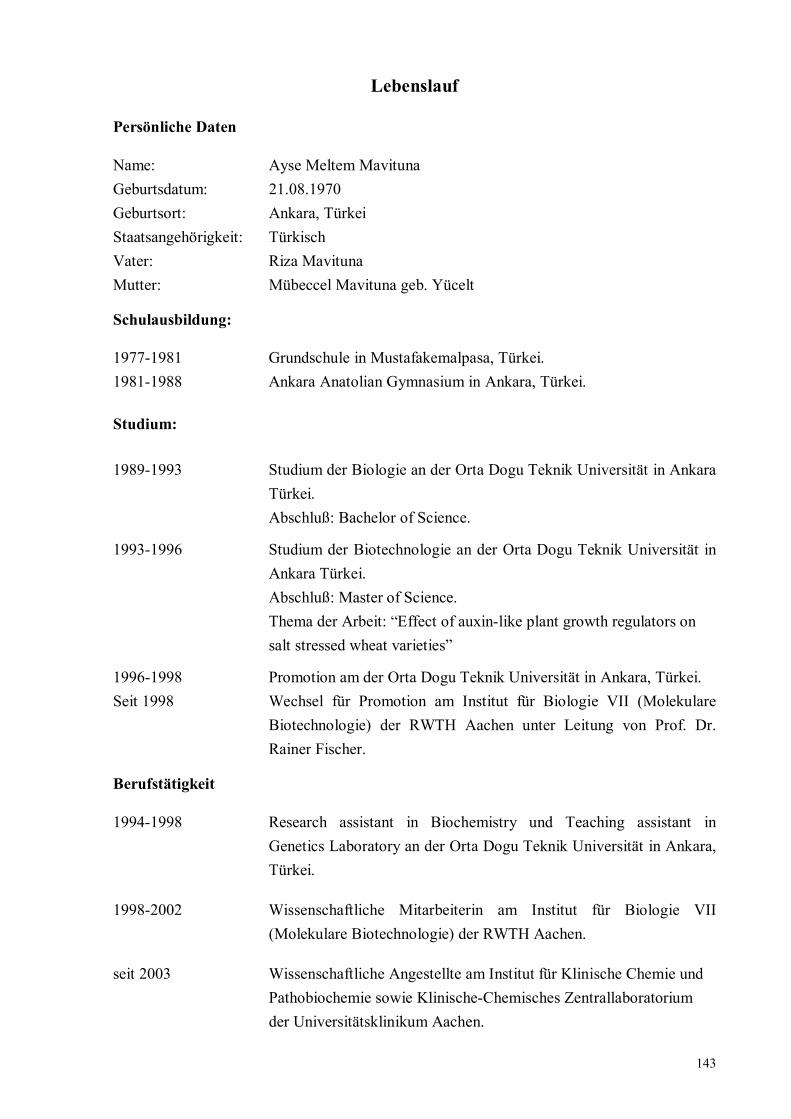
143
Lebenslauf Persönliche Daten
Name: Ayse Meltem Mavituna Geburtsdatum: 21.08.1970 Geburtsort: Ankara, Türkei Staatsangehörigkeit: Türkisch Vater: Riza Mavituna Mutter: Mübeccel Mavituna geb. Yücelt Schulausbildung:
1977-1981 Grundschule in Mustafakemalpasa, Türkei. 1981-1988 Ankara Anatolian Gymnasium in Ankara, Türkei.
Studium:
1989-1993 Studium der Biologie an der Orta Dogu Teknik Universität in Ankara Türkei.
Abschluß: Bachelor of Science.
1993-1996 Studium der Biotechnologie an der Orta Dogu Teknik Universität in Ankara Türkei.
Abschluß: Master of Science. Thema der Arbeit: Effect of auxin-like plant growth regulators on salt stressed wheat varieties
1996-1998 Promotion am der Orta Dogu Teknik Universität in Ankara, Türkei. Seit 1998 Wechsel für Promotion am Institut für Biologie VII (Molekulare
Biotechnologie) der RWTH Aachen unter Leitung von Prof. Dr. Rainer Fischer.
Berufstätigkeit
1994-1998 Research assistant in Biochemistry und Teaching assistant in Genetics Laboratory an der Orta Dogu Teknik Universität in Ankara, Türkei.
1998-2002 Wissenschaftliche Mitarbeiterin am Institut für Biologie VII (Molekulare Biotechnologie) der RWTH Aachen.
seit 2003 Wissenschaftliche Angestellte am Institut für Klinische Chemie und Pathobiochemie sowie Klinische-Chemisches Zentrallaboratorium der Universitätsklinikum Aachen.