Elastic Serum-Albumin Based Hydrogels: Mechanism of ...
12
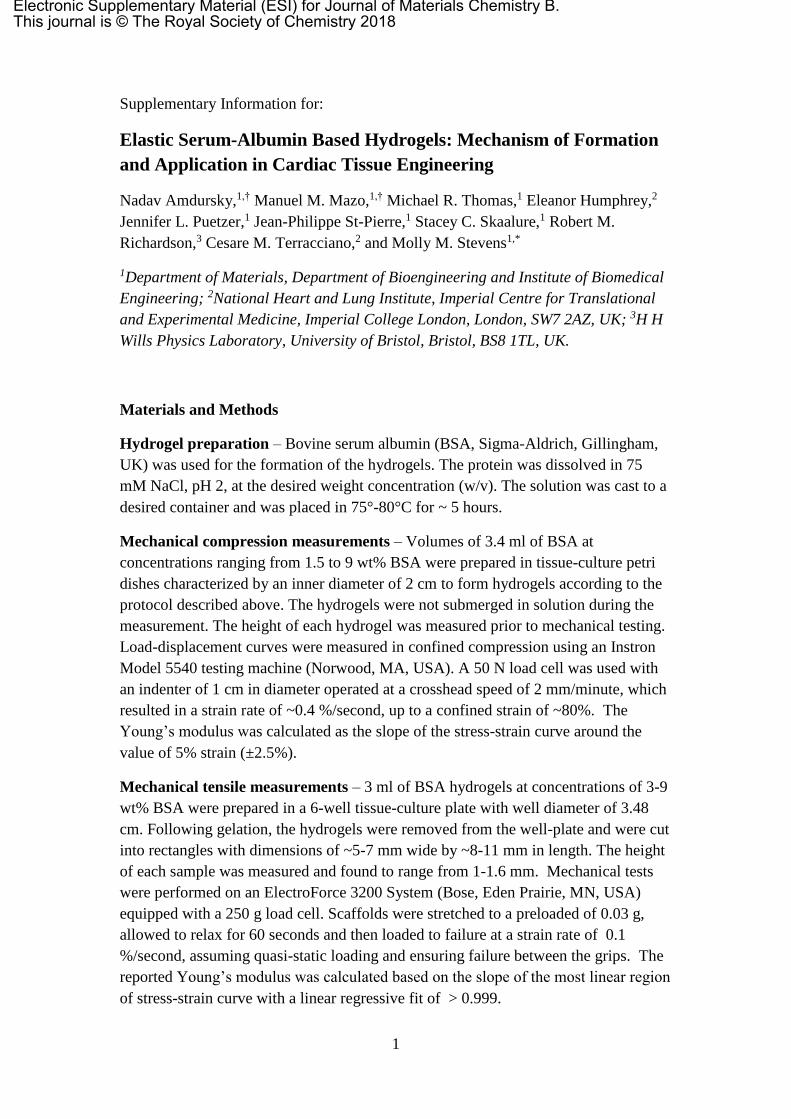
1 Supplementary Information for: Elastic Serum-Albumin Based Hydrogels: Mechanism of Formation and Application in Cardiac Tissue Engineering Nadav Amdursky, 1,† Manuel M. Mazo, 1,† Michael R. Thomas, 1 Eleanor Humphrey, 2 Jennifer L. Puetzer, 1 Jean-Philippe St-Pierre, 1 Stacey C. Skaalure, 1 Robert M. Richardson, 3 Cesare M. Terracciano, 2 and Molly M. Stevens 1,* 1 Department of Materials, Department of Bioengineering and Institute of Biomedical Engineering; 2 National Heart and Lung Institute, Imperial Centre for Translational and Experimental Medicine, Imperial College London, London, SW7 2AZ, UK; 3 H H Wills Physics Laboratory, University of Bristol, Bristol, BS8 1TL, UK. Materials and Methods Hydrogel preparation – Bovine serum albumin (BSA, Sigma-Aldrich, Gillingham, UK) was used for the formation of the hydrogels. The protein was dissolved in 75 mM NaCl, pH 2, at the desired weight concentration (w/v). The solution was cast to a desired container and was placed in 75°-80°C for ~ 5 hours. Mechanical compression measurements – Volumes of 3.4 ml of BSA at concentrations ranging from 1.5 to 9 wt% BSA were prepared in tissue-culture petri dishes characterized by an inner diameter of 2 cm to form hydrogels according to the protocol described above. The hydrogels were not submerged in solution during the measurement. The height of each hydrogel was measured prior to mechanical testing. Load-displacement curves were measured in confined compression using an Instron Model 5540 testing machine (Norwood, MA, USA). A 50 N load cell was used with an indenter of 1 cm in diameter operated at a crosshead speed of 2 mm/minute, which resulted in a strain rate of ~0.4 %/second, up to a confined strain of ~80%. The Young’s modulus was calculated as the slope of the stress-strain curve around the value of 5% strain (±2.5%). Mechanical tensile measurements – 3 ml of BSA hydrogels at concentrations of 3-9 wt% BSA were prepared in a 6-well tissue-culture plate with well diameter of 3.48 cm. Following gelation, the hydrogels were removed from the well-plate and were cut into rectangles with dimensions of ~5-7 mm wide by ~8-11 mm in length. The height of each sample was measured and found to range from 1-1.6 mm. Mechanical tests were performed on an ElectroForce 3200 System (Bose, Eden Prairie, MN, USA) equipped with a 250 g load cell. Scaffolds were stretched to a preloaded of 0.03 g, allowed to relax for 60 seconds and then loaded to failure at a strain rate of 0.1 %/second, assuming quasi-static loading and ensuring failure between the grips. The reported Young’s modulus was calculated based on the slope of the most linear region of stress-strain curve with a linear regressive fit of > 0.999. Electronic Supplementary Material (ESI) for Journal of Materials Chemistry B. This journal is © The Royal Society of Chemistry 2018
Transcript of Elastic Serum-Albumin Based Hydrogels: Mechanism of ...
1
Supplementary Information for:
Elastic Serum-Albumin Based Hydrogels: Mechanism of Formation
and Application in Cardiac Tissue Engineering
Nadav Amdursky,1,† Manuel M. Mazo,1,† Michael R. Thomas,1 Eleanor Humphrey,2
Jennifer L. Puetzer,1 Jean-Philippe St-Pierre,1 Stacey C. Skaalure,1 Robert M.
Richardson,3 Cesare M. Terracciano,2 and Molly M. Stevens1,*
1Department of Materials, Department of Bioengineering and Institute of Biomedical
Engineering; 2National Heart and Lung Institute, Imperial Centre for Translational
and Experimental Medicine, Imperial College London, London, SW7 2AZ, UK; 3H H
Wills Physics Laboratory, University of Bristol, Bristol, BS8 1TL, UK.
Materials and Methods
Hydrogel preparation – Bovine serum albumin (BSA, Sigma-Aldrich, Gillingham,
UK) was used for the formation of the hydrogels. The protein was dissolved in 75
mM NaCl, pH 2, at the desired weight concentration (w/v). The solution was cast to a
desired container and was placed in 75°-80°C for ~ 5 hours.
Mechanical compression measurements – Volumes of 3.4 ml of BSA at
concentrations ranging from 1.5 to 9 wt% BSA were prepared in tissue-culture petri
dishes characterized by an inner diameter of 2 cm to form hydrogels according to the
protocol described above. The hydrogels were not submerged in solution during the
measurement. The height of each hydrogel was measured prior to mechanical testing.
Load-displacement curves were measured in confined compression using an Instron
Model 5540 testing machine (Norwood, MA, USA). A 50 N load cell was used with
an indenter of 1 cm in diameter operated at a crosshead speed of 2 mm/minute, which
resulted in a strain rate of ~0.4 %/second, up to a confined strain of ~80%. The
Young’s modulus was calculated as the slope of the stress-strain curve around the
value of 5% strain (±2.5%).
Mechanical tensile measurements – 3 ml of BSA hydrogels at concentrations of 3-9
wt% BSA were prepared in a 6-well tissue-culture plate with well diameter of 3.48
cm. Following gelation, the hydrogels were removed from the well-plate and were cut
into rectangles with dimensions of ~5-7 mm wide by ~8-11 mm in length. The height
of each sample was measured and found to range from 1-1.6 mm. Mechanical tests
were performed on an ElectroForce 3200 System (Bose, Eden Prairie, MN, USA)
equipped with a 250 g load cell. Scaffolds were stretched to a preloaded of 0.03 g,
allowed to relax for 60 seconds and then loaded to failure at a strain rate of 0.1
%/second, assuming quasi-static loading and ensuring failure between the grips. The
reported Young’s modulus was calculated based on the slope of the most linear region
of stress-strain curve with a linear regressive fit of > 0.999.
Electronic Supplementary Material (ESI) for Journal of Materials Chemistry B.This journal is © The Royal Society of Chemistry 2018
2
Rheological measurements – 4.5% and 9 wt.% BSA hydrogels were prepared in a 6-
well tissue culture plate, gelled for 5 hours at 75°C, then removed and allowed to
swell to equilibrium in excess PBS overnight. After swelling, a biopsy punch was
used to cut the gels into 8 mm diameter discs (n = 3 per condition). The mechanical
properties of the hydrogels were studied using oscillatory shear rheology. Oscillatory
parallel plate rheological measurements were performed using an Advanced
Rheometer AR2000ex with AR Instrument Software (TA instruments, Herts, UK)
fitted with a Peltier temperature control system. Samples were tested at 25°C using an
8 mm diameter parallel stainless steel plate. Frequency sweeps were conducted from
0.1 to 10 Hz, at 0.5% strain. For 9% gels, a normal load of 0.15 - 0.2 N was applied
during testing, and for 4.5% gels, a normal load of 0.05 N was applied during testing.
Small Angle X-ray Scattering (SAXS) measurements – Non-gelled samples were
investigated by adding 300 μl of BSA in the above solutions in the concentrations of
1-9 wt.% BSA into 1.5 mm quartz glass capillaries and sealed with rapid-setting
epoxy resin. Scattered X-ray intensity as a function of scattering vector Q in the range
of 0.006-0.2 Å-1 was obtained using a CuKα Microfocus source GANESHA 300 XL
(SAXSLAB, Copenhagen, Denmark) SAXS-WAXS system in SAXS mode using the
in-vacuum Pilatus 300k (Dectris, Baden, Switzerland) detector. Measurements were
performed following determination of the centre of the capillary by beam-stop diode
measurements. Capillary contributions to scattered intensity were determined by
measuring the region above the sample and a solvent subtraction was performed using
75 mM NaCl at pH 2. Following subtraction of solvent and capillary contributions
considering run time and beam intensity, the two dimensional data sets were
integrated azimuthally to give one-dimensional scattering profiles. Following initial
measurement, the samples were removed and gelled at 80 °C for 3 hours to ensure
complete gelation. The capillaries were then re-introduced to the SAXSLAB system
and measurements repeated.
Data Fitting: All data was fitted using the software SasView with intensity error
weighting of the data over a Q-range of 0.0065 to 0.18 Å-1 with the Levenberg-
Marquardt algorithm to minimise χ2/ Npts. All parameters (except where referred to in
the text) were allowed to vary during the fitting process.
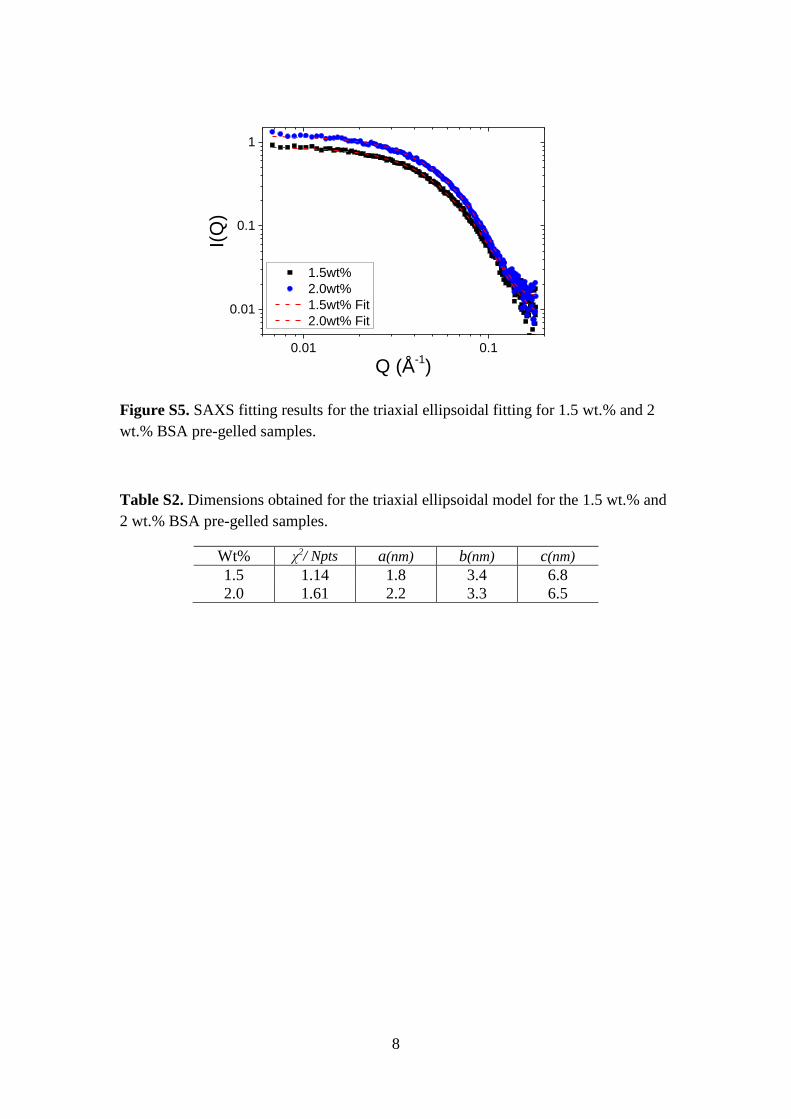
Triaxial ellipsoid fitting: Non-gelled, lower concentration samples were fitted using
the “TriaxialEllipsoidModel” function for non-aligned particles. Fitting was
performed on samples within the 1-2 wt% BSA samples where intensity at the low Q
limit was found to scale linearly with concentration suggesting minimal structure
factor contribution. Fitting was found to be robust for 1.5 and 2 wt% BSA with
semiaxes parameters (a, b, c) shown in Table S2 and fits shown in Figure S5.
Ellipsoidal cross section cylinder fitting: Fitting was performed using the
“EllipticalCylinderModel” for the 1 wt% BSA after heating with fit parameters
defined in Table S3 and resulting fit shown in Figure S6.
3
Correlation length model fitting: In order to fit the azimuthally integrated,
background subtracted scattered intensity vs. Q, the shape-independent model
function “CorrLength” which makes use of the scattering function described in
equation (1) was used. The fitting parameters obtained for the different mass fraction
samples are shown in Table S4.
Neonatal rat ventricular myocyte isolation, seeding and culture – All work was
carried out under the Animals (Scientific Procedures) Act 1986 and the EU Directive
2010/63/EU (Ethics approval secured by C.M.T). Neonatal rat ventricular myocytes
(NRVMs) were isolated from the ventricles of 0-2 day old animals. A GentleMACs
neonatal heart dissociation kit (Miltenyi Biotec, Woking, UK) was used to
enzymatically digest the ventricles to produce a cell suspension that was pre-plated
for 1 hour to remove non-myocytes. The enriched cell isolate was employed for the
first set of experiments (cardiomyocyte, CM, -only), while the unselected ventricle
digestion was used for the second one. Prior to cell seeding, the substrates (glass
coverslips, 4.5 wt% or 9 wt% BSA hydrogels) were coated with 1 μg/ml of human
Fibronectin (Sigma-Aldrich) for 1 hour at 37ºC. For validating fibronectin adsorption,
coated and pristine samples were stained with an anti-FN polyclonal antibody,
followed by an Alexa-594 conjugated secondary antibody. Random pictures from the
substrates were taken, and fluorescence quantified with Image J. 500000 cells in 30 µl
of M199 with Hank´s salts, 1% v/v L-Glutamine, 1% v/v Penicillin-Streptomycin (all
from Sigma-Aldrich), 10% v/v Fetal Calf Serum (Biosera, Nuaille, France) and 0.4
mg/ml vitamin B12 (Sigma-Aldrich) were seeded on the coated substrates, allowed to
attach for 30-60 minutes and subsequently supplemented with additional medium.
Media was carefully replaced 24 hours after seeding and every other day afterwards.
CM-only experiments: AlamarBlue® and LIVE/DEADTM viability/cytotoxicity kit
(Life technologies, Milton Keynes, UK) test were performed on day 1 following the
manufacturer´s instructions. On day 3, substrates were either fixed in 3.7% w/v
paraformaldehyde or frozen samples in Trizol. LIVE/DEADTM stained samples were
imaged using an Olympus XI51 inverted microscope.
Ventricular cells experiments: Samples were stained with LIVE/DEADTM on days 1
and 14, while beating rate was manually counted on days 7 and 14. On days 1, 4, 7
and 14, 3 samples per experiment were frozen for the Picogreen dsDNA
quantification assay (Life technologies). Once all had been collected, samples were
thawed and digested overnight in a papain (Life technologies) solution. On the next
day, they were briefly spin to remove any debris from the supernatant, and the test
was carried out following the manufacturer´s instructions. Finally, on day 14, 3
samples were fixed as above and subsequently stained.
RNA extraction, retrotranscription and real time qPCR - Frozen samples in Trizol
(Thermo Scientific, Milton Keynes, UK) were slowly defrosted in ice and RNA was
extracted following manufacturer´s instructions. Retrotranscription was afterwards
performed with QuantiTect Reverse Transcription Kit (Qiagen, Manchester, UK).
4
Real time qPCR was carried out using the primers listed in Table 1, with SyBr Green
Master Mix (Qiagen) using a Rotorgene Q (Qiagen) or Rotorgene 6000 (Corbett Life
Science, UK) real thermal cycler. Samples were held at 95°C for 15 minutes to
activate the DNA polymerase, then exposed to 40 heat cycles to denature (94°C for 15
seconds), anneal (primer-specific melting temperature for 30 seconds), and extend
(72°C for 30 seconds). A melting curve analysis was performed to confirm the length
of the PCR products and the specificity of the reaction. All primers were set up to run
at efficiencies of 90-100%. Data was normalized against a housekeeping gene
(Gapdh) and analyzed using the ΔΔCt method versus the freshly isolated cells
(NRVMs) and expressed as relative expression (2-ΔΔCt).
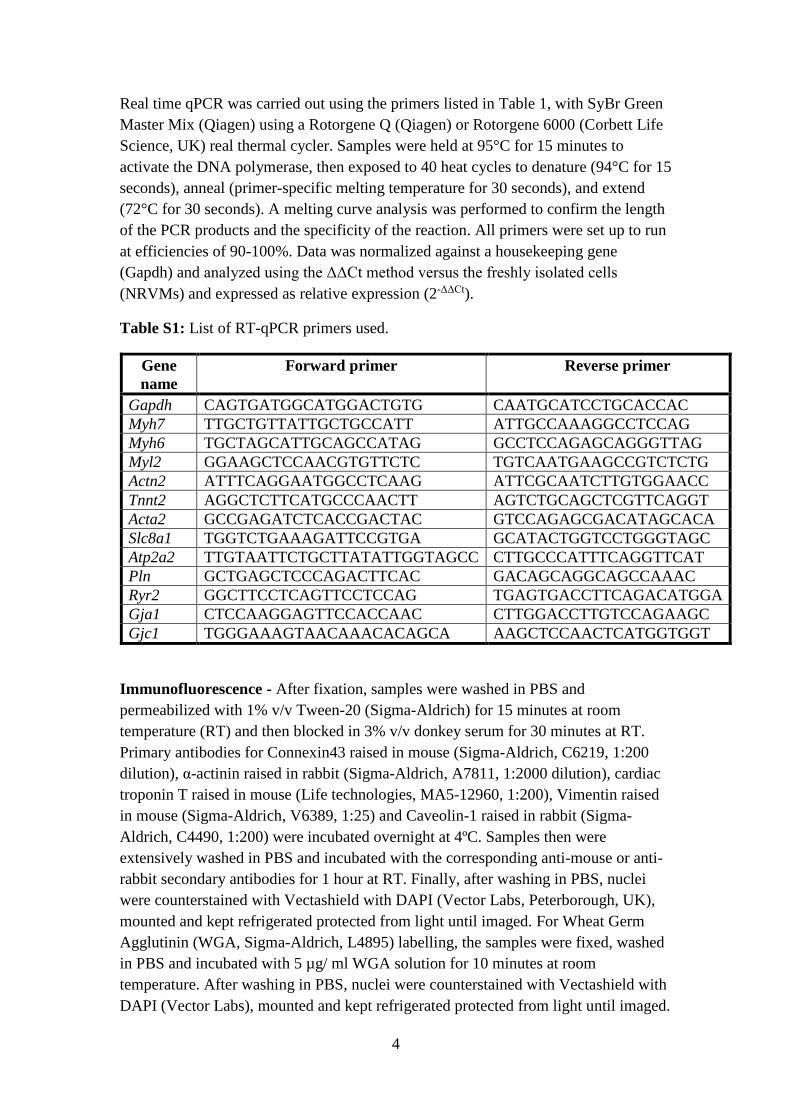
Table S1: List of RT-qPCR primers used.
Gene
name
Forward primer Reverse primer
Gapdh CAGTGATGGCATGGACTGTG CAATGCATCCTGCACCAC
Myh7 TTGCTGTTATTGCTGCCATT ATTGCCAAAGGCCTCCAG
Myh6 TGCTAGCATTGCAGCCATAG GCCTCCAGAGCAGGGTTAG
Myl2 GGAAGCTCCAACGTGTTCTC TGTCAATGAAGCCGTCTCTG
Actn2 ATTTCAGGAATGGCCTCAAG ATTCGCAATCTTGTGGAACC
Tnnt2 AGGCTCTTCATGCCCAACTT AGTCTGCAGCTCGTTCAGGT
Acta2 GCCGAGATCTCACCGACTAC GTCCAGAGCGACATAGCACA
Slc8a1 TGGTCTGAAAGATTCCGTGA GCATACTGGTCCTGGGTAGC
Atp2a2 TTGTAATTCTGCTTATATTGGTAGCC CTTGCCCATTTCAGGTTCAT
Pln GCTGAGCTCCCAGACTTCAC GACAGCAGGCAGCCAAAC
Ryr2 GGCTTCCTCAGTTCCTCCAG TGAGTGACCTTCAGACATGGA
Gja1 CTCCAAGGAGTTCCACCAAC CTTGGACCTTGTCCAGAAGC
Gjc1 TGGGAAAGTAACAAACACAGCA AAGCTCCAACTCATGGTGGT
Immunofluorescence - After fixation, samples were washed in PBS and
permeabilized with 1% v/v Tween-20 (Sigma-Aldrich) for 15 minutes at room
temperature (RT) and then blocked in 3% v/v donkey serum for 30 minutes at RT.
Primary antibodies for Connexin43 raised in mouse (Sigma-Aldrich, C6219, 1:200
dilution), α-actinin raised in rabbit (Sigma-Aldrich, A7811, 1:2000 dilution), cardiac
troponin T raised in mouse (Life technologies, MA5-12960, 1:200), Vimentin raised
in mouse (Sigma-Aldrich, V6389, 1:25) and Caveolin-1 raised in rabbit (Sigma-
Aldrich, C4490, 1:200) were incubated overnight at 4ºC. Samples then were
extensively washed in PBS and incubated with the corresponding anti-mouse or anti-
rabbit secondary antibodies for 1 hour at RT. Finally, after washing in PBS, nuclei
were counterstained with Vectashield with DAPI (Vector Labs, Peterborough, UK),
mounted and kept refrigerated protected from light until imaged. For Wheat Germ
Agglutinin (WGA, Sigma-Aldrich, L4895) labelling, the samples were fixed, washed
in PBS and incubated with 5 µg/ ml WGA solution for 10 minutes at room
temperature. After washing in PBS, nuclei were counterstained with Vectashield with
DAPI (Vector Labs), mounted and kept refrigerated protected from light until imaged.
5
Pictures were taken using a Leica SP5 Inverted confocal microscope. Cell area
(WGA), density (DAPI) and sarcomere length (alpha-actinin) were quantified using
ImageJ.
Statistical analysis - Results are presented as mean ± standard error of the mean
(SEM) unless specified otherwise. Statistical analysis was performed using SPSS 22
or GraphPad software. Distributions were assumed normal and differences were
analyzed by t-test or ANOVA with a HDS Tukey post-hoc test as required.
Differences were considered statistically significant when p < 0.05 (*), very
significant when p < 0.01 (**) and extremely significant when p < 0.001 (***).
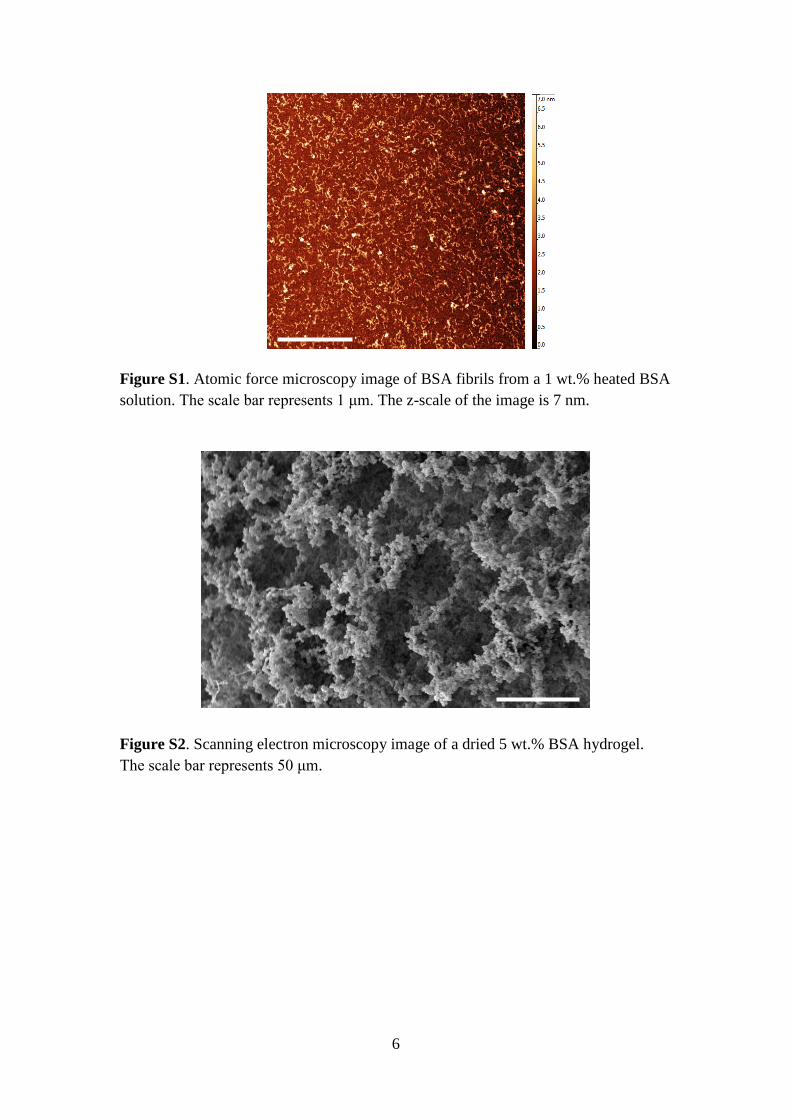
Atomic force microscopy (AFM) imaging – 1 wt% BSA solution was heated for 5
hours, followed by a 100 fold dilution in water. 20 μl of the diluted solution was
placed onto freshly cleaved mica surface that was later used as the substrate for the
AFM imaging. After 2 minutes of incubation the mica surface was gently washed in
water and dried with a nitrogen stream. An AFM 5500 microscope (Keysight
technologies, previously Agilent, Santa Rosa, CA, USA) was used for the imaging in
tapping mode. A HQ:NSC15/Al BS tip (μmasch) was used with a tip radius of 8 nm,
resonance frequency of 325 kHz and force constant of 40 N/m. The measurements
were performed in ambient atmosphere.
Scanning electron microscopy (SEM) imaging – 1 ml of 5 wt% BSA hydrogel was
freeze-dried. A small section of the freeze-dried material was taped by carbon tape to
a metal stab, and coated with thin layer of Au. A SEM JEOL 5610LV system was
used for imaging the surface of the gel, at an operating bias of 18 kV.
6
Figure S1. Atomic force microscopy image of BSA fibrils from a 1 wt.% heated BSA
solution. The scale bar represents 1 μm. The z-scale of the image is 7 nm.
Figure S2. Scanning electron microscopy image of a dried 5 wt.% BSA hydrogel.
The scale bar represents 50 μm.
7
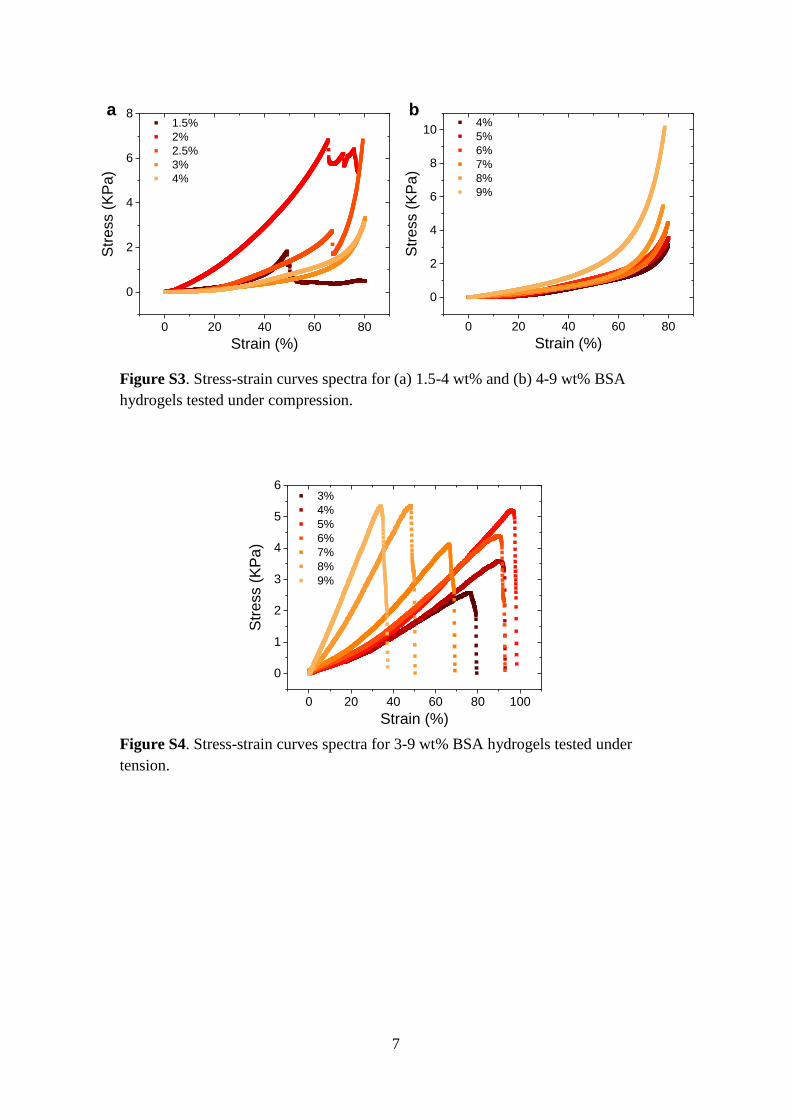
Figure S3. Stress-strain curves spectra for (a) 1.5-4 wt% and (b) 4-9 wt% BSA
hydrogels tested under compression.
Figure S4. Stress-strain curves spectra for 3-9 wt% BSA hydrogels tested under
tension.
0 20 40 60 80
0
2
4
6
8
10 4%
5%
6%
7%
8%
9%
Str
ess (
KP
a)
Strain (%)0 20 40 60 80
0
2
4
6
8 1.5%
2%
2.5%
3%
4%
Str
ess (
KP
a)
Strain (%)
b a
0 20 40 60 80 100
0
1
2
3
4
5
6 3%
4%
5%
6%
7%
8%
9%
Strain (%)
Str
ess (
KP
a)
8
0.01 0.1
0.01
0.1
1
I(Q
)
Q (Å-1)
1.5wt%
2.0wt%
1.5wt% Fit
2.0wt% Fit
Figure S5. SAXS fitting results for the triaxial ellipsoidal fitting for 1.5 wt.% and 2
wt.% BSA pre-gelled samples.
Table S2. Dimensions obtained for the triaxial ellipsoidal model for the 1.5 wt.% and
2 wt.% BSA pre-gelled samples.
Wt% χ2/ Npts a(nm) b(nm) c(nm)
1.5 1.14 1.8 3.4 6.8
2.0 1.61 2.2 3.3 6.5
9
0.01 0.1
0.01
0.1
1
I(Q
)
Q (Å-1)
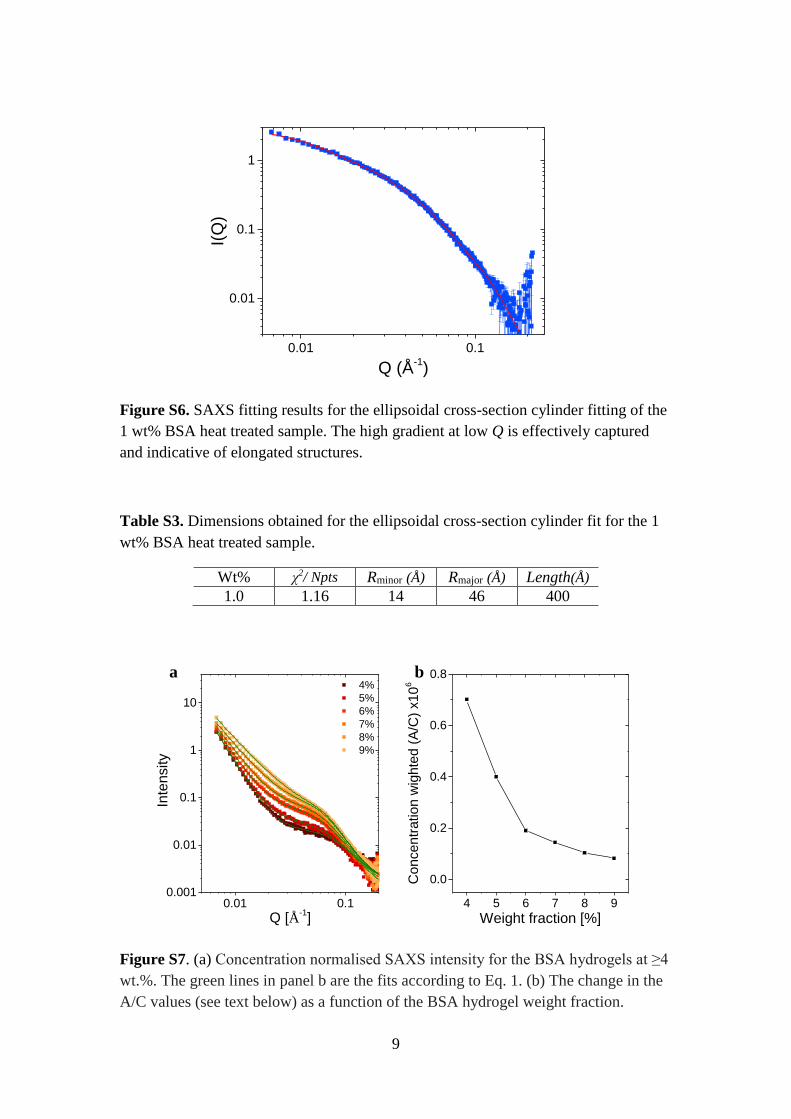
Figure S6. SAXS fitting results for the ellipsoidal cross-section cylinder fitting of the
1 wt% BSA heat treated sample. The high gradient at low Q is effectively captured
and indicative of elongated structures.
Table S3. Dimensions obtained for the ellipsoidal cross-section cylinder fit for the 1
wt% BSA heat treated sample.
Wt% χ2/ Npts Rminor (Å) Rmajor (Å) Length(Å)
1.0 1.16 14 46 400
Figure S7. (a) Concentration normalised SAXS intensity for the BSA hydrogels at ≥4
wt.%. The green lines in panel b are the fits according to Eq. 1. (b) The change in the
A/C values (see text below) as a function of the BSA hydrogel weight fraction.
0.01 0.10.001
0.01
0.1
1
10
4 5 6 7 8 9
0.0
0.2
0.4
0.6
0.8
Inte
nsity
4%
5%
6%
7%
8%
9%
Q [Å-1]
Concentr
ation w
ighte
d (
A/C
) x10
6
Weight fraction [%]
b a
10
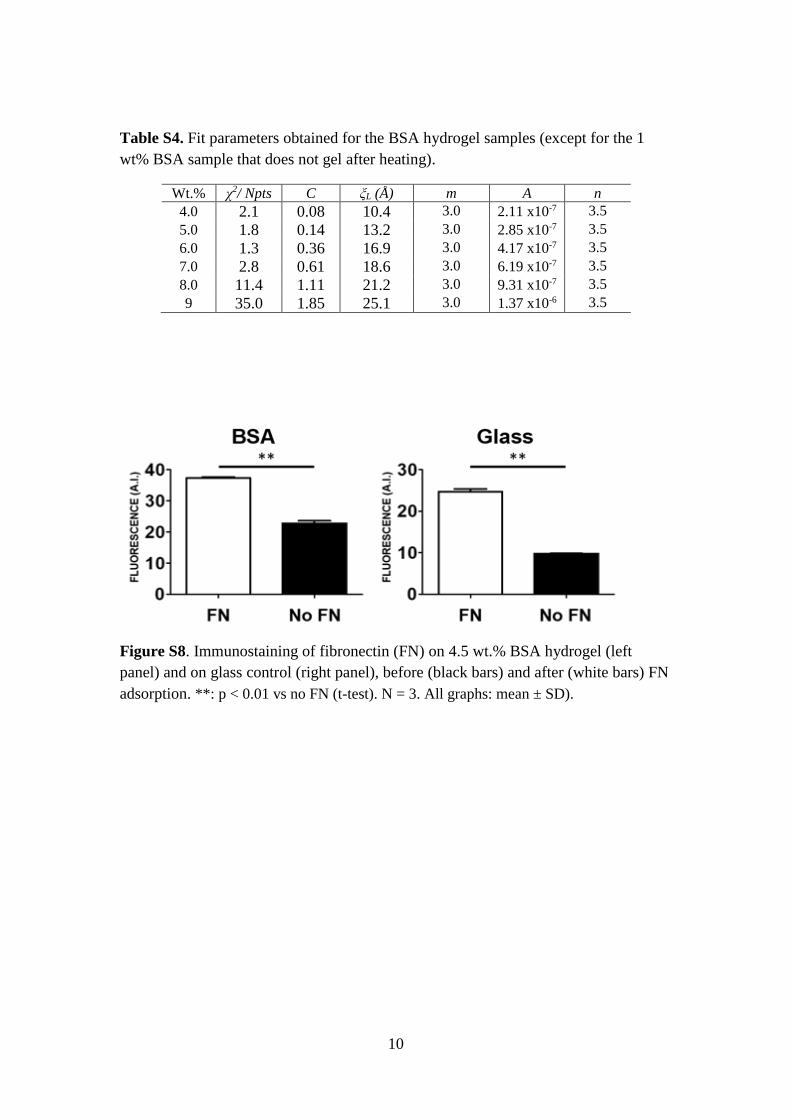
Table S4. Fit parameters obtained for the BSA hydrogel samples (except for the 1
wt% BSA sample that does not gel after heating).
Wt.% χ2/ Npts C ξL (Å) m A n
4.0 2.1 0.08 10.4 3.0 2.11 x10⁻⁷ 3.5
5.0 1.8 0.14 13.2 3.0 2.85 x10⁻⁷ 3.5
6.0 1.3 0.36 16.9 3.0 4.17 x10⁻⁷ 3.5
7.0 2.8 0.61 18.6 3.0 6.19 x10⁻⁷ 3.5
8.0 11.4 1.11 21.2 3.0 9.31 x10⁻⁷ 3.5
9 35.0 1.85 25.1 3.0 1.37 x10⁻⁶ 3.5
Figure S8. Immunostaining of fibronectin (FN) on 4.5 wt.% BSA hydrogel (left
panel) and on glass control (right panel), before (black bars) and after (white bars) FN
adsorption. **: p < 0.01 vs no FN (t-test). N = 3. All graphs: mean ± SD).
11
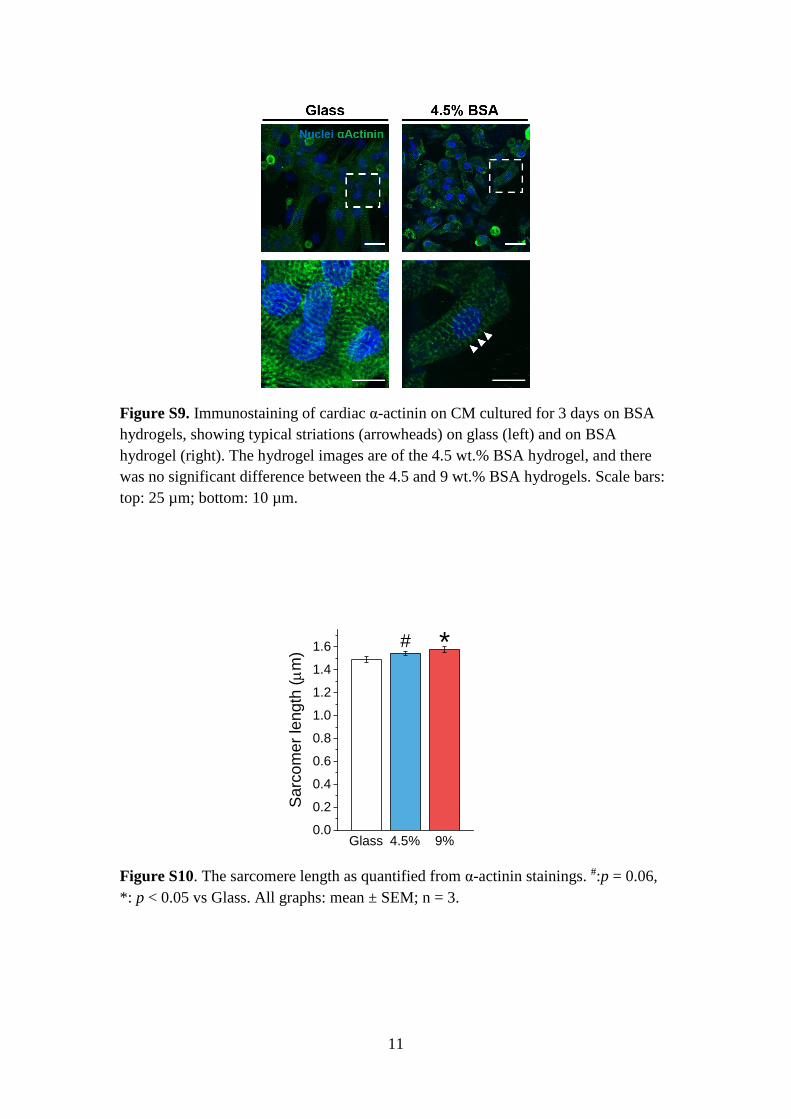
Figure S9. Immunostaining of cardiac α-actinin on CM cultured for 3 days on BSA
hydrogels, showing typical striations (arrowheads) on glass (left) and on BSA
hydrogel (right). The hydrogel images are of the 4.5 wt.% BSA hydrogel, and there
was no significant difference between the 4.5 and 9 wt.% BSA hydrogels. Scale bars:
top: 25 µm; bottom: 10 µm.
Figure S10. The sarcomere length as quantified from α-actinin stainings. #:p = 0.06,
*: p < 0.05 vs Glass. All graphs: mean ± SEM; n = 3.
0.0
0.2
0.4
0.6
0.8
1.0
1.2
1.4
1.6 # *
9%4.5%
Sa
rco
me
r le
ngth
(m
m)
Glass
12
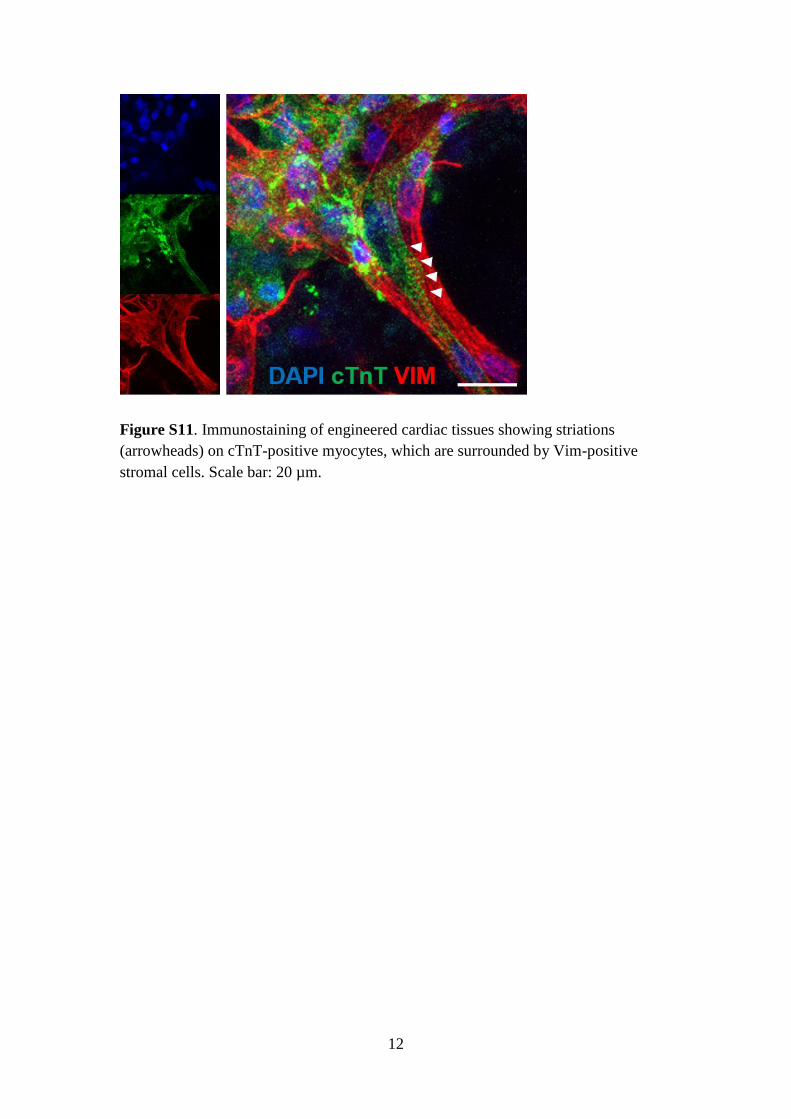
Figure S11. Immunostaining of engineered cardiac tissues showing striations
(arrowheads) on cTnT-positive myocytes, which are surrounded by Vim-positive
stromal cells. Scale bar: 20 µm.