Production of Hydroprocessed Esters and Fatty Acids (HEFA ...
14
HAL Id: hal-01274995 https://hal.archives-ouvertes.fr/hal-01274995 Submitted on 16 Feb 2016 HAL is a multi-disciplinary open access archive for the deposit and dissemination of sci- entific research documents, whether they are pub- lished or not. The documents may come from teaching and research institutions in France or abroad, or from public or private research centers. L’archive ouverte pluridisciplinaire HAL, est destinée au dépôt et à la diffusion de documents scientifiques de niveau recherche, publiés ou non, émanant des établissements d’enseignement et de recherche français ou étrangers, des laboratoires publics ou privés. Production of Hydroprocessed Esters and Fatty Acids (HEFA) – Optimisation of Process Yield Laurie Starck, Ludivine Pidol, Nicolas Jeuland, Thierry Chapus, Paul Bogers, Joanna Bauldreay To cite this version: Laurie Starck, Ludivine Pidol, Nicolas Jeuland, Thierry Chapus, Paul Bogers, et al.. Production of Hydroprocessed Esters and Fatty Acids (HEFA) – Optimisation of Process Yield. Oil & Gas Science and Technology - Revue d’IFP Energies nouvelles, Institut Français du Pétrole, 2016, 71 (1), 10.2516/ogst/2014007. hal-01274995
Transcript of Production of Hydroprocessed Esters and Fatty Acids (HEFA ...

HAL Id: hal-01274995https://hal.archives-ouvertes.fr/hal-01274995
Submitted on 16 Feb 2016
HAL is a multi-disciplinary open accessarchive for the deposit and dissemination of sci-entific research documents, whether they are pub-lished or not. The documents may come fromteaching and research institutions in France orabroad, or from public or private research centers.
L’archive ouverte pluridisciplinaire HAL, estdestinée au dépôt et à la diffusion de documentsscientifiques de niveau recherche, publiés ou non,émanant des établissements d’enseignement et derecherche français ou étrangers, des laboratoirespublics ou privés.
Production of Hydroprocessed Esters and Fatty Acids(HEFA) – Optimisation of Process Yield
Laurie Starck, Ludivine Pidol, Nicolas Jeuland, Thierry Chapus, Paul Bogers,Joanna Bauldreay
To cite this version:Laurie Starck, Ludivine Pidol, Nicolas Jeuland, Thierry Chapus, Paul Bogers, et al.. Productionof Hydroprocessed Esters and Fatty Acids (HEFA) – Optimisation of Process Yield. Oil & GasScience and Technology - Revue d’IFP Energies nouvelles, Institut Français du Pétrole, 2016, 71 (1),�10.2516/ogst/2014007�. �hal-01274995�

D o s s i e rSecond and Third Generation Biofuels: Towards Sustainability and Competitiveness
Seconde et troisième génération de biocarburants : développement durable et compétitivité
Production of Hydroprocessed Esters and Fatty Acids(HEFA) – Optimisation of Process Yield
Laurie Starck1*, Ludivine Pidol1, Nicolas Jeuland1, Thierry Chapus2,Paul Bogers3 and Joanna Bauldreay3
1 IFP Energies nouvelles, 1-4 avenue de Bois-Préau, 92852 Rueil-Malmaison - France2 IFP Energies Nouvelles, Rond-point de l'échangeur de Solaize, BP 3, 69360 Solaize - France
3 Shell Global Solutions Downstream, Shell Technology Centre Thornton, P.O. Box 1, Chester CH1 3SH - United Kingdome-mail: [email protected] - [email protected] - [email protected] - [email protected]
[email protected] - [email protected]
* Corresponding author
Abstract — Both Fischer-Tropsch (FT) and Hydroprocessed Esters and Fatty Acids (HEFA)
Synthetic Paraffinic Kerosine (SPK) fuels are considered as leading alternative replacements for
conventional jet fuel. To satisfy the requirements of Civil Aviation Authorities (CAA), their
drop-in incorporations have been subjected to a rigorous certification process. To reach the
ambitious incorporation targets, new routes for biofuels incorporation may need to emerge, involving
optimizing the production processes and the blending strategies. This paper focuses on a new strategy
for incorporating HEFA, allowing the process yield to be optimised.
One of the major steps limiting the process yield for HEFA remains the isomerisation that allows
production of a biofuel with very good cold flow properties. But this step introduces a substantial
decrease of the overall yield (fuel component per kg of starting material) due to the production of
light compounds, unsuitable for conventional jet fuel. In this work relaxing the freezing point require-
ment for the neat HEFA component (by decreasing the severity of the isomerisation step) is pro-
posed in order to minimize the production of less valuable light compounds. This strategy could
lead to a significant additional biofuel yield with respect to the oil compared to a process making
a better freezing point component. This allows the land surface area necessary for HEFA feedstock
cultivation to be reduced for a given amount of bio-jet fuel produced.
Resume — Production d’huiles vegetales hydrotraitees (Hydroprocessed Esters and Fatty Acids,
HEFA) – Optimisation du rendement — Le developpement des carburants alternatifs est en
plein essor, notamment dans le domaine aeronautique. Cela se concretise par la possibilite,
d’incorporer jusqu’a 50 % de carburants de synthese de type Fischer-Tropsch (FT) ou
Hydroprocessed Esters and Fatty Acids (HEFA) dans du carbureacteur. Ces cibles
d’incorporation sont ambitieuses. C’est pourquoi, l’objectif de cet article est d’etudier une
strategie innovante pour l’incorporation des carburants alternatifs, et plus precisement des
carburants de type HEFA, dans le domaine aeronautique en optimisant les strategies de
melanges c’est-a-dire en cherchant a optimiser les rendements des procedes.
En effet, l’un des moyens d’action permettant d’ameliorer les rendements des procedes HEFA est
d’agir sur l’etape d’hydrotraitement. Cette etape permet d’ameliorer les proprietes a froid.
Cependant la contre partie est l’impact que cela peut avoir sur le rendement : ameliorer les
This is an Open Access article distributed under the terms of the Creative Commons Attribution License (http://creativecommons.org/licenses/by/4.0),which permits unrestricted use, distribution, and reproduction in any medium, provided the original work is properly cited.
Oil & Gas Science and Technology – Rev. IFP Energies nouvelles (2016) 71, 10� L. Starck et al., published by IFP Energies nouvelles, 2014DOI: 10.2516/ogst/2014007

proprietes a froid est synonyme de perte en rendement (carburant produit par kg par rapport a la
masse de matiere premiere) a cause de la production de produits legers qui ne sont pas utilisables
dans la coupe jet. Ce travail propose donc de relacher la contrainte sur le point de disparition des
cristaux, exigee pour les carburants de type HEFA, en jouant sur la severite de l’etape
d’hydrotraitement et donc en minimisant la production de produits legers afin de maximiser les
rendements. Cette strategie pourrait amener a avoir un meilleur rendement en biojet par
rapport a l’huile de depart comparee a une strategie dans laquelle on recherche un meilleur
point de disparition des cristaux. Ainsi, il serait envisageable de reduire les surfaces agricoles
utilisees pour la culture des plantes pour un meme volume de biojet produit.
DEFINITIONS / ABBREVIATIONS
ASTM American Society for Testing and Materi-
als International
CAA Civil Aviation Authorities
DCO Decarboxylation
EU-ETS European Union Greenhouse Gas Emis-
sion Trading Scheme
FT Fischer-Tropsch
HDO Hydrodeoxygenation
HEFA Hydroprocessed Esters and Fatty Acids
HIS Hydroisomerization
HRJ Hydroprocessed Renewable Jet
HVO Hydrotreated Vegetable Oil
nP Normal (Linear) Paraffins
iP Iso Paraffins
SPK Synthetic Paraffinic Kerosene
SWAFEA Sustainable Way for Alternative Fuel and
Energy in Aviation
INTRODUCTION
World wide air traffic has been steadily increasing for
many years and is predicted to grow at a rate of close
to 4-5% per year, with even higher growth rates in the
Middle East and Asia [1, 2].
Moreover, the increased focus on climate change over
the last decade has created pressure to reduce greenhouse
gases emissions. It has been estimated that the aeronau-
tics sector represents 2 to 3% of the global CO2 emis-
sions [3]. Such a contribution may seem to be minor
but the air traffic is expected to strongly increase in the
next years while other industries move to lower carbon
options. This is one reason it has been decided to include
the aeronautics sector in the EU-ETS (European Union
Greenhouse Gas Emission Trading Scheme) from 2012.
International Air Transport Association (IATA) has
adopted a voluntary ambitious fuel efficiency goal:
reducing CO2 emissions by 50% by 2050, compared to
the 2005 level, as illustrated in Figure 1. Consequently,
the search for new alternative fuels for aircraft seems
to be a promising and necessary solution from an energy
security and environmental perspective. If aviation
wants to reduce its greenhouse gas emissions, it has to
turn to biofuels, which are the only fuels having the
potential to achieve significant greenhouse emissions
savings. Some of the steps towards a reduced CO2 goal
can be achieved with the efficiency increases anticipated
through aircraft improvement, operational measures or
infrastructure changes. But these measures are not
enough and additional reductions are required. It is
why biofuel appears to be the main candidate to achieve
these reductions. Significant emissions reduction can be
achieved with biofuel, provided that low emissions are
achieved in the cultivation step of the biomass and if
there is a rigorous control of land use change. Without
these controls, some biofuels can have very poor CO2
footprints.
The effort to develop alternative aviation fuels has
already begun, focused on Fischer-Tropsch (FT) fuels.
2005 20502020
No action
CNG 2020
2030 2040
-50% by2050
CO
2 em
issi
ons
2010
Known technology, operations andinfrastructure measures
Biofuels and additional technologyCarbon-neutral growth 2020Gross emissions trajectoryEconomic measures
(schematic)
TechOpsInfra
“Frozen technology” emissions
Biofuels +add. Tech
Figure 1
CO2 emissions reduction targeted by IATA (Source
IATA).
Page 2 of 13 Oil & Gas Science and Technology – Rev. IFP Energies nouvelles (2016) 71, 10

Generic FT Synthetic Paraffinic Kerosene (SPK) was
approved for use in blends, at up to 50% volume, with
Jet A-1 in ASTM D7566 in August 2009 [4, 5]. The sec-
ond class of alternative fuels approved for certification is
Hydroprocessed Esters and Fatty Acids (HEFA), also
called Hydrogenated Vegetable Oil (HVO) or Hydropro-
cessed Renewable Jet (HRJ); it covers hydrocarbon avia-
tion fuel produced from animal oils or vegetable oils
(triglycerides) by hydroprocessing. This fuel has also
been called BioSPK, although one should remember that
the FT SPK include biomass to liquid fuels that can
equally be called BioSPK. The ASTM D7566 specifica-
tion is structured to support various classes of alterna-
tive fuels in its appendices and HEFA was approved
for use at up to 50% volume in blends with conventional
kerosene in ASTMD7566 in July 2011 [6]. It can now be
used in ASTM D1655 fuels and, following an update to
DEF STAN 91-91, HEFA has also been approved under
“Check List”. The results of a study by the EU-funded
Sustainable Way for Alternative Fuels and Energy in
Aviation (SWAFEA) [7] have shown that the incorpora-
tion of biofuels in aviation fuel is necessary to reach the
ambitious IATA targets in terms of CO2 reduction.
These conclusions also show that a massive incorpora-
tion ratio will be needed, so that huge investments need
to be made. Moreover, the question of biofuels deploy-
ment has been raised, linked with a need for an optimised
production yield to meet those targets.
There is competition for biofuel components which
affects the design and economics of facilities that convert
bio-oils into fuel. Specifically, there is competition between
gasoil (e.g.automotiveDiesel, heatingand industrialDiesel)
and kerosene users.Most bio-oils naturally yield product in
the gasoil range so further processing steps are needed to
make a product that is technically better suited to kerosene
(jet fuel) production, in particular havingbetter low temper-
ature features than required for Diesel applications. The
objective of this work is to study product quality trade-offs
that could affect the economics of biojet production in the
initial periods when biofuel availability will be limited. Spe-
cifically, it considers incorporating low levels (considerably
less than the50%volumenowapproved)of SPKwith freez-
ing points higher than those currently approved (�40�Cmaximum) into Jet A-1, while keeping the blend freezing
point specification unchanged. Increasing (worsening) the
freezing point decreases the level of processing of the
SPK, which should produce higher biofuel component
yields [8] and a potentially better overall profitability than
a route that produces a higher proportion of better freezing
point products that can be incorporated at higher percent-
ages into the final Jet A-1. The recommendation for low
or medium HVO (HEFA) concentrations is also studied
for Diesel engines [9].
This paper does not deal with the economics them-
selves but provides technical data that could assist in
understanding the relationship between process costs
(usually related to process complexity), process yield,
HEFA quality, and blending rate. IFPEN and ShellGlo-
bal Solutions have joined their expertise to produce two
different qualities of HEFA from the same original oil
for the purposes of the SWAFEA project. The level of
hydroisomerisation applied to a hydroprocessed oil to
improve the low temperature properties was varied
between the two HEFA:
– if, as expected, important constraints are put on oil
availability and HEFA production capacity, in the
short term the incorporation process will have to be
optimised to incorporate this product into conven-
tional Jet A-1. In this case, the global optimisation
of the production yield will be of major importance.
A major factor limiting the process yield remains the
isomerisation step, which allows production of a bio-
fuel with very good cold flow properties. It also leads
to a substantial decrease in the overall yield because of
the co-production of light compounds that cannot be
incorporated in conventional jet fuel. To evaluate the
impact of this production step, an extreme view has
been chosen: a specific HEFA has been produced to
have limited cold flow properties (target: freezing
point around �20�C) and the resulting product has
been blended into conventional jet fuel at different
blending ratios. The overall yield has been calculated,
to evaluate if a substantial gain can be obtained with
such a strategy, while keeping the final blend in the
limits of the Jet A-1 specification (freezing point
� �47�C);– the current specification limits the incorporation rate
of HEFA to a maximum of 50% volume. To meet
the IATA targets, higher blending ratesmay eventually
be needed. Indeed, during the ramp-up period, this
productmay not be available everywhere. The capacity
to blend higher ratios in some locations can therefore
help to meet the incorporation targets, taking into
account the local availability of the product. A specific
HEFA meeting the ASTM D7566 specifications has
been made to evaluate the potential of such a product
being blended at a high ratio (75%) in Jet A-1.
To summarize the different strategies:
– Case 1: aim for a reduced HEFA incorporation ratio
for HEFA with poor cold flow properties (target:
freezing point around �20�C). Blends of this HEFA
production (called HEFA1) with a conventional Jet
A-1 have been prepared with 10%, 20% and 30% vol-
ume of HEFA1;
– Case 2: aim for a larger HEFA incorporation ratio
than permitted by ASTMD7566: one blend of HEFA
Oil & Gas Science and Technology – Rev. IFP Energies nouvelles (2016) 71, 10 Page 3 of 13
production (called HEFA2) with the same conven-
tional Jet A-1, has been prepared with an incorpora-
tion ratio of 75% volume of HEFA2.
1 GENERAL INFORMATION ON THE HYDROTREATMENTPROCESS OF VEGETABLE OILS
1.1 Vegetable Oil Composition
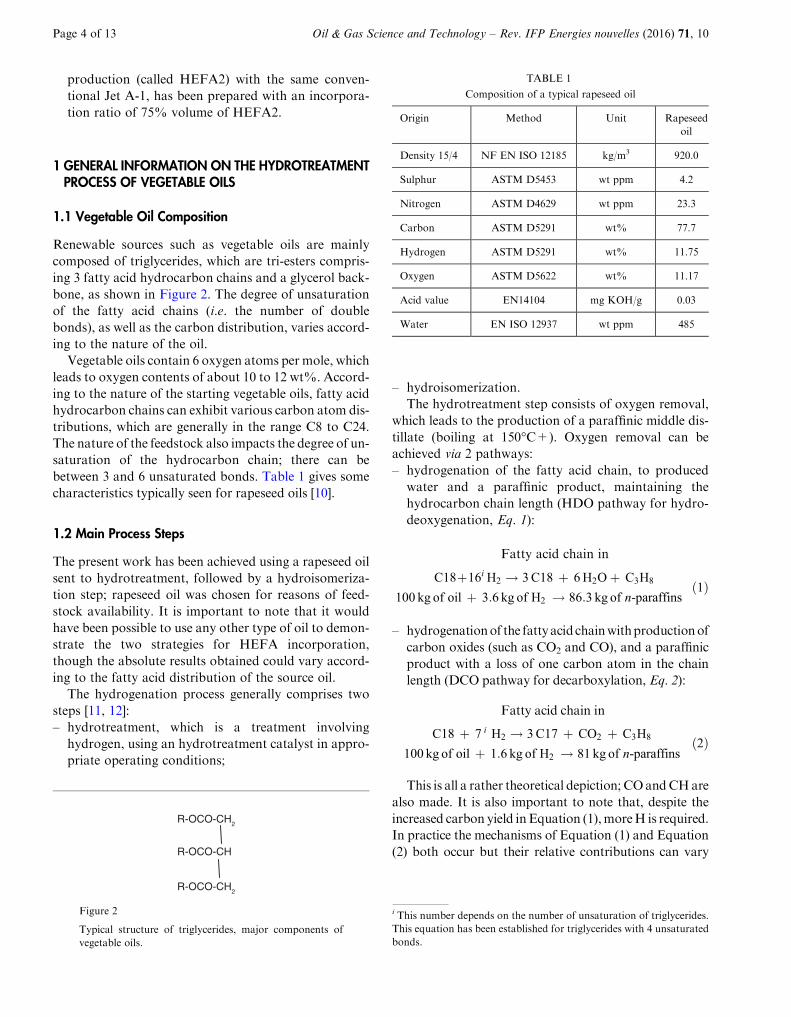
Renewable sources such as vegetable oils are mainly
composed of triglycerides, which are tri-esters compris-
ing 3 fatty acid hydrocarbon chains and a glycerol back-
bone, as shown in Figure 2. The degree of unsaturation
of the fatty acid chains (i.e. the number of double
bonds), as well as the carbon distribution, varies accord-
ing to the nature of the oil.
Vegetable oils contain 6 oxygen atoms per mole, which
leads to oxygen contents of about 10 to 12 wt%. Accord-
ing to the nature of the starting vegetable oils, fatty acid
hydrocarbon chains can exhibit various carbon atom dis-
tributions, which are generally in the range C8 to C24.
The nature of the feedstock also impacts the degree of un-
saturation of the hydrocarbon chain; there can be
between 3 and 6 unsaturated bonds. Table 1 gives some
characteristics typically seen for rapeseed oils [10].
1.2 Main Process Steps
The present work has been achieved using a rapeseed oil
sent to hydrotreatment, followed by a hydroisomeriza-
tion step; rapeseed oil was chosen for reasons of feed-
stock availability. It is important to note that it would
have been possible to use any other type of oil to demon-
strate the two strategies for HEFA incorporation,
though the absolute results obtained could vary accord-
ing to the fatty acid distribution of the source oil.
The hydrogenation process generally comprises two
steps [11, 12]:
– hydrotreatment, which is a treatment involving
hydrogen, using an hydrotreatment catalyst in appro-
priate operating conditions;
– hydroisomerization.
The hydrotreatment step consists of oxygen removal,
which leads to the production of a paraffinic middle dis-
tillate (boiling at 150�C+). Oxygen removal can be
achieved via 2 pathways:
– hydrogenation of the fatty acid chain, to produced
water and a paraffinic product, maintaining the
hydrocarbon chain length (HDO pathway for hydro-
deoxygenation, Eq. 1):
Fatty acid chain in
C18þ16i H2 ! 3C18 þ 6H2Oþ C3H8
100 kg of oil þ 3:6 kg of H2 ! 86:3 kg of n-paraffinsð1Þ
– hydrogenationof the fatty acid chainwithproductionof
carbon oxides (such as CO2 and CO), and a paraffinic
product with a loss of one carbon atom in the chain
length (DCO pathway for decarboxylation, Eq. 2):
Fatty acid chain in
C18 þ 7 i H2 ! 3C17 þ CO2 þ C3H8
100 kg of oil þ 1:6 kg of H2 ! 81 kg of n-paraffinsð2Þ
This is all a rather theoretical depiction; COandCHare
also made. It is also important to note that, despite the
increased carbon yield inEquation (1),moreH is required.
In practice the mechanisms of Equation (1) and Equation
(2) both occur but their relative contributions can varyR-OCO-CH
R-OCO-CH2
R-OCO-CH2
Figure 2
Typical structure of triglycerides, major components of
vegetable oils.
TABLE 1
Composition of a typical rapeseed oil
Origin Method Unit Rapeseed
oil
Density 15/4 NF EN ISO 12185 kg/m3 920.0
Sulphur ASTM D5453 wt ppm 4.2
Nitrogen ASTM D4629 wt ppm 23.3
Carbon ASTM D5291 wt% 77.7
Hydrogen ASTM D5291 wt% 11.75
Oxygen ASTM D5622 wt% 11.17
Acid value EN14104 mg KOH/g 0.03
Water EN ISO 12937 wt ppm 485
i This number depends on the number of unsaturation of triglycerides.
This equation has been established for triglycerides with 4 unsaturated
bonds.
Page 4 of 13 Oil & Gas Science and Technology – Rev. IFP Energies nouvelles (2016) 71, 10

dependingonconditions, catalyst, etc.However, the objec-
tive is to favour the HDO pathway, to maximize the yield
of valuable fuel products.
After this first hydrotreatment section, oxygen is com-
pletely removed, and a pure paraffinic product is
obtained, with typically the same carbon atom distribu-
tion as in the starting feedstock. For instance, starting
from rapeseed oil, the paraffinic product after hydro-
treatment is mainly composed of linear (normal) paraf-
fins (nP) such as nC16, nC17 and nC18. This product
exhibits a very high cetane, but very poor cold flow
properties. This product is located in the Diesel boiling
range, and the yield typically obtained is in the range
80-85 wt% relative to the feed.
Table 2 below gives the boiling and melting points of
some linear paraffins, which are the major hydrocarbon
components of the paraffinic product after hydrotreat-
ment. Note: for pure products, there is a discrete melting
point; for fuels, the melting of wax crystals occurs over a
temperature range and the freezing point for jet fuels is
the temperature at which, on warming up a cold fuel,
the last wax crystals disappear. Therefore for “melting
point”, think freezing point.
After hydrotreatment, the liquid hydrocarbon prod-
uct is a 100% paraffinic Diesel product, composed
mainly of nC16 – nC18 linear paraffins. The boiling
range of the product is consequently 280�C+, well
above the range seen for typical jet fuels.
To improve the cold flow properties of this paraffinic
Diesel, it is necessary to subject the product to a hydro-
isomerization (HIS) treatment, which will convert linear
paraffins into iso-paraffins. This improves low tempera-
ture performance for kerosene applications but has a
detrimental effect on cetane quality in Diesel engine
applications as shown in Figure 3 [13].
The HIS step is generally achieved using an appropri-
ate catalyst in hydrogenation conditions. The catalyst is
a bifunctional one, comprising both a hydrogenation
function and an acid function. The objective, ideally, is
to convert linear paraffins (nP) into iso-paraffins (iP),
while avoiding cracking reactions which lead to yield loss
by formation of gases and naphtha or gasoline cuts (that
boil below 150�C). To be as close as possible to this ideal
situation, an appropriate choice of the catalyst and oper-
ating conditions has to be made.
Here is a general description of the reactions which
take place in the HIS section:
– after hydrotreatment, the hydrocarbon product is a
100% paraffinic Diesel product, with a boiling range
280�C+. It is therefore necessary to convert nP into
iP, to improve cold flow properties, and convert the
Diesel boiling range product into a jet fuel boiling
range product (150-300�C);– when the severity of the HIS section is increased, it
leads to a higher conversion of nP into iP, which leads
to lower boiling and melting points (improved cold
flow) of the hydrocarbons. Consequently Diesel is
progressively converted into jet fuel (kerosene), and
then into gasoline and gases at higher HIS severities.
These lighter cuts (gasoline and gases) may be of lower
value, for example in the EU where there is already a:
surplus of gasoline. From biofuel producers’ perspec-
tives, the discussion would need to be: a) Diesel versus;
b) Diesel+low amounts high freeze jet component
versus; c) not much Diesel+larger amounts of low
freeze jet component.
At the end of the HIS step, there is a final distillation
step to remove gasoline range material.
To summarize, the challenge of HIS operation for
HEFA production is to convert a paraffinic Diesel
into a paraffinic jet fuel. As jet fuel is an intermedi-
ate product between Diesel and gasoline, there is
an optimum degree of conversion in terms of jet
fuel yield. This optimum can be attained by select-
ing the more appropriate catalyst as well as care-
fully tuning the operating conditions. This is the
condition to reach the maximum jet fuel yield,
together with jet fuel quality meeting the specifica-
tions (distillation range and cold flow properties,
i.e. freezing point when referring to jet fuel).
TABLE 2
Boiling and melting points of nC16, nC17 and nC18
nC16 nC17 nC18
Boiling point (�C) 286.9 302.2 316.7
Melting point (�C) 18 22 28.6
+28°C+18°C
-6°C-23°C
-78°C
-70°C-106°C
Melting point(°C)
DieselKero
Gasoline
N-paraffins Iso-paraffins
Carbon number
Cet
ane
num
ber
4 6 8 10 12 14 16 18 20 220
20
40
60
80
100
120
Figure 3
Melting point and cetane number of some normal and iso-
paraffins present in the jet fuel and Diesel range [13].
Oil & Gas Science and Technology – Rev. IFP Energies nouvelles (2016) 71, 10 Page 5 of 13

Figure 4 below shows the typical evolution of yields
during HIS operation. There is a maximum jet fuel yield,
which can be reached by carefully tuning the severity of
HIS operation. The severity has to be sufficient to con-
vert the hydrocarbons from the Diesel range (280�C+)
into the jet fuel range (150-300�C), but not too high, to
avoid excessive production of less economically attrac-
tive gases and gasoline (150�C) components.
1.3 Final Product Properties
The specifications requirements included in Table 3 have
to be met in the final jet fuel after blending. It should be
noted that it is necessary to blend the paraffinic jet fuel
with a conventional jet fuel from petroleum, since an
8% volume minimum aromatics content is specified, to
comply with material compatibility requirements. The
current certification for HEFA allows no more than
50% volume HEFA in the final jet fuel, in part to help
achieve this minimum aromatics level.
2 PRODUCTION OF HEFA JET FUELS WITH VARIOUSQUALITY REQUIREMENTS
2.1 Neat Materials (HEFA and Jet Fuels)
The previous section showed that there is an optimum
conversion in terms of jet fuel yield and quality.
Cold flow properties improvement
Pro
duct
dis
trib
utio
n
Jet range
Diesel range
Naphtha and lightends
Figure 4
Impact of cold flow properties on kerosene yield of HEFA
(source: IFP Energies nouvelles).
TABLE 3
Characteristics of the Jet A-1 fuels used in this work
Analysis Unit Jet A-1 specifications Jet fuel A Jet fuel B
Density 15�C kg/m3 775-840 803.3 821.0
Sulfur wt ppm 3 000 maximum 697 <5
Total aromatics vol% 25.0 max (FIA) 16.1 20.2
26.5 max (hplc) 18.9 20.4
Distillation Initial point �C 147.6 152.1
T10 D86 �C 205 max 167.0 170.2
T20 D86 �C 175.5 176.6
T50 D86 �C 199.0 201.5
T90 D86 �C 245.3 240.2
Final point D86 �C 300 max 270.6 258.9
T90-T10 D86 �C 22 min 78.3 70.0
Freezing point �C �47 max �49.6 �64.9
Smoke point mm 25 min or 19 min (*) 21 19
Viscosity at �20�C mm2/s 8.0 max 4.04 4.19
Flash point �C 38 min 40.5 42.5
(*) and Naphthalenes < 3.0 wt% (D1840).
Page 6 of 13 Oil & Gas Science and Technology – Rev. IFP Energies nouvelles (2016) 71, 10

The target which is set for HEFA jet fuel quality (freez-
ing point in particular) consequently has an impact on
the overall jet fuel yield.
The objective of this work was to examine the possi-
bility of relaxing the quality requirement for the freezing
point of the HEFA jet fuel component, and to estimate
the corresponding gain of yield. It was decided to set
two distinct freezing point targets for the jet fuel candi-
date HEFA:
– one HEFA to have a freezing point close to �20�C;– one HEFA to have a freezing point below �47�C.
Table 4 presents the cold flow properties, freezing
point and viscosity at �20�C, for the HEFA that were
produced from rapeseed oil for this study.
Two different jet fuels were used to prepare further
blends with HEFA1 and HEFA2. A first Jet A-1 (Jet
fuel A) with conventional characteristics and a second
Jet A-1 (Jet fuel B), with some more extreme but still
“on spec” properties (in particular, exceptionally good
freezing point). The main characteristics of the conven-
tional Jet A-1 used for this work are gathered in
Table 3.
2.2 Strategy of Blending and Characterization
Two blending strategies were adopted to optimise the
amount of each HEFA which could be incorporated into
Jet fuel A and Jet fuel B based on freezing point and vis-
cosity at �20�C.Jet fuel A: this fuel offered a typical freezing point
of �49.6�C and a low blending ratio strategy of 10%,
20% and 30% volume was adopted for HEFA1 due
to the �27�C freezing point of this product. HEFA2
however, offered an excellent �57.5�C freezing point
was therefore blended at one high concentration,
75% volume.
Jet fuel B: this fuel offered an excellent freezing point
of �64.9�C allowing greater scope for blending HEFA1
and a concentration range of 20%, 30%, 40%, 50%,
60%, 70% volume was selected. While no freezing point
issues were expected for blending HEFA2, a broad range
of concentrations was also chosen 25%, 40%, 50%, 60%
and 75% volume to investigate if any other specification
constraints might limit incorporation.
Tables 5 and 6 present the characteristics of blends of
Jet fuel A with HEFA1 and HEFA2, respectively.
The main conclusions from the analysis are as follows:
– all blends have densities that match predicted densi-
ties, within method precision – the blending is reliably
linear by volume and the mixing steps have produced
homogeneous blends;
– all the blends met the current ASTM specifications
except for freezing point (for some blends with
HEFA1) and aromatic content (blend with HEFA2);
– blending HEFA in conventional fuels produces sub-
stantial increases (improvements) in smoke point;
– all the HEFA blend fuels have Lower Heating Values
(LHV) higher than the minimum limit imposed by the
specification and the blending of HEFA in conven-
tional jet fuel resulted in an increase of mass LHV
as expected from the component data.
If we focus on cold flow properties, the main results
obtained for freezing points are presented in Figure 5.
The main conclusions are:
– HEFA1 blending ratio is limited by the freezing point.
Nevertheless, significant blending ratios can be
obtained before reaching this limit. With Jet fuel A
this maximum blending ratio has been estimated to
be 16%volume. Nevertheless, this point has to be fur-
ther checked and does not represent a fixed value;
there can be measurement uncertainties with freezing
points of highly hydroprocessed fuels and the maxi-
mum ratio will also be very dependent on the freezing
point of the crude oil based component;
– HEFA2 can be blended at any concentration without
any limitation on the freezing point, due to the very
good freezing point of the pure product;
– with Jet fuel A, the blend freezing point behaviour for
both HEFA seems to be close to linearity, which could
mean that the maximum blending ratio could be easily
calculated according to pure product properties. The
blending ratio of these HEFA could consequently be
adjusted, taking into account the initial freezing point
of the conventional Jet A-1.Nevertheless, this point still
has to be confirmed using other Jet A-1, to check that
this linearity is not dependent on Jet A-1 composition.
As far as viscosity is concerned, the best fit to the
results is not always linear, particularly for HEFA1, a
fuel whose freezing point is only slightly lower than the
�20�C test condition. Nevertheless, starting from a vis-
cosity of 4 mm2/s for the pure Jet A-1 (which is represen-
tative of typical Jet A-1 available on the market), a blend
of 75% HEFA2 still stays below the specification viscos-
ity limit. Moreover, all the blends made with HEFA2 are
expected to pass the ASTM D7566 viscosity limit
(8 mm2/s at �20�C). These results are presented in
Figure 6.
TABLE 4
Cold flow properties of HEFA1 and HEFA2
Analysis Unit HEFA1 HEFA2
Freezing point �C �27�C �57.5�C
Viscosity at �20�C mm2/s 11.72 7.52
Oil & Gas Science and Technology – Rev. IFP Energies nouvelles (2016) 71, 10 Page 7 of 13

Following the blend production and test results dis-
cussed above, blends were made with another Jet A-1,
Jet fuel B, that has excellent low temperature results;
as shown in Table 3, it has a significantly better freeze
point than average and represents a close to “best case”
blend partner for a poorer freezing point HEFA
TABLE 5
Characteristics of blends of Jet fuel A with HEFA1
Analysis Unit Jet A-1
specifications
Jet fuel HEFA1 Jet + 10%
HEFA1
Jet + 20%
HEFA1
Jet + 30%
HEFA1
Density 15�C kg/m3 775-840 803.3 773.5 800.0 797.0 794.0
Total aromatics (hplc) vol% 26.5 max 18.9 0.0 16.9 15.0 13.3
Distillation Initial �C 147.6 174.2 148.7 153.6 152.4
T10 �C 205 max 167.0 201.2 170.2 174.5 174.5
T20 �C 175.5 218.4 179.6 183.3 184.0
T50 �C 199.0 267.5 204.7 210.7 214.5
T90 �C 245.3 288.9 260.8 271.1 277.4
Final �C 300 max 270.6 293.2 282.8 288.5 289.5
T90-T10 �C 22 min 78.3 87.7 90.6 96.6 102.9
Freezing point �C �47 max �49.6 �27 �49.0 �46.5 �44.5
Smoke point mm 25 min or
19 min (*)
21 > 50 25.0 26.0 28.0
Viscosity at �20�C mm2/s 8.000 max 4.04 11.72 4.426 4.859 5.363
Flash point �C 38 min 40.5 67 43 43.5 45
Specific energy, net MJ/kg 42.8 min 43.25 44.07 43.31 43.41 43.49
(*) and Naphthalenes < 3.0 wt% (D1840).
y = 0.2351x - 50.842R2 = 0.9927
y = -0.0805x - 49.673R2 = 0.9961-60
-55
-50
-45
-40
-35
-30
-25
-200 20 40 60 80 100
HVO in jet A-1(%vol.)
Fre
ezin
g po
int (
°C)
HEFA1HEFA2Linear HEFA1Linear HEFA2
Jet A-1 -47°C min
Figure 5
Impact of HEFA content on final blend freezing point for
blends in Jet fuel A.
0
2
4
6
8
10
12
14
0 20 40 60 80 100
HVO in jet fuel (%vol.)
Vis
cosi
ty a
t -20
°C (
mm
2 /s)
Jet A-1 8 mm2/s max
y = 0.2351x - 50.842R2 = 0.9927
y = -0.0805x - 49.673R2 = 0.9961
HEFA1HEFA2Polynominal HEFA1Linear HEFA2
Figure 6
Impact of HEFA in Jet fuel A blending rate on final blend
viscosity at �20�C.
Page 8 of 13 Oil & Gas Science and Technology – Rev. IFP Energies nouvelles (2016) 71, 10

component. Its freezing point of �64.9�C is the highest
reported for the fuel; analysts sometimes prefer not to
determine freezing points accurately below an arbitrary
temperature in the range �60 to �75�C as this takes
more time and/or more effort to control such low tem-
peratures. With this greater than 15�C improvement in
freezing point compared to Jet fuel A, it was possible
to consider higher levels of HEFA in the two sets of
blends created. Table 7 summarises data for the seven
blends created with HEFA1 and Table 8 provides data
for the 5 blends with HEFA2; data for the neat HEFA
and Jet fuel A and B are in Table 3, and Table 4.
As shown in Figure 7, Jet fuel B has extended the
range over which HEFA1 can be blended and still
achieve Jet A-1 requirements. The best fit for HEFA1
is now polynomial, with freezing points being higher
(poorer) than a linear blend rule would expect. Based
on the fit the highest level of HEFA1 to pass the Jet
A-1 freezing point would be about 35% volume (or
30% based on actual data points). This is higher than
seen with Jet fuel A. If only a Jet A freezing point needed
to be met (�40�C maximum), the fit and actual data
points would both suggest upper limits of 51% volume.
For the HEFA2 blends the results are best described as
“scattered”; there may or may not be a sweet spot
around 60% volume with an exceptionally low freezing
point (similar to behaviour seen with some GTL SPK
[14]); many of the results are likely to be affected by
the analyst’s observation preference and the overriding
message is that all the HEFA2 blends in Jet fuel B have
very good freezing points, with no limits on HEFA2 con-
tent being caused by freeze point.
Viscosity data repeat the patterns seen with Jet fuel A:
Figure 8 shows that the HEFA2 blends follow an
approximately linear by volume behaviour while the
HEFA2 blends are better fitted by a polynomial fit.
HEFA1 blends above 63% volume fail the 8 mm2/s limit,
while all HEFA2 blends pass.
The limiting factor for HEFA2 blends would be set by
the 8.8% volume total aromatics by hplc method, if the
50% maximum were not applied.
In summary, the maximum volume percentages of
the HEFA in the two Jet A-1 are as in Table 9,
Figure 9 and Figure 10. Given that in a country using
Jet A rather than Jet A-1 there may not be many very
good freezing point fuels like Jet fuel B, this does
indicate that HEFA1 will probably have an upper
limit of 30 to 35% volume; more typically HEFA1
be limited to values in the range 15 to 20% volume
for Jet A-1 production.
TABLE 6
Characteristics of blends of Jet fuel A with HEFA2
Analysis Unit Jet A-1
specifications
Jet fuel HEFA2 Jet + 75% HEFA2
Density 15�C kg/m3 775-840 803.3 765.9 775.0
Total aromatics (hplc) vol% 26.5 max 18.9 0.0 4.8
Distillation Initial �C 147.6 188.0 171.8
T10 �C 205 max 167.0 201.6 192.2
T20 �C 175.5 206.7 199.2
T50 �C 199.0 224.7 218.9
T90 �C 245.3 279.9 276.0
Final �C 300 max 270.6 287.3 287.2
T90-T10 �C 22 min 78.3 78.3 83.8
Freezing point �C �47 max �49.6 �57.5 �56
Smoke point mm 25max or 19 max (*) 21 > 50 41
Viscosity at �20�C mm2/s 8.0 max 4.04 7.517 6.335
Flash point �C 38 min 40.5 68.0 58.0
Specific energy, net MJ/kg 42.8 min 43.25 44.11 43.89
(*) and Naphthalenes < 3.0 wt% (D1840).
Oil & Gas Science and Technology – Rev. IFP Energies nouvelles (2016) 71, 10 Page 9 of 13

2.3 Production Yield
Figure 11 shows the yield improvement for HEFA1 and
HEFA2 production. It appears that lowering the severity
of HIS operation, for production of HEFA1, leads to a
gain of jet and Diesel fuel yield and particularly a gain of
jet fuel yield to more than +10 points of mass yield rel-
ative to the oil.
For a given quantity of jet fuel produced, this poten-
tially allows a reduction in the land surface area necessary
for cultivation of the HEFA feedstock by at least 10%.
SUMMARY AND CONCLUSIONS
World wide air traffic has been steadily increasing for
many years and is predicted to grow in the future.
TABLE 7
Properties of blends of HEFA1 with Jet fuel B
%vol. HEFA1 in Jet fuel B 20 30 40 50 60 70
Analysis Unit
Density 15�C kg/m3 811.3 806.7 802.1 797.4 792.7 788.1
Total aromatics (hplc) vol% 17.5 15.1 12.9 10.8 8.8 6.7
Distillation Initial �C 153.9 155.4 157.1 159.6 161.9 165.7
T10 �C 172.5 174.4 176.3 179.1 182.2 185.7
T20 �C 179.9 182.6 185.6 188.5 192.9 197.0
T50 �C 208.9 213.9 219.4 227.0 234.3 243.1
T90 �C 264.3 273.2 277.4 282.1 283.7 285.4
Final �C 283.5 286.7 289.1 289.6 290.6 290.9
T90-T10 �C 91.8 98.8 101.1 103.0 101.5 99.7
Freezing point �C �58.8 �47.8 �42.8 �40.2 �37.1 �34.6
Smoke point mm 21.5 22.0 24.5 25.5 30.0 34.0
Viscosity at �20�C mm2/s 5.063 5.504 6.059 6.100 7.412 8.229
Flash point �C 44.0 46.0 47.0 49.5 51.0 53.5
Specific energy, net MJ/kg 43.215 43.325 43.426 43.535 43.636 43.741
y = -0.0024x2 + 0.6317x - 66.171R² = 0.9754
y = 0.0683x - 68.786R² = 0.158
-80-75-70-65-60-55-50-45-40-35-30-25-20
0 20 40 60 80 100
HVO in jet fuel (%vol.)
Fre
ezin
g po
int (
°C)
HEFA1HEFA2Polynomial HEFA1Linear HEFA2
Lower than
Jet A1 -47°C min
Figure 7
Freezing points for blends of HEFA1 and HEFA2 with Jet
fuel B.
y = 0.0006x2 + 0.0153x + 4.35R² = 0.9915
y = 0.033x + 3.9928R² = 0.9802
0
2
4
6
8
10
12
14
0 20 40 60 80 100
HVO in jet fuel (%vol.)
Vis
cosi
ty a
t -20
°C (
mm
2 /s)
HEFA1HEFA2Polynomial HEFA1Linear HEFA2
Jet A-1 8 mm2/s max
Figure 8
Viscosity for HEFA blends made with Jet fuel B.
Page 10 of 13 Oil & Gas Science and Technology – Rev. IFP Energies nouvelles (2016) 71, 10

Besides, the increased focus on climate change over the
last decade has created pressure to reduce greenhouse
gases emissions. One solution for the aeronautics sector
to satisfy the objective of CO2 reduction is the use of
alternative fuel such as HEFA.
HEFA are produced from hydrogenation of mainly
vegetable oils. This process generally comprises two
steps: hydrotreatment and hydroisomerization. The
process yield for HEFA remains limited because of
the isomerisation step that allows production of a bio-
fuel with very good cold flow properties. This work
proposes to relax the freezing point requirement for
the neat HEFA component (by decreasing the severity
of the isomerisation step) in order to minimize the
TABLE 8
Properties of blends of HEFA2 with Jet fuel B
%vol. HEFA2 in Jet fuel B 25 40 50 60 75
Analysis Unit
Density 15�C kg/m3 807.0 799.0 793.6 788.0 779.6
Total aromatics (hplc) vol% 16.2 13.1 11.0 9.1 5.5
Distillation Initial �C 157.0 159.9 165.1 168.2 175.7
T10 �C 174.9 178.5 181.7 185.4 191.0
T20 �C 182.3 186.4 189.5 192.4 197.2
T50 �C 205.6 209.1 211.3 213.9 217.4
T90 �C 251.7 260.3 263.5 268.2 272.8
Final �C 275.7 280.1 282.2 283.2 284.5
T90-T10 �C 76.8 81.8 81.8 82.8 81.8
Freezing point �C �65.9 �67.3 �67.0 <�75.0 �60.0
Smoke point mm 20.5 22.0 26.0 33.0 34.0
Viscosity at �20�C mm2/s 4.811 5.190 5.495 5.876 6.412
Flash point �C 45.5 47.5 49.5 52.0 56.0
Specific energy, net MJ/kg 43.262 43.423 43.531 43.642 43.819
16.3
46
35
51
0
10
20
30
40
50
60
Jet fuel A Jet fuel B
Jet A-1 specification Jet A specification
Max
ble
nd fo
r H
EF
A (
%)
Figure 9
Maximum blend % volumes for HEFA1 / Jet fuels combi-
nations neglecting current 50% specification limit.
52
59
0
10
20
30
40
50
60
70
Jet fuel A Jet fuel B
Max
ble
nd fo
r H
EF
A (
%)
Figure 10
Maximum blend % volumes for HEFA2 / Jet fuels combi-
nations neglecting current 50% specification limit.
Oil & Gas Science and Technology – Rev. IFP Energies nouvelles (2016) 71, 10 Page 11 of 13

production of less valuable light compounds. This
strategy could lead to a significant additional biofuel
yield with respect to the oil. Then this experimental
study determines if a combination of processing/blend-
ing is possible to optimise HEFA incorporation for
industry benefit.
A rapeseed oil was used for this study. The choice of
this oil has been done for reasons of feedstock availabil-
ity. It was decided to set two distinct freezing point tar-
gets for the jet fuel candidate HEFA: one HEFA to have
a freezing point close to�20�C and the other one HEFA
to have a freezing point below�47�C.Moreover two dif-
ferent jet fuels were used for the blends. A first Jet A-1
with conventional characteristics and a second Jet A-1,
with some more extreme but still “on spec” properties
(in particular, exceptionally good freezing point).
It has been shown that these HEFA can be blended in
significant volumes in a conventional Jet A-1. The upper
limits in terms of incorporation are:
– the freezing point for the HEFA1 (�27�C). HEFA1
can be incorporated at up to 30-35% volume before
failing Jet A-1 freezing point. The incorporation ratio
is dependant of the jet fuel quality regarding cold flow
behavior;
– the aromatic content of the final blend for the intro-
duction of HEFA2 (�57.5�C). However, HEFA2
can be incorporated at up to 59% before failing to
achieve the minimum total aromatics content. With
a higher aromatics jet fuel that has excellent freezing
point characteristics, higher levels of HEFA can be
incorporated, though the limiting properties remain
the same.
These preliminary tests have shown that by combining
processing conditions in combination with blending
strategies there is a potential to enhance the incorpora-
tion of HEFA in conventional jet fuel. The blending of
a high amount of a low freezing point HEFA could allow
higher incorporation rates in the long term, while the
incorporation of high freezing point HEFA in smaller
%vol. could allow HEFA incorporation to be started
in the shorter term, while optimizing the process yield.
This strategy is more in accordance with biomass avail-
ability. Nevertheless, it has to be stressed that these are
only preliminary results and need important validation
work, such as fitness for purpose tests recommended in
ASTMD4054, before going into the certification process
and being industrially used.
ACKNOWLEDGMENTS
This work was done as an additional contribution to the
SWAFEA Project and the contributors are Shell Global
Solutions and IFP Energies nouvelles.
REFERENCES
1 Advisory Council on Aeronautics Research in Europe(ACARE (2010) Aeronautics and air transport: beyondvision 2020 (towards 2050).
TABLE 9
Maximum blend % volumes for HEFA/Jet A-1 combinations neglecting current 50% specification limit
HEFA Jet A-1 Limit %vol. Limiting property Blend rule
HEFA1 Jet fuel A 16.3 Freezing point Jet A-1
46 Freezing point Jet A
HEFA1 Jet fuel B 35 (fit) or 30 (data point) Freezing point Jet A-1
51 Freezing point Jet A
HEFA2 Jet fuel A 52 Total aromatics Linear by volume
HEFA2 Jet fuel B 59 Total aromatics (hplc) Linear by volume
Cold flow properties improvement
Pro
duct
dis
trib
utio
n
Jet range
Diesel range
Naphtha and lightends
HE
FA
1
HE
FA
2
Figure 11
Yield improvement for HEFA production (source: IFP
Energies nouvelles).
Page 12 of 13 Oil & Gas Science and Technology – Rev. IFP Energies nouvelles (2016) 71, 10

2 http://www.airbus.com, Airbus Global market forecast2010-2029.
3 Pachauri R.K., Reisinger A. (2007) Contribution of workinggroups I, II and III to the fourth assessment report of theintergovernmental panel on climate change, Intergovern-mental Panel on Climate Change (IPCC), Geneva Switzer-land.
4 American Society for Testing and Materials (2009) Stan-dard Specification for Aviation Turbine Fuel ContainingSynthesized Hydrocarbons, ASTM D7566 – 10.
5 Moses C.A. (2008) Comparative evaluation of semi-synthetic jet fuels, CRC project No. AV-02-04a, Sept.
6 American Society for Testing and Materials) (2011)Standard Specification for Aviation Turbine Fuel ContainingSynthesized Hydrocarbons, ASTM D7566 – 11a.
7 http://www.swafea.eu.
8 Simacek P., Kubicka D., Sebor G., Pospisil M. (2010) Fuelproperties of hydroprocessed rapeseed oil, Fuel 89, 609-615.
9 Lapuerta M., Villajos M., Agudelo J.R., Boehman A.L.(2011) Key properties and blending strategies of hydro-treated vegetable oil as biodiesel for Diesel engines, FuelProcessing Technology 92, 2406-2411.
10 Ballerini D. (2011) Les Biocarburants – Repondre aux defisenergetiques et environnementaux des transports, EditionsTechnip, Paris, France.
11 Huber G.W., O’Connor P., Corma A. (2007) Processingbiomass in conventional oil refineries: production of highquality Diesel by hydrotreating vegetable oils in heavy vac-uum oil mixtures, Applied Catalysis A: General 329, 120-129.
12 Simacek P., KubickaD., Kubickova I., Homola F., PospisilM.,Chudoba J. (2011) Premiumquality renewableDiesel byhydroprocessed of sunflower oil, Fuel 90, 2473-2479.
13 Bloch M. (2010) State-of-the-Art BTL and HVO Produc-tion Processes and the Challenges for the Production ofBio-based Jet Fuel, SWAFEA 2nd European StakeholderConference, Munich Germany, July.
14 Bauldreay J.M., Heins R.J., Smith J. (2003) Synthetic jetfuels and their role in the future, 8th InternationalConference on Stability, Handling and Use of Liquid Fuels,Steamboat Springs, CO, USA, 14-19 Sept.
Manuscript accepted in January 2014
Published online in June 2014
Cite this article as: L. Starck, L. Pidol, N. Jeuland, T. Chapus, P. Bogers and J. Bauldreay (2014). Production of HydroprocessedEsters and Fatty Acids (HEFA) – Optimisation of Process Yield, Oil Gas Sci. Technol 71, 10.
Oil & Gas Science and Technology – Rev. IFP Energies nouvelles (2016) 71, 10 Page 13 of 13