Producer Price Index - statssa.gov.za · 2 Chapter 1: Introduction to the South African PPI 1.1...
39
THE SOUTH AFRICA I KNOW, THE HOME I UNDERSTAND Producer Price Index Methods, Sources and Theory v.2.0 October 2018
Transcript of Producer Price Index - statssa.gov.za · 2 Chapter 1: Introduction to the South African PPI 1.1...

THE SOUTH AFRICA I KNOW, THE HOME I UNDERSTAND
Producer Price Index
Methods, Sources and Theory
v.2.0 October 2018

1
Contents Chapter 1: Introduction to the South African PPI ................................................................................. 2 1.1 Background on price indices ................................................................................................................... 2 1.2 Definition of the PPI ............................................................................................................................... 2 1.3 Uses of the PPI ..................................................................................................................................... 3 Chapter 2: Types of producer price indices ......................................................................................... 4 2.1 Overview .............................................................................................................................................. 4 2.1.1 Stages-of-production ............................................................................................................................... 4 2.2 Aggregation of the South African PPI ....................................................................................................... 4 Chapter 3: Classification........................................................................................................................ 6 3.1 Background .......................................................................................................................................... 6 3.2 The structure of classification of the South African PPI ............................................................................... 7 Chapter 4: Weighting sources and derivation ...................................................................................... 9 4.1 Industry weights .................................................................................................................................... 9 4.2 Product weights ..................................................................................................................................... 9 4.3 PPI weight selection ............................................................................................................................. 10 4.4 Review of the PPI weights .................................................................................................................... 11 Chapter 5: Basket of goods ................................................................................................................. 12 5.1 Introduction ......................................................................................................................................... 12 5.2 Selection criteria for basket of goods ...................................................................................................... 12 5.3 The number of products in the basket .................................................................................................... 12 Chapter 6: Sampling ............................................................................................................................. 13 6.1 Introduction ......................................................................................................................................... 13 6.2 Selection of businesses (respondents) ................................................................................................... 13 6.3 Selection of a sampled product from the respondent ................................................................................ 13 Chapter 7: Data collection and processing (includes editing and data quality evaluation) ............ 14 7.1 Introduction ......................................................................................................................................... 14 7.2 Collection period and frequency ............................................................................................................ 14 7.3 Type of prices collected ........................................................................................................................ 15 7.4 Processing and data validation .............................................................................................................. 15 Chapter 8: Imputations in the PPI ....................................................................................................... 16 Chapter 9: Index calculation ................................................................................................................ 17 9.1 Overview ............................................................................................................................................ 17 9.2 Elementary indices .............................................................................................................................. 17 9.3 High-level indices ................................................................................................................................ 18 9.4 Graphical example of the aggregation structure of the PPI ........................................................................ 19 9.5 Linking of the PPI ................................................................................................................................ 20 9.5.1 Features of a linked index ....................................................................................................................... 20 9.5.2 Method of linking the PPI ........................................................................................................................ 21 Bibliography ......................................................................................................................................... 23 Appendix A: Input and Output CPCs .................................................................................................. 25 Appendix B: Basket of products in the PPI, price collection methodology and frequencies ......... 28 B1: Agriculture, Forestry and Fishing ......................................................................................................................... 28 B2: Mining and Quarrying ........................................................................................................................................... 29 B3: Electricity and Water ............................................................................................................................................ 30 B4: Manufacturing (Input) ........................................................................................................................................... 30 B5: Manufacturing (Output) ........................................................................................................................................ 32

2
Chapter 1: Introduction to the South African PPI
1.1 Background on price indices
Four of the principal price indices in the system of economic statistics—the PPI, the Consumer Price Index
(CPI), and the Export and Import price indices—are well known and closely watched indicators of
macroeconomic performance. They are direct indicators of the purchasing power of money in various types
of transactions and other flows involving goods and services. As such, they are also used to deflate
nominal measures of goods and services produced, consumed, and traded to provide measures of
volumes.
The IMF’s PPI manual (2004) identifies 10 steps to design, construct, disseminate, and maintain a
producer price index. These are:
1. Determining the objectives, scope, and conceptual basis of the index;
2. Deciding on the index coverage and classification structure;
3. Deriving the weighting pattern;
4. Designing the sample;
5. Collecting and editing the prices;
6. Adjusting for changes in quality;
7. Calculating the index;
8. Disseminating the indices;
9. Maintaining samples of businesses and product specifications; and
10. Reviewing and reweighting the index.
This manual will cover steps one to five, step seven; and steps nine to ten.
1.2 Definition of the PPI
The PPI indicates changes in producer prices of locally produced commodities including exports. The PPI
is defined as “A measure of the change in the prices of goods either as they leave their place of production
or as they enter the production process” (OECD, 2006).
3
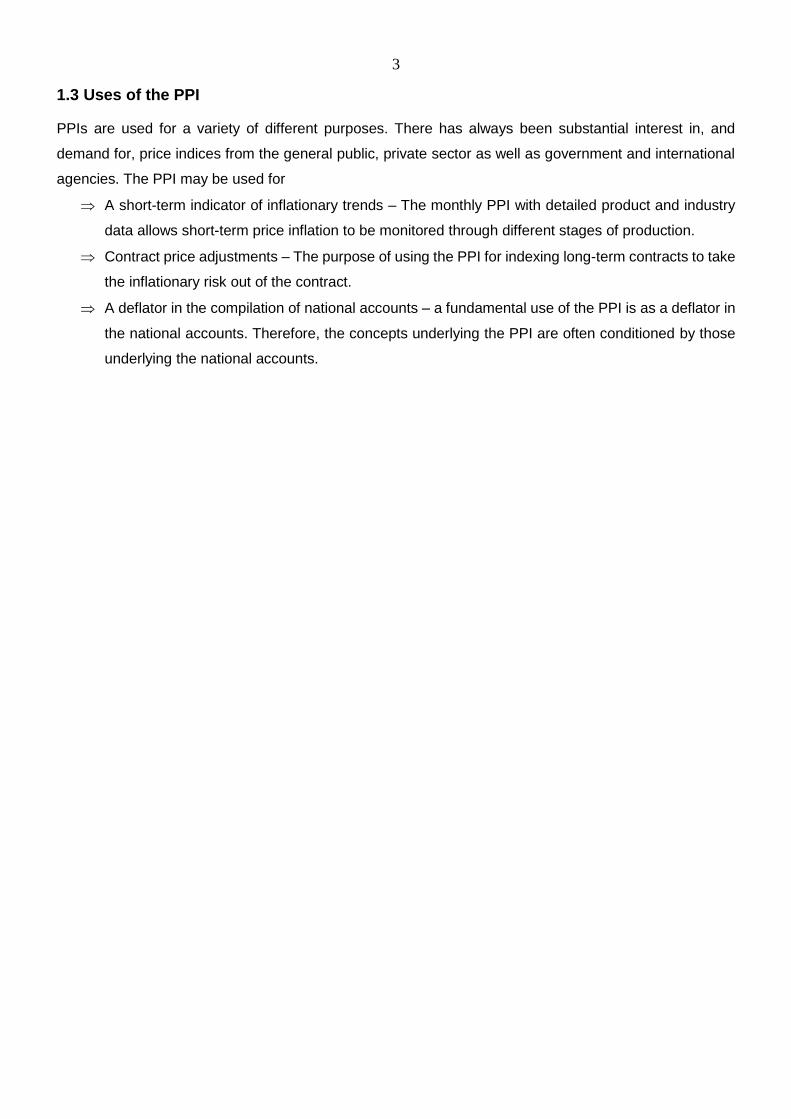
1.3 Uses of the PPI
PPIs are used for a variety of different purposes. There has always been substantial interest in, and
demand for, price indices from the general public, private sector as well as government and international
agencies. The PPI may be used for
A short-term indicator of inflationary trends – The monthly PPI with detailed product and industry
data allows short-term price inflation to be monitored through different stages of production.
Contract price adjustments – The purpose of using the PPI for indexing long-term contracts to take
the inflationary risk out of the contract.
A deflator in the compilation of national accounts – a fundamental use of the PPI is as a deflator in
the national accounts. Therefore, the concepts underlying the PPI are often conditioned by those
underlying the national accounts.

4
Chapter 2: Types of producer price indices
2.1 Overview
The aggregation of the PPI may take various forms; the South African PPI uses the stages of production
approach. With this concept, each commodity is allocated to the stage in which it is used.
Alternatives are the stage of processing, net output price indices per industry, PPI for the country or region,
etc. The selection of the aggregation method depends on the intended uses of the PPI.
2.1.1 Stages-of-production
For this approach each commodity is allocated to the stage in which it is used. A product is included in
each stage to which it contributes, and not assigned solely to one stage (OECD, 2006). The classification
of products to the different stages is usually achieved by reference to input-output (I/O) tables in order to
avoid multiple counting of the stages that are not aggregated.
This type of PPI has two types of indices. Output indices measure the change in price of products sold as
output for final consumption by domestic producers, while input indices concern intermediate products
used as inputs in the production process.
Both PPI output and input indices show changes in prices before the addition of deductible taxes on
products such as VAT. This is similar to an ex-factory price or the revenue actually received by a producer.
2.2 Aggregation of the South African PPI
When selecting an aggregation type, a number of questions are required to be taken into consideration.
The OECD (Maitland-Smith, 2000: 3) sets the following list as a guideline to the selection of aggregation
type:
a) Will the PPIs be used for deflation of outputs (and inputs?), and/or as a measure of inflation?
b) Assuming that a choice has to be made, are industry PPIs of higher priority than product PPIs or vice
versa?
c) Which industries and products should be covered? At what level of detail?
d) Will separate indices be compiled for export and domestic market prices?
e) Which prices are we trying to measure? Producer prices, wholesale prices?
f) What will the geographical coverage be? National, regional?
g) Monthly or quarterly time series?

5
With the analysis of these guidelines, the level of aggregation most suited to the South African PPI is the
stages-of-production approach. The decision rests on the fact that although the PPI is a key inflation
indicator, it is also used for deflation of the national accounts. The approach of the PPI gives a value-chain
perspective on the level of inputs and outputs, and eliminates double counting.
The tables published in the current PPI include industry (divided into input and output) and product
information. Industry tables available are:
Table 1: Industry tables
Industry Input Output
Agriculture, forestry and fishing X
Mining X
Manufacturing X X
Water, gas and electricity X
Appendix A gives the Input and Output 3-digit group CPC for each of the higher-level industries.

6
Chapter 3: Classification
3.1 Background
The PPI uses two classification systems, the Central Product Classification (CPC) and Standard Industrial
Classification (SIC) systems. As the name suggests, the CPC is used to identify and aggregate products.
The CPC is a classification based on the physical characteristics of goods or on the nature of the services
rendered. Each type of good or service distinguished in the CPC is defined in such a way that it is normally
produced by only one activity as defined in ISIC, the International Standard Industrial Classification of All
Economic Activities - this classification is the international standard for the classification of productive
economic activities. Its main purpose is to provide a standard set of economic activities so that entities can
be classified according to the activity they carry out.
The CPC covers products that are an output of economic activities, including transportable goods, non-
transportable goods and services (OECD, 2006).
It is a 5-digit classification system, consisting of:
Sections – one digit code;
Divisions – two-digit code;
Groups – three-digit code;
Classes – four-digit code;
Subclasses – five-digit code
Each product grouping is then assigned an industry classification according to SIC, which classifies the
different industries. Standard Industrial Classification version 5 (SIC v5) and Central Product Classification
version 2 (CPC v2) are used in the PPI.
7
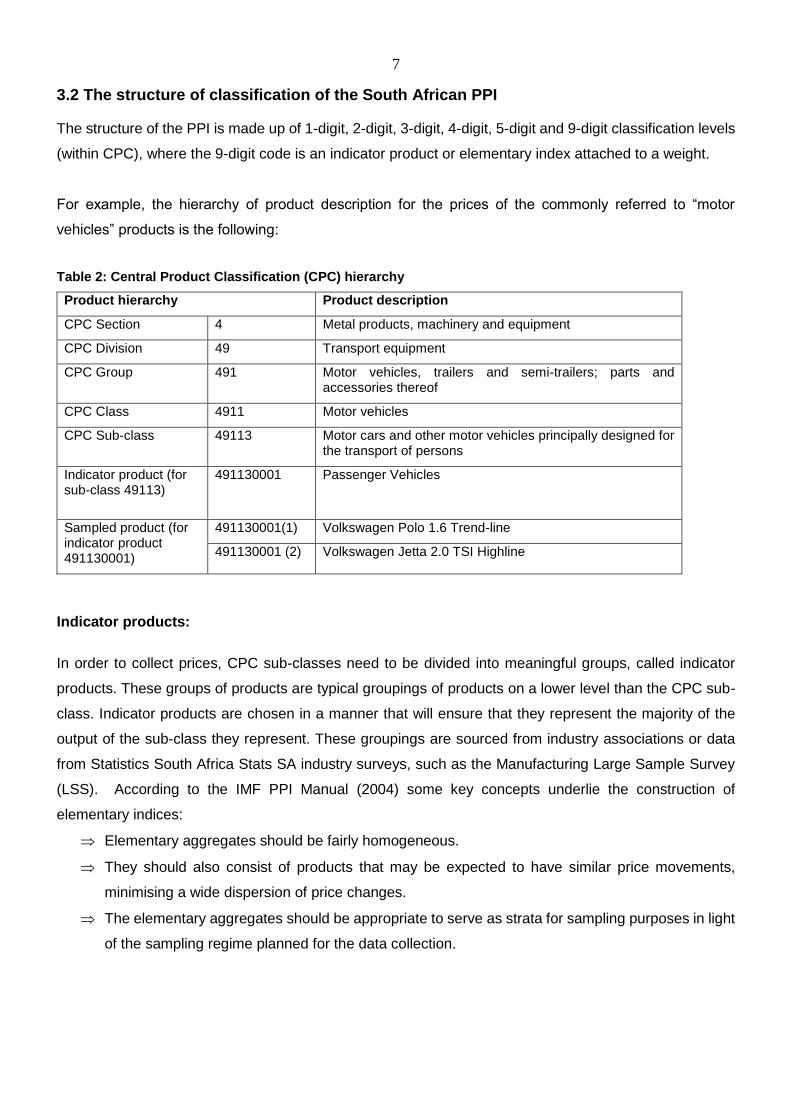
3.2 The structure of classification of the South African PPI
The structure of the PPI is made up of 1-digit, 2-digit, 3-digit, 4-digit, 5-digit and 9-digit classification levels
(within CPC), where the 9-digit code is an indicator product or elementary index attached to a weight.
For example, the hierarchy of product description for the prices of the commonly referred to “motor
vehicles” products is the following:
Table 2: Central Product Classification (CPC) hierarchy
Product hierarchy Product description
CPC Section 4 Metal products, machinery and equipment
CPC Division 49 Transport equipment
CPC Group 491 Motor vehicles, trailers and semi-trailers; parts and accessories thereof
CPC Class 4911 Motor vehicles
CPC Sub-class 49113 Motor cars and other motor vehicles principally designed for the transport of persons
Indicator product (for sub-class 49113)
491130001 Passenger Vehicles
Sampled product (for indicator product 491130001)
491130001(1) Volkswagen Polo 1.6 Trend-line
491130001 (2) Volkswagen Jetta 2.0 TSI Highline
Indicator products:
In order to collect prices, CPC sub-classes need to be divided into meaningful groups, called indicator
products. These groups of products are typical groupings of products on a lower level than the CPC sub-
class. Indicator products are chosen in a manner that will ensure that they represent the majority of the
output of the sub-class they represent. These groupings are sourced from industry associations or data
from Statistics South Africa Stats SA industry surveys, such as the Manufacturing Large Sample Survey
(LSS). According to the IMF PPI Manual (2004) some key concepts underlie the construction of
elementary indices:
Elementary aggregates should be fairly homogeneous.
They should also consist of products that may be expected to have similar price movements,
minimising a wide dispersion of price changes.
The elementary aggregates should be appropriate to serve as strata for sampling purposes in light
of the sampling regime planned for the data collection.

8
Sampled products:
Sampled products are the actual products that are priced in the PPI process. Each sampled product will
be priced consistently over time to ensure comparability. Sampled products are chosen in a manner that
will ensure that their price movements will reflect the price movements of the indicator product that they
represent. The specific products are sourced from dominant role-players or data from Stats SA industry
surveys.

9
Chapter 4: Weighting sources and derivation
4.1 Industry weights
“The value aggregate from the national accounts framework that aligns with the basic price received by
the producer of goods and services is the value of production (IMF, 2004)”. In other words, the value-
added from the national accounts lays the basis of the industry weighting structure in the PPI.
Some industries and products will be of little importance in terms of their share of total production. For
example, an industry that represents less than 0.1 per cent of production within the industrial or service
sectors could be excluded from the sample. In such cases, the output for the industry that is excluded
should be distributed across those that were selected, or it should be assigned to a closely related industry.
It may also be possible to make meaningful combinations of smaller industries producing related products
that meet the criteria for minimum sizes. A similar procedure would also be applied to products that are
insignificant. In either case, the weight for the non-sampled component needs to be included somewhere
in the weighting structure.
4.2 Product weights
The primary sources of weight information for the PPI are business- or establishment-based censuses,
the national accounts, annual industry surveys, and business registers. The criteria for use is the level of
detail available). In some instances additional data is required to supplement the primary source, in order
to select indicator products for pricing. These include administrative sources, association surveys, retail
and wholesale surveys and customs data. The South African PPI makes use of the National Accounts,
Large Sample Surveys (LSS), administrative sources as well as external association data.

10
Table 3: Sources of weights at product level
Industry Industry-level weights Product-level weights
Agriculture, forestry and fishing National Accounts 2015 Agriculture: Gross Income from
Agricultural products 2017
Department of Agriculture Forestry
and Fisheries.
Fishing: Census of Agriculture,
Forestry and Fishing (2007).
Statistics South Africa.
Forestry: Report on Commercial
Timber Resources and Primary
Roundwood Processing in South
Africa (2012/13). Department of
Agriculture, Forestry and Fisheries.
Mining National Accounts 2015 South African Mining Industry Annual
Commodity Summary (2016)
Department of Mineral Resources.
Manufacturing National Accounts 2015 Large Sample Survey (2014).
Statistics South Africa.
Water, gas and electricity National Accounts 2015 Water: Department of Water Affairs
(2016).
4.3 PPI weight selection
All higher level weights are based on the National Accounts Gross Value Added at a SIC 4-digit level
obtained in the supply and use tables. These tables are also used to determine which categories of
products belong to the input or output indices.
Within each SIC 4-digits industry, sales values in relation to total sales in a group are used for the selection
of the relevant CPC 5-digit sub-class level. Only those falling into the top 80 cumulative percentage of the
group are selected. This ensures that at least 80% of groups are covered in the basket of the PPI and
insignificant groups are excluded from the PPI.
Indicator product selection is done on either industry product share data or LSS detailed 8-digit data.
11
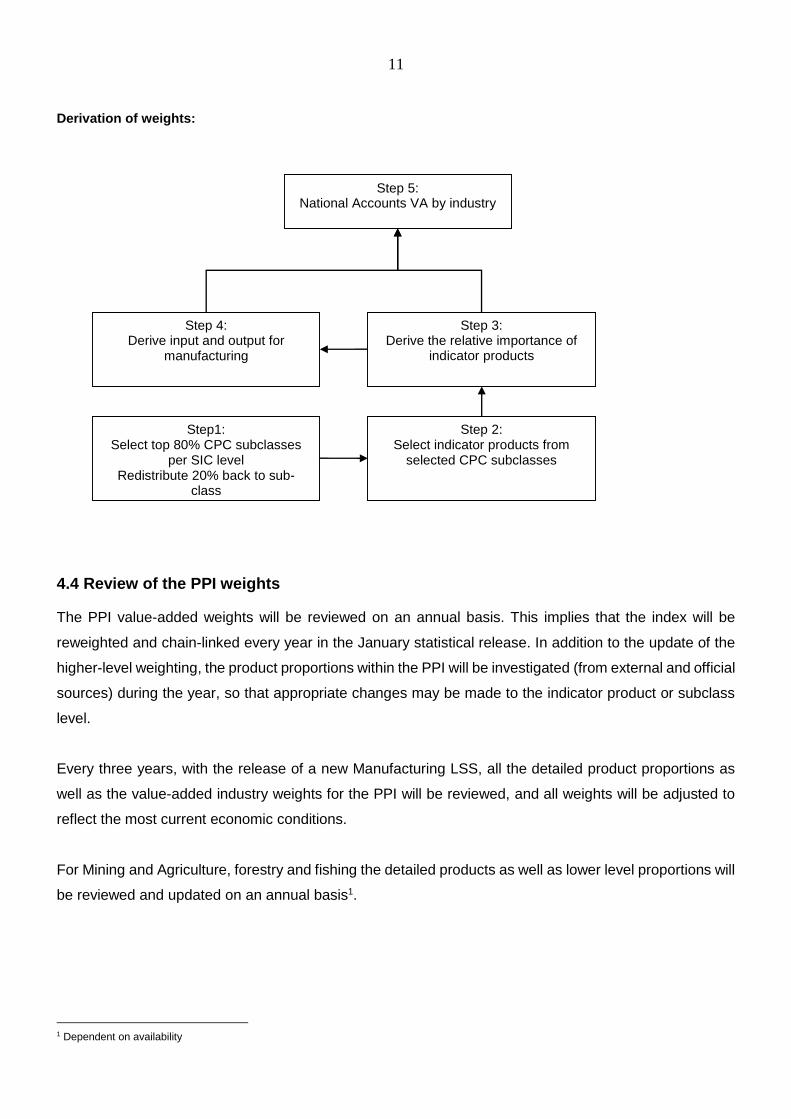
Derivation of weights:
4.4 Review of the PPI weights
The PPI value-added weights will be reviewed on an annual basis. This implies that the index will be
reweighted and chain-linked every year in the January statistical release. In addition to the update of the
higher-level weighting, the product proportions within the PPI will be investigated (from external and official
sources) during the year, so that appropriate changes may be made to the indicator product or subclass
level.
Every three years, with the release of a new Manufacturing LSS, all the detailed product proportions as
well as the value-added industry weights for the PPI will be reviewed, and all weights will be adjusted to
reflect the most current economic conditions.
For Mining and Agriculture, forestry and fishing the detailed products as well as lower level proportions will
be reviewed and updated on an annual basis1.
1 Dependent on availability
Step 5: National Accounts VA by industry
Step 3: Derive the relative importance of
indicator products
Step 2: Select indicator products from
selected CPC subclasses
Step 4: Derive input and output for
manufacturing
Step1: Select top 80% CPC subclasses
per SIC level Redistribute 20% back to sub-
class

12
Chapter 5: Basket of goods
5.1 Introduction
The basket is a list of specific goods, which forms the sample for price collection in the PPI.
The National Accounts value-added as well as Stats SA industry surveys and external industry information
guides the PPI on the selection of indicator products to be included in the basket.
5.2 Selection criteria for basket of goods
All National Accounts value-added with a high relative importance at 3- and 4-digit SIC group level is
included in the PPI. Based on national accounts data, all goods are either classified as intermediate or
final manufactured goods.
Furthermore, for the selection of the 5-digit sub-class level, sales values in relation to total sales in a group
are used. For 5-digit sub-classes to be included in the basket, it should fall into the top 80 cumulative
percentage of its group. This ensures that at least 80% of groups are covered in the basket of the PPI and
insignificant groups are excluded from the PPI.
Indicator product selection is done on either industry product share data or LSS detailed 8-digit data.
5.3 The number of products in the basket
The total number of indicator products in the basket is 263. Refer to Appendix B for the complete basket
of products in the PPI.

13
Chapter 6: Sampling
6.1 Introduction
There are two types of sampling in the PPI, sampling of businesses and sampling of sampled products
per indicator product.
6.2 Selection of businesses (respondents)
Records from various LSS industry surveys as well as the Stats SA Business Sampling Frame (BSF) form
the basis for the PPI sampling frame. Other frame sources include industry association information, where
this data is cross-referenced with that of LSS industry surveys to sample the businesses with the highest
turnover to represent the selected industries, and more specifically products.
In the actual selection, the top 80% of businesses within an industry that produce a certain product are
selected.
6.3 Selection of a sampled product from the respondent
When selecting sampled products from a company, the price collector has to ensure that the selected
ones are the volume sellers, in other words the products for which the highest volumes and/or turnover
are sold. In this process, item and transaction characteristics are important as they are both relevant to
the price of a product.
The item characteristics include for example (Maitland-Smith, 2000: 9):
Type of product
Brand name or model number
Main price determining characteristics, size, weight, power, etc.
The transaction characteristics include for example (Maitland-Smith, 2000: 10):
Type of buyer: exporter, wholesaler, retailer, manufacturer, government
Type of contract: single/multiple deliveries, orders, one year, agreed volume
Unit of measure per unit: metre, kilogram etc.
Delivery basis: free on board, sale with/without delivery to customer,
Type of price: average, list, free on board, net of discount
Type of discount: seasonal, volume, cash, competitive, trade

14
Chapter 7: Data collection and processing (includes editing and data quality evaluation)
7.1 Introduction
The process flow of the PPI takes on the following form:
7.2 Collection period and frequency
When collecting prices for a particular period, there are two basic choices of collection period: point-in-
time and period averages.
Point-in-time prices relate to the price of a product on a particular date in the month, whereas period prices
are an estimate of the price across the month and so are average prices for the month. The pros and cons
of each method are summarised in the table below (IMF, 2004: 121).
Send survey questionnaire to company
Receive questionnaire
from company
Quality control of
questionnaire
Capture questionnaire
Verification and editing of
data
Compilation of indices
Publication of the PPI

15
Table 4: Point-in-time and period prices
Method Pros Cons
Point-in-time
Consistency in month-to-month changes in price
A transaction may not have taken place on the specified date.
More susceptible to short-term external influences (for example, extreme weather conditions, labour stoppages) that could affect the price on the particular day of price collection.
Miss short-term prices changes, between collection dates
Period prices
Yields a smoother time series
Less susceptible to timing of price increases
The index will be less timely when compared with point-in-time estimates, since the average cannot be calculated until the end of the period.
Average prices should relate to a narrowly defined product of constant quality, rather than a broad commodity group.
The South African PPI uses mostly the point-in-time approach, and prices are collected on a monthly basis.
The majority of prices are collected for the first seven days of the month (to ensure consistency in the final
index, the price observation should compare like with like for each period). Regarding electricity,
agriculture and mining products, period prices are used.
7.3 Type of prices collected
A PPI measures changes in the prices received by domestic producers for their outputs or of the change
in the prices paid by domestic producers for their intermediate inputs. These prices are commonly referred
to as transaction prices and include all discounts or rebates given.
7.4 Processing and data validation
Once the questionnaires are received from the companies, the questionnaires are quality controlled to
ensure that all fields were completed, and that each questionnaire was completed accurately. Thereafter,
the questionnaire is captured and the data validated and edited if required.
Verification includes logical, range, variance and consistency checks (OECD, 2006).
Validation edits - to check the validity of basic identification of classificatory items in unit data.
Logical edits - ensure that two or more data items do not have contradictory values.
Consistency edits - check to ensure that precise and correct arithmetic relationships exist between
two or more data items.
Range edits - identify whether or not a data item value falls inside a determined acceptable range.
Variance edits - involve looking for suspiciously high variances at the output edit stage.

16
Chapter 8: Imputations in the PPI
The PPI and CPI follow the same methods when imputing for missing prices. There are three methods
that the IMF PPI and ILO CPI manual prescribe and give guidelines on, they are:
Omit the item for which the price is missing so that a matched sample is maintained (like is compared
with like) even though the sample is depleted
Carry forward the last observed price
Imputation:
o Impute the missing price by the average price change for the prices that are available in the
elementary aggregate.
o Impute the missing price by the price change for a particular comparable product from a similar
establishment.
Stats SA uses all three methods of imputation in the calculation of the PPI. The choice of method is
determined by the level of aggregation of a particular index and the frequency of price collection for a
particular product.
The matched sample approach is used when one observation in a sample for an elementary aggregate is
temporarily unavailable. For example, if the PPI collects data for 10 types of shirts and one of those is
temporality unavailable, the average price change is calculated on the remaining nine. In this way, the
assumption is that the price would have moved in the same way as the average of the prices of the items
that remain included in the elementary index. This type of imputation is applied at the lowest level of index
calculation/aggregation, at the elementary index level.
The carry-forward approach is strictly applied to annual, bi-annual, quarterly and other infrequent surveys
(not applied to monthly collected data). In the case of these periodic changes, it is legitimate to infer that
the prices should remain constant until the next change. This type of imputation is applied at the lowest
level of calculation/aggregation, at the elementary index level.
Imputation by average price change is only considered once there is no data available to calculate an
average percentage change for a specific indicator product. The lack of data could be attributed to various
causes, for example seasonal behaviour, shortage in the market, etc. If data for a specific indicator product
is missing, it is imputed on a similar product or group of products. An alternative to average price change
on elementary index level is to use price change for a particular comparable product or specific comparable
product from (a) similar establishment(s).

17
Chapter 9: Index calculation
9.1 Overview
The calculation of price indices is usually conducted in two stages. First, price indices are calculated for
the elementary aggregates, and then these elementary price indices are averaged to obtain higher-level
indices using the relative sales values of the elementary aggregates as weights.
9.2 Elementary indices
Elementary aggregates are constructed by grouping individual goods into relatively homogeneous
products and transactions. They may be formed for products in various regions of the country or for the
country as a whole, or for establishments. In other words, compilers of the PPI have to select
representative products within an elementary aggregate and then collect a sample of each of the
representative products, usually from a sample of different producers. The individual representative
products for which prices are actually collected are described as the sampled products.
For elementary index compilation, the Jevons formula is used. A Jevons index is defined as the unweighted
geometric mean of the price ratios (pt/pt-1), which is identical to the ratio of the unweighted geometric
mean (matched) prices.
The formula is given as:
The chained monthly indices link together the month-to-month changes through successive multiplication.
The Jevons formula is transitive as the chained monthly indices are identical to the corresponding direct
indices which compare prices in each successive month directly with those of the reference month.

18
9.3 High-level indices
The second stage of calculating the PPI does not involve individual prices or quantities. Instead, a higher-
level index is calculated as a Young index in which the elementary price indices are averaged using a set
of predetermined weights. The formula can be written as follows:
1,:0:0 b
i
t
i
b
i
t wIwI
wheretI :0 denotes the overall PPI, or any high-level index, from period 0 to t;
b
iwis the weight attached to
each of the elementary price indices; and
t
iI :0
is the corresponding elementary price index. The elementary
indices are identified by the subscript i , whereas the higher-level index carries no subscript. The weights
are derived in period b , which in practice has to precede period 0, the price reference period.
Almost certainly, the most important aspect of index compilation is consistency. Consistency in
aggregation means that if an index is calculated stepwise by aggregating lower-level indices to obtain
indices at progressively higher levels of aggregation, the same overall result should be obtained as if the
calculation had been made in one step.

19
9.4 Graphical example of the aggregation structure of the PPI2
2 Weighting occurs in one step in the PPI. For example, if a motor vehicle index is published, all items under motor vehicles will be normalised to
unity and weighted. If the final manufactured goods index is calculated, then all items under manufacturing are weighted. Two or more subindices
are not used to aggregate a higher-level index.
Sampled indicator product Variety A
Sampled indicator product Variety B
Sampled indicator product Variety C
Indicator product and elementary aggregate: Passenger vehicles
Sub-class: Motor cars and other motor vehicles principally designed for the transport of persons
Sub-class: Other subclasses
Class: Motor vehicles Class: Other classes
Group: Motor vehicles, trailers and semi-trailers; parts and accessories thereof
Group: Other groups
PPI Final manufactured goods
Indicator product and elementary aggregate: Other indicator products
Division: Transport and equipment
Division: Other divisions
Section: Metal products, machinery and equipment
Section: Other sections

20
9.5 Linking of the PPI
The PPI high-level weights as well as certain elementary indices will be updated annually. When new
weights are introduced the price reference period for the new index can be the last period of the old index;
the old and the new indices being linked together at this point. The old and the new indices constitute a
linked index.
The introduction of new weights is often a complex operation because it provides an opportunity to
introduce new items, new samples, new data sources, new compilation practices, new elementary
aggregates, new higher-level indices or new classifications. These tasks are often undertaken
simultaneously at the time of reweighting to minimise overall disruption to the time series and any resulting
inconvenience to users of the indices.
Annual chaining has the advantage that changes (such as the inclusion of new goods) can be introduced
on a regular basis, although every index needs some ongoing maintenance, whether annually chained or
not.
9.5.1 Features of a linked index
There are several important features of a linked index:
The linked index formula allows weights to be updated, and facilitates the introduction of new items
and sub-indices and the removal of obsolete ones.
In order to be able to link the old and the new series, an overlapping period (k) is needed in which
the index has to be calculated using both the old and the new set of weights.
A linked index may have two or more links. Between each link period, the index may be calculated
as a fixed weight index using any index number formula. The link period may be a month or a year,
provided the weights and indices refer to the same period.
Linking is intended to ensure that the individual indices on all levels show the correct development
through time.
Linking leads to non-additivity. When the new series is chained onto the old one the higher-level
indices after the link cannot be obtained as weighted arithmetic averages of individual indices using
the new weights. If, on the other hand, the index reference period is changed and the index series
prior to the link period is rescaled to the new index reference period, this series cannot be
aggregated to higher-level indices by use of the new weights.
21
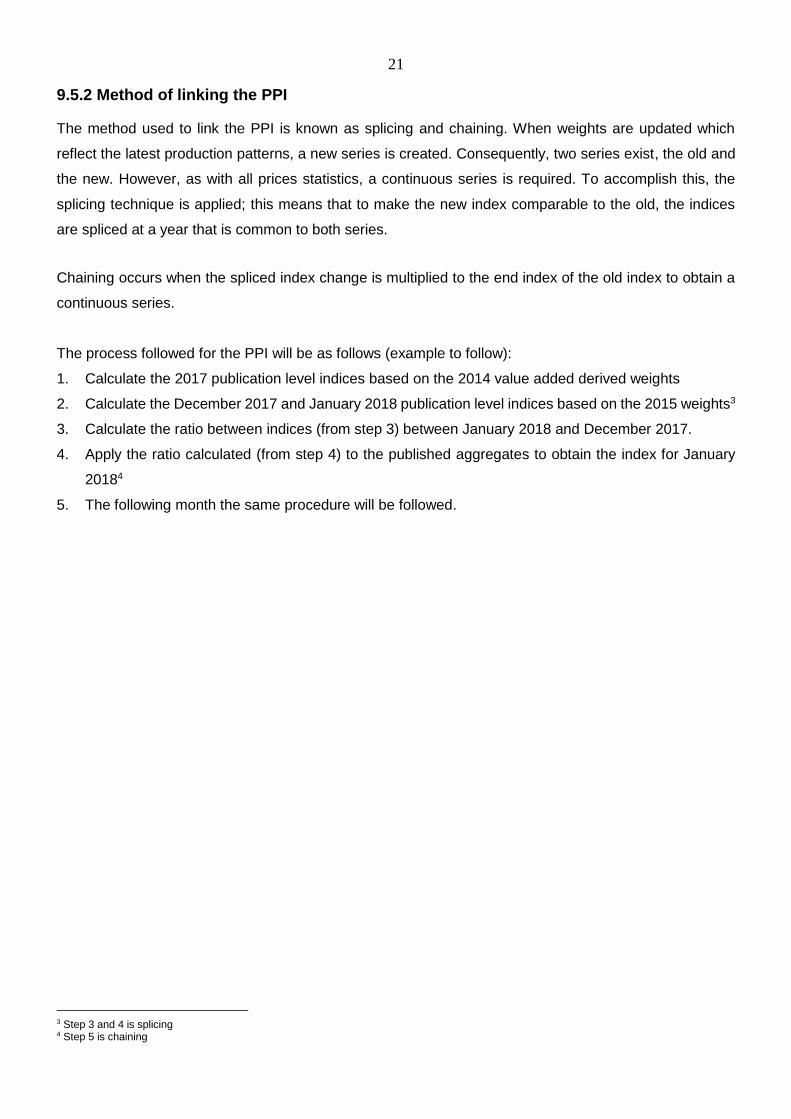
9.5.2 Method of linking the PPI
The method used to link the PPI is known as splicing and chaining. When weights are updated which
reflect the latest production patterns, a new series is created. Consequently, two series exist, the old and
the new. However, as with all prices statistics, a continuous series is required. To accomplish this, the
splicing technique is applied; this means that to make the new index comparable to the old, the indices
are spliced at a year that is common to both series.
Chaining occurs when the spliced index change is multiplied to the end index of the old index to obtain a
continuous series.
The process followed for the PPI will be as follows (example to follow):
1. Calculate the 2017 publication level indices based on the 2014 value added derived weights
2. Calculate the December 2017 and January 2018 publication level indices based on the 2015 weights3
3. Calculate the ratio between indices (from step 3) between January 2018 and December 2017.
4. Apply the ratio calculated (from step 4) to the published aggregates to obtain the index for January
20184
5. The following month the same procedure will be followed.
3 Step 3 and 4 is splicing 4 Step 5 is chaining

22
Table 5: Example – Linking and splicing the index
EXAMPLE Weight 2014
Weight 2015 Jan-17 Nov-17
Old index Dec-17
Average index of products 2017
New index Dec-17 Jan-18 Feb-18 Mar-18
Elementary price indices
A 21.2 24.6 101.2 109.1 111.3
B 25.8 24.1 102.1 121.3 122.3
C 16.9 18.1 99.0 110.0 112.4
D 15.9 15.9 97.1 115.7 117.6
E 20.2 17.3 100.0 113.6 111.4
Elementary price indices rebased
Derived from monthly price ratios
A 91.8 99.0 101.0 110.2 101.0 102.3 103.6 105.0
B 83.8 99.6 100.4 121.8 100.4 100.3 101.6 102.9
C 89.0 98.9 101.1 111.2 101.1 101.7 102.3 102.9
D 83.2 99.2 100.8 116.7 100.8 101.6 101.9 102.6
E 88.9 101.0 99.0 112.5 99.0 102.7 103.0 103.5
Higher-level indices
Old New
G= A+B+C 63.9 66.8 87.9 99.2 100.8 100.8 101.4 102.5 103.7
H=D+E 36.1 33.2 86.4 100.2 99.8 99.9 102.2 102.5 103.1
Total 100.0 100.0 87.3 99.6 100.4 100.5 101.7 102.5 103.5
Chaining of higher-level indices to 2008=100
Ratios
G= A+B+C 1.006 1.011 1.011
H=D+E 1.023 1.003 1.006
Total 1.012 1.008 1.009
Chaining of higher-level indices to 2008=100
Apply ratio to previous index
G= A+B+C 63.9 66.8 87.9 99.2 100.8 100.8 101.4 102.5 103.7
H=D+E 36.1 33.2 86.4 100.2 99.8 99.8 102.1 102.4 103.0
Total 100.0 100.0 87.3 99.6 100.4 100.4 101.6 102.4 103.4
23
Bibliography
Australian Bureau of Statistics (ABS). 2009. 6427.0 - Producer Price Indices, Australia, Dec 2009.
Explanatory notes.
Source: www.abs.gov.au
Bureau of Labor Statistics (BLS). 2008. BLS Handbook of Methods. Chapter 14: Producer Prices.
Source: https://www.bls.gov/opub/hom/pdf/ppi-20111028.pdf
International Labor Organization (ILO). 2004. Consumer Price Index Manual: Theory and Practice.
Source: www.ilo.org/public/english/bureau/stat/guides/cpi/index.htm
International Monetary Fund (IMF). 2004. Revised PPI Manual.
Source: www.imf.org/external/np/sta/tegppi/index.htm
Maitland-Smith, F. 2000. OECD Workshop on Economic Indicators. Producer Price Indices.
OECD. 2006. Glossary of Statistical Terms.
Source: http://stats.oecd.org/glossary
United Nations. 2009. Practical Guide to Producing Consumer Price Indices.
Source: https://www.unece.org/fileadmin/DAM/stats/publications/Practical_Guide_to_Producing_CPI.pdf
Statistics New Zealand. 2015. Producer Price Index. Concepts, Sources and Methods.
Source: http://archive.stats.govt.nz/browse_for_stats/economic_indicators/prices_indexes/ppi-concepts-
sources-methods-2015/conceptual-basis.aspx#
Statistics South Africa. 2008. The South African CPI Sources and Methods. Release v.1
Source: www.statssa.gov.za
Statistics Sweden. 2004. A Description of Swedish Producer and Import Price Indices – PPI, EXPI and
IMPI.
Source:http://www.scb.se/statistik/PR/PR0301/A_Description_of_Swedish_Producer_and_Import_Price_
Indices.pdf

24

25
Appendix A: Input and Output CPCs
CPC Code CPC description Input/Output
CPC 0 Agriculture, forestry and fishing products
CPC 01 Products of agriculture, horticulture and market gardening Output
CPC 02 Live animals and animal products (excluding meat) Output
CPC 03 Forestry and logging products Output
CPC 04 Fish and other fishing products Output
CPC 1 Ores and minerals; electricity, water and gas
CPC 11 Coal and lignite; peat Output
CPC 13 Gold, uranium and thorium ores and concentrates Output
CPC 14 Metal ores and concentrates Output
CPC 16 Other minerals Output
CPC 17 Electricity, town gas, steam and hot water Output
CPC 18 Natural water Output
CPC 2 Food products; beverages and tobacco; textiles, apparel and leather products
CPC 211 Meat and meat products Output
CPC 212 Prepared and preserved fish, crustaceans, molluscs and other aquatic invertebrates Output
CPC 213 Prepared and preserved vegetables, pulses and potatoes Output
CPC 214 Prepared and preserved fruit and nuts Output
CPC 215 Animal and vegetable oils and fats Output
CPC 221 Processed liquid milk and cream Output
CPC 222 Other dairy products Output
CPC 231 Grain mill products Output
CPC 233 Preparations used in animal feeding Output
CPC 234 Bakery products Output
CPC 235 Sugar Output
CPC 236 Cocoa, chocolate and sugar confectionery Output
CPC 239 Food products n.e.c Output
CPC 241 Ethyl alcohol; spirits, liqueurs and other spirituous beverages Output
CPC 242 Wines Output
CPC 243 Malt liquors and malt Output
CPC 244 Soft drinks ;bottled mineral waters Output
CPC 250 Tobacco products Output
CPC 271 Made-up textile articles Output
CPC 272 Carpets and other textile floor coverings Output
CPC 282 Wearing apparel, except fur apparel Output
CPC 291 Tanned or dressed leather; composition leather Input
CPC 293
Footwear, with outer soles and uppers of rubber or plastics, or with uppers of leather or textile materials, other than sports footwear, footwear incorporating a protective metal toe- cap and miscellaneous special footwear Output
CPC 3 Other transportable goods, except metal products, machinery and equipment
CPC 311
Wood, sawn or chipped lengthwise, sliced or peeled, of a thickness exceeding 6mm; railway or tramway sleepers (cross-ties) of wood not impregnated Input
CPC 312 Wood continuously shaped along any of its edges or faces; wood wool; wood flour; wood in chips or particles Input
CPC 313
Wood in the rough, including those treated with paint, stains, creosote or other preservatives; railway or tramway sleepers (cross-ties) of wood, impregnated Input

26
CPC Code CPC description Input/Output
CPC 314 Boards and panels Input
CPC 316 Builders' joinery and carpentry of wood (including cellular wood panels, assembled parquet panels, shingles and shakes) Input
CPC 321 Pulp, paper and paperboard Output
CPC 322 Books, in print Output
CPC 323 Newspapers and periodicals, daily, in print Output
CPC 326 Stamps, cheque forms, banknotes, stock certificates, brochures and leaflets, advertising material and other printed matter Output
CPC 333
Petroleum oils and oils obtained from bituminous materials, other than crude; preparations n.e.c. containing by weight 70% or more of these oils, such oils being the basic constituents of the preparations Output
CPC 334 Petroleum gases and other gaseous hydrocarbons, except natural gas Output
CPC 335
Petroleum jelly; paraffin wax, micro- crystalline petroleum wax, slack wax, ozokerite, lignite wax, peat wax, other mineral waxes, and similar products; petroleum coke, petroleum bitumen and other residues of petroleum oils or of oils obtained from bituminous materials Output
CPC 341 Basic organic chemicals Input
CPC 342 Basic inorganic chemicals n.e.c. Input
CPC 346 Fertilizers and pesticides Output
CPC 347 Plastics in primary forms Input
CPC 348
Synthetic rubber and factice derived from oils, and mixtures thereof with natural rubber and similar natural gums, in primary forms or in plates, sheets or strip Input
CPC 351 Paints and varnishes and related products; artists' colours ;ink Output
CPC 352 Pharmaceutical products Output
CPC 353 Soap, cleaning reparations, perfumes and toilet preparations Output
CPC 354 Chemical products n.e.c. Output
CPC 361 Rubber tyres and tubes Output
CPC 362 Other rubber products Input
CPC 363 Semi-manufactures of plastics Input
CPC 364 Packaging products of plastics Input
CPC 369 Other plastic products Output
CPC 371 Glass and glass products Input
CPC 372 Non-structural ceramic ware Output
CPC 373 Refractory products and structural non-refractory clay products Output
CPC 374 Plaster, lime and cement Output
CPC 375 Articles of concrete, cement and plaster Output
CPC 379 Other non-metallic mineral products n.e.c. Output
CPC 381 Furniture Output
CPC 382 Jewellery and related articles Output
CPC 389 Other manufactured articles n.e.c. Output
CPC 393 Metal waste or scraps Input
CPC 4 Metal products, machinery and equipment
CPC 411 Basic iron and steel Input
CPC 412 Products of iron or steel Input
CPC 413 Basic precious metals and metals clad with precious metals Input
CPC 414 Copper ,nickel, aluminium, alumimina, lead, zinc and tin, unwrought Input

27
CPC Code CPC description Input/Output
CPC 415 Semi-finished products of copper, nickel, aluminium, lead, zinc and tin or their alloys Input
CPC 416 Other non-ferrous metals and articles thereof (including waste and scrap of some metals); cermets and articles thereof Input
CPC 421 Structural metal products and parts thereof Output
CPC 422 Tanks, reservoirs and containers of iron, steel or aluminium Output
CPC 429 Other fabricated metal products Output
CPC 431 Engines and turbines and parts thereof Output
CPC 432 Pumps, compressors, hydraulic and pneumatic power engines, and valves, and parts thereof Output
CPC 433 Bearings, gears, gearing and driving elements, and parts thereof Output
CPC 435 Lifting and handling equipment and parts thereof Output
CPC 439 Other general -purpose machinery and parts thereof Output
CPC 442 Machine-tools and parts and accessories thereof Output
CPC 444 Machinery for mining, quarrying and construction, and parts thereof Output
CPC 445 Machinery for food, beverage and tobacco processing, and parts thereof Output
CPC 447 Weapons and ammunition and parts thereof Output
CPC 448 Domestic appliances and parts thereof Output
CPC 452 Computing machinery and parts and accessories thereof Output
CPC 461 Electric motors, generators and transformers, and parts thereof Output
CPC 462 Electricity distribution and control apparatus, and parts thereof Output
CPC 463 Insulated wire and cable; optical fibre cables Output
CPC 464 Accumulators, primary cells and primary batteries, and parts thereof Output
CPC 471 Electronic valves and tubes; electronic components; parts thereof Output
CPC 473
Radio broadcast and television receivers; apparatus for sound and video recording and reproducing; microphones, loudspeakers, amplifiers, etc. Output
CPC 482
Instruments and appliances for measuring, checking, testing, navigating and other purposes, except optical instruments; industrial process control equipment; parts and accessories thereof Output
CPC 491 Motor vehicles, trailers and semi-trailers; parts and accessories thereof Output
CPC 492 Bodies (coachwork) for motor vehicles; trailers and semi-trailers; parts and accessories thereof Output
CPC 495 Railway and tramway locomotives and rolling stock, and parts thereof Output
CPC 496 Aircraft and spacecraft, and parts thereof Output

28
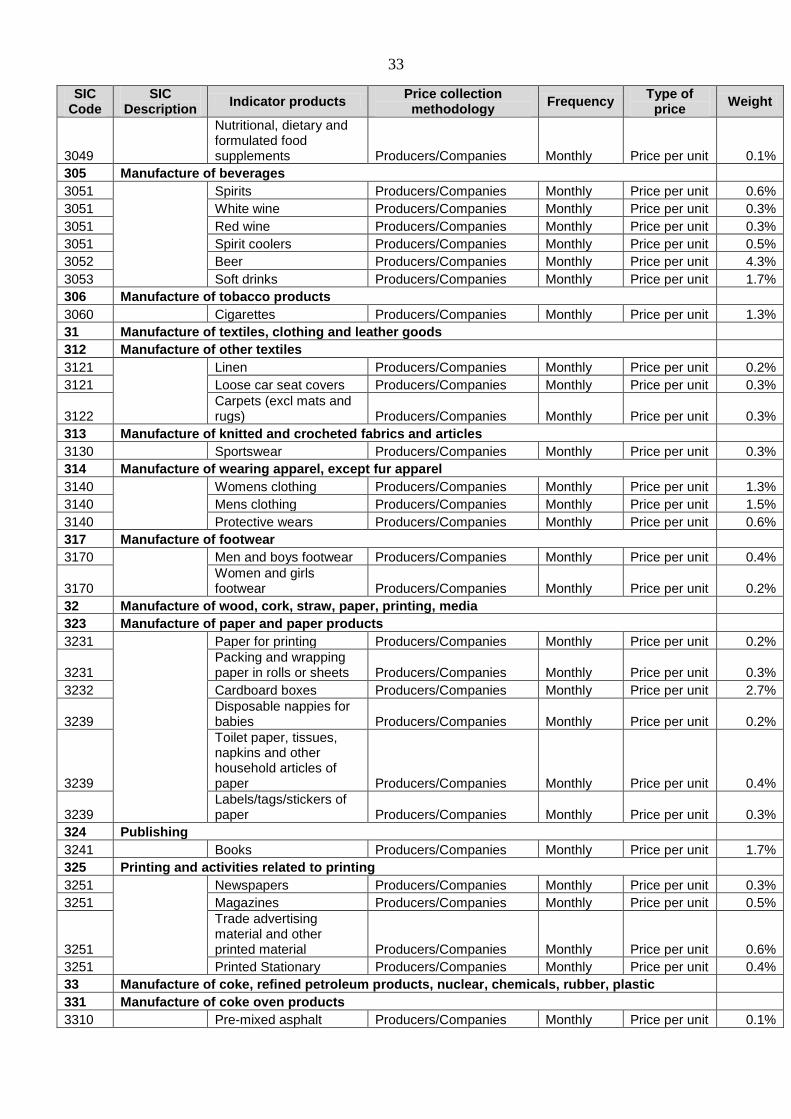
Appendix B: Basket of products in the PPI, price collection methodology and frequencies
B1: Agriculture, Forestry and Fishing
SIC Code
SIC Description
Indicator products Price collection methodology
Frequency Type of price Weight
1 Agriculture, forestry and fishing 100%
11 Agriculture
111 Growing of crops
1111
Wheat Markets Monthly Average price 2.5%
1111 Maize Markets Monthly Average price 12.8%
1111 Sunflower seed Markets Monthly Average price 2.2%
1111 Sugar cane Sugar Cane Growers Association
Monthly (on month lag)
Price per ton of Recoverable Value (RV) 3.1%
1112 Tomatoes Markets Monthly Average price 1.2%
1112 Onions Markets Monthly Average price 0.9%
1112 Potatoes Markets Monthly Average price 3.1%
1113 Bananas Markets Monthly Average price 2.4%
1113 Lemons Markets Monthly Average price 1.9%
1113
Oranges Markets Monthly Average price 5.5%
1113 Grapes Markets Monthly Average price 2.1%
1113 Apples Markets Monthly Average price 3.7%
1113 Pears Markets Monthly Average price 1.8%
112 Farming of animals
1121
Cattle Auctions Monthly Average price 11.9%
1121 Sheep Auctions Monthly Average price 2.6%
1121 Raw milk Processors of milk/Farmers/Association Monthly Average price 5.5%
1121 Wool Auctions/Companies Monthly Average price 1.5%
1122 Pigs Auctions Monthly Average price 2.0%
1122 Poultry Association Monthly Average price 15.0%
1122 Eggs Association/Companies Monthly Average price 4.0%
12 Forestry and logging
122 Logging
1220
Sawn and planted timber - Softwood Companies Monthly Price per unit 7.1%
1220 Sawn and planted timber - Hardwood Companies Monthly Price per unit 1.1%
13 Fishing
131 Ocean and coastal fishing
1310
Hake Fishing Producers/Companies Monthly Price per unit 4.5%
1310
Small pelagic (e.g. anchovies and pilchards)
Fishing Producers/Companies Monthly Price per unit 0.8%
1310 Rock lobster Fishing Producers/Companies Monthly Price per unit 0.4%
1310 Squid Fishing Producers/Companies Monthly Price per unit 0.5%

29
B2: Mining and Quarrying
SIC Code
SIC Description
Indicator products Price collection methodology
Frequency Type of price Weight
2 Mining and Quarrying 100%
21 Mining of Coal
210 Mining of Coal
2100 Coal Mining Producers/Companies Monthly
Contract price/Average price 25.0%
22 Extraction crude petroleum /natural gas
221 Extraction of crude petroleum and natural gas
2210
Natural gas Companies Monthly Average price 2.4%
2210 Natural gas condensate Companies Monthly
Price per unit/Brent crude oil average 0.6%
23 Mining of gold
230 Mining of gold
2300 Gold Mining Producers/Companies Monthly Average price 15.7%
24 Mining of metal ores, except gold
241 Mining of iron ore
2410 Haematite Mining Producers/Companies Monthly Average price 11.3%
242 Mining of non-ferrous metal ores, except gold
2421
Chromite Mining Producers/Companies Monthly Average price 3.5%
2422 Metallic copper Mining Producers/Companies Monthly Average price 1.2%
2423 Metallurgical manganese
Mining Producers/Companies Monthly Average price 3.1%
2424 Platinum
Companies/Platinum refiners/ London Metal Exchange Monthly
London Metal Exchange (LME) average price 18.0%
2424 Rhodium Mining Producers/Companies Monthly Average price 1.7%
2424 Palladium Mining Producers/Companies Monthly Average price 6.2%
2429 Nickel Mining Producers/Companies Monthly Average price 3.5%
25 Other mining and quarrying
251 Stone quarrying, clay and sand-pits
2511
Granite Mining Producers/Companies Monthly Average price 0.4%
2519 Aggregate stones Mining Producers/Companies Monthly Average price 0.3%
2519 Sand Mining Producers/Companies Monthly Average price 0.1%
2520 Gem diamonds Mining Producers/Companies Monthly Average price 1.8%
2520 Industrial diamonds Mining Producers/Companies Monthly Average price 2.3%
2531 Phosphate concentrate Mining Producers/Companies Monthly Average price 1.8%
2539 Andalusite Mining Producers/Companies Monthly Average price 1.2%
30
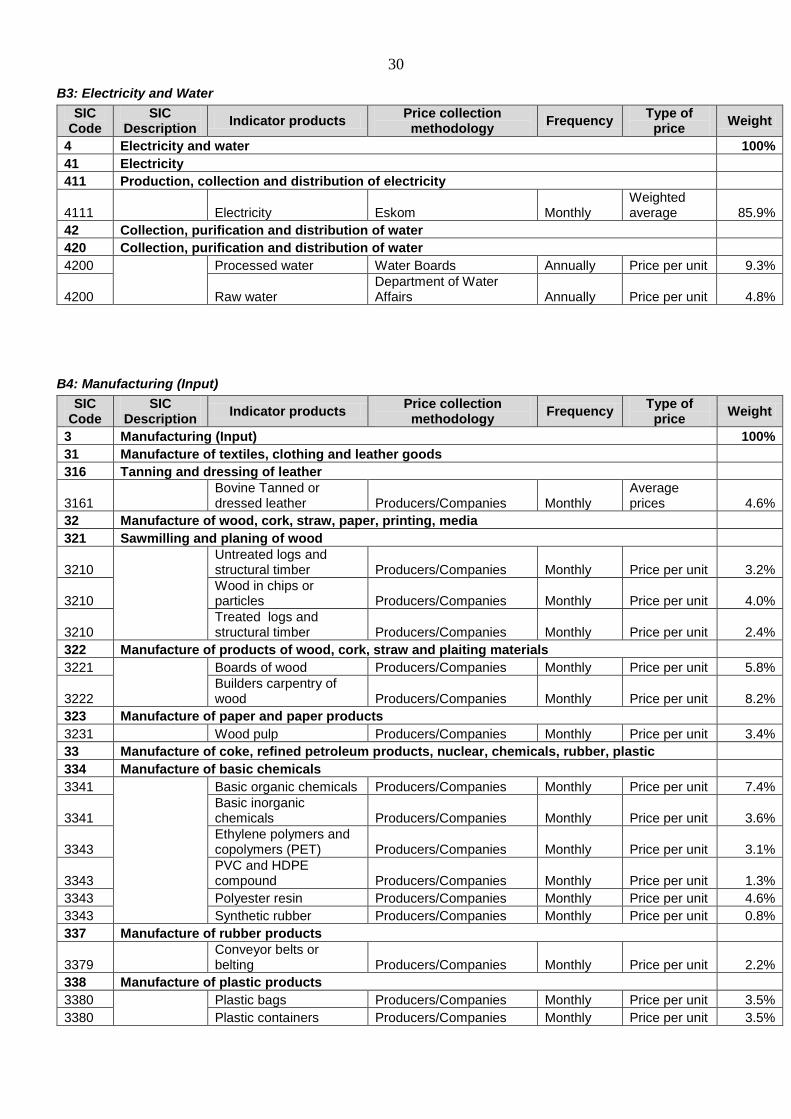
B3: Electricity and Water
SIC Code
SIC Description
Indicator products Price collection methodology
Frequency Type of
price Weight
4 Electricity and water 100%
41 Electricity
411 Production, collection and distribution of electricity
4111 Electricity Eskom Monthly Weighted average 85.9%
42 Collection, purification and distribution of water
420 Collection, purification and distribution of water
4200
Processed water Water Boards Annually Price per unit 9.3%
4200 Raw water Department of Water Affairs Annually Price per unit 4.8%
B4: Manufacturing (Input)
SIC Code
SIC Description
Indicator products Price collection methodology
Frequency Type of
price Weight
3 Manufacturing (Input) 100%
31 Manufacture of textiles, clothing and leather goods
316 Tanning and dressing of leather
3161 Bovine Tanned or dressed leather Producers/Companies Monthly
Average prices 4.6%
32 Manufacture of wood, cork, straw, paper, printing, media
321 Sawmilling and planing of wood
3210
Untreated logs and structural timber Producers/Companies Monthly Price per unit 3.2%
3210 Wood in chips or particles Producers/Companies Monthly Price per unit 4.0%
3210 Treated logs and structural timber Producers/Companies Monthly Price per unit 2.4%
322 Manufacture of products of wood, cork, straw and plaiting materials
3221
Boards of wood Producers/Companies Monthly Price per unit 5.8%
3222 Builders carpentry of wood Producers/Companies Monthly Price per unit 8.2%
323 Manufacture of paper and paper products
3231 Wood pulp Producers/Companies Monthly Price per unit 3.4%
33 Manufacture of coke, refined petroleum products, nuclear, chemicals, rubber, plastic
334 Manufacture of basic chemicals
3341
Basic organic chemicals Producers/Companies Monthly Price per unit 7.4%
3341 Basic inorganic chemicals Producers/Companies Monthly Price per unit 3.6%
3343 Ethylene polymers and copolymers (PET) Producers/Companies Monthly Price per unit 3.1%
3343 PVC and HDPE compound Producers/Companies Monthly Price per unit 1.3%
3343 Polyester resin Producers/Companies Monthly Price per unit 4.6%
3343 Synthetic rubber Producers/Companies Monthly Price per unit 0.8%
337 Manufacture of rubber products
3379
Conveyor belts or belting Producers/Companies Monthly Price per unit 2.2%
338 Manufacture of plastic products
3380
Plastic bags Producers/Companies Monthly Price per unit 3.5%
3380 Plastic containers Producers/Companies Monthly Price per unit 3.5%

31
SIC Code
SIC Description
Indicator products Price collection methodology
Frequency Type of
price Weight
34 Manufacture of other non-metallic mineral products
341 Manufacture of glass and glass products
3411
Safety glass Producers/Companies Monthly Price per unit 0.9%
3411 Fibre glass Producers/Companies Monthly Price per unit 0.5%
3411 Glass containers Producers/Companies Monthly Price per unit 2.0%
35 Manufacture of basic or fabricated metals, machinery, equipment, computing equipment
351 Manufacture of basic iron and steel
3510
Ferro-manganese Producers/Companies Monthly Price per unit 2.0%
3510 Ferro-chromium alloy Producers/Companies Monthly Price per unit 2.5%
3510 Flat rolled non-alloy steel products Producers/Companies Monthly Price per unit 6.6%
3510 Flat rolled stainless steel products Producers/Companies Monthly Price per unit 3.3%
3510 Bars and rods of iron or steel Producers/Companies Monthly Price per unit 2.6%
3510
Angles, shapes, sections and similar products of iron or steel Producers/Companies Monthly Price per unit 1.3%
3510
Wire of iron or non-alloy steel Producers/Companies Monthly Price per unit 0.7%
352 Manufacture of basic precious and non-ferrous metals
3520 Silver in powder form Producers/Companies Monthly Price per unit 1.0%
3520
Unwrought or semi-manufactured gold Producers/Companies Monthly Price per unit 2.4%
3520
Unwrought or semi-manufactured platinum Producers/Companies Monthly Price per unit 4.5%
3520 Unwrought aluminium Producers/Companies Monthly Price per unit 0.8%
3520 Tubes, pipes and tube or pipe fittings, of copper Producers/Companies Monthly Price per unit 0.6%
3520 Manganese metal (electrolytic manganese) Producers/Companies Monthly Price per unit 0.8%
353 Casting of metals
3531
Semi - finished products and ingots of iron and steel Producers/Companies Monthly Price per unit 1.2%
3532 Aluminium products Producers/Companies Monthly Price per unit 0.9%
395 Recycling n.e.c
3951 Metal waste and scrap Producers/Companies Monthly Price per unit 3.8%
32
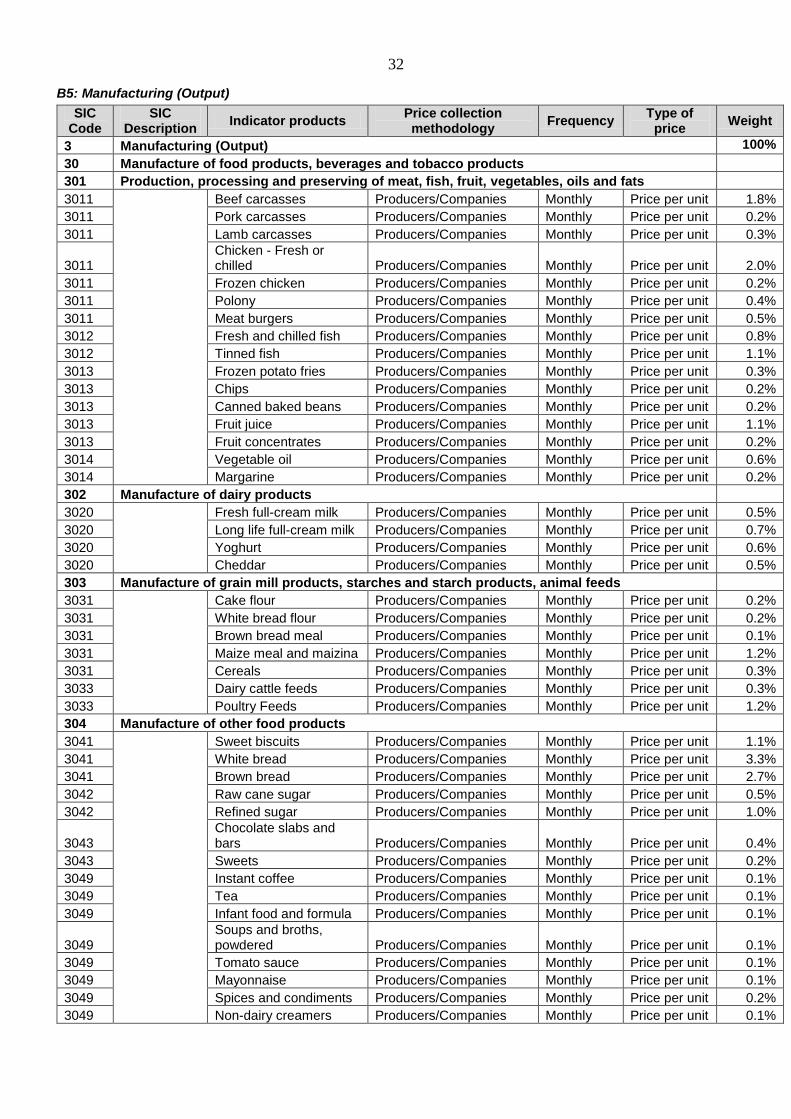
B5: Manufacturing (Output)
SIC Code
SIC Description
Indicator products Price collection methodology
Frequency Type of
price Weight
3 Manufacturing (Output) 100%
30 Manufacture of food products, beverages and tobacco products
301 Production, processing and preserving of meat, fish, fruit, vegetables, oils and fats
3011
Beef carcasses Producers/Companies Monthly Price per unit 1.8%
3011 Pork carcasses Producers/Companies Monthly Price per unit 0.2%
3011 Lamb carcasses Producers/Companies Monthly Price per unit 0.3%
3011 Chicken - Fresh or chilled Producers/Companies Monthly Price per unit 2.0%
3011 Frozen chicken Producers/Companies Monthly Price per unit 0.2%
3011 Polony Producers/Companies Monthly Price per unit 0.4%
3011 Meat burgers Producers/Companies Monthly Price per unit 0.5%
3012 Fresh and chilled fish Producers/Companies Monthly Price per unit 0.8%
3012 Tinned fish Producers/Companies Monthly Price per unit 1.1%
3013 Frozen potato fries Producers/Companies Monthly Price per unit 0.3%
3013 Chips Producers/Companies Monthly Price per unit 0.2%
3013 Canned baked beans Producers/Companies Monthly Price per unit 0.2%
3013 Fruit juice Producers/Companies Monthly Price per unit 1.1%
3013 Fruit concentrates Producers/Companies Monthly Price per unit 0.2%
3014 Vegetable oil Producers/Companies Monthly Price per unit 0.6%
3014 Margarine Producers/Companies Monthly Price per unit 0.2%
302 Manufacture of dairy products
3020
Fresh full-cream milk Producers/Companies Monthly Price per unit 0.5%
3020 Long life full-cream milk Producers/Companies Monthly Price per unit 0.7%
3020 Yoghurt Producers/Companies Monthly Price per unit 0.6%
3020 Cheddar Producers/Companies Monthly Price per unit 0.5%
303 Manufacture of grain mill products, starches and starch products, animal feeds
3031
Cake flour Producers/Companies Monthly Price per unit 0.2%
3031 White bread flour Producers/Companies Monthly Price per unit 0.2%
3031 Brown bread meal Producers/Companies Monthly Price per unit 0.1%
3031 Maize meal and maizina Producers/Companies Monthly Price per unit 1.2%
3031 Cereals Producers/Companies Monthly Price per unit 0.3%
3033 Dairy cattle feeds Producers/Companies Monthly Price per unit 0.3%
3033 Poultry Feeds Producers/Companies Monthly Price per unit 1.2%
304 Manufacture of other food products
3041
Sweet biscuits Producers/Companies Monthly Price per unit 1.1%
3041 White bread Producers/Companies Monthly Price per unit 3.3%
3041 Brown bread Producers/Companies Monthly Price per unit 2.7%
3042 Raw cane sugar Producers/Companies Monthly Price per unit 0.5%
3042 Refined sugar Producers/Companies Monthly Price per unit 1.0%
3043 Chocolate slabs and bars Producers/Companies Monthly Price per unit 0.4%
3043 Sweets Producers/Companies Monthly Price per unit 0.2%
3049 Instant coffee Producers/Companies Monthly Price per unit 0.1%
3049 Tea Producers/Companies Monthly Price per unit 0.1%
3049 Infant food and formula Producers/Companies Monthly Price per unit 0.1%
3049 Soups and broths, powdered Producers/Companies Monthly Price per unit 0.1%
3049 Tomato sauce Producers/Companies Monthly Price per unit 0.1%
3049 Mayonnaise Producers/Companies Monthly Price per unit 0.1%
3049 Spices and condiments Producers/Companies Monthly Price per unit 0.2%
3049 Non-dairy creamers Producers/Companies Monthly Price per unit 0.1%
33
SIC Code
SIC Description
Indicator products Price collection methodology
Frequency Type of
price Weight
3049
Nutritional, dietary and formulated food supplements Producers/Companies Monthly Price per unit 0.1%
305 Manufacture of beverages
3051
Spirits Producers/Companies Monthly Price per unit 0.6%
3051 White wine Producers/Companies Monthly Price per unit 0.3%
3051 Red wine Producers/Companies Monthly Price per unit 0.3%
3051 Spirit coolers Producers/Companies Monthly Price per unit 0.5%
3052 Beer Producers/Companies Monthly Price per unit 4.3%
3053 Soft drinks Producers/Companies Monthly Price per unit 1.7%
306 Manufacture of tobacco products
3060 Cigarettes Producers/Companies Monthly Price per unit 1.3%
31 Manufacture of textiles, clothing and leather goods
312 Manufacture of other textiles
3121
Linen Producers/Companies Monthly Price per unit 0.2%
3121 Loose car seat covers Producers/Companies Monthly Price per unit 0.3%
3122 Carpets (excl mats and rugs) Producers/Companies Monthly Price per unit 0.3%
313 Manufacture of knitted and crocheted fabrics and articles
3130 Sportswear Producers/Companies Monthly Price per unit 0.3%
314 Manufacture of wearing apparel, except fur apparel
3140
Womens clothing Producers/Companies Monthly Price per unit 1.3%
3140 Mens clothing Producers/Companies Monthly Price per unit 1.5%
3140 Protective wears Producers/Companies Monthly Price per unit 0.6%
317 Manufacture of footwear
3170
Men and boys footwear Producers/Companies Monthly Price per unit 0.4%
3170 Women and girls footwear Producers/Companies Monthly Price per unit 0.2%
32 Manufacture of wood, cork, straw, paper, printing, media
323 Manufacture of paper and paper products
3231
Paper for printing Producers/Companies Monthly Price per unit 0.2%
3231 Packing and wrapping paper in rolls or sheets Producers/Companies Monthly Price per unit 0.3%
3232 Cardboard boxes Producers/Companies Monthly Price per unit 2.7%
3239 Disposable nappies for babies Producers/Companies Monthly Price per unit 0.2%
3239
Toilet paper, tissues, napkins and other household articles of paper Producers/Companies Monthly Price per unit 0.4%
3239 Labels/tags/stickers of paper Producers/Companies Monthly Price per unit 0.3%
324 Publishing
3241 Books Producers/Companies Monthly Price per unit 1.7%
325 Printing and activities related to printing
3251
Newspapers Producers/Companies Monthly Price per unit 0.3%
3251 Magazines Producers/Companies Monthly Price per unit 0.5%
3251
Trade advertising material and other printed material Producers/Companies Monthly Price per unit 0.6%
3251 Printed Stationary Producers/Companies Monthly Price per unit 0.4%
33 Manufacture of coke, refined petroleum products, nuclear, chemicals, rubber, plastic
331 Manufacture of coke oven products
3310 Pre-mixed asphalt Producers/Companies Monthly Price per unit 0.1%

34
SIC Code
SIC Description
Indicator products Price collection methodology
Frequency Type of
price Weight
3310 Bituminous mixtures Producers/Companies Monthly Price per unit 0.4%
332 Petroleum refineries/synthesisers
3321/2/3
Petrol Producers/Companies Monthly Average price 3.2%
3321/2/3 Jet fuel Producers/Companies Monthly
Average price 0.3%
3321/2/3 Diesel Producers/Companies Monthly
Average price 4.0%
3321/2/3 Engine oils Producers/Companies Monthly
Average price 0.2%
3321/2/3 LPG gasses Producers/Companies Monthly
Average price 0.3%
3321/2/3
Petro-chemicals and feedstocks Producers/Companies Monthly
Average price 2.0%
3321/2/3 Lubricating preparations Producers/Companies Monthly
Average price 0.1%
334 Manufacture of basic chemicals
3342 Fertilizers Producers/Companies Monthly Price per unit 0.6%
335 Manufacture of other chemicals products
3351
Insecticides Producers/Companies Monthly Price per unit 0.4%
3352 Paints Producers/Companies Monthly Price per unit 1.1%
3353
Provitamins, vitamins, hormones and antibiotics Producers/Companies Monthly Price per unit 0.7%
3353 Cold and flu preparations Producers/Companies Monthly Price per unit 0.2%
3353 Anti-inflammatories Producers/Companies Monthly Price per unit 0.3%
3353 Non-narcotic Analgesics Producers/Companies Monthly Price per unit 0.2%
3353 Expectorants Producers/Companies Monthly Price per unit 0.1%
3353 Antiviral and retroviral drugs Producers/Companies Monthly Price per unit 1.0%
3354 Toilet Soap Producers/Companies Monthly Price per unit 0.2%
3354
Non soap based detergents, laundry bars and tablets Producers/Companies Monthly Price per unit 0.4%
3354 Washing powder Producers/Companies Monthly Price per unit 0.5%
3354 Lotions and creams Producers/Companies Monthly Price per unit 0.6%
3354 Perfumes and deodorant Producers/Companies Monthly Price per unit 0.2%
335/6 Manufacture of other chemicals products/Man-made fibres
3359/60
Adhesives and sealants Producers/Companies Monthly Price per unit 0.3%
3359/60 Prepared explosives Producers/Companies Monthly Price per unit 0.6%
3359/60
Water and pool treatment chemicals Producers/Companies Monthly Price per unit 0.5%
337 Manufacture of rubber products
3371 Tyres Producers/Companies Monthly Price per unit 1.0%
338 Manufacture of plastic products
3380
Vinyl chloride polymers (PVC) and copolymers Producers/Companies Monthly Price per unit 0.3%
3380 Plastic pipes, tubes and fittings Producers/Companies Monthly Price per unit 0.3%
3380 Plastic films for packaging purposes Producers/Companies Monthly Price per unit 0.7%
3380 Vinyl sheeting or flooring Producers/Companies Monthly Price per unit 0.1%
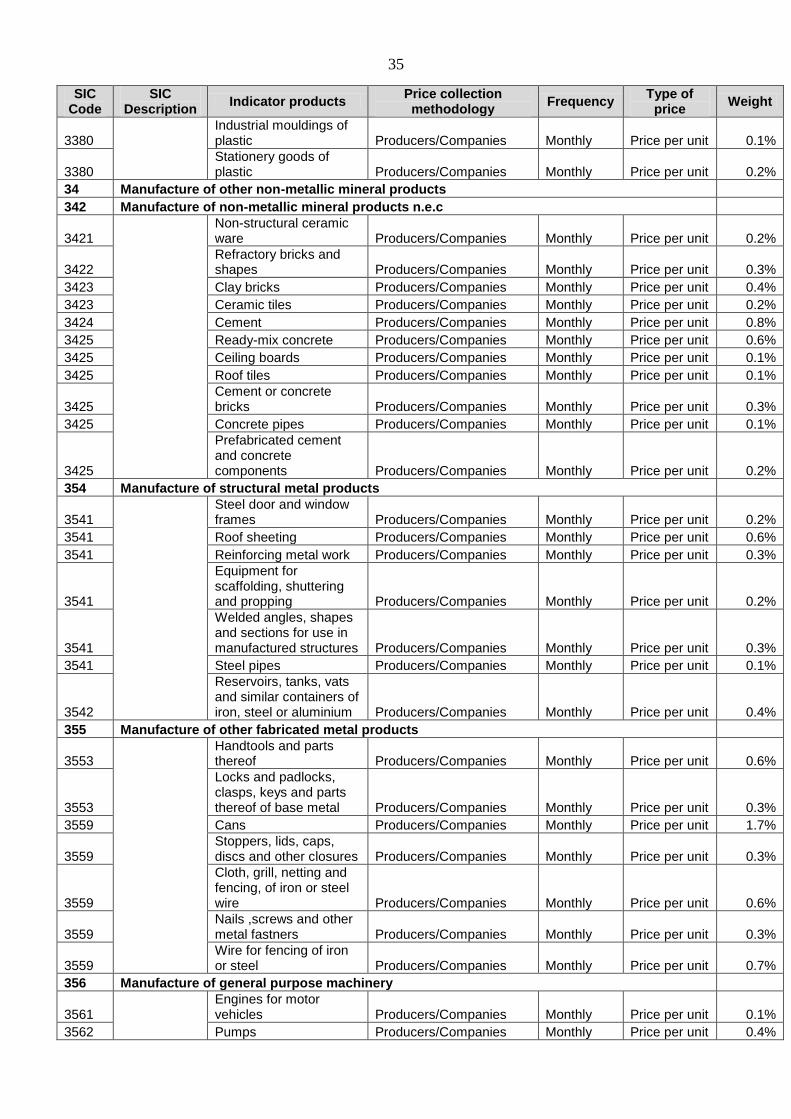
35
SIC Code
SIC Description
Indicator products Price collection methodology
Frequency Type of
price Weight
3380 Industrial mouldings of plastic Producers/Companies Monthly Price per unit 0.1%
3380 Stationery goods of plastic Producers/Companies Monthly Price per unit 0.2%
34 Manufacture of other non-metallic mineral products
342 Manufacture of non-metallic mineral products n.e.c
3421
Non-structural ceramic ware Producers/Companies Monthly Price per unit 0.2%
3422 Refractory bricks and shapes Producers/Companies Monthly Price per unit 0.3%
3423 Clay bricks Producers/Companies Monthly Price per unit 0.4%
3423 Ceramic tiles Producers/Companies Monthly Price per unit 0.2%
3424 Cement Producers/Companies Monthly Price per unit 0.8%
3425 Ready-mix concrete Producers/Companies Monthly Price per unit 0.6%
3425 Ceiling boards Producers/Companies Monthly Price per unit 0.1%
3425 Roof tiles Producers/Companies Monthly Price per unit 0.1%
3425
Cement or concrete bricks Producers/Companies Monthly Price per unit 0.3%
3425 Concrete pipes Producers/Companies Monthly Price per unit 0.1%
3425
Prefabricated cement and concrete components Producers/Companies Monthly Price per unit 0.2%
354 Manufacture of structural metal products
3541 Steel door and window frames Producers/Companies Monthly Price per unit 0.2%
3541 Roof sheeting Producers/Companies Monthly Price per unit 0.6%
3541
Reinforcing metal work Producers/Companies Monthly Price per unit 0.3%
3541
Equipment for scaffolding, shuttering and propping Producers/Companies Monthly Price per unit 0.2%
3541
Welded angles, shapes and sections for use in manufactured structures Producers/Companies Monthly Price per unit 0.3%
3541 Steel pipes Producers/Companies Monthly Price per unit 0.1%
3542
Reservoirs, tanks, vats and similar containers of iron, steel or aluminium Producers/Companies Monthly Price per unit 0.4%
355 Manufacture of other fabricated metal products
3553
Handtools and parts thereof Producers/Companies Monthly Price per unit 0.6%
3553
Locks and padlocks, clasps, keys and parts thereof of base metal Producers/Companies Monthly Price per unit 0.3%
3559 Cans Producers/Companies Monthly Price per unit 1.7%
3559 Stoppers, lids, caps, discs and other closures Producers/Companies Monthly Price per unit 0.3%
3559
Cloth, grill, netting and fencing, of iron or steel wire Producers/Companies Monthly Price per unit 0.6%
3559 Nails ,screws and other metal fastners Producers/Companies Monthly Price per unit 0.3%
3559 Wire for fencing of iron or steel Producers/Companies Monthly Price per unit 0.7%
356 Manufacture of general purpose machinery
3561
Engines for motor vehicles Producers/Companies Monthly Price per unit 0.1%
3562 Pumps Producers/Companies Monthly Price per unit 0.4%

36
SIC Code
SIC Description
Indicator products Price collection methodology
Frequency Type of
price Weight
3562 Taps, cocks and valves Producers/Companies Monthly Price per unit 0.3%
3563 Ball or roll bearings Producers/Companies Monthly Price per unit 0.2%
3563 Gears and gearing Producers/Companies Monthly Price per unit 0.1%
3565
Lifting and handling equipment and parts thereof Producers/Companies Monthly Price per unit 0.4%
3569 Industrial heating and cooling system Producers/Companies Monthly Price per unit 0.6%
3569
Commercial and industrial refrigerating and freezing equipments Producers/Companies Monthly Price per unit 0.3%
3569
Filtering or purifying machinery and apparatus( except for air or engines) Producers/Companies Monthly Price per unit 0.3%
3569 Industrial ventilating fans and blowers Producers/Companies Monthly Price per unit 0.3%
357 Manufacture of special purpose machinery
3572
Machine-tools and parts and accessories thereof Producers/Companies Monthly Price per unit 0.5%
3574
Continuous-action elevators, cutters, tunnelling, boring and sinking machinery Producers/Companies Monthly Price per unit 0.2%
3574 Graders and scrapers Producers/Companies Monthly Price per unit 0.1%
3574 Tamping machines and road rollers Producers/Companies Monthly Price per unit 0.1%
3574 Front-end shovel loaders, self-propelled Producers/Companies Monthly Price per unit 0.1%
3574
Mechanical shovels, excavators and shovel loaders Producers/Companies Monthly Price per unit 0.2%
3574 Dumpers designed for off- highway use Producers/Companies Monthly Price per unit 0.3%
3574
Machinery for sorting, screening, separating, washing, crushing, grinding, mixing or kneading of construction material Producers/Companies Monthly Price per unit 0.4%
3574
Parts of machinery for mining, quarrying and construction Producers/Companies Monthly Price per unit 0.4%
3575
Machinery for food, beverage and tobacco processing, and parts thereof Producers/Companies Monthly Price per unit 0.3%
3577 Munitions, ammunitions and cartridges Producers/Companies Monthly Price per unit 1.7%
358 Manufacture of household appliances
3580
Fridge-freezer Producers/Companies Monthly Price per unit 0.3%
3580 Geysers Producers/Companies Monthly Price per unit 0.1%
3580 Stoves and ovens Producers/Companies Monthly Price per unit 0.1%
359 Manufacture of office, accounting and computing machinery
3590 Computers Producers/Companies Monthly Price per unit 0.5%
36 Manufacture of electrical machinery and apparatus n.e.c
361 Manufacture of electric motors, generators and transformers
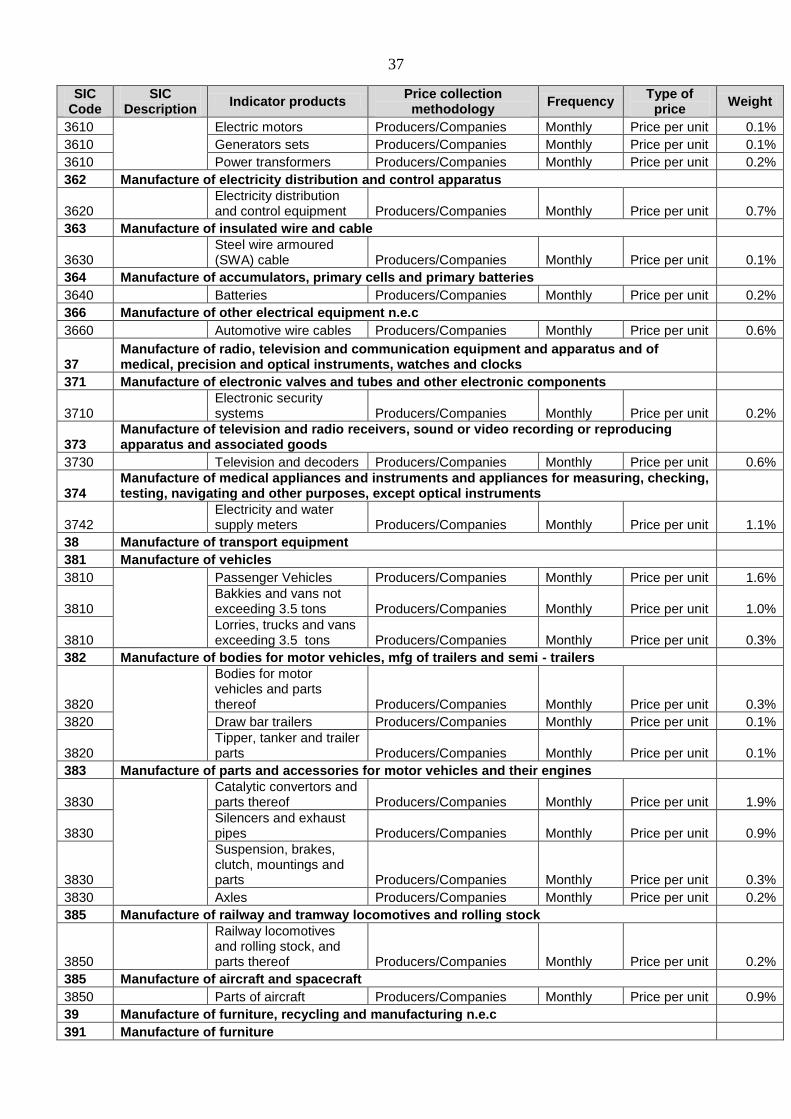
37
SIC Code
SIC Description
Indicator products Price collection methodology
Frequency Type of
price Weight
3610
Electric motors Producers/Companies Monthly Price per unit 0.1%
3610 Generators sets Producers/Companies Monthly Price per unit 0.1%
3610 Power transformers Producers/Companies Monthly Price per unit 0.2%
362 Manufacture of electricity distribution and control apparatus
3620 Electricity distribution and control equipment Producers/Companies Monthly Price per unit 0.7%
363 Manufacture of insulated wire and cable
3630
Steel wire armoured (SWA) cable Producers/Companies Monthly Price per unit 0.1%
364 Manufacture of accumulators, primary cells and primary batteries
3640 Batteries Producers/Companies Monthly Price per unit 0.2%
366 Manufacture of other electrical equipment n.e.c
3660 Automotive wire cables Producers/Companies Monthly Price per unit 0.6%
37 Manufacture of radio, television and communication equipment and apparatus and of medical, precision and optical instruments, watches and clocks
371 Manufacture of electronic valves and tubes and other electronic components
3710 Electronic security systems Producers/Companies Monthly Price per unit 0.2%
373 Manufacture of television and radio receivers, sound or video recording or reproducing apparatus and associated goods
3730 Television and decoders Producers/Companies Monthly Price per unit 0.6%
374 Manufacture of medical appliances and instruments and appliances for measuring, checking, testing, navigating and other purposes, except optical instruments
3742 Electricity and water supply meters Producers/Companies Monthly Price per unit 1.1%
38 Manufacture of transport equipment
381 Manufacture of vehicles
3810
Passenger Vehicles Producers/Companies Monthly Price per unit 1.6%
3810 Bakkies and vans not exceeding 3.5 tons Producers/Companies Monthly Price per unit 1.0%
3810 Lorries, trucks and vans exceeding 3.5 tons Producers/Companies Monthly Price per unit 0.3%
382 Manufacture of bodies for motor vehicles, mfg of trailers and semi - trailers
3820
Bodies for motor vehicles and parts thereof Producers/Companies Monthly Price per unit 0.3%
3820 Draw bar trailers Producers/Companies Monthly Price per unit 0.1%
3820 Tipper, tanker and trailer parts Producers/Companies Monthly Price per unit 0.1%
383 Manufacture of parts and accessories for motor vehicles and their engines
3830
Catalytic convertors and parts thereof Producers/Companies Monthly Price per unit 1.9%
3830 Silencers and exhaust pipes Producers/Companies Monthly Price per unit 0.9%
3830
Suspension, brakes, clutch, mountings and parts Producers/Companies Monthly Price per unit 0.3%
3830 Axles Producers/Companies Monthly Price per unit 0.2%
385 Manufacture of railway and tramway locomotives and rolling stock
3850
Railway locomotives and rolling stock, and parts thereof Producers/Companies Monthly Price per unit 0.2%
385 Manufacture of aircraft and spacecraft
3850 Parts of aircraft Producers/Companies Monthly Price per unit 0.9%
39 Manufacture of furniture, recycling and manufacturing n.e.c
391 Manufacture of furniture

38
SIC Code
SIC Description
Indicator products Price collection methodology
Frequency Type of
price Weight
3910
Furniture Producers/Companies Monthly Price per unit 0.9%
3910 Base sets and mattresses Producers/Companies Monthly Price per unit 0.4%
392 Manufacture n.e.c.
3921 Precious and semi-precious stones Producers/Companies Monthly Price per unit 0.3%
3921
Gold jewellery Producers/Companies Monthly Price per unit 0.1%
3929 Number plates and signs Producers/Companies Monthly Price per unit 0.4%