article with some preliminary evidence of reputation use in procurement .pdf

Procurement Package 1 Proposed Preliminary Design
San Joaquin River
Floodplain Impacts Assessment
Hydrology & Hydraulics Report
August 2012
Engineering Report
Sylmar
Anaheim
Los Angeles
Kings/Tulare Regional Station(Potential Station)
Ontario Airport
Riverside
Murrieta
Escondido
University City
San Diego
Industry
Sacramento
Stockton
Downtown Modesto
San Francisco Transbay Terminal
Gilroy
San Jose Diridon Redwood City
or Palo Alto
Millbrae-SFO
Burbank
Downtown Merced
Fresno
Bakersfield
Palmdale
Norwalk
10/2
6/12
AD
DEN
DU
M 5
- R
FP H
SR 1
1-16

10/2
6/12
AD
DEN
DU
M 5
- R
FP H
SR 1
1-16

CALIFORNIA HIGH-SPEED TRAIN PROJECT
ENGINEERING REPORT
Procurement Package 1 Proposed Preliminary Design
San Joaquin River
Floodplain Impacts Assessment Hydrology & Hydraulics Report
Prepared by:
AECOM CH2M HILL
August 23, 2012
10/2
6/12
AD
DEN
DU
M 5
- R
FP H
SR 1
1-16

California High‐Speed Rail Authority and Federal Railroad Administration. 2012. Procurement Package 1 Proposed Preliminary Design, San Joaquin River Floodplain Impacts Assessment Hydrology & Hydraulics Report, California High‐Speed Train Project. Sacramento, CA, and Washington, DC. Prepared by AECOM and CH2M HILL, August 2012.
10/2
6/12
AD
DEN
DU
M 5
- R
FP H
SR 1
1-16
CALIFORNIA HIGH-SPEED TRAIN PROJECT FLOODPLAIN IMPACTS ASSESSMENT AND PROCUREMENT PACKAGE 1 HYDROLOGY & HYRAULICS REPORT
PAGE III
D R A F T REV 1 – AUGUST 22, 2012
Table of Contents
Table of Contents ................................................................................................................................................ iii
List of Abbreviated Terms .................................................................................................................................... v Introduction ..................................................................................................................................................... 7
Purpose ............................................................................................................................................... 7 Encroachment Location ...................................................................................................................... 7 Encroachment Description ................................................................................................................. 9 Jurisdiction ........................................................................................................................................ 12
General Hydrology ......................................................................................................................................... 12 Basin 12 Friant Dam Operations...................................................................................................................... 12 FEMA FIS ........................................................................................................................................... 13 Planned Hydrology Updates ............................................................................................................. 13
Regulatory Hydrology .................................................................................................................................... 13 FEMA 13 DWR 13 CVFPB 14 Modeled Flow Rates ......................................................................................................................... 14
Hydraulic Model ............................................................................................................................................. 14 HEC‐RAS Models ............................................................................................................................... 14 FEMA Model ..................................................................................................................................... 14 Caltrans Model .................................................................................................................................. 15 HST Model ......................................................................................................................................... 15 Topographic Information .................................................................................................................. 15 Hydraulic Structures ......................................................................................................................... 17 Validation of Model Geometries ...................................................................................................... 18 Model Uncertainty ............................................................................................................................ 20
Hydraulic Evaluation ...................................................................................................................................... 20 Soffit Clearance ................................................................................................................................. 20 Incremental Flood Rise ..................................................................................................................... 21
Conclusions .................................................................................................................................................... 22 References ..................................................................................................................................................... 22
List of Tables
1 FEMA FIS Flood Flows on the San Joaquin River (FEMA 2008 and 2009) ............................................................ 13
2 Comparison of FEMA and Caltrans HEC‐RAS Models for SJR ............................................................................... 14
3 Existing Design Water Surface Elevation at Crossing Table ................................................................................. 20
4 Incremental Flood Rise Due to Proposed Encroachment .................................................................................... 22
10/2
6/12
AD
DEN
DU
M 5
- R
FP H
SR 1
1-16
CALIFORNIA HIGH-SPEED TRAIN PROJECT FLOODPLAIN IMPACTS ASSESSMENT AND PROCUREMENT PACKAGE 1 HYDROLOGY & HYRAULICS REPORT
PAGE IV
D R A F T REV 1 – AUGUST 22, 2012
List of Figures
1 Site Vicinity and Location Map ............................................................................................................................... 7
2 Photos of the Crossing Location ............................................................................................................................. 8
3 San Joaquin River and Major Hydraulic Structures ................................................................................................ 9
4a Pier Configuration – North Portion ...................................................................................................................... 10
4b Pier Configuration – Center Portion ..................................................................................................................... 11
4c Pier Configuration – South Portion ...................................................................................................................... 11
5 Example of California Department of Water Resources LiDAR DTM ................................................................... 16
6 Example of Project Aerial Survey Topography ..................................................................................................... 17
7 Comparison of FEMA HEC‐RAS Cross Section and Caltrans HEC‐RAS Cross Section Geometry with DWR TIN Topography. .......................................................................................................................................... 19
8 Clearance between the Proposed HST Bridge and Alternative Design Water Surface Elevations ...................... 21
10/2
6/12
AD
DEN
DU
M 5
- R
FP H
SR 1
1-16
CALIFORNIA HIGH-SPEED TRAIN PROJECT FLOODPLAIN IMPACTS ASSESSMENT AND PROCUREMENT PACKAGE 1 HYDROLOGY & HYRAULICS REPORT
PAGE V
D R A F T REV 1 – AUGUST 22, 2012
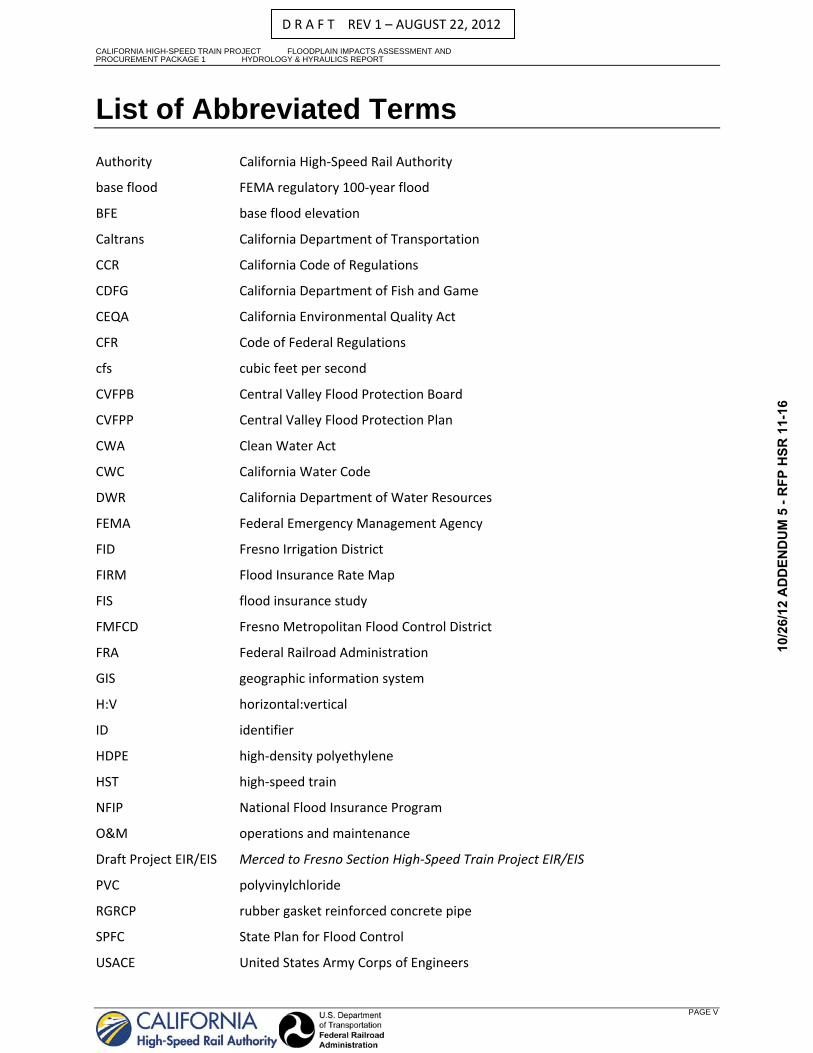
List of Abbreviated Terms
Authority California High‐Speed Rail Authority
base flood FEMA regulatory 100‐year flood
BFE base flood elevation
Caltrans California Department of Transportation
CCR California Code of Regulations
CDFG California Department of Fish and Game
CEQA California Environmental Quality Act
CFR Code of Federal Regulations
cfs cubic feet per second
CVFPB Central Valley Flood Protection Board
CVFPP Central Valley Flood Protection Plan
CWA Clean Water Act
CWC California Water Code
DWR California Department of Water Resources
FEMA Federal Emergency Management Agency
FID Fresno Irrigation District
FIRM Flood Insurance Rate Map
FIS flood insurance study
FMFCD Fresno Metropolitan Flood Control District
FRA Federal Railroad Administration
GIS geographic information system
H:V horizontal:vertical
ID identifier
HDPE high‐density polyethylene
HST high‐speed train
NFIP National Flood Insurance Program
O&M operations and maintenance
Draft Project EIR/EIS Merced to Fresno Section High‐Speed Train Project EIR/EIS
PVC polyvinylchloride
RGRCP rubber gasket reinforced concrete pipe
SPFC State Plan for Flood Control
USACE United States Army Corps of Engineers
10/2
6/12
AD
DEN
DU
M 5
- R
FP H
SR 1
1-16
CALIFORNIA HIGH-SPEED TRAIN PROJECT FLOODPLAIN IMPACTS ASSESSMENT AND PROCUREMENT PACKAGE 1 HYDROLOGY & HYRAULICS REPORT
PAGE VI
D R A F T REV 1 – AUGUST 22, 2012
U.S.C. United States Code
USGS U.S. Geological Survey
WSE water surface elevation
10/2
6/12
AD
DEN
DU
M 5
- R
FP H
SR 1
1-16
ERROR! NO TEXT OF SPECIFIED STYLE IN DOCUMENT.
PAGE 7
D R A F T REV 1 – AUGUST 22, 2012
Introduction Purpose The purpose of this TM is to summarize available hydrologic and hydraulic information for the proposed California High Speed Train (HST) crossing of the San Joaquin River (SJR), and to present the hydraulic impacts caused by the proposed encroachment at regulatory flow rates. General information regarding the HST between Merced and Fresno and associated hydrologic and hydraulic requirements for HST stream encroachments are summarized in separate documents, including AECOM and CH2M HILL 2011 and 2012 in the references, and are not repeated here. This technical memorandum is specific to HST San Joaquin River crossing based on the procurement‐level bridge configuration.
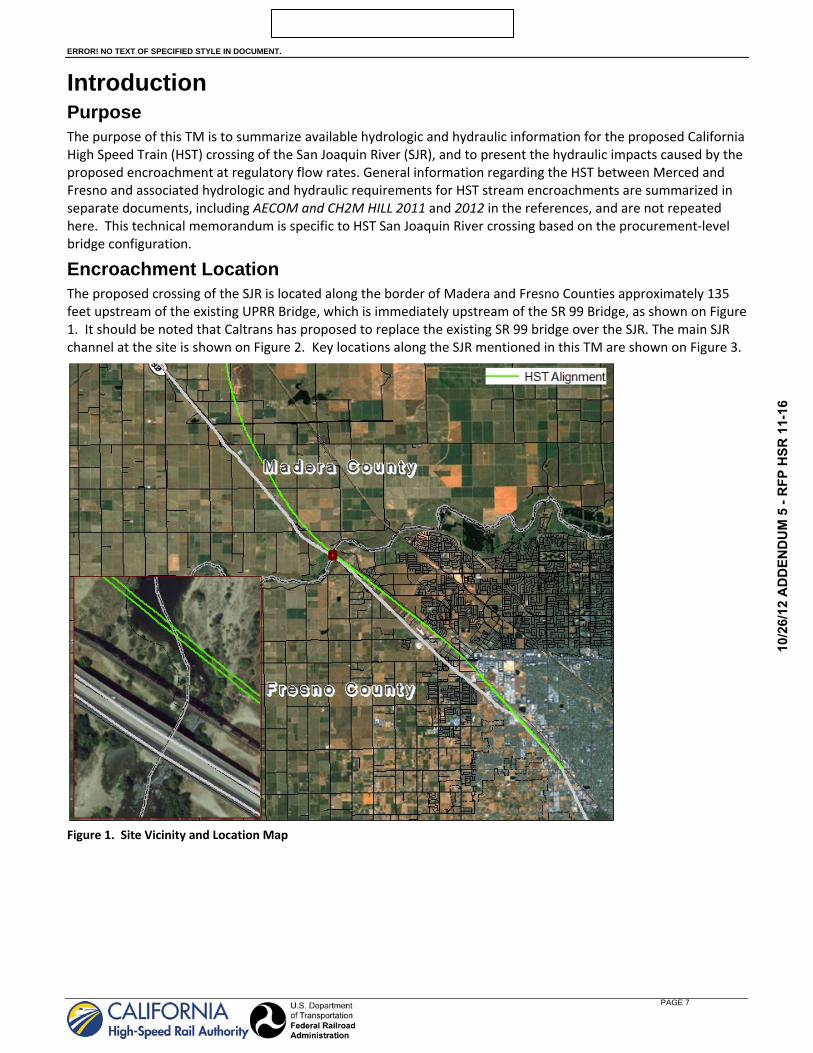
Encroachment Location The proposed crossing of the SJR is located along the border of Madera and Fresno Counties approximately 135 feet upstream of the existing UPRR Bridge, which is immediately upstream of the SR 99 Bridge, as shown on Figure 1. It should be noted that Caltrans has proposed to replace the existing SR 99 bridge over the SJR. The main SJR channel at the site is shown on Figure 2. Key locations along the SJR mentioned in this TM are shown on Figure 3.
Figure 1. Site Vicinity and Location Map
10/2
6/12
AD
DEN
DU
M 5
- R
FP H
SR 1
1-16
CALIFORNIA HIGH-SPEED TRAIN PROJECT FLOODPLAIN IMPACTS ASSESSMENT AND PROCUREMENT PACKAGE 1 HYDROLOGY & HYRAULICS REPORT
PAGE 8
D R A F T REV 1 – AUGUST 22, 2012
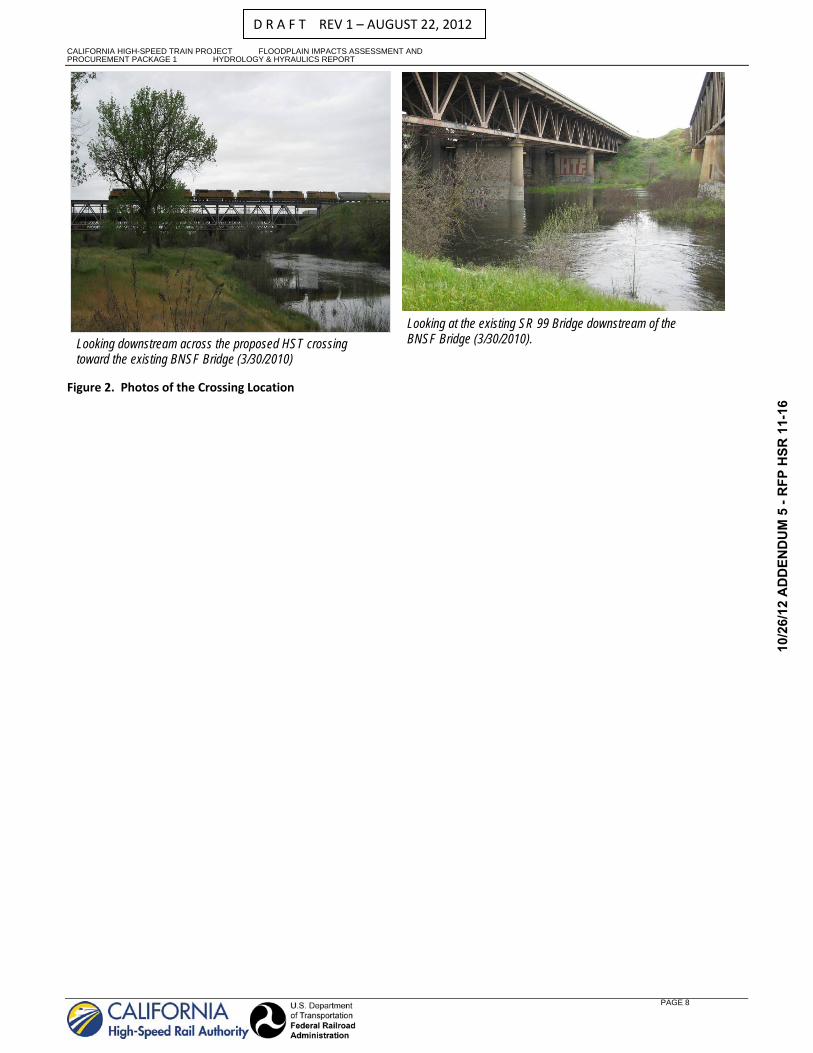
Figure 2. Photos of the Crossing Location
Looking at the existing SR 99 Bridge downstream of the BNSF Bridge (3/30/2010). Looking downstream across the proposed HST crossing
toward the existing BNSF Bridge (3/30/2010)
10/2
6/12
AD
DEN
DU
M 5
- R
FP H
SR 1
1-16
ERROR! NO TEXT OF SPECIFIED STYLE IN DOCUMENT.
PAGE 9
D R A F T REV 1 – AUGUST 22, 2012
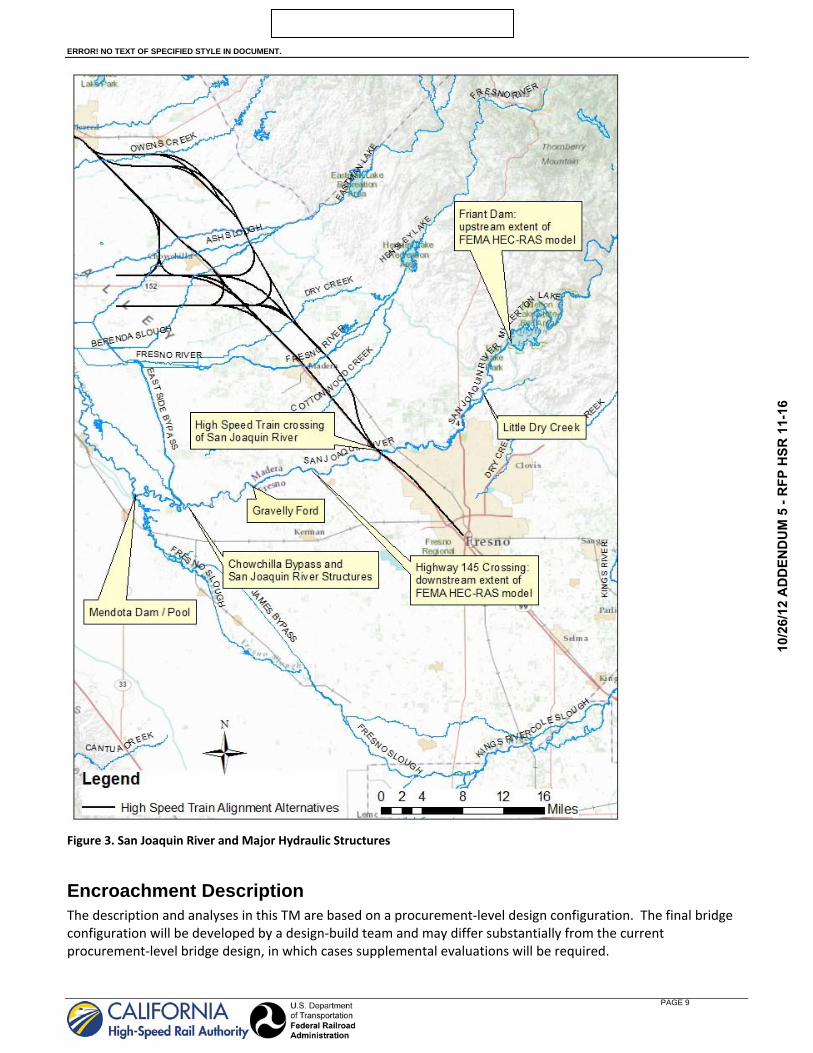
Figure 3. San Joaquin River and Major Hydraulic Structures
Encroachment Description The description and analyses in this TM are based on a procurement‐level design configuration. The final bridge configuration will be developed by a design‐build team and may differ substantially from the current procurement‐level bridge design, in which cases supplemental evaluations will be required.
10/2
6/12
AD
DEN
DU
M 5
- R
FP H
SR 1
1-16
CALIFORNIA HIGH-SPEED TRAIN PROJECT FLOODPLAIN IMPACTS ASSESSMENT AND PROCUREMENT PACKAGE 1 HYDROLOGY & HYRAULICS REPORT
PAGE 10
D R A F T REV 1 – AUGUST 22, 2012
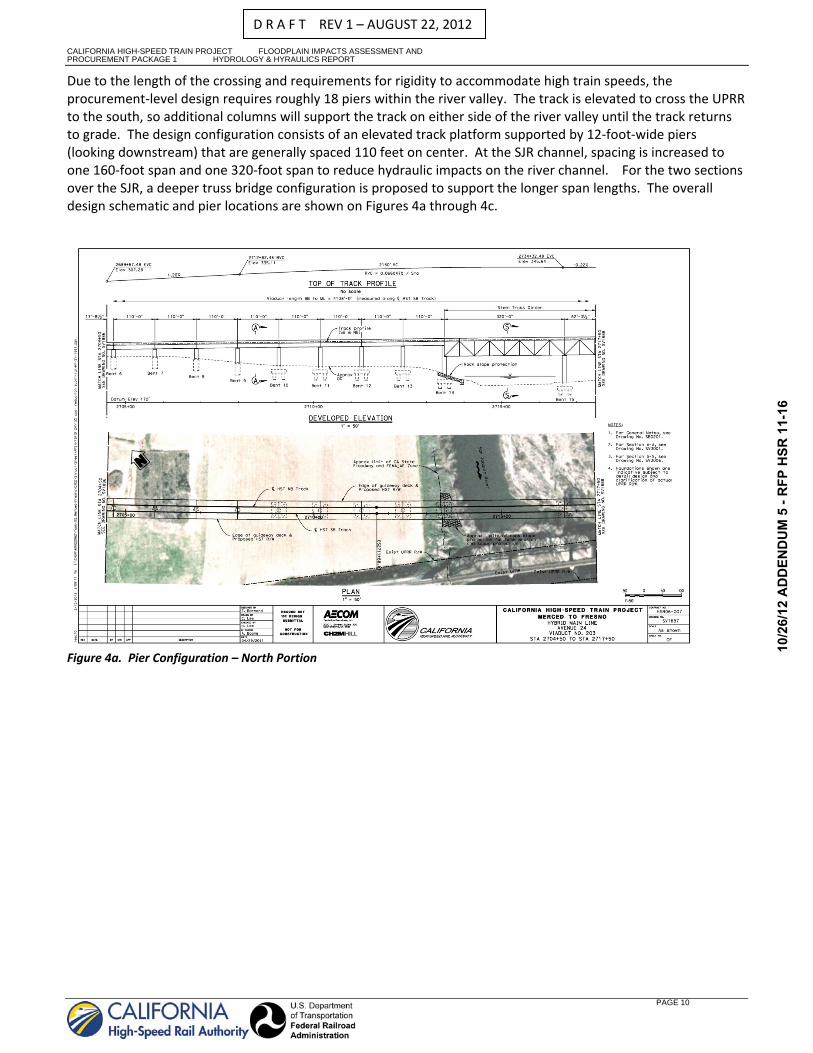
Due to the length of the crossing and requirements for rigidity to accommodate high train speeds, the procurement‐level design requires roughly 18 piers within the river valley. The track is elevated to cross the UPRR to the south, so additional columns will support the track on either side of the river valley until the track returns to grade. The design configuration consists of an elevated track platform supported by 12‐foot‐wide piers (looking downstream) that are generally spaced 110 feet on center. At the SJR channel, spacing is increased to one 160‐foot span and one 320‐foot span to reduce hydraulic impacts on the river channel. For the two sections over the SJR, a deeper truss bridge configuration is proposed to support the longer span lengths. The overall design schematic and pier locations are shown on Figures 4a through 4c.
Figure 4a. Pier Configuration – North Portion
10/2
6/12
AD
DEN
DU
M 5
- R
FP H
SR 1
1-16

ERROR! NO TEXT OF SPECIFIED STYLE IN DOCUMENT.
PAGE 11
D R A F T REV 1 – AUGUST 22, 2012
Figure 4b. Pier Configuration – Center Portion.
Figure 4c. Pier Configuration – South Portion
10/2
6/12
AD
DEN
DU
M 5
- R
FP H
SR 1
1-16

CALIFORNIA HIGH-SPEED TRAIN PROJECT FLOODPLAIN IMPACTS ASSESSMENT AND PROCUREMENT PACKAGE 1 HYDROLOGY & HYRAULICS REPORT
PAGE 12
D R A F T REV 1 – AUGUST 22, 2012
Jurisdiction The following agencies have jurisdiction for permits pertaining to floodplain encroachment at the SJR crossing: Federal Emergency Management Agency (FEMA), Central Valley Flood Protection Board (CVFPB), California Department of Water Resources (DWR) and California High‐Speed Rail Authority (Authority):
The SJR crossing includes a mapped FEMA floodway. Encroachment of the FEMA National Flood Insurance Program (NFIP) Flood Insurance Rate Map (FIRM) 100‐year floodplain is regulated locally through municipal and county construction permits. Approved modification of the floodway requires a Conditional Letter of Map Revision (CLOMR).
The SJR crossing includes a mapped CVFPB floodway. Encroachment of the CVFPB floodway is regulated through CVFPB Encroachment Permits.
The crossing is located near an urbanized area; therefore, pending requirements by the California Department of Water Resources (DWR) to use the 200‐year flood in lieu of FEMA’s 100‐year base flood may apply in the future. Applicable timing, urbanizing boundaries and 200‐year flow rates for DWR regulations have not yet been formalized.
There is a Federal flood‐control project downstream on the SJR, but the U.S. Army Corps of Engineers (USACE) has indicated that it does not extend upstream to this crossing location; therefore, reviews by the USACE under Sections 408 and 208.10 will not be required for the SJR crossing (USACE 2012). USACE and CVFPB will, however, closely coordinate on HST hydraulic impact evaluations throughout the Central Valley.
General Hydrology Basin The contributing watershed encompasses about 1,800 square miles, originating in the Sierra Nevada Mountains where precipitation increases substantially with altitude. Most of that watershed is controlled by a number of upstream dams that are used variously for irrigation diversion, hydropower and flood control. Friant Dam is the closest, and regulates discharge for irrigation diversion, flood control and other purposes, including restoration of native salmonid populations. Historically, flows rates in the SJR have generally decreased with distance from the dam due to irrigation diversions.
Friant Dam Operations Friant Dam is operated by the United States Bureau of Reclamation (Reclamation), with flood control storage and release regulated by an agreement with the USACE (SJR Restoration Program, 2008). The dam was completed in 1942, creating Millerton Lake with a storage capacity of 520,500 acre‐feet. Table 4‐1 of the SJR Restoration Program 2008 document lists a Probable Maximum Flood peak outflow of 570,000 cfs from Friant Dam, a value which is cited as coming from a 1998 memorandum from the Manager of Planning Services to Reclamation’s Regional Director. The largest flood on record released from Millerton Lake since the construction of Friant Dam is 97,000 cfs in December 1955. Non‐flood releases from Friant Dam are restricted to 8,000 cfs (SJR Restoration Program, 2008), which is the authorized design flow for the SJR Federal flood‐control project downstream (USACE 1959).
Historical Friant Dam operations are subject to change. A settlement agreement between multiple environmental groups and Reclamation was signed on September 13, 2006, and signed by President Obama in March, 2009, agreeing to additional releases from Friant Dam for habitat restoration. These releases result in a 15 percent decrease in irrigation water deliveries (Jones, 2010). The settlement also provides for additional flood protection along the SJR (NRDC, 2007). The 2012 Central Valley Flood Protection Plan reports plans to increase the flood storage allocation at Friant Dam. Due to these changes, the 1998 reservoir operations cited by the SJR Restoration Program (2008) may not fully reflect future operations. The trend appears to target higher base flows for fish habitat restoration and lower flood flows for flood‐reduction objectives.
10/2
6/12
AD
DEN
DU
M 5
- R
FP H
SR 1
1-16
ERROR! NO TEXT OF SPECIFIED STYLE IN DOCUMENT.
PAGE 13
D R A F T REV 1 – AUGUST 22, 2012
FEMA FIS The original hydrology for the Madera and Fresno County Flood Insurance Studies (FISs) was developed in the 1970s using 38 years of flow records near Mendota, downstream from Fresno (FEMA 2008, 2009). Hydrology for the Town of Fireburgh (at the valley bottom, north of the Mendota Pool) was established in the late 1970s and reconfirmed by the U.S. Army Corps of Engineers (USACE) in 1994. Peak flows at Friant Dam and at Gravelly Ford were generated by USACE from a 48‐year flow record spanning 1949 to 1997. Gravelly Ford is located 35 miles downstream from Friant Dam, halfway between the SR 99 crossing and the Mendota Pool. This hydrology developed by USACE was used for the Sacramento‐San Joaquin River Basin Comprehensive Study prepared by the Corps in 1999. The hydrology has also been used for several FEMA floodplain updates since 2000.
Planned Hydrology Updates USACE has been working for several years to update the hydrology for many of the rivers flowing into the San Joaquin and Sacramento River valleys. This effort is called the Central Valley Hydrology Study (CVHS; USACE and DWR 2012). Among other uses, this updated hydrology will be used to update flood‐prone areas, including the 200‐year flood areas mandated by California’s FLOODSAFE Program. The new hydrology under development by the USACE is expected to be available in late 2012 or 2013, although the anticipated date remains uncertain and has been extended. The intent of DWR is to make the new hydrology models for the various rivers available for public use as they are finalized. Updated floodplain maps for the San Joaquin River might be completed as early as the end of 2012; but it may also be spring of 2013 before they are available. Also under development is delineation of areas that are considered urban or urbanizing for application of DWR 200‐year floodplains instead of FEMA 100‐year floodplains.
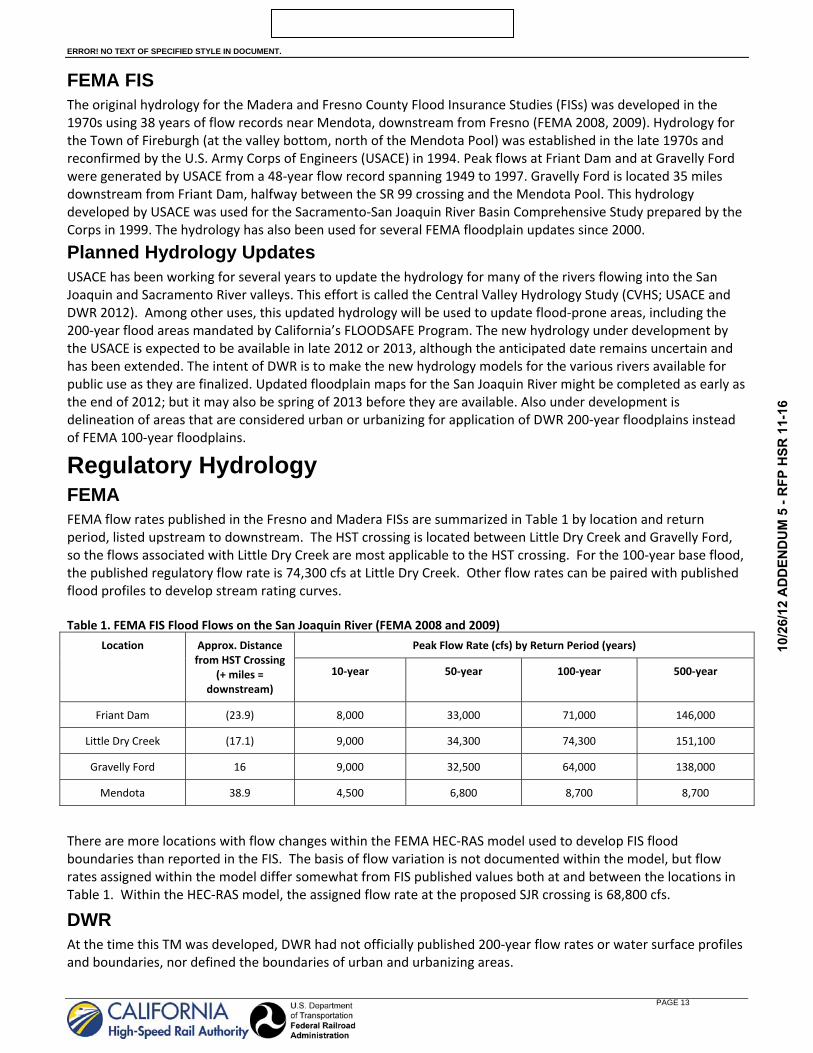
Regulatory Hydrology FEMA FEMA flow rates published in the Fresno and Madera FISs are summarized in Table 1 by location and return period, listed upstream to downstream. The HST crossing is located between Little Dry Creek and Gravelly Ford, so the flows associated with Little Dry Creek are most applicable to the HST crossing. For the 100‐year base flood, the published regulatory flow rate is 74,300 cfs at Little Dry Creek. Other flow rates can be paired with published flood profiles to develop stream rating curves. Table 1. FEMA FIS Flood Flows on the San Joaquin River (FEMA 2008 and 2009)
Location Approx. Distance from HST Crossing
(+ miles = downstream)
Peak Flow Rate (cfs) by Return Period (years)
10‐year 50‐year 100‐year 500‐year
Friant Dam (23.9) 8,000 33,000 71,000 146,000
Little Dry Creek (17.1) 9,000 34,300 74,300 151,100
Gravelly Ford 16 9,000 32,500 64,000 138,000
Mendota 38.9 4,500 6,800 8,700 8,700
There are more locations with flow changes within the FEMA HEC‐RAS model used to develop FIS flood boundaries than reported in the FIS. The basis of flow variation is not documented within the model, but flow rates assigned within the model differ somewhat from FIS published values both at and between the locations in Table 1. Within the HEC‐RAS model, the assigned flow rate at the proposed SJR crossing is 68,800 cfs.
DWR At the time this TM was developed, DWR had not officially published 200‐year flow rates or water surface profiles and boundaries, nor defined the boundaries of urban and urbanizing areas.
10/2
6/12
AD
DEN
DU
M 5
- R
FP H
SR 1
1-16
CALIFORNIA HIGH-SPEED TRAIN PROJECT FLOODPLAIN IMPACTS ASSESSMENT AND PROCUREMENT PACKAGE 1 HYDROLOGY & HYRAULICS REPORT
PAGE 14
D R A F T REV 1 – AUGUST 22, 2012
CVFPB CVFPB has mapped a Designated Floodway along the SJR. The reported design flow is reported as a range from 18,000 to 20,000 cfs in the reach from the Gravelly Ford Area to Friant Dam, a length of 40.3 miles. The reported flow rate was categorized as a 100‐year snowmelt flood, adopted on June 11, 1977 (CVFPB 2012). For conservatism, a flow rate of 20,000 cfs was selected from the range for this TM.
Modeled Flow Rates The following flow rates were evaluated for existing flood elevations and incremental flood rise. The design‐build contractor shall review the current state of model development and hydrology for final permits.
200‐year design flow for DWR if available and applicable: Whether the final design flow will be 200‐year or 100‐year is not established at this time, and 200‐year flow rates by DWR were not available.
100‐year design flow based on FEMA FIS: 74,300 cfs.
100‐year design flow based on FEMA HEC‐RAS model: 68,800 cfs.
CVFPB design flow: 20,000 cfs.
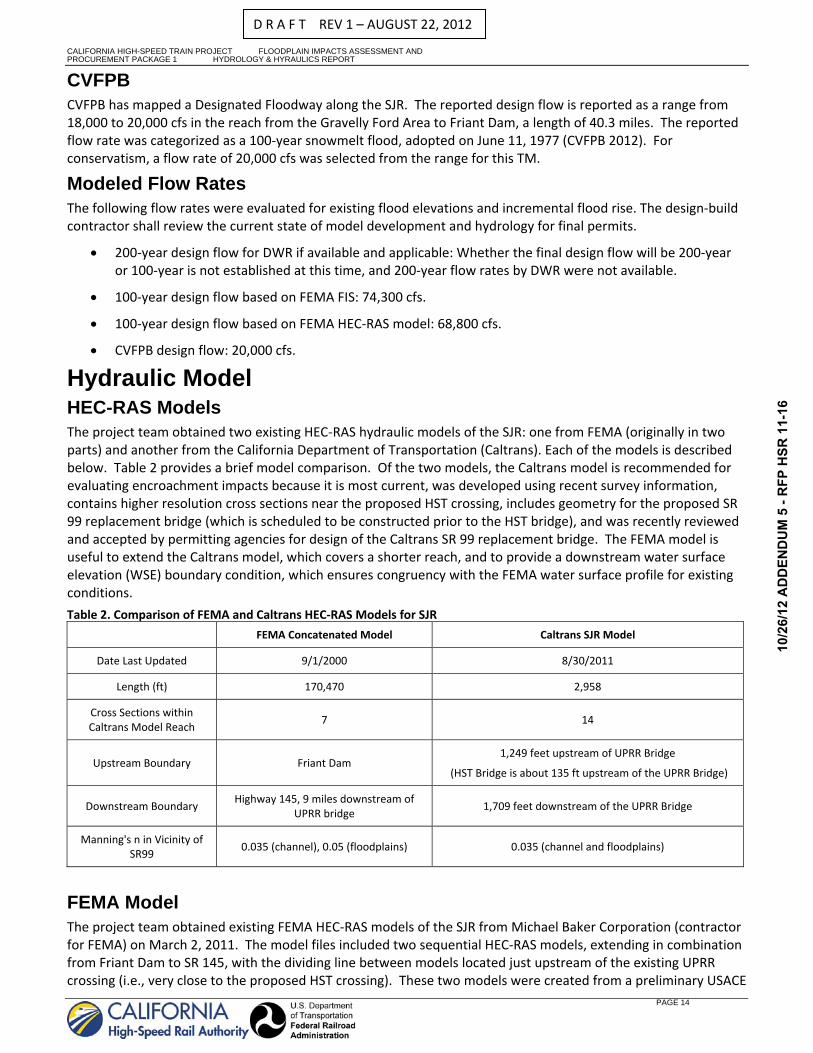
Hydraulic Model HEC-RAS Models The project team obtained two existing HEC‐RAS hydraulic models of the SJR: one from FEMA (originally in two parts) and another from the California Department of Transportation (Caltrans). Each of the models is described below. Table 2 provides a brief model comparison. Of the two models, the Caltrans model is recommended for evaluating encroachment impacts because it is most current, was developed using recent survey information, contains higher resolution cross sections near the proposed HST crossing, includes geometry for the proposed SR 99 replacement bridge (which is scheduled to be constructed prior to the HST bridge), and was recently reviewed and accepted by permitting agencies for design of the Caltrans SR 99 replacement bridge. The FEMA model is useful to extend the Caltrans model, which covers a shorter reach, and to provide a downstream water surface elevation (WSE) boundary condition, which ensures congruency with the FEMA water surface profile for existing conditions.
Table 2. Comparison of FEMA and Caltrans HEC‐RAS Models for SJR
FEMA Concatenated Model Caltrans SJR Model
Date Last Updated 9/1/2000 8/30/2011
Length (ft) 170,470 2,958
Cross Sections within Caltrans Model Reach
7 14
Upstream Boundary Friant Dam 1,249 feet upstream of UPRR Bridge
(HST Bridge is about 135 ft upstream of the UPRR Bridge)
Downstream Boundary Highway 145, 9 miles downstream of
UPRR bridge 1,709 feet downstream of the UPRR Bridge
Manning's n in Vicinity of SR99
0.035 (channel), 0.05 (floodplains) 0.035 (channel and floodplains)
FEMA Model The project team obtained existing FEMA HEC‐RAS models of the SJR from Michael Baker Corporation (contractor for FEMA) on March 2, 2011. The model files included two sequential HEC‐RAS models, extending in combination from Friant Dam to SR 145, with the dividing line between models located just upstream of the existing UPRR crossing (i.e., very close to the proposed HST crossing). These two models were created from a preliminary USACE
10/2
6/12
AD
DEN
DU
M 5
- R
FP H
SR 1
1-16

ERROR! NO TEXT OF SPECIFIED STYLE IN DOCUMENT.
PAGE 15
D R A F T REV 1 – AUGUST 22, 2012
model that extended from Friant Dam to Mendota Pool. The files obtained also included CAD maps and WSE profile graphs used as figures in the FIS.
The two models overlap for one cross section just upstream of the existing UPRR crossing. The separate models each produce the same 100‐year WSE (244.03 feet NGVD 29) at this common cross section because the shared WSE from the downstream model is used as the downstream boundary condition for the upstream model.
Concatenating the two FEMA models into a single model results in essentially no change in the 100‐year WSEs. All WSEs match between the concatenated and separate models except at 21 of the 139 total cross‐sections, for which the concatenated model WSE is up to 0.02‐feet higher.
Since the models were used to generate the FIS profile graphs for Madera (FEMA, 2008) and Fresno counties (FEMA, 2009), there is close agreement between the modeled and graphed 100‐year WSEs, within the margin of error of visual determination. Compensation for the difference between NAVD 88 (graphed) and NGVD 29 (modeled) datums1 is required.
Caltrans Model The project team obtained an existing Caltrans HEC‐RAS model of the SJR and associated Final Hydraulic Report from Caltrans on May 2, 2012. This model was developed to support the Final Hydraulic Report (Caltrans, 2011) for replacement of existing SR‐99 bridges across the SJR with a new 6‐span bridge. The HEC‐RAS model was created using survey data from the project preliminary investigations, and was calibrated to the FEMA Floodway Data and Flood Profile elevations for the project site. Caltrans selected a 100‐year design flow for permitting of 69,000 cfs, presumably by rounding the 68,800 cfs in FEMA’s HEC‐RAS model.
HST Model The Caltrans model was selected to model hydraulic impacts caused by the proposed HST bridge. That model was calibrated to the FEMA model WSEs, so the existing WSE profile is consistent. The Caltrans model was extended upstream by concatenating the upstream portions of the FEMA model. The FEMA model was also used to establish the downstream water surface elevation for each modeled flow condition.
Topographic Information Independent topographic information for the SJR is available from three sources. Topographic maps or digital terrain models (DTMs) are available based on DWR Light Detection and Ranging (LiDAR) data and project aerial survey. In addition, Caltrans’ HEC‐RAS model incorporates Caltrans’ recent cross‐sectional surveys.
California Department of Water Resources LiDAR
The DWR provided LiDAR data for the entire Merced to Fresno alignment on April 27, 2011. This data consists of 510 tiles of post‐processed LiDAR data, in both LAS and ASCII format. Horizontal accuracy is at least 3.5‐feet (95% confidence), and vertical accuracy is at least 0.53‐feet (95% confidence). This data appears to have some sparse bathymetric data (below the SJR water surface). The water level appears to be low at the time of data collection. Figure 5 shows an example of the DWR LiDAR data in the vicinity of the High Speed Train crossing of the SJR.
1 NGVD 29 + 2.43 ft = NAVD 88 (http://www.ngs.noaa.gov/cgi‐bin/VERTCON/vert_con2.prl, at coordinates 36 50 43.07 N, 119 55 45.41 W)
10/2
6/12
AD
DEN
DU
M 5
- R
FP H
SR 1
1-16

CALIFORNIA HIGH-SPEED TRAIN PROJECT FLOODPLAIN IMPACTS ASSESSMENT AND PROCUREMENT PACKAGE 1 HYDROLOGY & HYRAULICS REPORT
PAGE 16
D R A F T REV 1 – AUGUST 22, 2012
Figure 5. Example of California Department of Water Resources LiDAR DTM
Project Aerial Survey
Project aerial survey was collected by Tetra Tech Geomatics Group on February 23, 2011. Two‐foot contours are mapped, as well as spot elevation points and outlines of topographic features. A digital terrain model (DTM) of the surveyed surface accompanies the topographic map. The project aerial survey does not have any information below surfaces, such as bathymetric topography or pier locations beneath the bridge deck. Figure 6 shows an example of the Project Aerial Survey in the vicinity of the HST crossing of the SJR.
10/2
6/12
AD
DEN
DU
M 5
- R
FP H
SR 1
1-16

ERROR! NO TEXT OF SPECIFIED STYLE IN DOCUMENT.
PAGE 17
D R A F T REV 1 – AUGUST 22, 2012
Figure 6. Example of Project Aerial Survey Topography.
Hydraulic Structures Boundary Conditions
Major downstream controls are sufficiently distant to avoid backwater effects at the HST crossing2. There are no immediate upstream controls that would distort normal depth. Local hydraulic structures (bridges) are included in the HEC‐RAS models.
UPRR Bridge
The geometry of the UPRR Bridge was included in both the Caltrans and FEMA HEC‐RAS model and can generally be confirmed through project photographs. UPRR Bridge geometry was confirmed during Caltrans’ survey.
SR 99 Bridge
Caltrans intends to replace the SR 99 Bridge on a timeline that should precede construction of the HST Bridge, and has included the replacement bridge geometry in its HEC‐RAS model. Construction drawings were also obtained from Caltrans to provide verification. The Caltrans proposed bridge geometry was accepted as the relevant condition for modeling “existing” conditions at the proposed HST crossing.
2 The SJR flows unimpeded from Friant Dam to the combined Chowchilla Bypass Bifurcation Structure, located 27.8 miles downstream of the HST crossing. The Chowchilla Bypass Bifurcation Structure consists of the combined Chowchilla Bypass and SJR Control Structures (RM 115.6), each of which have four 20‐foot‐wide gated bays. Up to 12,000 cfs have historically been diverted into the Chowchilla Bypass, but its design‐capacity is 5,500 cfs, and allowable diversions depend on Kings River floodwater entering the SJR downstream (DWR, 2010).
Approximately 11.1 miles downstream of the SJR Control Structure, the SJR (and Fresno Slough) are impounded by Mendota Dam, creating the Mendota Pool. The Mendota Pool is used to receive delivery of water pumped from the Sacramento/San Joaquin delta via the Delta‐Mendota Canal (DMC), and to distribute water through multiple diversions (Revive the San Joaquin, Date Unknown). Typical DMC delivery is 2,500 to 2,800 cfs during the irrigation season. The Mendota Pool is relatively small (3,000 acre‐feet) and has a surface area of approximately 1,200 acres.
10/2
6/12
AD
DEN
DU
M 5
- R
FP H
SR 1
1-16

CALIFORNIA HIGH-SPEED TRAIN PROJECT FLOODPLAIN IMPACTS ASSESSMENT AND PROCUREMENT PACKAGE 1 HYDROLOGY & HYRAULICS REPORT
PAGE 18
D R A F T REV 1 – AUGUST 22, 2012
Validation of Model Geometries Cross Section Geometry
The Caltrans detailed cross sections based on their recent survey were considered the most recent and accurate cross section data available. Comparison to cross sections in the FEMA model and cross sections cut from the DWR DTM and Project DTM showed reasonably good agreement in the vicinity of the HST crossing. Graphic results are shown on Figure 7, after converting to a common datum. More distant cross sections outside of the extents of the Caltrans model showed poorer agreement between the FEMA cross sections and the DWR LiDAR TIN, but the discrepancies were not considered significant enough to alter fundamental hydraulic results. The following modifications were made to the Caltrans model:
1) Left and right overbanks were assigned 2) Manning’s n was changed from 0.035 to 0.055/0.04/0.055, consistent with the FEMA model
Hydraulic Structures
The Caltrans model includes more definition than the FEMA model for the UPRR and SR99 bridges. Only the Caltrans model includes updated structure geometry for the new SR 99 bridge.
10/2
6/12
AD
DEN
DU
M 5
- R
FP H
SR 1
1-16

ERROR! NO TEXT OF SPECIFIED STYLE IN DOCUMENT.
PAGE 19
D R A F T REV 1 – AUGUST 22, 2012
Figure 7. Comparison of FEMA HEC‐RAS Cross Section and Caltrans HEC‐RAS Cross Section Geometry with DWR TIN Topography
200
210
220
230
240
250
260
270
280
290
300
‐500 0 500 1000 1500 2000
Elevation (ft., NAVD88)
X distance (ft), facing downstream
XS 70.25 (AU)
DWR TIN AUFEMA HEC‐RAS Section 70.25 (AU)TT_Survey
200
210
220
230
240
250
260
270
280
‐500 0 500 1000 1500 2000
Elevation (ft., NAVD88)
X distance (ft), facing downstream
XS 70.12 (AT)
DWR TIN AT
FEMA HEC‐RAS Section 70.12 (AT)
TT_Survey
CalTrans HEC‐RAS XS 1716.055
10/2
6/12
AD
DEN
DU
M 5
- R
FP H
SR 1
1-16

CALIFORNIA HIGH-SPEED TRAIN PROJECT FLOODPLAIN IMPACTS ASSESSMENT AND PROCUREMENT PACKAGE 1 HYDROLOGY & HYRAULICS REPORT
PAGE 20
D R A F T REV 1 – AUGUST 22, 2012
Model Uncertainty Like all models, the one dimensional hydraulic model used to support the analyses in this TM has limitations. Those limitations (including assumptions, parameter representations, and modeling algorithms) include approximations and uncertainties that produce a margin of error. The margin of error is smaller when considering relative changes, such as incremental rise, because errors tend to cancel one another. Examples of approximations or uncertainty include the following:
Geometry: The model used for the San Joaquin is a merged product of two existing hydraulic models provided by outside sources. Where possible, the input geometric information has been verified; however there is still uncertainty regarding the geometry, especially the geometry under the surface of the water during the original survey. According to the Caltrans model, there is an 8‐foot rise in thalweg elevation between the HST crossing and the BNSF bridge. While this rise may very well be real, it is large and potentially suspicious and may cause uncertainty in the model hydraulics.
One‐Dimensional Hydraulics: the HST bridge crosses the San Joaquin at an “S”‐shaped bend in the river, where low and high flows may have significantly different channel geometries and flow directions. These complex hydraulics are not fully captured in a 1D model.
Roughness and other Model Parameters: The values of parameters used in the model are based on best engineering practices and judgment, but may not accurately reflect conditions in the field. Small changes in these values may affect model results.
Hydraulic Evaluation Soffit Clearance The HST Model (composite Caltrans and FEMA model) was used to evaluate existing hydraulic conditions and hydraulic impacts caused by the HST bridge encroachment. The peak existing water surface elevations are summarized in Table 3.
Table 3. Existing Design Water Surface Elevation at Crossing
Flow Conditions Water Surface Elevation
(feet, NAVD88)
20,000 cfs (CVFPB 100‐year flood) 235.20
68,800 cfs (FEMA Model 100‐year Flood) 244.67
74,300 cfs (FIS 100‐year Flood) 245.46
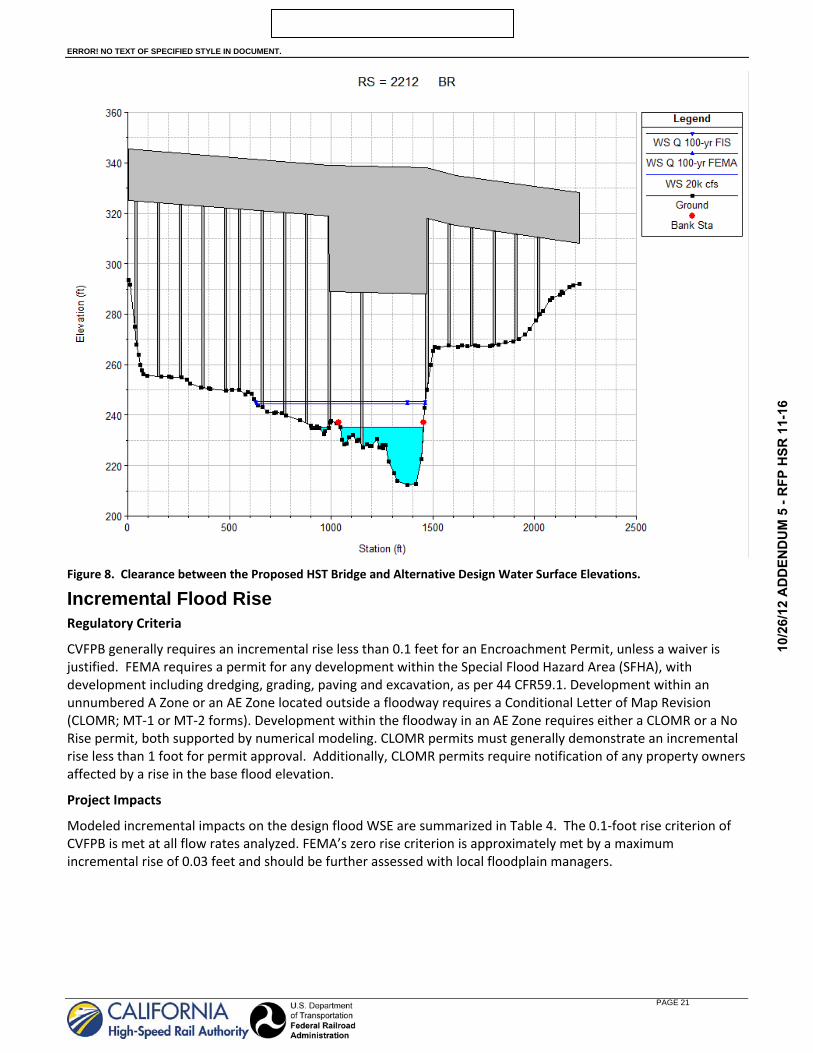
The WSE relative to the bridge soffit are shown in section on Figure 8. It is clear that the required 3 feet of clearance between the WSE and the bridge soffit is greatly exceeded by the elevated structure, which provides approximately 37 feet of clearance above the 200‐year WSE.
10/2
6/12
AD
DEN
DU
M 5
- R
FP H
SR 1
1-16
ERROR! NO TEXT OF SPECIFIED STYLE IN DOCUMENT.
PAGE 21
D R A F T REV 1 – AUGUST 22, 2012
Figure 8. Clearance between the Proposed HST Bridge and Alternative Design Water Surface Elevations.
Incremental Flood Rise Regulatory Criteria
CVFPB generally requires an incremental rise less than 0.1 feet for an Encroachment Permit, unless a waiver is justified. FEMA requires a permit for any development within the Special Flood Hazard Area (SFHA), with development including dredging, grading, paving and excavation, as per 44 CFR59.1. Development within an unnumbered A Zone or an AE Zone located outside a floodway requires a Conditional Letter of Map Revision (CLOMR; MT‐1 or MT‐2 forms). Development within the floodway in an AE Zone requires either a CLOMR or a No Rise permit, both supported by numerical modeling. CLOMR permits must generally demonstrate an incremental rise less than 1 foot for permit approval. Additionally, CLOMR permits require notification of any property owners affected by a rise in the base flood elevation.
Project Impacts
Modeled incremental impacts on the design flood WSE are summarized in Table 4. The 0.1‐foot rise criterion of CVFPB is met at all flow rates analyzed. FEMA’s zero rise criterion is approximately met by a maximum incremental rise of 0.03 feet and should be further assessed with local floodplain managers.
10/2
6/12
AD
DEN
DU
M 5
- R
FP H
SR 1
1-16

CALIFORNIA HIGH-SPEED TRAIN PROJECT FLOODPLAIN IMPACTS ASSESSMENT AND PROCUREMENT PACKAGE 1 HYDROLOGY & HYRAULICS REPORT
PAGE 22
D R A F T REV 1 – AUGUST 22, 2012
Table 4. Incremental Flood Rise Due to Proposed Encroachment
Flow Conditions
Largest Incremental Rise (feet) Distance Upstream
before Zero Rise (feet) Downstream at the Bridge Upstream
20,000 cfs (CVFPB 100‐year flood) 0.00 0.01 0.01 24,000
68,800 cfs (FEMA Model 100‐year Flood) 0.00 0.03 0.03 25,000
74,300 cfs (FIS 100‐year Flood) 0.00 0.03 0.03 26,000
Scour
Channel stability and scour analyses are not included in this TM. The design‐build contractor will be required to include scour analyses for final conditions.
Conclusions The proposed HST bridge will encroach on the CVFPB designated floodway and the FEMA floodway. The final design and hydraulic analyses will be developed by the design‐builder. This TM establishes design flow rates and a hydraulic model that are proposed as suitable for design, and provides initial procurement‐level model results to provide a context for future design improvements. Based on model results, the elevated HST will provide ample freeboard. The current design should also satisfy CVFPB criteria for minimal incremental flood rise. The design produces a negligibly small rise in the FEMA floodway. The design‐builder should coordinate early with local floodplain managers to determine whether the requirements for a zero‐rise permit are met or a CLOMR is required. Hydraulically optimized piers should be considered. A 2‐D Hydraulic model may also better capture the complex angular flows at the bridge site and subtle differences in water surface elevation.
Although the rise appears negligible, local permitting requirements should be confirmed early with local floodplain managers. In light of potentially large costs to increase span length, potentially adverse hydraulic impacts on existing bridges and environmental impacts that could occur with channel modifications, and relatively minor incremental hydraulic impacts from the proposed design configuration, development of a CLOMR may be preferable to alternatives if required by regulators. It is also likely that any additional funds required to meet a zero rise criterion at this location could be better spent on flood‐reduction mitigation at other, more urbanized or constricted locations.
References AECOM and CH2M HILL. 2012. Merced to Fresno Section Project EIR/EIS 15% Design Hydraulics and Floodplain
Technical Report. April 2010.
AECOM and CH2M HILL. 2011. California High‐Speed Train Engineering Report, Procurement Package 1 Proposed Preliminary Design: Floodplain Impacts Assessment and Hydrology and Hydraulics Report. November 2011.
Bureau of Reclamation. 2009. San Joaquin River Restoration Program: Mendota Pool Bypass and Reach 2B Channel Improvements Project Public Scoping Meeting. July 13, 2009. http://www.usbr.gov/newsroom/newsrelease/detail.cfm?RecordID=28941. Accessed February 23, 2012.
California Department of Water Resources (DWR). 2010. State Plan of Flood Control Descriptive Document. November 2010.
California Department of Water Resources (DWR). 2011. 2012 Central Valley Flood Protection Plan. December 2011 (Public Draft).
California Department of Transportation (Caltrans). 2011. Final Hydraulic Report, San Joaquin River Island Park 6‐Lane Project Bridge No. 41 0090, 06 – MAD – 99, EA 0‐g‐442621. August 30, 2011.
10/2
6/12
AD
DEN
DU
M 5
- R
FP H
SR 1
1-16

ERROR! NO TEXT OF SPECIFIED STYLE IN DOCUMENT.
PAGE 23
D R A F T REV 1 – AUGUST 22, 2012
Central Valley Flood Protection Board (CVFPB). 2012. Best Available Map (BAM) interactive maps at http://gis.bam.water.ca.gov/bam/ . June 15, 2012.
Federal Emergency Management Agency. 2008. Flood Insurance Study, Madera County, California and Incorporated Areas. Washington, D.C., September 26.
Federal Emergency Management Agency. 2009. Flood Insurance Study, Fresno County, California and Incorporated Areas. Washington, D.C., February 18.
Jones, Carolyn. 2010. San Joaquin River flowing through dry stretches. San Francisco Chronicle. March 31, 2010.
National Resources Defense Council (NRDC). 2007. NRDC Legislative Facts: San Joaquin River Restoration Settlement Act (H.R. 24 and S. 27: January 2007). January, 2007. http://www.nrdc.org/legislation/factsheets/leg_07010101A.pdf Accessed February 23, 2007.
Revive the San Joaquin. Date Unknown. Mendota Dam, the Delta‐Mendota Canal, and Mendota Pool. Accessed February 23, 2012. http://www.revivethesanjoaquin.org/content/mendota‐dam‐delta‐mendota‐canal‐and‐mendota‐pool
San Joaquin River Restoration Program. 2008. Draft Background Report on Friant Dam Operations. February 7, 2008.
State of California – Department of Transportation (Caltrans). Division of Engineering Services. Structure Design Services. 2011. Final Hydraulic Report: San Joaquin River; Island Park 6‐Lane Project Bridge No. 41 0090 06 – MAD – 99 EA 06‐442621. August 30, 2011.
U. S. Army Corps of Engineers (USACE). 2012a. Workshop to discuss Section 408 screening requirements and jurisdictional crossings. May 22.
U.S. Army Corps of Engineers and California Department of Water Resources (USACE and DWR). 2012. Central Valley Hydrology Study: http://cvhydrology.org/.
U. S. Army Corps of Engineers (USACE). 1959. Standard Operation and Maintenance Manual for the Lower San Joaquin River Levees, Lower San Joaquin River and Tributaries Project, California. Sacramento District. Sacramento, CA. April 1959.
10/2
6/12
AD
DEN
DU
M 5
- R
FP H
SR 1
1-16