PROCESSING OF SOLID SOLUTION, MIXED...
174
PROCESSING OF SOLID SOLUTION, MIXED URANIUM/REFRACTORY METAL CARBIDES FOR ADVANCED SPACE NUCLEAR POWER AND PROPULSION SYSTEMS By TRAVIS WARREN KNIGHT A DISSERTATION PRESENTED TO THE GRADUATE SCHOOL OF THE UNIVERSITY OF FLORIDA IN PARTIAL FULFILLMENT OF THE REQUIREMENTS FOR THE DEGREE OF DOCTOR OF PHILOSOPHY UNIVERSITY OF FLORIDA 2000
Transcript of PROCESSING OF SOLID SOLUTION, MIXED...

PROCESSING OF SOLID SOLUTION, MIXED URANIUM/REFRACTORY METAL CARBIDES FOR ADVANCED SPACE NUCLEAR POWER
AND PROPULSION SYSTEMS
By
TRAVIS WARREN KNIGHT
A DISSERTATION PRESENTED TO THE GRADUATE SCHOOL OF THE UNIVERSITY OF FLORIDA IN PARTIAL FULFILLMENT
OF THE REQUIREMENTS FOR THE DEGREE OF DOCTOR OF PHILOSOPHY
UNIVERSITY OF FLORIDA
2000

This work is dedicated to my parents, Dannis and Frances Knight, for their love, support, and encouragement through the years.

iii
ACKNOWLEDGMENTS
This work was performed in the Ultra-high Temperature Materials Laboratory of the
Innovative Nuclear Space Power and Propulsion Institute (INSPI) at the University of Florida.
Support for this research came from the NASA Marshall Space Flight Center under grant
NAG8-1251 and from the Department of Defense, Ballistic Missile Defense Organization
(formerly SDIO), Innovative Science and Technology Office under contract NAS-26314,
managed by NASA Glenn Research Center through INSPI.
The author wishes to thank Dr. Robert J. Hanrahan Jr. of Los Alamos National
Laboratory for his many valuable insights into material science and laboratory research and
many other contributions and assistance in this study.
Many heartfelt thanks belong to Dr. Samim Anghaie for his kind mentorship and sage
advice. His wisdom and encouragement in matters both academic and professional have been a
true source of inspiration.
A special thanks is owed to the other members of my doctoral committee, Dr. Edward
T. Dugan, Dr. Robert J. Hanrahan, Dr. Michael J. Kaufman, and Dr. William G. Vernetson, for
their advice and comments throughout this research and the preparation of this manuscript.

iv
TABLE OF CONTENTS page
ACKNOWLEDGMENTS ................................................................................................... iii
ABSTRACT......................................................................................................................... vi
INTRODUCTION................................................................................................................1 Motivation and Objective .......................................................................................................1 Application Fundamentals.......................................................................................................3
Nuclear Thermal Propulsion.............................................................................................3 Advanced Terrestrial Reactors .........................................................................................6
Historical Background on Carbide Nuclear Fuel Development ................................................8 Space Power and Propulsion Studies................................................................................8 Advanced Terrestrial Reactor Fuel Studies .....................................................................12
Technical Background on Carbide Fuel Development ...........................................................15 Melting Point and Carbon-to-Metal Ratio.......................................................................16 Processing and Fabrication.............................................................................................19
Processing by extrusion............................................................................................19 Processing by sintering .............................................................................................21 Processing by hot pressing........................................................................................25 Other processing methods........................................................................................26
Fuel Element Fracture ....................................................................................................27 Hot Hydrogen Corrosion and Mass Loss........................................................................28
METHOD...........................................................................................................................34 Preparation and Handling of Powders...................................................................................34
Composition..................................................................................................................34 Uranium Hydride Processing ..........................................................................................38 Mixing and Handling of Powders....................................................................................39
Processing ...........................................................................................................................41 Cold Uniaxial Pressing....................................................................................................41
Uniaxial pressing in a graphite die/susceptor..............................................................42 Uniaxial pressing in stainless steel dies.......................................................................47
Sintering By Induction Heating........................................................................................48 Equipment design and performance...........................................................................48

v
Temperature measurement and control......................................................................53 Testing schedule.......................................................................................................53
Dynamic Magnetic Compaction......................................................................................54 Hot Pressing ..................................................................................................................54
Equipment design and performance...........................................................................54 Equipment redesign..................................................................................................56 Testing schedule.......................................................................................................60
Density Measurements .........................................................................................................60 Melting Point Determination..................................................................................................61
RESULTS ...........................................................................................................................64 Binary Carbides...................................................................................................................64 Ternary Carbides .................................................................................................................68
Density Measurements and Microscopy Results..............................................................68 X-ray Diffraction Results................................................................................................72
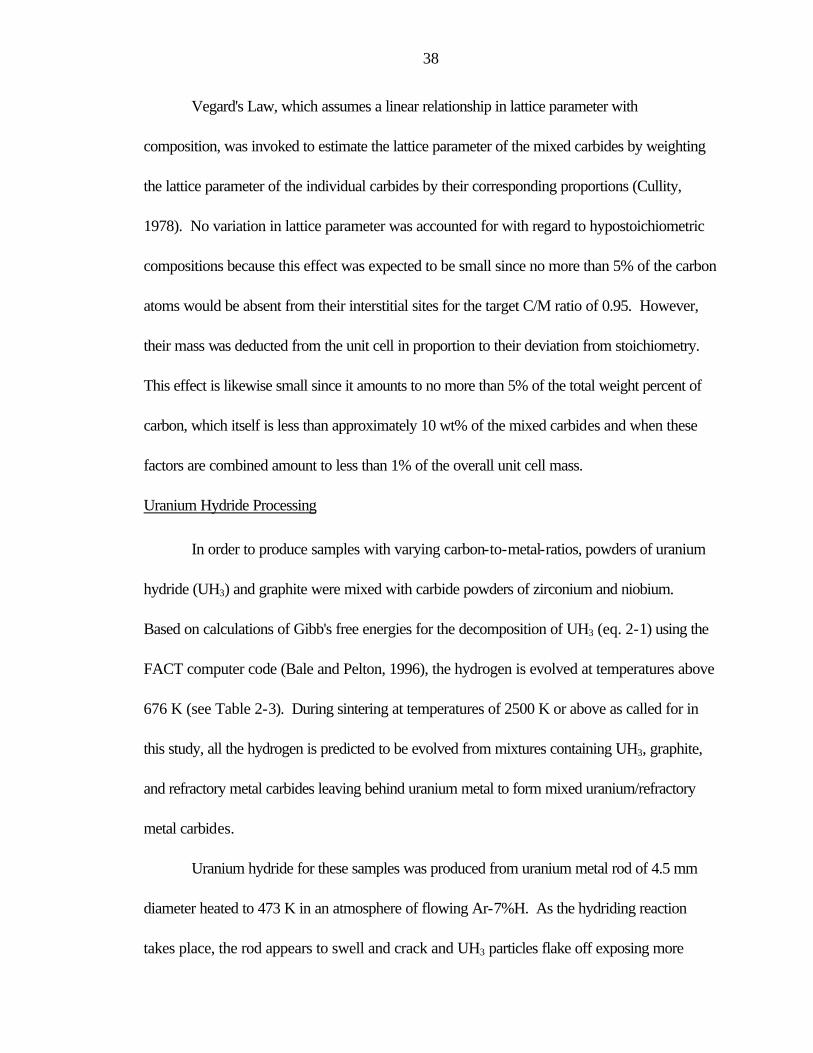
Hot Pressing ........................................................................................................................76
DISCUSSION..................................................................................................................137 Binary Carbides.................................................................................................................137 Ternary Carbides ...............................................................................................................140
Microscopy Results......................................................................................................140 Time and temperature.............................................................................................140 Pre-compaction.....................................................................................................143
Solid Solution Formation and X-ray Diffraction Results.................................................144 Pre-Compaction................................................................................................................155 Hot Pressing ......................................................................................................................155 Suggested Processing Methodology....................................................................................157
CONCLUSIONS AND RECOMMENDATIONS...........................................................159
LIST OF REFERENCES ..................................................................................................162
BIOGRAPHICAL SKETCH.............................................................................................167

vi
Abstract of Dissertation Presented to the Graduate School of the University of Florida in Partial Fulfillment of the Requirements for the Degree of Doctor of Philosophy
PROCESSING OF SOLID SOLUTION, MIXED URANIUM/REFRACTORY
METAL CARBIDES FOR ADVANCED SPACE NUCLEAR POWER AND PROPULSION SYSTEMS
By
Travis Warren Knight
May 2000
Chairman: Samim Anghaie Major Department: Department of Nuclear and Radiological Engineering
Nuclear thermal propulsion (NTP) and space nuclear power are two enabling
technologies for the manned exploration of space and the development of research outposts in
space and on other planets such as Mars. Advanced carbide nuclear fuels have been proposed
for application in space nuclear power and propulsion systems. This study examined the
processing technologies and optimal parameters necessary to fabricate samples of single phase,
solid solution, mixed uranium/refractory metal carbides. In particular, the pseudo-ternary
carbide, UC-ZrC-NbC, system was examined with uranium metal mole fractions of 5% and
10% and corresponding uranium densities of 0.8 to 1.8 gU/cc. Efforts were directed to those
methods that could produce simple geometry fuel elements or wafers such as those used to
fabricate a Square Lattice Honeycomb (SLHC) fuel element and reactor core.

vii
Methods of cold uniaxial pressing, sintering by induction heating, and hot pressing by
self-resistance heating were investigated. Solid solution, high density (low porosity) samples
greater than 95% TD were processed by cold pressing at 150 MPa and sintering above 2600
K for times longer than 90 min. Some impurity oxide phases were noted in some samples
attributed to residual gases in the furnace during processing. Also, some samples noted
secondary phases of carbon and UC2 due to some hyperstoichiometric powder mixtures having
carbon-to-metal ratios greater than one.
In all, 33 mixed carbide samples were processed and analyzed with half bearing
uranium as ternary carbides of UC-ZrC-NbC. Scanning electron microscopy, x-ray diffraction,
and density measurements were used to characterize samples. Samples were processed from
powders of the refractory mono-carbides and UC/UC2 or from powders of uranium hydride
(UH3), graphite, and refractory metal carbides to produce hypostoichiometric mixed carbides.
Samples processed from the constituent carbide powders and sintered at temperatures above
the melting point of UC showed signs of liquid phase sintering and were shown to be largely
solid solutions. Pre-compaction of mixed carbide powders prior to sintering was shown to be
necessary to achieve high densities. Hypostoichiometric, samples processed at 2500 K
exhibited only the initial stage of sintering and solid solution formation. Based on these findings,
a suggested processing methodology is proposed for producing high density, solid solution,
mixed carbide fuels.
Pseudo-binary, refractory carbide samples hot pressed at 3100 K and 6 MPa showed
comparable densities (approximately 85% of the theoretical value) to samples processed by
cold pressing and sintering at temperatures of 2800 K.

1
INTRODUCTION
Motivation and Objective
Because of its high performance potential, nuclear thermal propulsion (NTP) could be
utilized for manned missions and cargo transport to the moon or Mars, unmanned explorations
of the outer planets, and earth orbit transfers of satellites or other space-based assets. The
Rover/NERVA programs, a joint effort between NASA and the Atomic Energy Commission,
ran from 1955 to 1973 during which four major fuel types were tested (Bennett et al., 1994;
Davidson, 1991; Taub, 1975). The last advanced nuclear fuel considered before the program
was cancelled in 1973 was a solid solution, mixed carbide, (U, Zr)C (Lyon, 1973). Other
advanced fuels for terrestrial reactors have been tested including pyrolytic carbon coated
microspheres of UC2 embedded in a graphite matrix, graphite coated spheres, and mixed
carbides such as (U, Pu)C and (U, Th)C2. These advanced fuels have been studied with
particular interest for fast breeder reactor programs because of the higher heavy-metal atom
density in carbides over oxide fuels leading to shorter doubling times. Observed high melting
point, thermochemical stability, and high thermal conductivity of single phase, solid-solution
mixed uranium/refractory metal carbides such as the pseudo-ternary carbide, (U, Zr, Nb)C,
portend their usefulness as an advanced fuel for next generation terrestrial as well as space
reactor design applications. This study was undertaken to develop and optimize processing

2
techniques for producing high density, solid solutions of the mixed carbide, (U, Zr, Nb)C,
containing five to ten mole percent uranium carbide (UC).
Mixed carbide fuels have several advantages over the more widely studied oxide fuels
used in virtually all nuclear reactors today. Perhaps chief among these advantages is their higher
thermal conductivity, which can approach that of metallic uranium. This higher thermal
conductivity lowers the fuel centerline temperature permitting a higher linear heat generation rate
and larger diameter fuel rod which decreases fabrication costs. Savings are also obtained
through reduced emergency cooling requirements due to less thermal energy being stored in the
core at any given time. Mixed carbides have the advantage of increasing the melting point of
UC with melting points for typical compositions greater than 3600 K making them even more
desirable for high temperature applications.
Furthermore, the higher uranium density of carbide fuels permits the design of more
compact reactor cores. While high temperature, compact cores are the domain of space-based
reactors, design studies utilizing mixed carbide fuel for terrestrial reactors have revealed
additional cost savings possible through smaller reactor vessels and containment buildings.
Mixed carbides of uranium and either thorium or plutonium have been investigated as a fuel for
fast breeder reactors enabling shorter doubling times (Matske, 1986). These and additional
issues have been discussed in several monographs on the subject (Matzke, 1986; Holden,
1966).
Despite these many benefits, some concerns regarding carbide fuels include
compatibility issues with coolant and/or cladding materials. Uranium carbide is compatible with
sodium up to 1143 K and with helium at all temperatures. By alloying with refractory metal

3
carbides, the resistance of UC to attack by water can be increased (Holden, 1966). Because
of their improved thermochemical stability in a hot-hydrogen environment over graphite matrix
fuels, mixed carbide fuels have been more widely investigated for potential space nuclear power
and propulsion applications. Their projected endurance at very high temperatures far exceeds
that of fuels previously tested and signifies their potential as a fuel for increased performance
characteristics (i.e. higher specific impulse and/or longer lifetime, etc.). However, insufficient
test data exist to fully evaluate their performance under conditions required for NTP such as
temperature and hot hydrogen environment. Further, previous studies of the (U, Zr, Nb)C
system did not clearly define carbon-to-metal (C/M) ratios. Studies by Carmack (1991) and
Czechowicz et al. (1991) have shown that the C/M ratio greatly affects the melting point and
performance of carbides. Any study attempting to characterize mixed carbide fuels for high
temperature applications must include this determination.
Application Fundamentals
Nuclear Thermal Propulsion
Because of their high temperature, high radiation, and hot hydrogen environment, high
performance space nuclear reactors for power and/or propulsion present a unique and
challenging set of materials engineering requirements. To understand the origin of these
requirements and the motivation for studying mixed carbide fuels, it is instructive to examine the
factors that contribute to nuclear rocket performance. Specific impulse (Isp), also called
specific thrust, is used to measure performance and is defined as thrust divided by propellant
mass flow rate (see Eq. 1).

4
propellant ofweight molecular MWcorereactor of re temperatu T
where
rate flow masspropellant
thrust
==
∝
=
MWT
Isp
(1)
A nuclear thermal rocket operates by the same basic principles as chemical rockets--
namely the expansion of hot gas (propellant) through a rocket nozzle to provide thrust. As
shown in Figure 1-1, the propellant flows through coolant channels of the solid-fuel reactor core
where it is heated to very high temperatures (>3000 K proposed for pseudo-ternary carbides).
To achieve high performance (as measured by Eq. 1), the fuel is required to operate at very high
temperatures. Hydrogen has been used as a propellant during all rocket reactor tests and is
preferred because it has the lowest molecular weight. However, hot hydrogen can react with
the fuel resulting in corrosion and mass loss. Furthermore, mission cost constraints require a
compact, lightweight reactor necessitating high power densities (high neutron flux) with
associated radiation damage and increased susceptibility of the fuel elements to fracture.
High operating temperatures are also desirable for waste heat rejection by space
nuclear power reactors. The energy rejected per unit area by a radiator is proportional to the
fourth power of its temperature as shown in equation 2 (Angelo and Buden, 1985). Further,
because it is desirable to minimize the mass of a space power system due to high launch costs,
the mass and therefore the area of any radiator is at a premium. Higher operating temperatures
possible with mixed uranium/refractory metal carbides allow for greater waste heat rejection per
unit radiator area helping to minimize payload. Of course, to reject heat at these temperatures,
the radiator material must have good performance characteristics at high temperatures.

5
Figure 1-1. Nuclear thermal rocket engine a) drawing showing propellant flow (after Koenig, 1986) b) photograph of nuclear rocket engines tested in the Rover/NERVA programs
b.
a)

6
However, their study is outside the scope of this work, which was focused on the development
of the high temperature nuclear fuels alone.
(K) corereactor of re temperatu TKm W8-5.67E constant,Boltzman -Stefan
radiator theof emissivity
where,T
4-2-
4
=⋅⋅=
=
=
σ
ε
σεE
(2)
Therefore, mixed carbides make possible smaller payloads reducing launch costs in
several ways. Higher melting points lead to smaller radiators and associated hardware
necessary for space power generation. Compact reactor cores for power and/or propulsion
are made possible through higher thermal conductivity and higher heavy-metal atom density. To
achieve these goals, their performance must be qualified against all the deleterious effects
concomitant with high performance--namely high temperature, high neutron flux, and hot
hydrogen environment.
Advanced Terrestrial Reactors
Carbide fuels have a number of advantages over oxide-based fuels for fast breeder
reactor applications by increasing breeding ratios and shortening doubling times. Higher
breeding ratios, the amount of fissile fuel produced over the amount destroyed, leads to higher
fissile material gains (Fgain) per cycle. Equation 3 shows the relationship of reactor doubling time
(RDT), the time it takes to produce enough fissile material to fuel an additional reactor, to Fgain
and FBOC, the amount of fuel at the beginning of a cycle or fissile inventory. The higher thermal

7
conductivity of carbides allows for higher linear heat generation rates (LHGR) for more
compact cores and decreased fissile inventory (FBOC) leading to shorter RDT (see Equation 3).
=
yearcyclefuel
gain
BOC
F
FRDT
(3)
From a safety perspective, high thermal conductivity also decreases the thermal energy
stored in the fuel that must be contended with in an accident/transient scenario. This reduces the
emergency core cooling requirements and therefore the cost of such systems. Also, the higher
thermal conductivity permits larger diameter fuel pins which are not only less expensive to
fabricate but result in fewer number of pins and therefore less associated cladding and
hardware. This leads to a decrease in parasitic captures (increase in Fgain). Similarly, higher
heavy-metal atom densities and higher metal to non-metal atom ratios also serve to increase
Fgain. Having proportionately more fuel in the core also serves to harden the spectrum
increasing the number of neutrons released in fission per neutron absorbed in fissile material (η)
and therefore Fgain (Harry, 1983; Matzke, 1986).
Advantages of carbide fuels for other advanced reactor types derive mainly from the
benefits of higher thermal conductivity and higher heavy-metal atom densities through higher
burnup, higher LHGR, lower fissile inventories (smaller cores) and therefore decreased costs.

8
Historical Background on Carbide Nuclear Fuel Development
Space Power and Propulsion Studies
The processing and testing of solid solution, mixed uranium/refractory metal carbide
fuels have been conducted in both the U.S. and former Soviet Union (also later in Russia) with
particular interest for their application to space nuclear power and propulsion. Solid solution,
pseudo-binary carbides--namely (U, Zr)C--were the last in a series of fuel designs investigated
during the Rover/NERVA (nuclear engine for rocket vehicle applications) programs. It was
demonstrated that the solid solution uranium-zirconium carbide fuel elements have the potential
for higher service temperatures than any other candidate fuel types.
The Rover/NERVA programs, a joint effort between NASA and the Atomic Energy
Commission, ran from 1955 to 1973 during which four major fuel types were tested as depicted
in Figure 1-2. These fuel types were: 1) UC2 particles dispersed in graphite 2) UO2 and
eventually UC2 particles with a pyrolytic-carbon (PyC) coating dispersed in a graphite matrix,
3) A composite of graphite/(U, Zr) C with the carbide forming a continuous webbed structure,
and 4) Solid-solution (U, Zr) C. All fuel elements except the solid solution carbide type had a
protective zirconium carbide coating. The latter two fuel types were tested in the Nuclear
Furnace 1 (NF-1) Test Reactor at Jackass Flats, Nevada in 1972 (Lyon, 1973). Further large
scale, in-core testing of fuel elements was cancelled in 1973 with the termination of the
Rover/NERVA program. Despite being judged a technical success, the program was cancelled
due to changing national priorities (Angelo and Buden, 1985).

9
Figure 1-2. Microstructure of various NERVA fuels (after Matthews et al., 1991).
Because of the limited number of solid-solution carbide fuel elements tested (28 fuel
elements in two reactor cells), its usefulness as a fuel for nuclear thermal propulsion (NTP)
could not be fully evaluated. However, depending on the required operational lifetime, the solid
solution carbides are expected to operate for short periods with propellant exit temperatures as

10
high as 3200 K and many hours at lower temperatures (2600 – 3000 K) as shown in Figure 1-
3 (Lyon, 1973; Koenig, 1986). More recently, studies and modeling by Storms (1992) have
shown that mass loss due to vaporization will dominate. This was shown to be the life limiting
phenomenon near the reactor core's exit where surface temperatures exceed 2900 K. Based
on the thermochemical analysis of vaporization behavior of the Zr-U-C and Nb-U-C systems,
Butt et al. (1993) fit the predicted mass loss rates with the following two equations as a function
of fuel temperature (see Equations 4a and 4b).
1993) al.,et (Butt 310x295.4313.18)(R log ,),( 11015.085.0 TCUNb −+−= (4a)
1993) al.,et (Butt 310x97.3882.16)(R log ,),( 2101.09.0 TCUZr −+−= (4b)
Figure 1-3. Performance of NERVA tested nuclear fuels and expected performance of carbide fuels at the conclusion of the Rover/NERVA programs (after Koenig, 1986). Curves A and B are also included as more recent estimates of pseudo-binary carbide fuel performance calculated based on modeling from Butt et al. (1993).
11
From equations 4a and 4b, the projected endurance of these pseudo-binary carbide
fuels can be calculated. Curves A and B in Figure 1-3 were calculated based on the fuel
geometry of the solid solution, all-carbide fuel elements used in the NF-1 experiments (see
Figure 1-4) and assuming an arbitrary limit of 10% mass loss for the core. It should be pointed
out that the estimates calculated in this manner are conservative since they assume a uniform
maximum operating temperature and hence a uniform mass loss rate for the entire core. In
reality, the peak temperature will occur near the exit of the core where the mass loss rates by
vaporization will be greatest.
With the interest generated as a result of the Space Exploration Initiative (SEI), other
studies of mixed carbides were reported in the early 1990s. Experimental work reported by
Czechowicz et al. (1991) examined the pseudo-binary, UC-ZrC, system. Storms (1992)
contributed a great amount of work on the properties of refractory carbides and more recently
reported on some thermochemical modeling of mass loss from (U, Zr)C fuels in flowing hot
hydrogen. Carmack (1991) investigated the processing of refractory monocarbides and mixed
carbides of Ta, Hf, and U and also reported on the melting points of some monocarbides.
Wang et al. (1994) produced samples of (U, Zr)C using a self-propagating high-temperature
synthesis method.
From 1993 to 1997, a collaborative effort was established between the Innovative
Nuclear Space Power and Propulsion Institute (INSPI) at the University of Florida and the
Russian Scientific Research Institute, LUTCH. The goal of this collaboration was to verify
Russian data and research on pseudo-ternary carbide nuclear fuels for NTP, which were
carried out in the former Soviet Union between 1978 and 1988. Testing in that period reported

12
hydrogen exit-gas temperatures of 2800-3300 K with power densities as high as 20 MW/liter
and uranium mass loss estimates as low as 0.5 to 1.0 % (based on reactivity loss
measurements). However, vital information on the post-test condition of fuel elements was
lacking since no post-test analysis was conducted. Collaborative efforts between INSPI and
LUTCH were aimed at verifying these results and conducting post-test analysis of the fuel
(D'yakov and Tishchenko, 1994; Diaz, 1994; Knight, 1999).
Advanced Terrestrial Reactor Fuel Studies
A number of advanced nuclear fuel studies have been conducted using carbide-based
fuels with most efforts directed toward fast breeder reactor programs (see Table 1-1). Mixed
carbide nuclear fuels of (U0.3,Pu0.7)C have been used in the Indian Fast Breeder Test Reactor
(FBTR) operated from 1985 to the present. The higher plutonium content was chosen because
natural uranium could be used. For these higher plutonium contents, the carbide fuel is not only
advantageous for the above reasons but is necessary because early investigations showed that
(U0.24, Pu0.76)O2 is not compatible with the sodium coolant (Ganguly et al., 1986). Experiments
conducted by Los Alamos National Laboratory in the Experimental Breeder Reactor II (EBR
II) used test assemblies with (U0.76, Pu0.24)C. Helium-bonded test assemblies achieved peak
burnups as high as 20.7 at% (192 MWd/kg) without failure. Sodium-bonded fuel pins achieved
peak burnups of 15.8 at% (146 MWd/kg) before failure. Both sodium and helium-bonded,
peak burnup fuel pins had 316 stainless steel cladding (Harry, 1983; Herbst and Matthews,
1982).
Other potential applications of carbide fuels that have been investigated include
applications in high temperature gas-cooled reactors (HTGR) and in pebble-bed reactors

13
Table 1-1. Experience with advanced carbide nuclear fuels for terrestrial reactors.
Reactor/ Study
Country Oper- ation
Fuel Comments Reference
WR-1 (Whiteshell Reactor)
Manitoba, Canada
1965 to 1985
Cast enriched UC slugs, Zr alloy sheath
Organically cooled, heavy-water moderated; 60 MWt; 10 MWd/kg; few defects noted in fuel
(Matzke, 1986)
Dragon UK 1966 to 1973
(U, Th)C2 HTGR; 100 MWd/kg (Matzke, 1986; Lung, 1996)
Peach Bottom Atomic Power Station
US 1967 to 1974
(U, Th)C2 HTGR; 40 MWe (El-Wakil, 1982; Agnew, 1981; Matzke, 1986)
AVR Jülich, Germany
1967 to 1980s
20% enriched UC2 graphite coated; ThC2 (fertile)
Pebble-bed reactor; 13 MWe; He cooled, T=1223 K; 100 MWd/kg
(El-Wakil, 1982; Agnew, 1981; Matzke, 1986; Lung, 1996)
BR-10 USSR 1973 carbide FBR; 5 at% burnup; switched to non-carbide fuel
(Matzke, 1986)
Fort St. Vrain
US 1979 to 1989
UC2, Th2, coated microspheres in graphite matrix
HTGR; 330 MWe; predicted 100 MWd/kg before shutdown in 1989
(El-Wakil, 1982; Agnew, 1981; Matzke, 1986)
FBTR Kalpakkam, India
1985 to present
(U0.3, Pu0.7)C FBR; 42.5 MWt, 12.5 MWe
(Matzke, 1986)
EBRII test fuel assemblies
US 1974 to 1980s
(U0.24, Pu0.76)C Advanced LMFBR study; 192 MWd/kg achieved; 120 MWd/kg, 100 kW/m, d=9.4mm
(Herbst and Matthews, 1982; Harry, 1983)

14
Figure 1-4: Various designs of nuclear fuel elements. a) Rover/NERVA NF-1 carbide/graphite composite fuel element (Lyon, 1973) b) Rover/NERVA, NF-1 carbide fuel element (Lyon, 1973) c) Russian twisted ribbon carbide fuel element (D'yakov and Tishchenko, 1994) d) Square-lattice Honeycomb fuel wafers, grid assembly, shroud, and reactor core (Furman, 1999; Widargo, 1999)

15
(PBR). An example of the latter reactor type was the German Arbeitsgemeinschaft
Versuchsreaktor (AVR) that operated from 1967 to the 1980s. This reactor operated using
spherical graphite fuel pellets 2.36 in. in diameter with a center containing 3.5 g of 20% enriched
UC and graphite (El-Wakil, 1982). Burnups as high as 100 MWd/kg were achieved. Fuel
rods made of 600 µm diameter microspheres embedded in graphite were used in HTGRs such
as Peach Bottom and Fort St. Vrain. These microspheres had a UC2 or (U, Th)C2 nuclear fuel
center ~200um in diameter. Surrounding the fuel is a buffer layer of carbon to limit swelling by
accommodating fission gasses (El-Wakil, 1982; Kneif, 1992). A layer of pyrolytic graphite was
used to help contain the migration of fission products while a silicon carbide layer provides
strength. A final PyC layer protects the more brittle SiC coating (Agnew, 1981; Kneif, 1992).
The "amoeba effect", a problem noted in coated fuel particles, occurs when the centerline
temperature of the particle exceeds 1873 K. The result is a migration of the central carbide fuel
particle in the direction of the temperature gradient breaching the coating that provides the
fission product barrier (Matzke, 1985). An average fuel burnup of 100 MWd/kg was expected
for the Fort St. Vrain reactor before it was shutdown in 1989 due to economic factors (El-
Wakil, 1982; PSCC, 1995).
Technical Background on Carbide Fuel Development
Several studies are discussed in the following sections that illustrate four major factors to
be considered in the development of carbide nuclear fuels. These factors include: 1) controlling
microstructure and carbon-to-metal (C/M) ratio to prevent the formation of a second phase, 2)
difficulties associated with fabricating carbide fuel elements, 3) fracture problems during

16
operation, and 4) corrosion by the hot hydrogen propellant. Each of these factors is discussed
below as they relate to the development of pseudo-ternary carbide nuclear fuels.
Melting Point and Carbon-to-Metal Ratio
The highest melting point for the monocarbides of U, Zr, Nb, Ta, and W occurs for
congruent melting in the single phase, solid solution region of these nonstoichiometric
intermediate phases with C/M typically between 0.75 and 1.0. The congruent melting points of
several refractory monocarbides are listed below in Table 1-2 along with their corresponding
carbon-to-metal ratio (C/M). Similarly, the single phase, solid solution regions for pseudo-
binary and pseudo-ternary carbides lie within a narrow range of C/M values less than one. The
C/M ratio had to be carefully adjusted in the Rover/NERVA, NF-1 test program to prevent the
formation of a second phase, carbon, which drastically lowers the melting point. A C/M ratio of
0.88 to 0.95 was targeted for NF-1, (U, Zr)C fuel elements for a proposed maximum operating
temperature of 3200 K (Lyon, 1973). Outside the range of C/M for single phase, solid
solutions, these carbides experience eutectic melting at far lower temperatures (Butt et al.,
1993). However, it is desirable to produce fuel in the upper range of the C/M ratio due to the
high initial carbon mass losses during operation (Butt et al., 1993). More regarding carbon
mass loss will be discussed in later sections.
Along with other mixed refractory carbides, Tosdale (1967) also investigated the
pseudo-binary (U, Zr)C and the pseudo-ternary, (U, Zr, Nb)C. This study reported improved
oxidation resistance and higher melting points for ternary carbide mixtures with UC than for
binary carbide mixtures of NbC or ZrC with an equal amount of UC. For low uranium content
fuels (0.05 to 0.1 U/M), a maximum in the solidus temperature was observed to fall between a

17
zirconium to refractory metal ratio of 0.65 to 0.85. Unfortunately, no C/M determination was
reported for samples in this study. However, studies of stoichiometric (U, Zr)C by Czechowicz
et al. (1991) revealed the development of a second phase, carbon, in equilibrium with the solid-
solution (U, Zr)C. The melting temperature of the supposed single-phase, solid solution (U,
Zr)C from Tosdale (1967) is 100 K to 700 K higher (depending on the uranium content) than
for eutectic compositions, (U, Zr)Cx + C (Czechowicz et al., 1991). Figure 1-5 compares the
solidus temperatures for solid solution (U, Zr)C and eutectic (U, Zr)Cx+C. Butt et al. (1993)
noted that the addition of 10 at% uranium can be expected to lower the melting point by 200 to
500 K depending on C/M (Butt et al., 1993).
Table 1-2. Important Data on Some Refractory Carbides.
Binary alloy Melting point, (C/M Ratio)† Lattice Parameter (nm)‡
NbC 3873 K ± 25 K, (0.79) 0.4469
TaC 4258 K, (0.89) 0.4454
UC 2803 K, (1.00) 0.49605*
WC 3058 K (0.61) 0.422**
ZrC 3813 K, (0.87) 0.4697
†(Massalski, 1986), ‡(Weimer, 1997), *(Matthews et al., 1994), **(Storms, 1967)
Studies by Accary et al. produced uranium monocarbide by the decomposition of UH3
mixed with graphite. This study noted the very small size and flake-like shape of UH3 particles.
Samples produced from these powders achieved high densities following sintering but showed

18
more dependence on cold pressing pressure than spherical uranium metal particles produced
from the calcium reduction of UO2 (Accary and Caillat, 1961). Uranium metal hydride can be
produced relatively easily from uranium metal using a glove box. The annealed metal with a
clean surface is heated to between 423 to 473 K in a glove box under an atmosphere of Ar-
7%H. The hydride (UH3) will form on the surface producing small flakes that fall off exposing
more uranium metal to continue the reaction. The resultant UH3 powder can then be used as a
feed material for processing mixed carbides and controlling the C/M ratio to produce
hypostoichiometric mixed carbides.
Figure 1-5. Comparison of solidus curves for solid solution (U, Zr)C and eutectic (U, Zr)CX+C (after Czechowicz et al., 1991).
19
Processing and Fabrication
Processing by extrusion
In reporting on the production of UC, Accary and Caillat (1961) briefly touch on some
of the benefits of the extrusion process when using a mixture of uranium and graphite powders.
In general, the reaction is fairly complete owing likely to the high pressure and resultant
deformation of particles during extrusion. This provides an intimate contact between the various
particles and a disruption of the oxide layer on uranium particles, which promotes the
carburization process. However, complete densification was not achieved via extrusion.
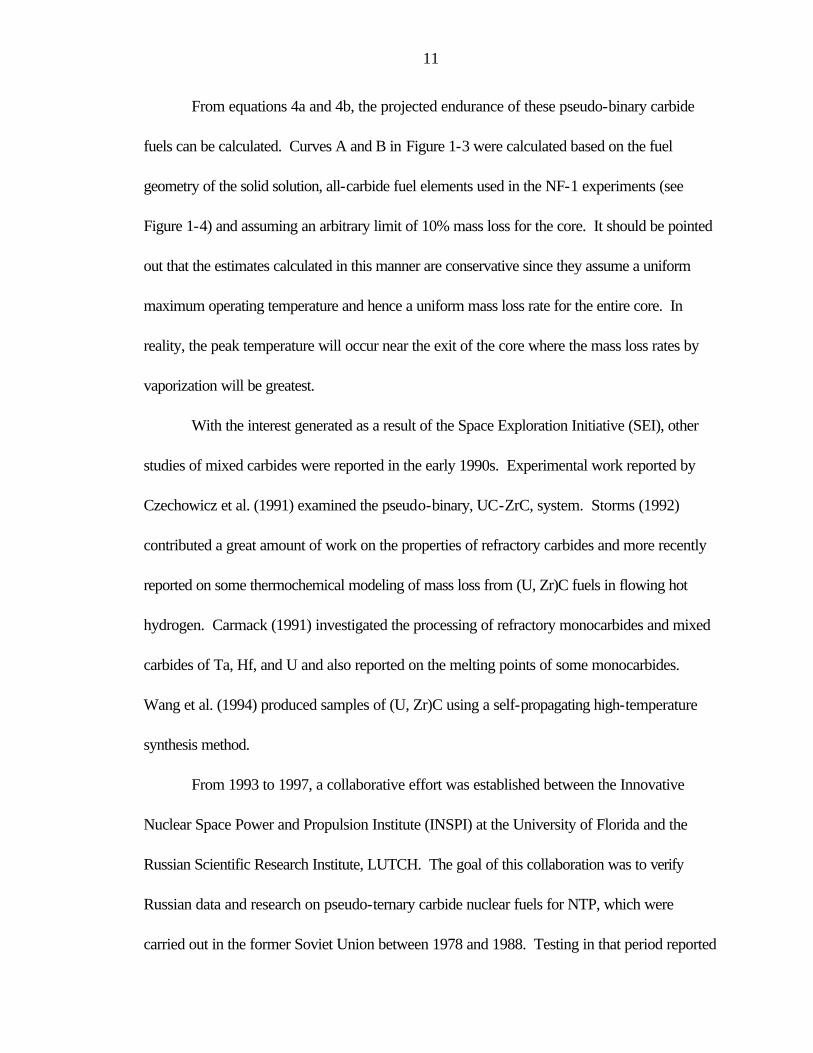
Fabrication of solid solution (U, Zr)C fuel elements for the Rover/NERVA program
was accomplished in several steps beginning with the extrusion of a mixture of ZrC, UO2, ZrO2,
graphite flour, and a binder, Varcum 8251®. A long heat treatment process followed as shown
in Table 1-3. The free carbon remaining was removed by leaching with flowing hot hydrogen at
2200 to 2300 K for 40 to 60 hours. Fuel elements were then impregnated with zirconium to
varying degrees with overall mass gains of (0%, 3%, or 8%) using a chemical vapor deposition
process at ~1900 K to produce carbide fuel elements that were hypostoichiometric in carbon.
A final heat treatment of two hours at 2800 K was applied to hypostoichiometric fuel elements.
A lack of graphite in the mixture made it difficult to extrude these elements and
produced severe wear on the dies (Lyon, 1973). The 19 mm wide, hexagonal Rover/NERVA
fuel element with its 19 coolant channels (2.3 mm diameter) could not be fabricated due to these
difficulties. Instead, the carbide elements had to be manufactured in a cylindrical form with a
single 3.2 mm diameter coolant channel and machined to a hexagonal geometry 5.5 mm wide

20
and 0.64 m long (see Figure 1-4). These combined processing steps produced fuel elements
with porosities of 18 to 23% and C/M ratios of 0.95 to 0.98.
Table 1-3. Heat treatment procedure of Rover/NERVA fuel elements.
Length of Time Temperature Range Comment
60 hours 325-385 K Electrically heated circulated-air ovens
10 hours 385 - 405 K
15-20 hours 405 - 525 K Decomposition of binder
54 hours 1125 K ~10 torr argon flush
2.5 hours Heat up to 1875 K Moved to vertical induction furnaces, argon atmosphere
3 hours 1875 - 2625 K Carbothermic reduction of UO2 and ZrO2
0.5 hour Hold at 2625 K
3 hours Heat up and hold 2625 K
3.5 hours Hold at 2625 K Complete sold solution formation below UC2+C eutectic ~2725 K
2 hours Increase and hold between 2775 - 2875 K
Fabrication details of the Russian fuel elements are not reported, although it is generally
accepted that this is accomplished via an extrusion process. The geometry of the fuel elements
is different than that used in the US taking on the form of a “twisted ribbon” with individual pins
2 mm thick, 4 mm wide, and 35-100 mm long. Twisted ribbons are bundled together to form
fuel elements and stacked vertically to form a fuel assembly (D'yakov and Tishchenko, 1994).

21
Because of their segmented lengths, axial variation in enrichment of the fuel assembly is possible.
Russian cores also incorporate an axial reflector or "after-burner" region, which allows for the
use of reduced uranium content of the pseudo-ternary carbides (uranium density of ~0.8 g/cc).
A low uranium content is desired not only for higher melting temperatures as shown above but
also for improved thermochemical stability in the hot hydrogen environment encountered in NTP
systems (D'yakov and Tishchenko, 1994).
Processing by sintering
Processing of mixed carbides by sintering can follow many different routes with options
that include sintering with a chemical reaction, pre-sinter compaction, etc. For example, mixed
carbide powders can be compressed prior to sintering to increase the initial density by cold
pressing with a punch and die, by pulsed magnetic compaction, or some other method. Also,
the starting material can be varied from the constituent carbide powders (sintering without a
chemical reaction) to powder mixtures selected for a particular chemical reaction (reaction
sintering) to produce mixed carbides. Some examples include the carbothermic reduction of the
mixed metal oxides with graphite or carburization of metal powders either directly or metal
powders produced from the decomposition of their hydride form. For sufficiently exothermic
reactions, a self-propagating, high-temperature synthesis method is possible that very rapidly
consumes the reactive starting material. In some cases, the resultant material may not be
acceptable due to porosity or impurities and a comminution step is required grinding the initial
carbide clinker forming the carbide powders for further processing and fabrication steps.
Storms (1967) noted that the production of hypostoichiometric carbides from the carbothermic

22
reduction of the oxide with graphite leads to unacceptable oxygen content. A high vacuum
anneal should be applied to carbides produced in this method.
The procedure used by Carmack (1991) for producing mixed carbide samples
consisted of cold pressing at 55 MPa the refractory metal carbide and hydride powders with
UO2 powder and a binder. Metal hydride powders were added to produce samples that were
hypostoichiometric in carbon. Samples were then sintered in a vacuum resistance furnace with
tungsten elements following a program that first took the samples to 573 K to allow the binder
to vaporize. Next, the furnace was incrementally raised to 1773 K for one hour to allow the
hydrogen gas evolved from the metal hydrides to escape. Finally, the samples were raised to
2573 K at the rate of 100 K/hr and held for one to two hours for sintering. As a binder to
provide green strength for the pressed samples prior to sintering, Carmack used 3.0 wt%
polyethylene oxide and 1.5 wt% oleic acid dissolved in alcohol. Earlier attempts to use 1.0
wt% stearic acid did not provide adequate green strength for the pressed samples.
A comparison of the various processing parameters associated with sintering was made
by Accary and Caillat (1961) for the reaction sintering of uranium and graphite powders to
produce UC. An evaluation of cold pressing pressure revealed a critical value between 200
and 350 MPa above which there was no benefit or an actual lowering of the compact's final
density following sintering. Near full density could be achieved without any cold pressing by
sintering in a vacuum furnace above 1473 K which is greater than the melting point of uranium.
The heatup rate was found to be important with high heating rates causing the reaction to
proceed too rapidly producing a more porous material. Variation of both sintering time and
temperature saw little difference in final density. However, longer sintering times and higher

23
temperatures resulted in a more complete reaction of the starting materials as measured by the
percentage of carbon reacted.
Mixed uranium/plutonium carbide fuel elements were produced for the Advanced Fuels
Program for fast breeder reactors (Gutierrez and Herbst, 1980). These fuel types included
single phase (U0.8, Pu0.2)C fabricated at 87% TD and two-phase (U, Pu)C+10 vol% (U,
Pu)2C3 fabricated at 98%, 87%, and 81% of TD. A vacuum carbothermic reduction process
with UO2, PuO2, and C (graphite) followed by grinding, cold pressing at approximately 70 to
200 MPa and sintering between 1723 and 2073 K for times up to nine hours depending on the
desired density. For the high density (98% TD), two-phase carbide, a sintering aid, nickel, was
added to shorten the sintering period. To process the single phase (U, Pu)C, an additional step
had to be added to remove excess carbon. Following grinding, the carbide powders were
subjected to a hydrogen treatment at 1173 K reacting with excess carbon to form methane,
CH4, gas. The subsequent carbide powders are very reactive and had to be guarded against
exposure to oxygen or moisture in concentrations greater than 10 ppm.
Dynamic magnetic compaction (DMC) was developed as an alternative to conventional
powder metallurgy (PM) for producing full-density, net-shape parts (Chelluri and Barber,
1999). The DMC process involves filling an electrically conductive container referred to as the
armature with the powders to be consolidated. A central spindle (die) can be placed in the
center of the armature prior to filling to give internal features to the part as the powders are
pressed against the die. The armature containing the powders is placed in a high-field
electromagnetic coil to which a high current pulse is applied. A magnetic field is produced in the
coil which induces currents in the armature. These opposite currents create magnetic forces that

24
repel each other and press the armature into the powder with a large force providing the
compaction (see Figure 1-6). The entire process occurs in less than a millisecond. Full-density,
net-shape powder consolidation has been reported using this method with various metal
powders. High green strengths are achieved and can eliminate or reduce the sintering time
required for material processing (Chelluri and Barber, 1999).
Figure 1-6. Illustration of the dynamic magnetic compaction process.
Wang et al. (1994) produced samples of (U, Zr)C using a self-propagating, high-
temperature synthesis (SHS) method. A form of reaction sintering, the SHS method was used
to produce solid solution (U, Zr)C from powders of U, UC2, Zr, and graphite. The exothermic
nature of the reaction leads to a combustion wave consuming the reactants. Wang et al.
observed the onset of the reaction was observed to occur near the melting point of uranium with
the liquid providing for higher diffusion rates thus fueling higher reaction rates.
1. Insert Sample
2. Pulse Coil (high current)
3. Remove compacted sample

25
Wang et al. (1994) also found the initial heating rate of the reactants to be important.
Lower heat up rates provide greater time for solid state reactions forming intermediate products
that act as a diffusion barrier for the reactants. This reduces the driving force and delays or
prevents the onset of the combustion reaction. This method has the advantage of a high reaction
rate and a lower energy requirement for sintering since the heat of the reaction is used to drive
the further combustion of the reactants. A possible drawback includes the relatively porous
nature of the final product especially for very high reaction rates (Haggerty, 1991). This porous
nature was shown in the study of (U, Zr)C by Wang et al.(1994). Further, incomplete reactions
were noted with samples formed from initial reactants involving UC2 instead of uranium metal
because of its higher melting point.
Processing by hot pressing
Hot pressing has some advantages over sintering alone without applied pressure. Hot
pressing is typically conducted at temperatures of approximately half the melting point of the
material, which is less than for sintering operations which are usually performed at three-fourths
the melting point. Also reduced is the time at which this temperature is maintained because of
the accelerated nature of sintering due to the simultaneous application of pressure and high
temperature. The application of pressure allows for more contact between particles through
rearrangement and through increased stress or on particles at their contact area, which is where
sintering occurs and increases the energy available for sintering. These factors of lower
processing temperature and shorter times serves to reduce grain growth and usually leading to
greater compact strength (Richerson, 1992).

26
Fischer (1964) investigated hot pressing of mixed carbides of (Ta0.8, Hf0.2)C and (Ta0.8,
Zr0.2)C. Hot pressing pressures between 7 and 50 MPa and temperatures of 2200 to 3000 K
were investigated. Heating of the graphite die and sample was accomplished using a 50 kW,
9.6 kHz electromagnetic induction furnace with a coil diameter of 19 cm (7.5 in.). Full density
was achieved for (Ta0.8, Hf0.2)C after 15 minutes at 48 MPa and 2800 K. Similarly, 96% TD
for (Ta0.8, Zr0.2)C was achieved after 15 minutes at 41 MPa and 2800 K. The inability to
achieve 100% TD with (Ta0.8, Zr0.2)C was attributed to the starting material's larger particle size
of 2.8 µm, nearly twice the size of (Ta0.8, Hf0.2)C particles.
Accary and Caillat (1961) produced UC at nearly 98% TD by hot pressing uranium
and graphite powders. Pressures between 25-30 MPa were used with a double punch floating
graphite die, while a molybdenum cylinder placed over the graphite die was used to contain the
lateral pressure on the die. A minimum sintering temperature of 1123 K was noted to produce
samples that had some mechanical strength. These lower processing temperatures would be
expected for UC than for the mixed refractory carbides studied by Fischer (1964) due to the
much lower melting point of UC (~2800 K) vs. the greater than 4100 K melting point of the
aforementioned mixed refractory carbides.
Other processing methods
Other techniques have been applied to the processing and fabrication of carbide fuels.
For example, various methods involving freeze drying, sol-gel techniques, or uranium loaded
resins in a fluidized-bed furnace have been used to produce carbide microspheres (Matthews et
al., 1994; Stinton et al., 1979; Zaitzev, 1994). Such microspheres are or were used in particle
bed or dispersed fuel designs such as the graphite matrix fuel rods for HTGRs and early fuel

27
elements for the Rover/NERVA programs or refractory-metal matrix fuels such as the cermet
(U, Zr)CN-W. However, these particle fuel techniques were not pursued since they do not
conform to the solid solution, all-carbide fuel forms previously investigated for NTP reactors
and proposed by this work.
Fuel Element Fracture
The problem of low thermal-stress resistance among all-carbide fuel elements was
anticipated in the Rover/NERVA programs. It was in part due to this fact that the geometry of
the fuel element was changed to be thinner with a single coolant channel to minimize thermal
gradients. Other likely contributors to fuel element fracture include surface flaws introduced
during the extensive machining operations performed on solid solution carbide fuel elements
because they could not be extruded in the desired geometry. From the post-test analysis of
NF-1 fuel elements, the chief problem exhibited by the solid solution carbides was fuel element
fracture. The number of fractures and the fracture pattern could be correlated to some degree
with the amount of zirconium that was added to control the C/M ratio. Fuel elements with the
highest amount of zirconium added (lowest C/M ratio) showed fewer cracks both in the
transverse and longitudinal direction. For (U, Zr)C fuel elements, the greatest degree of fracture
occurred at the axial region corresponding to the highest power densities (highest neutron flux).
However, it was noted that no sign of millimeter sized fragments were seen (Lyon, 1973).
Component studies performed by LUTCH measured the strength of fuel elements
before and after exposure to flowing hot hydrogen. These results showed an increase in
torsional strength for (U, Zr, Nb)C following exposure while those made of (U, Zr, Ta)C
remained approximately constant (D'yakov and Tishchenko, 1994).

28
Butt et al. (1993) in their survey discussed the thermal shock resistance parameter as it
relates to mixed carbides. This factor is related to the thermal stress that would be developed in
a material due to temperature gradients and is proportional to the fracture strength and thermal
conductivity of the fuel and inversely proportional to its coefficient of thermal expansion as
shown in Equation 5. While noting that insufficient data exists for the mixed carbide fuels to
allow for direct comparisons, Butt et al. (1993) did note that low porosity and low uranium
content can be expected to increase thermal shock resistance. From this it would seem
favorable to have high density, high thermal conductivity, low uranium content fuels.
ratiopoison (1/K)t coefficienexpansion thermal
(Pa) elasticity of modulus sYoung'(W/mK)ty conductivi thermal
(Pa)strength fracture
1992) Richerson, 1993; al.,et (Butt ,)1(
'
==
===
−=
µα
κσ
αµκσ
E
ER
f
f
(5)
Hot Hydrogen Corrosion and Mass Loss
Besides their high service temperature, single-phase, solid solution carbides have a good
resistance to corrosion by hot hydrogen compared with earlier Rover/NERVA fuel designs.
The study of carbide fuel elements at the end of the Rover/NERVA program was motivated by
carbon loss rates in earlier fuel types sufficient to adversely impact neutronic considerations.
These losses were due to the high chemical reactivity of hot hydrogen with free carbon. The
near absence of free carbon in the advanced solid solution carbide fuel elements reduces carbon
loss rates due to interaction of hot hydrogen with only chemically combined carbon (Lyon,
1973).

29
Figure 1-7. Mass loss rates for three different Rover/NERVA fuel elements showing the characteristic midband corrosion pattern. Curve A is for NbC coated graphite matrix fuel elements (Pewee-1 tests). Similarly, curve B is for ZrC coated fuel elements (Pewee-1 tests), while curve C is for ZrC coated composite carbide/graphite fuel elements from NF-1 tests (after Lyon, 1973).
Regardless of the fuel design, all fuel elements tested during the Rover/NERVA
program experienced some degree of corrosion and mass loss during testing as expected.
Insufficient test data exist for the solid solution carbide fuel elements but mass loss rates for
three other fuel designs are shown in Figure 1-4. The characteristic peak in mass loss rates
about the midsection of the core was termed “mid-band” corrosion. Mass loss during operation
can be attributed to several interrelated phenomena including radiation exposure, chemical
reaction with flowing hot hydrogen, vaporization, and creep among others. Isolated, single-
effect studies on graphite-matrix, composite, and carbide fuel materials did not indicate the
complex corrosion pattern exhibited by the Rover/NERVA tests. Instead, most single-effect
100 80
60 50 40
30
20
10
0 0 200 400 600 800 1000 1200
Station (mm)
Mas
s Lo
ss R
ate
(mg/
m2 s)
A
B
C

30
studies designed to test temperature dependence indicated a single thermally activated rate
limiting step (Barletta et al., 93). These and other findings point to competing processes that
give rise to the varied "mid-band" corrosion pattern based on the distinct local physical
conditions that are likely to exist at different stages along the fuel element length (see Figure 1-
7). Such gradients that occur along the propellant stream include temperature, pressure,
neutron fluence, and hydrocarbon concentration.
Suggested explanations of this characteristic corrosion pattern point to the high reactivity
of carbon with flowing hot hydrogen and the observed cracking in the fuel’s zirconium carbide
coating. Cracking exposed the fuel to attack by flowing hot hydrogen and cracks were most
numerous around the mid-band. However, this understanding of corrosion patterns would not
apply to the carbide fuel elements due to the absence of both free carbon and a protective
coating.
However, some common phenomenon can help explain mass loss characteristics for
graphite matrix and composite design fuel and also predict losses for solid solution, carbide fuel
designs. The presence of hydrocarbons in the propellant stream serves to reduce carbon
losses. In the upper part of the reactor core where temperatures are less than 1500 K,
reactions of hydrogen with carbon will be negligible. Hydrocarbons can be added to the stream
but will be present regardless due to reactions of hot hydrogen with carbon. At high
temperatures these become unstable and their effect is negligible above 2900 K. Near the exit,
where temperatures exceed 2900 K, losses are largely due to vaporization from the exposed
carbide surfaces. Here also hydrogen corrosion is negligible and hydrogen gas actually serves
to reduce losses by vaporization by reflecting some vapor back to the surface. In between,

31
hydrogen will react with carbon forming hydrocarbons that build up in the propellant stream
serving to suppress losses downstream but ahead of the higher temperature region where
vaporization dominates.
Thermochemical modeling of the pseudo-binary (U, Zr)C based on available data
indicates that the initial loss of uranium and carbon will be large as they form concentration
gradients at exposed surfaces of the fuel element. A low uranium diffusion rate in the solid
solution carbide causes this gradient to be steep and limited to about the outer 40 µm (Storms,
1992). Subsequent losses of uranium are predicted to be smaller and only in relative proportion
to zirconium losses. Storms (1992) concluded that this loss of uranium due to vaporization
would be the life-limiting phenomenon for solid solution carbide NTP systems. Porosity in the
carbide fuel either from fabrication or created by irradiation, serves to increase uranium diffusion
to the surface leading to higher mass loss rates. Also, increasing the surface area exposed to the
propellant gas stream, open pores further increase uranium mass losses.
Pseudo-ternary carbides of (U, Zr, Nb)C and (U, Zr, Ta)C were investigated by
LUTCH with average uranium content of ~1.1 g/cc and 0.85 g/cc respectively. The uncoated
fuel pins were fabricated in the "twisted-ribbon" design. Tests were conducted in flowing hot
hydrogen at 3300 K for one hour for (U, Zr, Nb)C and two hours for samples of (U, Zr, Ta)C.
Post-test analysis has shown uranium mass losses of ~5% for (U, Zr, Nb)C samples. There
was a fair amount of uncertainty in tests for (U, Zr, Ta)C as different methods of analysis gave
conflicting results. Uranium mass losses for these samples could be 7% or as little as 1-2%
(D'yakov and Tishchenko, 1994).

32
In order to gauge the service life for these carbides, tests in flowing hot hydrogen were
performed at a lower temperature, 2800 K, for 10 hours. Fuel pins of (U, Zr, Nb)C
experienced average mass losses of 2%, while those of (U, Zr, Ta)C had average losses of less
than 1%. Analysis of the uranium distribution in cross-sections of fuel pins revealed that the loss
of uranium was largely from the surface of the fuel pins as shown in Figure 1-8. Solid solutions
with NbC showed losses mainly in the outer 200-300 µm while solid-solutions with TaC
revealed losses only from the outer 50-100 µm (D'yakov and Tishchenko, 1994). These
uranium mass loss profiles agree at least qualitatively with the predictions based on
thermochemical modeling of the pseudo-binary (U, Zr)C (Storms, 1992).

33
Figure 1-8. Changes in uranium distribution for Russian "twisted ribbon" fuel elements before and after hot hydrogen testing (measured across fuel pin cross section). Lines 1, 2, and 5 are pre-test measurements while 3, 4, 6, and 7 are post-test. (a) (U, Zr, Nb)C (b) (U, Zr, Ta)C (after D'yakov and Tishchenko, 1994).

34
METHOD
Preparation and Handling of Powders
Composition
Based on preliminary results from previous work with mixed uranium/refractory metal
carbides, studies of pseudo-ternary carbides such as (U, Zr, Nb)C should examine high density,
low uranium content fuels with C/M ratios of approximately 0.95. These characteristics are
most likely to provide the highest melting point, lowest mass loss rates, best thermal shock
resistance, and lowest theoretical density (through low U/M) for an advanced, high performance
nuclear fuel. Based upon previous Rover/NERVA designs utilizing highly enriched uranium
(93% U-235) with a density of approximately 0.3 gU/cc, such low uranium content fuels are
possible (Lyon, 1973). Other possible variations include Russian core designs using 0.8 to 1.1
gU/cc fuel with a reflector or "after burner" region. Therefore, this study examined the pseudo-
ternary (U, Zr, Nb)C, with a C/M of 0.95, U/M equal to 0.5 and 1.0, and zirconium to
refractory metal ratios (Zr/Mref) of 0.65, 0.75, and 0.85 yielding estimated uranium densities
ranging from 0.8 to 1.8 gU/cc (see Table 2-1).
Initial processing attempts were accomplished using mixtures of carbide powders with
uranium, C-T1, and without uranium, C-B1, C-B2, C-B3, and C-B4. These stoichiometric or
near stoichiometric compositions were easier to prepare since the carbide powders of UC,

Tabl
e 2-
1. C
ompo
sitio
n an
d ca
lcul
ated
mix
ed c
arbi
de b
atch
dat
a.
Bat
ch
Nom
inal
Com
posit
ion
U D
ensi
ty
(gU
/cc)
Th
eore
tical
D
ensi
ty
(g/c
c)*
C/M
U
/M
Zr/M
ref
Mat
eria
l So
urce
No.
†
C-B
1 (Z
r 0.7
, Nb 0
.3)C
0
6.94
5 1
0 0.
7 3,
5
C-B
2 (Z
r 0.6
5, N
b 0.3
5)C
0
7.00
5 1
0 0.
65
3, 5
C-B
3 (Z
r 0.7
5, N
b 0.2
5)C
0
6.89
2 1
0 0.
75
3, 5
C-B
4 (Z
r 0.8
5, N
b 0.1
5)C
0
6.77
8 1
0 0.
85
3, 5
C-T
1 (U
0.1,
Zr0.
45, N
b 0.4
5)C
1.
838
8.11
5 1
0.11
5 0.
5 1,
3, 5
C-T
2 (U
0.1,
Zr0.
58, N
b 0.3
2)C
0.95
1.
563
7.77
3 0.
951
0.09
9 0.
65
2, 4
, 5, 6
C-T
3 (U
0.1,
Zr0.
68, N
b 0.2
2)C
0.95
1.
539
7.66
0 0.
951
0.09
9 0.
75
2, 4
, 5, 6
C-T
4 (U
0.1,
Zr0.
77, N
b 0.1
3)C
0.95
1.
522
7.55
1 0.
951
0.09
9 0.
85
2, 4
, 5, 6
C-T
5 (U
0.05
, Zr 0
.62,
Nb 0
.33)
C0.
95
0.80
1 7.
379
0.95
0 0.
050
0.65
2,
4, 5
, 6
C-T
6 (U
0.05
, Zr 0
.71,
Nb 0
.24)
C0.
95
0.78
8 7.
265
0.95
0 0.
050
0.75
2,
4, 5
, 6
C-T
7 (U
0.05
, Zr 0
.81,
Nb 0
.14)
C0.
95
0.77
6 7.
153
0.95
0 0.
050
0.85
2,
4, 5
, 6
C-T
8 (W
0.1,
Zr0.
45, N
b 0.4
5)C
0
8.01
2 1
0 0.
5 3,
5, 8
* Th
eore
tical
den
sity
calc
ulat
ed u
sing
latti
ce p
aram
eter
dat
a fro
m T
able
1-2
(see
text
). †
Mat
eria
l num
bers
from
Tab
le 2
-2.
35
36
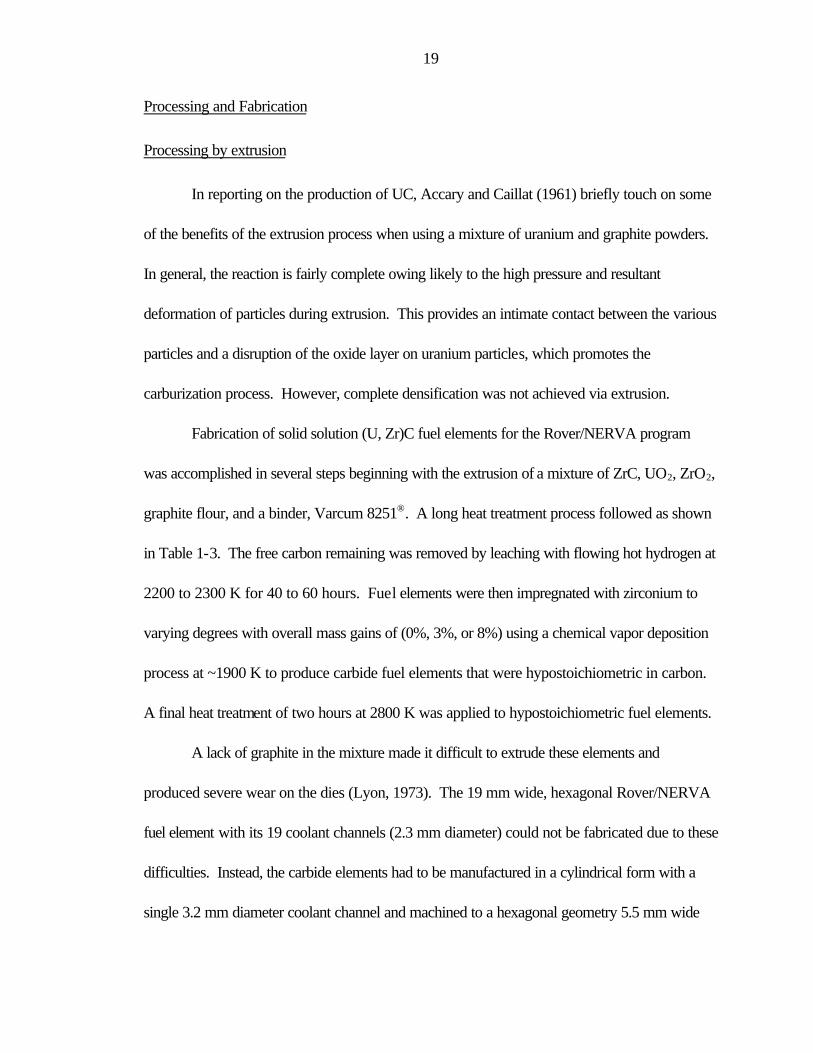
NbC, and ZrC were readily available. This initial phase was used to test equipment and
processing methods before attempting to process hypostoichiometric samples in the target
composition range. In all, four pseudo-binary, (Zr, Nb)C, and one pseudo-ternary, (U, Zr,
Nb)C, compositions were processed from the initial carbide powders. Table 2-1 lists these
various compositions along with the other compositions processed in this study.
As explained in the previous chapter, the low U/M ratios were chosen to maintain the
highest melting points of the refractory carbides while containing enough uranium for criticality
and desired excess reactivity. Initial studies of the UC-ZrC-NbC system indicate that the
highest melting point for compositions containing this fraction of UC should occur for Zr/Mref of
0.65 to 0.85 (Tosdale, 1967). Therefore, the pseudo-binary compositions C-B2, C-B3, and
C-B4 nominally correspond to a Zr/Mref of 0.65, 0.75, and 0.85 respectively. Similarly, ternary
carbide compositions with U/M equal to 0.1, C-T2, C-T3, and C-T4, have nominal Zr/Mref of
0.65, 0.75, and 0.85 respectively. The same is also true for C-T5, C-T6, and C-T7 but with
U/M equal to 0.05.
Also shown in Table 2-1 are the corresponding estimates of theoretical density (TD) for
each composition. Theoretical density was taken as the crystallographic density for a solid
solution of the mixed carbides, which it was the goal of this work to produce. Crystallographic
density was calculated by dividing the mass of a unit cell weighted in proportion to the various
carbides present by the volume of the unit cell. The dimensions of the unit cell were obtained
from lattice parameters for the various carbides as listed in Table 1-2.

37
Table 2-2. Material data on powders used in sample compositions
Material Reference
No.
Material Supplier
Lot No. Particle Size Purity
1 UC CERAC 60 Mesh (~250 µm)
99.5%
2 UH3 Alfa Lot No. 062174 Stock: 89000
3 ZrC (1) Alfa Lot No. F10E09 -325 Mesh (~44 µm)
98%
4 ZrC (2) LANL Lot #5A APS 3.5 µm
5 NbC LANL Lot #46-C1 APS 3.5 µm
6 Graphite Johnson Matthey
Lot #I24C08 300 Mesh (~48 µm)
99.5%
7 Stearic Acid Aldrich Lot #07112AF 95%
8 WC Alfa Lot #B02A45 99.5%
All of the data for the mono-carbides listed in Table 1-2 are for the cubic, rock salt
[NaCl] structure. However, stoichiometric WC has an HCP structure and the cubic form
WC0.61 is only stable above 2800 K (Storms, 1967). Since the goal of this work was to
produce solid solution mixed carbides, the lattice parameter for the cubic form of WC was
chosen for this calculation and it was assumed that a limited amount of WC could be substituted
in a solid solution of largely ZrC and NbC in a cubic form. Scanning electron microscopy and
x-ray diffraction analysis would be used to determine if indeed solid solutions of all the mixed
carbide samples was achieved and whether this assumption was valid.
38
Vegard's Law, which assumes a linear relationship in lattice parameter with
composition, was invoked to estimate the lattice parameter of the mixed carbides by weighting
the lattice parameter of the individual carbides by their corresponding proportions (Cullity,
1978). No variation in lattice parameter was accounted for with regard to hypostoichiometric
compositions because this effect was expected to be small since no more than 5% of the carbon
atoms would be absent from their interstitial sites for the target C/M ratio of 0.95. However,
their mass was deducted from the unit cell in proportion to their deviation from stoichiometry.
This effect is likewise small since it amounts to no more than 5% of the total weight percent of
carbon, which itself is less than approximately 10 wt% of the mixed carbides and when these
factors are combined amount to less than 1% of the overall unit cell mass.
Uranium Hydride Processing
In order to produce samples with varying carbon-to-metal-ratios, powders of uranium
hydride (UH3) and graphite were mixed with carbide powders of zirconium and niobium.
Based on calculations of Gibb's free energies for the decomposition of UH3 (eq. 2-1) using the
FACT computer code (Bale and Pelton, 1996), the hydrogen is evolved at temperatures above
676 K (see Table 2-3). During sintering at temperatures of 2500 K or above as called for in
this study, all the hydrogen is predicted to be evolved from mixtures containing UH3, graphite,
and refractory metal carbides leaving behind uranium metal to form mixed uranium/refractory
metal carbides.
Uranium hydride for these samples was produced from uranium metal rod of 4.5 mm
diameter heated to 473 K in an atmosphere of flowing Ar-7%H. As the hydriding reaction
takes place, the rod appears to swell and crack and UH3 particles flake off exposing more

39
uranium metal (see Figure 2-1). These flakes of UH3 were then mixed with the desired
compositions of graphite and carbides of zirconium and niobium to produce samples that were
hypostoichiometric.
23 H 3 U2 2 +→UH (2-1)
Table 2-3. Gibb's free energies for decomposition of uranium hydride.
T (K) ∆G (J)*
300 144856.5
400 107651
500 69308.9
600 30077.6
675 176.2
676 -225
700 -9871.3
*Calculated from: FACT (Bale and Pelton, 1996)
Mixing and Handling of Powders
The material powders used in sample compositions are listed in Table 2-2 above. The
carbide powders and 3 wt% stearic acid were weighed on a Sartorius model R180D balance
and added to a 125 ml Nalgene HDPE bottle. This handling took place inside a fume hood.
Approximately 80 chrome steel balls (diameter 0.635 cm) were added to the bottle for mixing
in a ball mill. Mixing was done overnight for at least 18 hours. If only carbide powders were to
be used in a particular mixture, the bottle was closed and was mixed on a Lortone model 1.5E
rotary tumbler (see Figure 2-2). Two Buna-N o-rings were placed around the outside of the

40
a.
b. Figure 2-1. Production of uranium hydride powder from uranium metal rod. a) comparison of an unexposed uranium metal rod (d=4.5 mm) with a uranium metal rod (d=3.7mm) exposed for approximately 36 hours. b) exposed uranium metal rod and resulting UH3 particles.

41
bottle at the top and bottom to aid the bottle in making contact with the rollers of the rotary
tumbler to prevent slippage between the bottle and rollers preventing the bottle from rotating.
Because uranium hydride is pyrophoric in air, if the hydride powders were to be used, the
handling was done inside a glove box with an inert environment of ultra-high purity (UHP) argon
or Ar-7%H. The lids and open bottles were placed in the antechamber that was evacuated so
that no residual air would be left in the bottles to contaminate the glove box. The bottles and
lids were then transferred to the main chamber and the appropriate amount of UH3 was
weighed on an AND model HL-200 (0.1 g accuracy) scale and added to the bottle which was
then closed. As with the mixtures containing only carbide powders, the bottles were mixed on
the rotary tumbler overnight for at least 18 hours.
Prior to cold pressing, the stainless steel dies were transferred to the glove box. A 1 cm
tall graphite plug was placed in the bottom of each die and approximately 2.5 g of a mixture was
added to each die. A temporary graphite punch was placed on top of the powders to minimize
contact with the open air before transfer to the cold press where a stainless steel punch was
used during pressing. After pressing, the bottom die holder of the press was removed, and the
sample, along with the graphite plug, is pushed out the bottom of the die using the press. The
sample was then transferred to the graphite die for sintering.
Processing
Cold Uniaxial Pressing
The first attempts at processing mixed uranium/refractory metal carbides did not involve
cold pressing or any other method of compaction prior to sintering. These samples exhibited a

42
Figure 2-2. Mixing of powders was done on a rotary tumbler, Lortone model 1.5E.
large amount of porosity (low density) and had little mechanical strength. The samples were of
such low quality that they would be ground down during polishing. In order to produce high
quality samples of low porosity, it was decided to cold press samples prior to sintering.
Uniaxial pressing in a graphite die/susceptor
The first attempt at cold unidirectional pressing utilized a 20 ton hydraulic press to
compact powders. A two piece holder of brass and aluminum was machined to mount a 0.635
cm (0.25 in.) punch made of tool steel to the hydraulic press as shown in Figure 2-3. The
mixed powders were pressed in the same graphite die/susceptor (2.54 cm OD by 6.5 cm
length) that was used for sintering. A plexiglass shield was used during all cold pressing

43
a.
b.
Figure 2-3. Design of the first uniaxial cold press used for pressing mixed carbide powders in graphite dies before sintering. a) an illustration of the press. b) a photograph of some of the hardware used. From left to right, the 0.635 cm punch and holder for attaching to the 20 ton hydraulic press, steel sheath for containing the lateral pressure on the die of 2.54 cm OD, and the copper mold for later dies of 1.9 cm OD.
graphite susceptor
Trailer tongue scale
20 ton hydraulic jack

44
operations to provide protection in case the die was to shatter. Almost invariably, the dies
would fail due to the high lateral pressure on the die and low strength of the graphite.
To contain the lateral pressure, a steel cylinder (3.5 cm OD) was used to sheath the
graphite dies. This setup is similar to the graphite die and molybdenum cylinder used by Accary
and Caillat (1961). To ensure a tight fit, heavy weight paper (punch cards) were wound around
the graphite die, which would be twisted into the steel sheath for a tight fit. This method
improved the success rate of cold pressing but the graphite dies would fail on approximately
every other pressing due to the inability to get a good fit. Also, it was difficult to prepare the die
and steel sheath for pressing. Therefore, the steel sheath was discarded and a new method was
developed.
Next a copper mold that was cut in half (4.2 cm on each side and 7.5 cm in length) was
used to brace the graphite die and contain the lateral pressure. The copper mold was machined
to exactly fit the graphite die by first drilling two holes along both edges of the block. It was
then cut in half perpendicular to the holes, which were used to bolt the block together again. A
central hole along the axis was then bored out to match the graphite die forming a mold to brace
it. Because this method was expected to better contain the lateral pressure, a smaller graphite
die, 1.9 cm in diameter and 7 cm tall, was used for pressing. A smaller diameter die/susceptor
was used for the added benefit of allowing for higher temperature without exceeding the limits of
the furnace's heat exchanger (see section titled "Sintering" below). The thin layer of copper
about 0.5 mm thick was filed away from the inside of each piece where the two halves contact
each other. This was done to ensure a tight fit around the graphite die when the mold and die
were bolted together. Ultimately however, this method proved no better than the steel sheath.

45
The failures of both these methods seemed to result from imperfect matching of the
holder and graphite die, which allowed the die to fracture at those areas of poor fit.
Recognizing the failure of the two previous methods, an improved method was sought where the
holder and die could achieve a better, if not perfect, fit. For this reason, a tapered graphite die
that could be buttressed by a much larger size matching graphite holder was developed. The
graphite die was machined to the specifications shown in Figure 2-4 to match with a tapered
hole bored into a large graphite block 9 cm by 9 cm in cross section and 12.5 cm tall using a
#10 reamer. The two complementary components could be wrung together to achieve a near
perfect fit. Pressing was achieved by applying a bi-directional force on the die/holder apparatus
(see Figure 2-4). This was accomplished using two separate hydraulic presses, one to press the
powders inside the die and the other to press the die into the graphite holder to apply an even
lateral force to the outside of the die for balancing the internal pressure form the other press.
Using this method, cold pressing was successful at pressures as high as 250 MPa.
Also, a tapered die was successfully used for pressing a second time following sintering of an
initial sample in the furnace. However, this seemed to be the limit of use obtainable from the
tapered die since most failed during a third attempt. Failure seemed to result again from the
inability to contain the lateral pressure because of poor fit of the graphite die and holder. The
outer surface of the tapered die would become uneven and its outer diameter would be reduced
in the middle where it would experience the highest temperatures during sintering. This is likely
the result of vaporization of carbon from the die surface at the high temperature encountered
during sintering or oxidation due to residual oxygen retained in the furnace during sintering. This

46
a.
b. Figure 2-4. Re-design of the initial cold press using a tapered die. a) an illustration of the press and tapered die showing dimensions. b) a photograph of the die with its larger graphite holder for reinforcement during pressing.
1.84 cm
1.68 cm
7.7 cm 0.635 cm

47
large-scale unevenness could not be successfully eliminated by wringing together the tapered die
and matching holder and ultimately resulted in failure of the tapered graphite die.
Uniaxial pressing in stainless steel dies
Finally, a fourth cold pressing apparatus was designed. Because of graphite's low
strength, it was decided to press the samples in stainless steel dies and transfer the cold pressed
sample to the graphite die for sintering. Initial attempts failed because the sample lacked
cohesion after pressing and would crumble and breakup upon removal from the steel die. To
overcome this problem, a binder, stearic acid (C18H36O2), was added to the powder mixture.
The addition of a binder permitted the cold pressed sample to have a measure of green strength
to allow its transfer to the graphite dies for sintering and also provided some lubrication between
the powder compacts and die wall to allow their removal. Three weight percent stearic acid
was added to each mixture. With less than this amount, the cold pressed sample would crumble
and not hold its form for transfer to the graphite die.
An entirely new cold press was constructed to handle pressing operations using the new
stainless steel punch and dies. Instead of mounting the punch and die in a hydraulic press, it was
mounted between two steel blocks that can move up and down on two 2.54 cm (1 in.)
threaded steel rods. The bottom of each steel rod is mounted to a steel cart and pressure is
applied to the punch and die by tightening a nut on each threaded steel rod. Being able to
control each side of the press with a separate nut allowed better control over the pressing and
prevented the misalignment of the punch and die. This had become a challenge in the old
hydraulic press where there was not much precision and resulted in the bending the punch
because of misalignment. A trailer tongue scale was used during pressing for measuring up to

48
454 kg (1000 lbs.) for a possible equivalent pressure of 141 MPa for a 0.635 cm (0.25 in.)
diameter sample.
This press was later modified to shorten the time required to press a sample. Instead of
applying pressure by tightening the nuts on the upper die holder, a Buehler Simplimet-2
hydraulic mounting press was placed underneath the bottom die holder and replaced the trailer
tongue scale. Pressure was applied using the hydraulic jack contained in the mounting press,
which also contains a gauge for measuring the pressure applied to the sample up to 4536 kg
(10,000 lbs.) for a possible equivalent pressure of 1405 MPa for a 0.635 cm (0.25 in.)
diameter sample (see Figure 2-5).
Sintering By Induction Heating
Equipment design and performance
Carbide samples were sintered in an induction furnace following cold pressing. A
Taylor Winfield, model CE2000, 20kW, 450 kHz power supply was used with a four liter,
water-cooled test chamber (see Figure 2-6). Two water-cooled electrical power feedthroughs
from Insulator Seal Inc., model 9511020, rated for 10 kV/35 kW were welded into an 8 inch
diameter stainless steel rotatable, Conflat ® flange. This was bolted to one of the four arms of
the stainless steel, four-way cross test chamber. Different size coils were used along with
different diameter graphite dies. Initially, a four turn 3.3 cm ID coil made of ordinary copper
refrigeration tubing was used with a 2.54 cm (1 in.) diameter, 6.5 cm tall graphite die. A 0.635
cm (0.25 in.) diameter hole was drilled through the center of the graphite rod to form the die.
All samples sintered by induction heating were made to 0.635 cm (0.25 in.) in diameter. This

49
Figure 2-5. Photograph of the final cold press.
large die permitted cold pressing at approximately 600 lbs. with variable success but prevented
obtaining temperatures above 2400 K for any extended period of time. The large die has a
large surface area to radiate energy/heat to the coil causing the cooling water to boil or overheat
and trip the high temperature sensor on the power supply.

50
Figure 2-6. An illustration of the induction furnace chamber showing major components.
In order to achieve the higher temperatures targeted for processing samples, the
diameter of the graphite die was reduced to 1.9 cm in conjunction with the development of the
second cold pressing design. This medium sized graphite die which permitted cold pressing at
1000 lbs. with variable success, could operate at temperatures as high as 2600 K for more than
an hour. A slightly smaller, tapered diameter graphite die was developed for the third cold
pressing design. This design performed similarly to the medium graphite die but was abandoned
because of problems with cold pressing and problems removing the sample after sintering.
Cooling Water Lines
Power Supply 20 kW 450 kHz
Depth Gauge
Gauges
Reaction Chamber
Graphite Die
Fuel Material Powders
Argon Supply
Diffusion Pump
& Mechanical Pump
Induction Coil

51
Tapered graphite dies as well as those of the medium size were often cracked while trying to
remove the sample. The problem resulted from the sample diffusion bonding to the graphite die
and punch during sintering (see Figure 2-7). Since the powders had been previously pressed
into the die at high pressure (as much as 250 MPa for the tapered design), the powder was
already in intimate contact with the punch and die surfaces allowing them to easily become
bonded with the sample during sintering. The fourth cold pressing design using a stainless steel
die to press the samples and then transfer to the graphite die virtually eliminated the difficulty of
removing the samples after sintering. Almost all samples could be removed by tapping the
sample from the bottom using a stainless steel rod.
Figure 2-7. A photograph showing a mixed carbide sample diffusion bonded to the graphite punch and die following a sintering for 40 minutes at 2600 K.

52
Since the final cold press design no longer required a tapered graphite die, the design
was changed to be a uniform 1.6 cm in diameter and 8 cm long. Along with a smaller five turn,
2.2 cm ID coil, temperatures as high as 2800 K were achieved. Using this small graphite die
and small coil, samples were sintered as long as 90 minutes at or near this high temperature.
Slight decreases in power were necessary during some experiments due to inadequate cooling
from the heat exchanger that provides cooling for the coil and power supply.
Another problem encountered during sintering was arcing between the coil and graphite
die. Early coil designs were made from ordinary refrigeration copper tubing with a wall
thickness of 0.076 cm (0.030 in.). Arcing would melt the coil allowing the cooling water to
pour into the chamber terminating the experiment and requiring an extensive cleanup effort.
Later coil designs were made from heavy-duty copper tubing with wall thickness of 0.124 cm
(0.049 in.). The thicker wall tubing prevented most arcing events from destroying the coil and
would only occasionally produce a pinhole but would still require replacement and cleanup of
the chamber.
Pressure was applied to the graphite punch by means of a mechanical feedthrough with
model number, VF-100-2, by Huntington Inc. Weights sufficient to produce a pressure of 3
MPa were added to the feedthrough for use during the sintering of mixed carbide samples. A
dial gauge graduated in thousandths of an inch was fitted on top of these weights and measured
the movement of the punch during sintering. Using this gauge, it was possible to note the onset
and cessation of compaction as well as estimate the degree of compaction based on gross
movement of the gauge.

53
Temperature measurement and control
Measurement of sintering temperature was done by using a Maxline™ temperature
acquisition and control system. The control unit was a Maxline™ model MX-MR04 with
infrared thermometers, which span a temperature range from 977 to 3866 K. These so-called
"two color" sensors operate by measuring the ratio of energy emitted by the target at two
infrared wavelengths of 0.7 and 1.07 microns. Because they operate on a dual wavelength
ratio, they are not susceptible to errors in temperature measurement owing to the emissivity of
non-blackbodies which is cancelled by taking the ratio of intensity at two different wavelengths
(Felice 1995). Instead, possible errors result from any wavelength dependence of emissivity for
the target in question. Any difference in the target's emissivity at the two different wavelengths
monitored by the sensors must be compensated for through an emissivity slope (e slope) factor.
Greybodies are a group of materials whose emissivities are the same at both wavelengths
measured by the sensors and therefore do not require a compensating factor or e slope factor
equal to 1.00. For applications involving the Maxline ™ system, graphite can be considered a
greybody (Maxline, 1988). Measurements by Neuer (1995) have shown that the emissivity of
graphite is approximately linear at these wavelengths.
Testing schedule
Various heating schedules were tried to determine the processes occurring during
sintering and to find the optimum processing parameters such as sintering temperature and time
interval. Samples were processed at temperatures between 2500 and 2800 K for times ranging
from five minutes to two hours.

54
Dynamic Magnetic Compaction
Dynamic magnetic compaction (DMC) was investigated as an alternate method to cold
isostatic pressing of carbide powders. Carbide powders from batches C-T1 and C-T8 were
compacted using the DMC method. A copper tube 1.58 cm OD and 1.28 cm tall with a wall
thickness of 0.07 cm was used as the armature. It was filled with the powder mixture and
shaken using a vibrator to get a uniform filling so that the finished sample would be uniform in the
axial direction. Figure 2-8 shows the prepared sample just prior to insertion into the coil for
compaction. Following compaction, the samples were sintered in the induction furnace at
temperatures between 2700 and 2950 K for periods as long as 90 minutes. Sintering was
accomplished by placing the sample with its copper armature atop a 1.9 cm diameter graphite
pedestal. The pedestal was positioned so that the sample was at the center both vertically and
diametrically of a four turn, 2.2 cm ID induction coil. The copper armature was removed from
the sample by melting as the power was increased to the sintering temperature.
Hot Pressing
Equipment design and performance
Hot pressing of mixed carbides by direct resistance heating of the samples was
investigated. The first attempt at hot pressing involved the use of an arbor press to which a 1.27
cm (0.5 in.) graphite punch and die were added between the press ram and base plate. A
water-cooled, copper electrode was bolted around the graphite punch at the top and a copper
plate formed the bottom electrode attached to the graphite die underneath. As much as 650 A
at 5.9 volts of direct current was applied to the hot press from a Miller power supply, model

55
Figure 2-8. Picture showing a pseudo-ternary carbide sample just prior to insertion into the electromagnetic coil for compaction using the dynamic magnetic compaction method.

56
number SR-1000-C1, for a peak input power of 3.8 kW. The peak power output from the
power supply was 7.3 kW with significant losses in the cables and connections. Pressure was
applied to the punch by lead bricks attached to the arm of the arbor press. Loose graphite
powder was packed around the punch and die as insulation. This graphite insulation was
contained by an inconel foil shield, 5 cm (2 in.) in diameter, that together with the packed
graphite powder enclosed all of the punch and die except for the upper 2 cm (0.75 in.) that was
exposed. A depth gauge mounted on top of the ram of the arbor press that contacted the
graphite punch/electrode was used to monitor compaction. The dial face of the gauge was
marked in thousandths of an inch.
During the experiment the inconel shield would glow incandescent and the upper part of
the punch that was exposed glowed a bright orange. Problems associated with this setup
included burning of the electrode that was exposed and to a lesser extent that part which was
enclosed by the graphite insulation and inconel shield. Experiments were halted before its failure
and its final condition can be seen in Figure 2-9. In early experiments, the copper electrode lost
its contact with the graphite punch as the experiment heated up. This forced the addition of
water cooling for the copper electrode. This set of experiments was ultimately halted because
the insulation on the cables melted at 7.3 kW supplied by the power supply. Compaction was
noted to be continuing before the experiment was halted indicating that more compaction was
still possible.
Equipment redesign
The failures noted in the original hot press forced the design and construction of a
different press to prevent overheating of the cables and better protect the graphite

57
Figure 2-9. Picture of damaged hot press components.
punch/electrode from oxidation. The second hot press used the larger framework of 20 ton
hydraulic press with the hydraulic hand jack replaced by lead bricks placed on top of the punch
(see Figure 2-10). The upper and lower parts of the graphite electrode that are exposed were
enlarged to 9 cm by 9 cm (see Figure 2-11). Water-cooled copper electrodes bolt directly into
these graphite electrodes. A 1.27 cm (0.5 in.) graphite punch and die were inserted between
the graphite electrodes. The outer diameter of the graphite die was 2.54 cm (1 in.). A larger,
28 cm (11 in.) diameter by 38 cm (15 in.) tall, steel drum was used to contain the loose graphite
insulation that was packed around the graphite electrodes and the punch and die. This was to
provide better insulation and more protection to reduce the oxidation of the punch and die. A
0.635 cm (0.25 in.) quartz tube was added penetrating the graphite powder and abutting the
graphite die. UHP argon was allowed to flow through this tube, which was used to make a

58
Figure 2-10. Schematic of the second hot press.
Water Cooling Lines
Pressure Gauge
Ternary Sample
Graphite Die
Top Electrode
Bottom Electrode
Graphite Powder
Argon Flow
Graphite Punch
Water Cooling Lines

59
visual inspection of the color radiating from the die. At the highest power levels attempted
during testing, the die glowed a bright orange color and was estimated to be between 3000 K
and 3200 K.
Figure 2-11. Picture of the second hot press electrodes.
Some operational difficulties occurred during the first experiment. The original graphite
punch was a uniform 1.27 cm (0.5 in.) in diameter and a significant part of the upper punch was
oxidized or was vaporized. The reduced diameter caused the punch to collapse under the
weight of the lead bricks. It was prevented from completely collapsing by steel blocks that
limited how far the punch could travel. The graphite punch was redesigned to be 2.54 cm (1
in.) in diameter in the upper part and taper down to a uniform 1.27 cm (0.5 in.) where it makes

60
contact with the die. The graphite insulation was repacked and the UHP argon was allowed to
flow into and permeate the insulation overnight. Compaction was noted in all experiments but in
each case the experiment had to be halted because of overheating of the cables.
Testing schedule
The hot press was operated in this final configuration for four experiments between 60
and 112 minutes. Hot pressing was continued until compaction ceased after reaching the
maximum output of the power supply or the cable overheated.
Density Measurements
Bulk density was measured to estimate the amount porosity contained in the samples.
Sample porosity is important since it affects material performance and high density (low
porosity) fuels are required to achieve the desired performance under NTP conditions. Also,
the relative amount of porosity provides an indication of the degree of sintering and whether
additional processing is needed. Also, it provides a means to compare the effectiveness of
different processing parameters such as temperature, compaction pressure, sintering time, etc.
Because the sample shapes were not entirely regular, their volume had to be estimated
by measuring the displacement of water from a known volume. This was accomplished by first
weighing the dry samples before any other steps were taken and recording their masses. Next,
the weight of a small container of water (d=1cm, h=1cm) was measured and recorded. Each
sample was then individually placed in the container, which was then filled with water and
weighed. The mass of the container filled with water and the dry sample mass minus the mass
of the sample and water together provides the mass of the water displaced by the sample. Then

61
assuming a density of 1 g/cc for water, the volume of the sample was obtained. The assumption
of 1g/cc for water at room temperature is valid since for water at 293 K, the density is 0.998
g/cc and does not vary more than 0.003 g/cc for ±10 K.
Melting Point Determination
Because of the importance of high melting temperature to the usefulness of these
carbides, it was decided to examine the melting temperature of these mixed carbides. A test
stand for melting point determination was constructed in a 36 cm (14 in.) bell jar (see Figure 2-
12). Water-cooled, power feedthroughs made of copper and rated for 1000 amps were used.
These power feedthroughs (part number 9462017) were manufactured by Insulator Seal
Incorporated. A Miller power supply, model number SR-1000-C1, was used to supply power
to the test stand. The apparatus was designed to use direct resistance heating to melt the small,
0.635 cm (0.25 in.) diameter, samples processed in this study. Graphite electrodes were used
with a top electrode diameter of 1.27 cm (0.5 in.) and the bottom electrode 2.54 cm (1 in.) in
diameter.
The top electrode was bolted to two pieces of copper while the bottom electrode was
drilled and bolted to a copper plate. Both ends were water-cooled. The bottom plate was
insulated from the other parts of the test stand using a mica sheet of thickness 0.5 mm. A small
shallow, 0.635 cm (0.25 in.) diameter depression was machined in the ends of the graphite
electrodes to hold the sample in place during heating. The top electrode was designed to move
freely vertically between two 1.27 cm (0.5 in.) threaded rods covered and electrically insulated
by quartz tubes. A dial gauge measuring movement in one thousandth of an inch monitored its

62
vertical movement. The electrodes and sample would be expected to expand upon heating. A
subsequent contraction at temperatures near the melting point would be indicative of the onset
of structural changes in the sample. Therefore, this is the temperature of interest because
structural changes in the proposed fuel could block coolant channels and the formation of any
liquid must be strictly avoided to maintain mass loss rates at acceptable levels.
Figure 2-12. Apparatus for melting point determination.
Temperature measurements were made using a Maxline™, model MX-MR04,
temperature acquisition and control system with infrared thermometers. As discussed above,
these so-called "two color" sensors operate by measuring the ratio of two infrared wavelengths,

63
0.7 and 1.07 microns, and are not susceptible to errors in temperature measurement owing to
the absolute emissivity of non-blackbodies (see "Sintering" above). However, ZrC and NbC
are not greybodies as graphite and require use of an e-slope factor of 1.1 to correct for non-
linearity in their emissivity with wavelength based on data for emissivity of ZrC, the dominant
component, from Touloukian and DeWitt (1972).

64
RESULTS
A total of 33 mixed carbide samples were processed using the various methods and
parameters discussed in the previous chapter. Table 3-1 and Table 3-2 list the samples, their
nominal composition, powder mixture batch number, measured bulk density, and key
parameters related to their processing. Of the 33 total samples, 20 were ternary carbides and
of those 20, 17 contained depleted uranium in amounts of either 5% or 10% metal mole
fraction. Nineteen of the ternary carbides and seven of the binary carbides of ZrC and NbC
were pre-compacted either by cold pressing or the DMC method and sintered. Additionally,
three samples were successfully processed by hot pressing for comparison with pre-compacted
and sintered samples. Results of these experiments are summarized below.
Binary Carbides
The binary carbide samples B4 through B10 were processed by cold pressing at 120
MPa and sintering at temperatures as high as 2800 K for as long as one hour (see Table 3-1).
For samples B1 through B3, no pre-compaction was done prior to sintering. A portfolio of
scanning electron micrograph (SEM) images is shown in Figures 3-1 through 3-10. These
SEM images reveal a largely open, porous microstructure. Additionally, many of the binary
samples were not particularly consolidated and some would be ground down noticeably during
polishing. This pattern is true despite sintering times longer than 30 min. at 2800 K and pre-

65
Tab
le 3
-1. M
easu
red
data
and
pro
cess
ing
para
met
ers
for b
inar
y sa
mpl
es.
2900
K
2800
K
42
62
47
30 10
19
2700
K
45
65
58
36
18 37
30
17
22
2600
K
70 22 40
33
23
25
2500
K
48
68
75
46 25
2400
K
87 25
5 43
36 T
ime
at o
r ab
ove
tem
pera
ture
(m
in.)
2300
K
54
71 56 7 28
28
Col
d Pr
esse
d (M
Pa)
none
none
none
120
120
120
120
120
120
120
%T
D
80.6
83.3
89.2
87.4
79.5
77.0
85.9
78.3
81.6
79.5
Den
sity
(g
/cc)
5.60
5.79
6.19
6.07
5.48
5.31
6.02
5.49
5.63
5.48
Com
posi
tion
(Zr 0
.7, N
b 0.3
)C
(Zr 0
.7, N
b 0.3
)C
(Zr 0
.7, N
b 0.3
)C
(Zr 0
.7, N
b 0.3
)C
(Zr 0
.75,
Nb 0
.25)
C
(Zr 0
.75,
Nb 0
.25)
C
(Zr 0
.65,
Nb 0
.35)
C
(Zr 0
.65,
Nb 0
.35)
C
(Zr 0
.75,
Nb 0
.25)
C
(Zr 0
.75,
Nb 0
.25)
C
Bat
ch
C-B
1
C-B
1
C-B
1
C-B
1
C-B
3
C-B
3
C-B
2
C-B
2
C-B
3
C-B
3
No.
1 2 3 4 5 6 7 8 9 10

66
2900
K
97
2800
K
5
2700
K
10 90
94
99
2600
K
20
20
68
38
2 20 4
2500
K
23
72
43
6 142 13
3 37
36
10
102
97
99
2400
K
21
26
74
45
8 4 39
72 T
ime
at o
r ab
ove
tem
pera
ture
(m
in.)
2300
K
23
28
74
48
10
144 8 16
6 39
42
79
Col
d Pr
esse
d (M
Pa)
(non
e)
140
~80
140
250
150
80
120
120
120
120
120
DM
C
DM
C
DM
C
%T
D
76.8
91.9
81.3
94.2
88.0
96.0
72.8
90.7
---
85.9
83.4
76.3
81.2
82.1
82.6
Den
sity
(g
/cc)
6.23
7.46
6.60
7.64
7.14
7.79
5.91
7.36
---
6.27
6.09
5.57
6.59
6.58
6.62
Com
posi
tion
(U0.
1, Z
r 0.4
5, N
b 0.4
5)C
(U0.
1, Z
r 0.4
5, N
b 0.4
5)C
(U0.
1, Z
r 0.4
5, N
b 0.4
5)C
(U0.
1, Z
r 0.4
5, N
b 0.4
5)C
(U0.
1, Z
r 0.4
5, N
b 0.4
5)C
(U0.
1, Z
r 0.4
5, N
b 0.4
5)C
(U0.
1, Z
r 0.4
5, N
b 0.4
5)C
(U0.
1, Z
r 0.4
5, N
b 0.4
5)C
(U0.
05, Z
r 0.7
1, N
b 0.2
4)C
0.95
(U0.
05, Z
r 0.7
1, N
b 0.2
4)C
0.95
(U0.
05, Z
r 0.7
1, N
b 0.2
4)C
0.95
(U0.
05, Z
r 0.7
1, N
b 0.2
4)C
0.95
(U0.
1, Z
r 0.4
5, N
b 0.4
5)C
(W0.
1, Z
r 0.4
5, N
b 0.4
5)C
(W0.
1, Z
r 0.4
5, N
b 0.4
5)C
Bat
ch
C-T
1
C-T
1
C-T
1
C-T
1
C-T
1
C-T
1
C-T
1
C-T
1
C-T
6
C-T
6
C-T
6
C-T
6
C-T
1
C-T
8
C-T
8
No.
1 2 3 4 5 6 7 8 9 10
11
12
13
14
15
Tab
le 3
-2.
Mea
sure
d da
ta a
nd p
roce
ssin
g pa
ram
eter
s fo
r ter
nary
sam
ples
.

67
2900
K
2800
K
3 3 4
2700
K
2600
K
2500
K
40
95
128
82
107
2400
K
Tim
e at
or
abov
e te
mpe
ratu
re (
min
.)
2300
K
Col
d Pr
esse
d (M
Pa)
120
120
120
none
120
%T
D
88.9
89.0
88.5
74.5
86.1
Den
sity
(g
/cc)
6.91
6.82
6.68
5.50
6.16
Com
posi
tion
(U0.
1, Z
r 0.5
8, N
b 0.3
2)C
0.95
(U0.
1, Z
r 0.6
8, N
b 0.2
2)C
0.95
(U0.
1, Z
r 0.7
7, N
b 0.1
3)C
0.95
(U0.
05, Z
r 0.6
2, N
b 0.3
3)C
0.95
(U0.
05, Z
r 0.8
1, N
b 0.1
4)C
0.95
Bat
ch
C-T
2
C-T
3
C-T
4
C-T
5
C-T
7
No.
16
17
18
19
20
Tab
le 3
-2.
cont
inue
d.

68
compaction by cold pressing at 120 MPa. Further, a pressure of 3 MPa was applied to all
binary samples during sintering in the induction furnace. These characteristics lie in stark
contrast to most of the ternary samples, which after sintering were quite hard and appeared
fairly consolidated from their SEM images (see “Ternary Carbides” below).
Ternary Carbides
Density Measurements and Microscopy Results
The ternary carbides were processed by sintering for various times and temperatures as
shown in Table 3-2. All samples were pre-compacted prior to sintering except for sample T1
and T19. Samples T13, T14, and T15 were compacted using the DMC method. The
measured density and percentage of theoretical density for each sample are also shown in Table
3-2.
Many of the various problems encountered during processing have been outlined in the
previous chapter describing the development of the different processing methods. In some
cases, these problems affected the processing of one or more samples and changed the
prescribed processing parameters. These variations were documented and are reflected in the
data contained herein. The fact that problems occurred does not invalidate the experiments as
those processing parameters were to be intentionally varied. This was done in order to gain
perspective on the various phenomena occurring during processing and to identify the critical
parameters for processing mixed carbides.
A portfolio of scanning electron micrograph (SEM) images are shown in Figures 3-11
through 3-29 at the end of this chapter. For most samples, a standard SEM image generated

69
from secondary electrons emitted from the sample reveals the topographic features of the
sample. Also, where possible a second SEM image showing compositional contrast is shown
by imaging using backscattered electrons. For these images, lighter areas indicate regions of the
mixed carbide sample with a largely higher atomic number than the surrounding material.
Therefore, since Nb (Z=41) and Zr (Z=40) have similar atomic numbers, uranium (Z=92)
provides a marked contrast when concentrated in regions of the sample providing indication of
inhomogeneity in the mixed carbide. All images were taken on a JEOL 35C with a beam
voltage of 25 kV.
The SEM image of sample T1 is shown in Figure 3-11. A fair degree of residual
porosity is evident and seems to agree with the estimate of 76.8% TD based on density
measurements. The numerous rounded pores are indicative of the intermediate stage of
sintering, while the large, light shaded areas of Figure 3-11b indicates a fair degree of
inhomogeneity comprised mostly of UC.
The microstructure of sample T2 is shown in Figure 3-12. Its higher density can be
attributed in part to pre-compaction by cold pressing at 140 MPa. Rounded and elongated
pores are indicative of the intermediate stage of sintering. Grain growth is evident with grain
sizes of approximately 30 to 40 µm indicating the latter stages of sintering. The large amount of
uranium contained in the grain boundaries points to large scale inhomogeneity. This
concentration in the grain boundaries indicates a process of liquid phase sintering where a liquid
(UC) fills the open pores and grain boundaries aiding in the sintering process.
Figure 3-13 shows a larger amount of porosity for sample T3 than would be expected
based on the longer sintering time of 68 min. at 2600 K. This is in part due to the fact that the

70
die cracked during pressing and only achieved approximately 80 MPa pressure instead of the
intended 140 MPa applied to most samples. Also, the graphite punch was believed to have
been stuck initially during sintering since the onset of compaction was not observed as expected.
More weight was added to the mechanical feedthrough and indication of compaction was noted
thereafter. The large areas concentrated in UC (see Figure 3-13b) note a large degree of
inhomogeneity.
Similar to sample T2, Figure 3-14 shows spherical and elongated pores for sample T4.
Its higher density could be expected from the longer sintering time it received. Accordingly, the
sample also appears to be more homogenous. The heating schedule for sample T5 was very
abbreviated and as expected the porosity is much higher and the large areas of concentrated
UC indicate a lack of homogeneity (see Figure 3-15). In contrast, sample T6 appears much
less porous (96.0% TD) with a much more homogenous microstructure owing to the extended
sintering time of 142 min. at 2500 K. The fraction of UC that is still visible in the grain
boundaries is small and points to liquid phase sintering (see Figure 3-16). The large grains on
the order of 100 µm indicate a significant degree of grain growth which would be expected for
such long times at high temperatures.
The largest amount of porosity (72.8% TD) for any sample was exhibited by sample T7
with a much abbreviated heating schedule of 4 min. at 2400 K and 8 min. at or above 2300 K.
Figure 3-17 shows a large amount of porosity and inhomogeneity. Sample T8 points to the
effect of temperature on sintering with a short heating schedule of 5 min. at a higher temperature
of 2800 K and 10 min. at or above 2700 K. A moderate amount of porosity (90.7% TD) is
shown in Figure 3-T8 with smooth, mostly spherical pores and some inhomogeneity remaining.

71
Samples T9 through T12 mark a shift in the processing methodology for ternary
samples. These samples were produced by mixing the refractory carbide powders with uranium
hydride and stearic acid as a binder/lubricant. These samples were pressed in stainless steel
dies prior to transfer to the graphite susceptor for sintering. A persistent arcing problem with
the induction furnace prevented high temperature sintering and resulted in abbreviated heating
cycles for most samples. As a result, lack of consolidation prevented any SEM image of
sample T9 from being obtained. Instead, the sample was virtually ground away to a powder
during the polishing step after processing.
Figure 3-19 indicates a large amount of porosity for sample T10 with 85.9% TD.
Because of the lack of consolidation, a compositional contrast image was not possible. Instead
of revealing contrast in atomic number of the sample, the only contrast visible was between the
peaks and the deep holes present in the open microstructure. Sample T11 (see Figure 3-20)
and T12 (see Figure 3-21) appear much as sample T10 with a large amount of open porosity.
These samples exhibit only the initial stages of sintering.
Samples T13 through T15 were pre-compacted using the DMC method without a
binder. Figure 3-22 shows the large spherical pores of sample T13 with 81.2% TD. A virtually
uniform composition is shown in Figure 3-22b, which can be attributed to a long sintering time
of 90 min. at 2700 K. Samples T14 (see Figure 3-23) and T15 (see Figure 3-24) were
processed from a mixture of WC-ZrC-NbC. Both samples have similar microstructures and
densities of 82.1% TD and 82.6% TD respectively even though sample T15 was sintered at a
temperature of 2900 K for 97 min. compared with 2700 K for 94 min. for sample T14.

72
The SEM images of samples T16 through T20 are shown in Figures 3-25 through 3-29.
These samples were processed from hypostoichiometric mixtures similar to samples T9 through
T12. Likewise, these samples except for T19 were also pre-compacted by cold pressing at
120 MPa prior to sintering. Each sample was sintered for different time intervals for 40 min. to
128 min. above 2500 K. Peak temperatures above 2800 K were achieved for samples T16
through T18 for three to four minutes. This temperature could not be maintained because the
energy radiated by the susceptor began to boil the water cooling the induction coil.
From their SEM images (Figures 3-25 through 3-27), samples T16 through T18 appear
to be well compacted in agreement with their relative densities of approximately 89% TD.
These same samples also show evidence of liquid phase sintering. Sample T19, which was not
pre-compacted, appears far less consolidated at only 74.5% TD (see Figure 3-28). Because
of their large amount of porosity, meaningful compositional contrast images could not be
obtained for samples T19 and T20.
X-ray Diffraction Results
The diffraction patterns of the original powders, all the ternary samples, and samples B7
and HP2 are shown in Figure 3-32 through 3-59 at the end of this chapter. Results of this
analysis are summarized in Table 3-3. Also shown is the diffraction pattern of the UH3
processed from uranium metal rod (see Figure 3-37).
Samples T1 and T5 appear to be largely solid solutions with the peaks corresponding to
d-values for a cubic phase between those of pure ZrC and pure NbC. For example, the d-
value of the {111} plane falls at 2.66 D, which is the weighted average between ZrC, NbC,
and UC. The slightly broader peaks indicate there is some variation in the d-values and

73
Table 3-3. X-ray diffraction results.
No. Solid Solution Determination Additional Phases/Impurities
T1 s.s. with possible concentration gradients
Significant amount UO2
T2 s.s. with possible concentration gradients
Very small amount graphite, UC2, and oxide of Zr/Nb
T3 s.s. with possible concentration gradients
Very small amount graphite and UC2
T4 s.s. with possible concentration gradients
Small amount graphite and UC2 to a lesser extent
T5 s.s. with possible concentration gradients
Very small amount UO2
T6 s.s. with possible concentration gradients
Very small amount UC2
T7 s.s. with possible concentration gradients
Small amount UC2 very small fraction oxide of Zr or Nb/U
T8 distinct peaks; some indication of s.s. regions
significant amount UO2
T9 Not solid solution; ZrC/NbC distinct
T10 Not solid solution
T11 Not solid solution Large amount of graphite
T12 Not solid solution
T13 Solid solution
T14 Solid solution
T15 Solid solution
T16 Solid solution
T17 Solid solution

74
Table 3-3. continued.
T18 Solid solution Small amount of graphite
T19 Not solid solution
T20 Solid solution
B7 Solid solution
HP2 Solid solution Significant amount of graphite

75
therefore variation in composition and that it may not be entirely homogenous. Also, a small
ZrC peak is discernable for the {111} plane indicating a small amount of ZrC is still present. In
addition, some impurity U3O7 is also present based on the additional peaks identified in Figures
3-39 and 3-43. This is likely the result of residual oxygen in the chamber during processing
since this phase does not appear in the starting materials.
Similar results were obtained for sample T2 except that no residual ZrC appears to be
present leaving a solid solution with some slight concentration gradients possible as noted from
the small degree of broadening exhibited by the solid solution peaks. A very small fraction of
other phases are noted also including graphite and UC2. An oxide is also present in a very small
amount of either ZrNb2O7 or Nb14ZrO37.
Samples T3 and T4 are a solid solution with some small composition gradients as noted
by the slightly broadened peaks. Also, graphite and UC2 are noted to be present in small
amounts. Samples T6 and T7 show only a small fraction of UC2 and no graphite while T7
shows an additional oxide of either ZrO2 or Nb3UO10.
Beginning with sample T8, a marked difference in the sample diffraction patterns
appears as noted by the virtual absence of a solid solution. Sample T8 shows distinct peaks for
NbC and ZrC as well as the presence of solid solution regions. Also, present is a significant
amount of UO2 which similar to the oxides found in other samples are likely the result of residual
oxygen in the chamber during processing.
Samples T9 through T12 and T19 have distinct ZrC peaks with tails stretching to higher
angles of 2θ or lower d-values. These tails stretch as far as the d-values for NbC and,
combined with the lack of a distinct NbC peak in most cases, point to the early stages of solid

76
solution formation. On the other hand, samples T16, T17, T18, and T20 are shown to be
largely solid solutions by the sharp well defined peaks for the mixed carbide at the expected d-
values (angles of 2θ) as shown in Figures 3-54, 3-55, 3-56, and 3-58 respectively. The only
second phase evident is graphite in samples T11 and T18.
Sample T13 appears to be a solid solution with sharp peaks corresponding to expected
d-values of the mixed carbide (see Figure 3-51). Similarly, T14 and T15 are solid solutions of
NbC and ZrC with WC instead of UC as in the previous examples (see Figures 3-52 and 3-
53). The peaks are slightly broader for T14 and T15 indicating a range in d-values and hence
the presence of possible concentration gradients. No lines corresponding to d-values for the
hexagonal mono-carbide, WC, are present indicating that it forms a solid solution with NbC and
ZrC at least in the concentration range up to 10% WC.
Hot Pressing
Three samples were hot pressed using the apparatus described in the previous chapter
with the results of these experiments listed in Table 3-4. The highest temperatures achieved
were estimated between 3000 K and 3200 K. Compaction was noted in all hot pressing
attempts and was noted to be continuing although extremely slowly before each experiment was
terminated due to overheating of the electrical cables. SEM images of samples HP1 and HP2
are shown in Figures 3-30 and 3-31 respectively. These samples have a small amount of open
porosity and are fairly consolidated as shown in the SEM images. This was further made
evident while polishing the samples prior to imaging as they were hard and required several

77
grinding disks to polish the samples. The last sample, HP3, was not fully consolidated since the
hot pressing operation had to be stopped due to melting of the electrical cable insulation.
The binary carbide samples B7 and HP2 both indicate the formation of solid solutions.
However, only sample HP2 shows a significant amount of graphite also present in the sample.
Table 3-4. Measured data and processing parameters for hot pressed samples.
No. Composition Density (g/cc)
%TD Processing Time Above ~3100 K
(min.) HP1 WC 13.9 88.8 55 HP2 (Zr0.7, Nb0.3)C 5.91 85.1 30 HP3 WC 13.18 84.3 0

78
a.
b. Figure 3-1. Binary sample B1, (Zr0.7, Nb0.3)C, with ρ= 5.6g/cc (80.6% TD) processed for
42 min. at = 2800 K after cold pressing at 120 MPa. Scale indicator is 10 µm. a) SEM; b) higher magnification SEM.
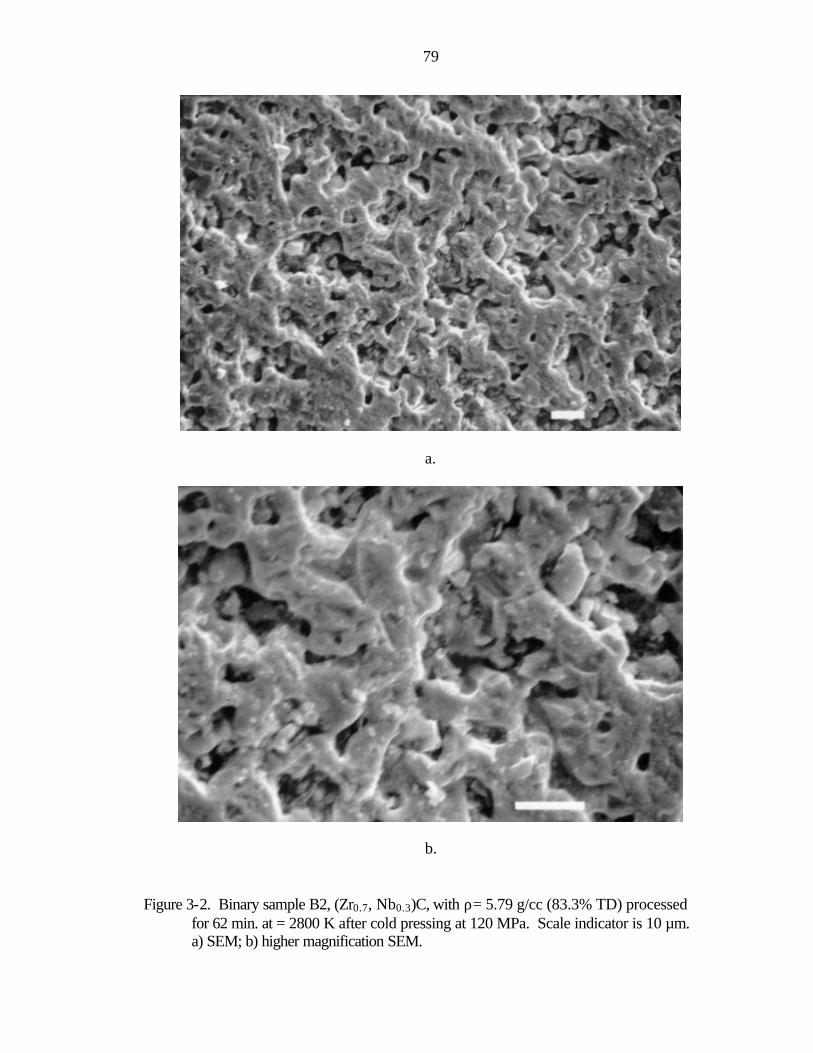
79
a.
b. Figure 3-2. Binary sample B2, (Zr0.7, Nb0.3)C, with ρ= 5.79 g/cc (83.3% TD) processed
for 62 min. at = 2800 K after cold pressing at 120 MPa. Scale indicator is 10 µm. a) SEM; b) higher magnification SEM.

80
a.
b. Figure 3-3. Binary sample B3, (Zr0.7, Nb0.3)C, with ρ= 6.19 g/cc (89.2% TD) processed
for 47 min. at = 2800 K after cold pressing at 120 MPa. Scale indicator is 10 µm. a) SEM; b) higher magnification SEM.

81
a.
b. Figure 3-4. Binary sample B4, (Zr0.7, Nb0.3)C, with ρ= 6.07 g/cc (87.4% TD) processed
for 30 min. at = 2800 K after cold pressing at 120 MPa. Scale indicator is 10 µm. a) SEM; b) higher magnification SEM.

82
a.
b. Figure 3-5. Binary sample B5, (Zr0.75, Nb0.25)C, with ρ= 5.48 g/cc (79.5% TD) processed
for 18 min. at = 2700 K after cold pressing at 120 MPa. Scale indicator is 10 µm. a) SEM; b) higher magnification SEM.

83
a.
b. Figure 3-6. Binary sample B6, (Zr0.75, Nb0.25)C, with ρ= 5.31 g/cc (77.0% TD) processed
for 5 min. at = 2400 K after cold pressing at 120 MPa. Scale indicator is 10 µm. a) SEM; b) higher magnification SEM.
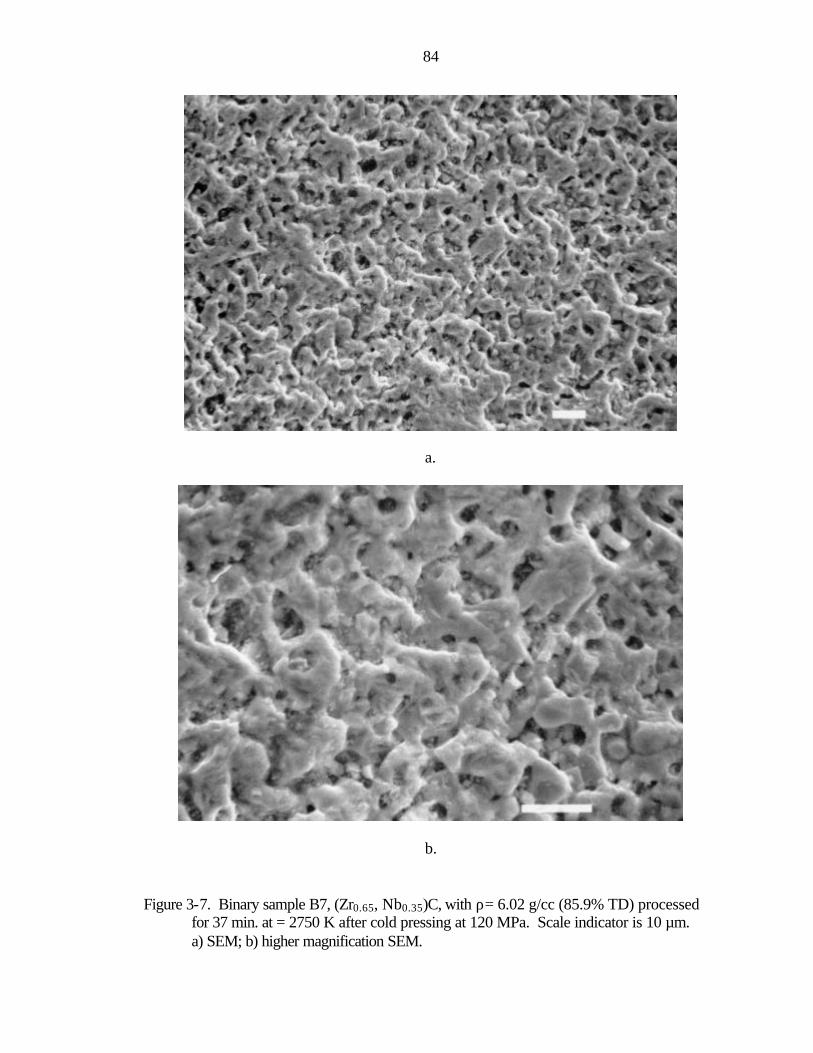
84
a.
b. Figure 3-7. Binary sample B7, (Zr0.65, Nb0.35)C, with ρ= 6.02 g/cc (85.9% TD) processed
for 37 min. at = 2750 K after cold pressing at 120 MPa. Scale indicator is 10 µm. a) SEM; b) higher magnification SEM.

85
a.
b. Figure 3-8. Binary sample B8, (Zr0.65, Nb0.35)C, with ρ= 5.49 g/cc (78.3% TD) processed
for 30 min. at = 2750 K after cold pressing at 120 MPa. Scale indicator is 10 µm. a) SEM; b) higher magnification SEM.

86
a.
b. Figure 3-9. Binary sample B9, (Zr0.75, Nb0.25)C, with ρ= 5.63 g/cc (81.6% TD) processed
for 17 min. at = 2700 K after cold pressing at 120 MPa. Scale indicator is 10 µm. a) SEM; b) higher magnification SEM.

87
a.
b. Figure 3-10. Binary sample B10, (Zr0.75, Nb0.25)C, with ρ= 5.48 g/cc (79.5% TD)
processed for 19 min. at = 2800 K after cold pressing at 120 MPa. Scale indicator is 10 µm. a) SEM; b) higher magnification SEM.

88
a.
b. Figure 3-11. Ternary sample T1, (U0.1, Zr0.45, Nb0.45)C, with ρ=6.23 g/cc (76.8% TD)
processed for 19 min. at = 2600 K without pre-compaction. Scale indicator is 10 µm. a) SEM; b) SEM with compositional contrast.

89
a.
b. Figure 3-12. Ternary sample T2, (U0.1, Zr0.45, Nb0.45)C with ρ=7.46 g/cc (91.9% TD),
cold pressed at 140 MPa and sintered for 20 min. at = 2600 K Scale indicator is 10 µm. a) SEM; b) SEM with compositional contrast.

90
a. 100 µm
b. 10 µm Figure 3-13. Ternary sample T3, (U0.1, Zr0.45, Nb0.45)C with ρ=6.60 g/cc (81.3% TD)
processed for 68 min. at = 2600 K after cold pressing at ~80 MPa. a) SEM; b) SEM with compositional contrast.

91
a. 10 µm
b. 100 µm Figure 3-14. Ternary sample T4, (U0.1, Zr0.45, Nb0.45)C, with ρ=7.64 g/cc (94.2% TD)
processed for 38 min. at = 2600 K after cold pressing at 140 MPa. a) SEM; b) SEM with compositional contrast.

92
a.
b. Figure 3-15. Ternary sample T5, (U0.1, Zr0.45, Nb0.45)C, with ρ=7.14 g/cc (88.0% TD)
processed for 6 min. at = 2500 K after cold pressing at 250 MPa. Scale indicator is 10 µm. a) SEM; b) SEM with compositional contrast.
93
a.
b. Figure 3-16. Ternary sample T6, (U0.1, Zr0.45, Nb0.45)C, with ρ=7.79 g/cc (96.0% TD)
processed for 20 min. = 2600 K and 142 min. = 2500 K after cold pressing at 150 MPa. Scale indicator is 10 µm. a) SEM; b) SEM with compositional contrast.

94
a.
b. Figure 3-17. Ternary sample T7, (U0.1, Zr0.45, Nb0.45)C, with ρ=5.91 g/cc (72.8% TD)
processed for 4 min. at = 2400 K and 8 min. at = 2300 K after cold pressing at 80 MPa. Scale indicator is 10 µm. a) SEM; b) SEM with compositional contrast.
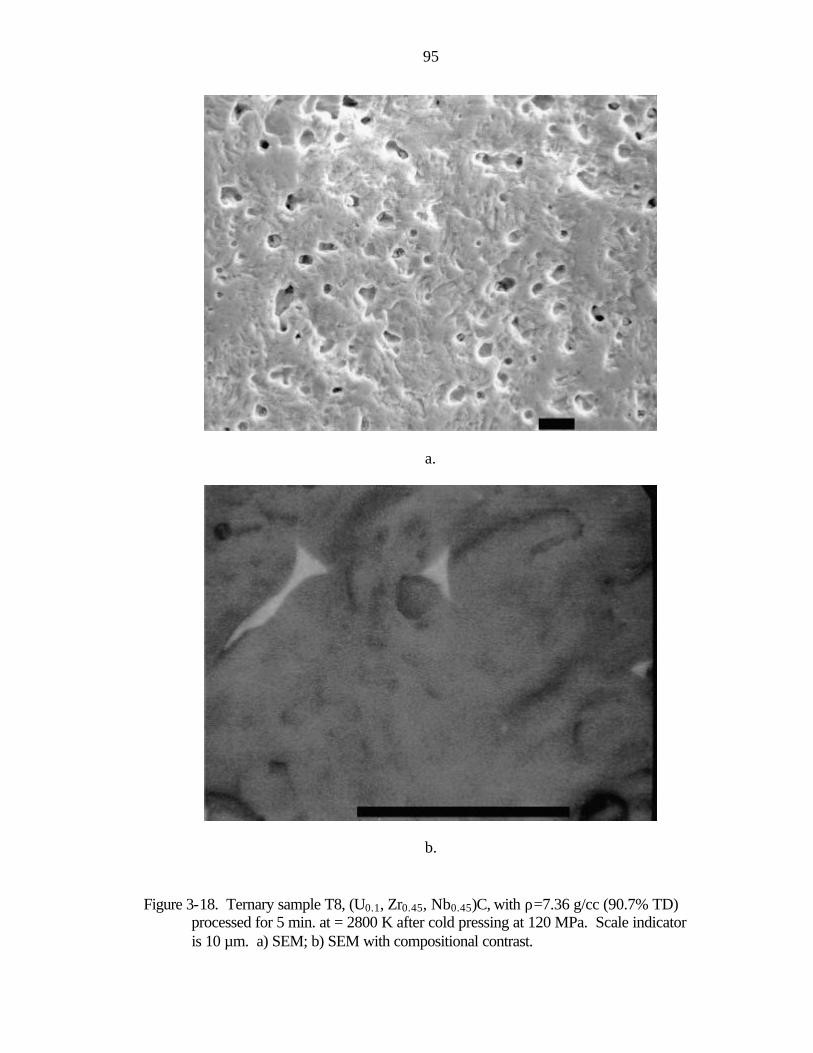
95
a.
b. Figure 3-18. Ternary sample T8, (U0.1, Zr0.45, Nb0.45)C, with ρ=7.36 g/cc (90.7% TD)
processed for 5 min. at = 2800 K after cold pressing at 120 MPa. Scale indicator is 10 µm. a) SEM; b) SEM with compositional contrast.

96
a. 10 µm
b. 1 µm Figure 3-19. Ternary sample T10, (U0.05, Zr0.71, Nb0.24)C0.95 with ρ=6.27 g/cc (85.9%
TD) processed for 37 min. at = 2500 K after cold pressing at 120 MPa. a) SEM; b) SEM with compositional contrast.

97
a. 10 µm
b. 1.0 µm Figure 3-20. Ternary sample T11, (U0.05, Zr0.71, Nb0.24)C0.95 with ρ=6.09 g/cc (83.4%
TD) processed for 36 min. at = 2500 K after cold pressing at 120 MPa. a) SEM; b) SEM with compositional contrast.

98
a. 100 µm
b. 10 µm Figure 3-21. Ternary sample T12, (U0.05, Zr0.71, Nb0.24)C0.95 with ρ=5.57 g/cc (76.3%
TD) processed for 4 min. at = 2600 K and 10 min. at = 2500 K after cold pressing at 120 MPa. a) SEM; b) SEM with compositional contrast.

99
a.
b. Figure 3-22. Ternary sample T13, (U0.1, Zr0.45, Nb0.45)C with ρ=6.59 g/cc (81.2% TD)
processed by DMC pre-compaction and sintered for 90 min. at = 2700 K. Scale indicator is 10 µm. a) SEM; b) SEM with compositional contrast.

100
a.
b. Figure 3-23. Ternary sample T14, (W0.1, Zr0.45, Nb0.45)C with ρ=6.58 g/cc (82.1% TD)
processed by DMC pre-compaction and sintered for 94 min. at = 2700 K. Scale indicator is 10 µm. a) SEM; b) higher magnification SEM.

101
a.
b. Figure 3-24. Ternary sample T15, (W0.1, Zr0.45, Nb0.45)C with ρ=6.62 g/cc (82.6% TD)
processed by DMC pre-compaction and sintered for 97 min. at = 2900 K. Scale indicator is 10 µm. a) SEM; b) higher magnification SEM.

102
a. 10 µm
b. 10 µm Figure 3-25. Ternary sample T16, (U0.1, Zr0.58, Nb0.32)C0.95 with ρ=6.91 g/cc (88.9% TD)
processed for 3 min. at = 2800 K and 40 min. at = 2500 K after cold pressing at 120 MPa. a) SEM; b) SEM with compositional contrast.

103
a. 10 µm
b. 10 µm Figure 3-26. Ternary sample T17, (U0.1, Zr0.68, Nb0.22)C0.95 with ρ=6.82 g/cc (89.0% TD)
processed for 3 min. at = 2800 K and 95 min. at = 2500 K after cold pressing at 120 MPa. a) SEM; b) SEM with compositional contrast.
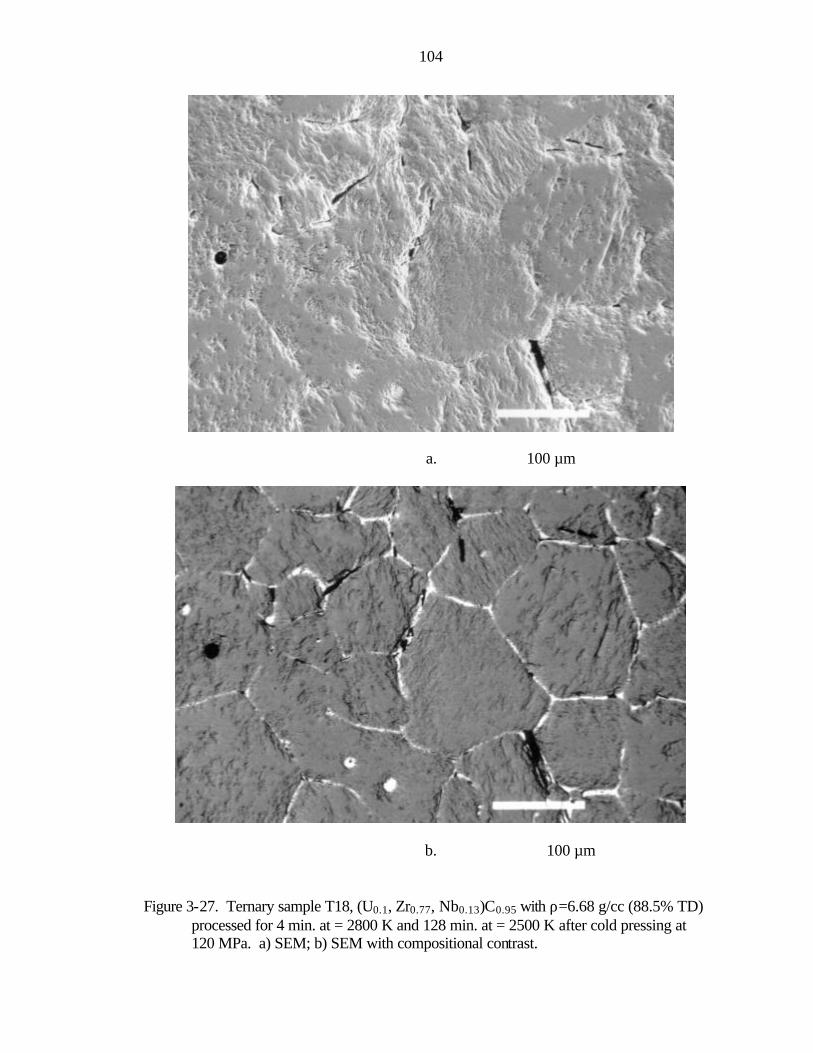
104
a. 100 µm
b. 100 µm Figure 3-27. Ternary sample T18, (U0.1, Zr0.77, Nb0.13)C0.95 with ρ=6.68 g/cc (88.5% TD)
processed for 4 min. at = 2800 K and 128 min. at = 2500 K after cold pressing at 120 MPa. a) SEM; b) SEM with compositional contrast.

105
a. 10 µm
b. 10 µm Figure 3-28. Ternary sample T19, (U0.05, Zr0.62, Nb0.33)C0.95 with ρ=5.50 g/cc (74.5%
TD) processed for 82 min. at = 2500 K with no pre-compaction. a) SEM; b) SEM.

106
a. 10 µm
b. 10 µm Figure 3-29. Ternary sample T20, (U0.05, Zr0.81, Nb0.14)C0.95 with ρ=6.16 g/cc (86.1%
TD) processed for 107 min. at = 2500 K after cold pressing at 120 MPa. a) SEM; b) SEM.

107
a. 100 µm
b. 10 µm Figure 3-30. Hot pressed WC, sample HP1, with ρ=13.9 g/cc (88.8% TD) processed for
55 min. at an estimated 3100 K. a) SEM; b) higher magnification SEM.

108
a. 10 µm
b. 1 µm Figure 3-31. Hot pressed sample HP2 (Zr0.7, Nb0.3)C with ρ=5.91 g/cc (85.1% TD)
processed for 30 min. at an estimated 3100 K. a) SEM; b) higher magnification SEM.

2030
4050
6070
8090
100
2θ (
deg
.)
Figu
re 3
-32.
X-ra
y di
ffrac
tion
patte
rn o
f the
orig
inal
ZrC
pow
der f
rom
LA
NL.
0
500
1,00
0
1,50
0
2,00
0
2,50
0
3,00
0
3,50
0
4,00
0
4,50
0counts
109
ZrC
-LA
NL

2030
4050
6070
8090
100
2θ (
deg
.)
Figu
re 3
-33.
X-ra
y di
ffrac
tion
patte
rn o
f the
orig
inal
ZrC
pow
der f
rom
Alfa
.
0
500
1,00
0
1,50
0
2,00
0
2,50
0
3,00
0counts
110
ZrC
-Alfa

2030
4050
6070
8090
100
2θ (
deg
.)
Figu
re 3
-34.
X-r
ay d
iffra
ctio
n pa
ttern
of t
he o
rigin
al N
bC p
owde
r.
0
500
1,00
0
1,50
0
2,00
0
2,50
0
3,00
0
3,50
0
4,00
0
4,50
0counts
111
Nb
C-L
AN
L

2030
4050
6070
8090
100
2θ (
deg
.)
Figu
re 3
-35.
X-ra
y di
ffrac
tion
patte
rn o
f the
orig
inal
UC
/UC
2 po
wde
r.
050100
150
200
250
300
350
counts
112
UC
/UC
2

2030
4050
6070
8090
100
2θ (
deg
.)
Figu
re 3
-36.
X-r
ay d
iffra
ctio
n pa
ttern
of t
he o
rigin
al W
C p
owde
r.
0
500
1,00
0
1,50
0
2,00
0
2,50
0
3,00
0
3,50
0
4,00
0
4,50
0counts
113
WC

2030
4050
6070
8090
100
2θ (
deg
.)
Figu
re 3
-37.
X-ra
y di
ffrac
tion
patte
rn o
f UH
3 po
wde
rs sh
owin
g m
ostly
oxi
des a
fter h
andl
ing.
050100
150
200
250
counts
114
UH
3-IN
SP
I

2030
4050
6070
8090
100
2θ(d
eg.)
Figu
re 3
-38.
X-r
ay d
iffra
ctio
n pa
ttern
of s
ampl
e B
7.
0
200
400
600
800
1,00
0
1,20
0counts
115
b7

2030
4050
6070
8090
100
2θ (
deg
.)
Figu
re 3
-39.
X-r
ay d
iffra
ctio
n pa
ttern
of s
ampl
e T1
.
0
200
400
600
800
1,00
0
1,20
0
1,40
0
1,60
0counts
116
t1

2030
4050
6070
8090
100
2θ (
deg
.)
Figu
re 3
-40.
X-r
ay d
iffra
ctio
n pa
ttern
of s
ampl
e T2
.
0
200
400
600
800
1,00
0
1,20
0
1,40
0
1,60
0counts
117
t2

2030
4050
6070
8090
100
2θ (
deg
.)
Figu
re 3
-41.
X-r
ay d
iffra
ctio
n pa
ttern
of s
ampl
e T3
.
0
500
1,00
0
1,50
0
2,00
0
2,50
0
3,00
0counts
118
t3

2030
4050
6070
8090
100
2θ (
deg
.)
Figu
re 3
-42.
X-r
ay d
iffra
ctio
n pa
ttern
of s
ampl
e T4
.
0
500
1,00
0
1,50
0
2,00
0
2,50
0counts
119
t4

2030
4050
6070
8090
100
2θ (
deg
.)
Figu
re 3
-43.
X-r
ay d
iffra
ctio
n pa
ttern
of s
ampl
e T5
.
0
200
400
600
800
1,00
0
1,20
0
1,40
0
1,60
0
1,80
0counts
120
t5

2030
4050
6070
8090
100
2θ (
deg
.)
Figu
re 3
-44.
X-r
ay d
iffra
ctio
n pa
ttern
of s
ampl
e T6
.
0
500
1,00
0
1,50
0
2,00
0
2,50
0
3,00
0
3,50
0counts
121
t6

2030
4050
6070
8090
100
2θ (
deg
.)
Figu
re 3
-45.
X-r
ay d
iffra
ctio
n pa
ttern
of s
ampl
e T7
.
0
100
200
300
400
500
600
700
800
counts
122
t7

2030
4050
6070
8090
100
2θ (
deg
.)
Figu
re 3
-46.
X-r
ay d
iffra
ctio
n pa
ttern
of s
ampl
e T8
.
050100
150
200
250
300
350
400
counts
123
t8

2030
4050
6070
8090
100
2θ (
deg
.)
Figu
re 3
-47.
X-r
ay d
iffra
ctio
n pa
ttern
of s
ampl
e T9
.
0
100
200
300
400
500
600
700
800
900
1,00
0counts
124
t9

2030
4050
6070
8090
100
2θ (
deg
.)
Figu
re 3
-48.
X-r
ay d
iffra
ctio
n pa
ttern
of s
ampl
e T1
0.
0
100
200
300
400
500
600
700
counts
125
t10

2030
4050
6070
8090
100
2θ (
deg
.)
Figu
re 3
-49.
X-r
ay d
iffra
ctio
n pa
ttern
of s
ampl
e T1
1.
0
500
1,00
0
1,50
0
2,00
0
2,50
0
3,00
0counts
126
t11

2030
4050
6070
8090
100
2θ (
deg
.)
Figu
re 3
-50.
X-r
ay d
iffra
ctio
n pa
ttern
of s
ampl
e T1
2.
0
200
400
600
800
1,00
0
1,20
0counts
127
t12

2030
4050
6070
8090
100
2θ (
deg
.)
Figu
re 3
-51.
X-r
ay d
iffra
ctio
n pa
ttern
of s
ampl
e T1
3.
0
200
400
600
800
1,00
0
1,20
0
1,40
0
1,60
0
1,80
0
2,00
0counts
128
t13

2030
4050
6070
8090
100
2θ (
deg
.)
Figu
re 3
-52.
X-r
ay d
iffra
ctio
n pa
ttern
of s
ampl
e T1
4.
0
200
400
600
800
1,00
0
1,20
0
1,40
0counts
129
t14

2030
4050
6070
8090
100
2θ (
deg
.)
Figu
re 3
-53.
X-r
ay d
iffra
ctio
n pa
ttern
of s
ampl
e T1
5.
0
200
400
600
800
1,00
0
1,20
0
1,40
0
1,60
0
1,80
0counts
130
t15

2030
4050
6070
8090
100
2θ (
deg
.)
Figu
re 3
-54.
X-r
ay d
iffra
ctio
n pa
ttern
of s
ampl
e T1
6.
0
200
400
600
800
1,00
0
1,20
0
1,40
0
1,60
0
1,80
0counts
131
t16

2030
4050
6070
8090
100
2θ (
deg
.)
Figu
re 3
-55.
X-r
ay d
iffra
ctio
n pa
ttern
of s
ampl
e T1
7.
0
200
400
600
800
1,00
0
1,20
0
1,40
0
1,60
0
1,80
0counts
132
t17

2030
4050
6070
8090
100
2θ (
deg
.)
Figu
re 3
-56.
X-r
ay d
iffra
ctio
n pa
ttern
of s
ampl
e T1
8.
0
500
1,00
0
1,50
0
2,00
0
2,50
0
3,00
0counts
133
t18

2030
4050
6070
8090
100
2θ (
deg
.)
Figu
re 3
-57.
X-r
ay d
iffra
ctio
n pa
ttern
of s
ampl
e T1
9.
0
100
200
300
400
500
600
700
800
counts
134
t19

2030
4050
6070
8090
100
2θ (
deg
.)
Figu
re 3
-58.
X-r
ay d
iffra
ctio
n pa
ttern
of s
ampl
e T2
0.
0
200
400
600
800
1,00
0
1,20
0
1,40
0
1,60
0counts
135
t20

2030
4050
6070
8090
100
2θ (
deg
.)
Figu
re 3
-59.
X-r
ay d
iffra
ctio
n pa
ttern
of s
ampl
e H
P2, (
Zr0.
7, N
b 0.3
)C.
0
200
400
600
800
1,00
0
1,20
0
1,40
0
1,60
0counts
136
HP
2

137
DISCUSSION
Binary Carbides
Figure 4-1 ranks the binary samples in order of the percentage of theoretical density
achieved during processing. Also shown for comparison are the processing parameters applied
to each sample. Despite this facility, the data virtually defies any trend in pre-compaction,
sintering time, or temperature. However, several observations are worth noting for discussion.
The apparent lack of consolidation of most of the refractory samples lies in stark contrast to the
fairly dense and hard ternary carbide samples despite the largely similar treatments of pre-
compaction and sintering. Further, the binary refractory carbides were sintered at temperature
200 to 300 K higher than most uranium bearing ternary carbide samples.
An initial explanation might lie in the difference in starting materials. The ternary carbide
samples had a third component of UC that was not present in the binary carbide samples. The
well consolidated, fairly dense, and hard ternary carbide samples all exhibited some indication of
liquid phase sintering through the melting of UC particles. This is evidenced particularly in
Figures 3-12b, 3-15b, 3-16b, 3-25b, and 3-27b. These SEM images showing compositional
contrast reveal the UC concentrated in the grain boundaries.
Liquid phase sintering would greatly enhance the sintering of the ternary samples. High
densities are achieved rapidly through the liquid material flowing to grain boundaries and open

Sam
ple
Figu
re 4
-1.
Com
paris
on o
f bin
ary
carb
ide
sam
ple
rela
tive
dens
ities
with
info
rmat
ion
on p
roce
ssin
g pa
ram
eter
s for
eac
h sa
mpl
e.
% Theoretical Density
138
77.0
78.3
79.5
79.5
80.6
81.6
83.3
85.9
87.4
89.2
60.0
70.0
80.0
90.0
100.
0
B6
B8
B5
B10
B1
B9
B2
B7
B4
B3
42m.>2800K, No CP
62m.>2800K, No CP
47m.>2800K, No CP
19m.>2800K, CP 120MPa
5m.>2400K, CP 120MPa
10m.>2800K, CP 120MPa
30m.>2750K, CP 120MPa
18m.>2700K, CP 120MPa
30m.>2800K, CP 120 MPa
37m.>2750K, CP 120 MPa

139
spaces in the microstructure. Secondly, the presence of a liquid phase contacting the grain
boundaries of particles provides for enhanced sintering through a solution-precipitation
mechanism (Kwon, 1991). Employing this mechanism, the solid, in this case ZrC and NbC, is
dissolved at the compressed, contact regions between particles and re-precipitated through the
liquid onto uncompressed particle surfaces enhancing the normal surface and volume diffusion
mechanisms during sintering, which take place in the absence of a liquid phase.
This liquid phase sintering is possible through the melting of the UC particles in the
mixed powder compact. While the congruent melting point of stoichiometric UC is 2803 K, the
actual composition of the material used for samples T1 through T8 was hyperstoichiometric
UC1+x, which has a minimum melting point of 2677 K at approximately 60 at% C. This
temperature was achieved in processing many of these early ternary carbide samples although it
could not always be maintained throughout the entire processing of all samples due to problems
with the induction furnace. Nevertheless, that such temperatures were achieved and the
evidence of liquid phase sintering shown by the SEM images lends credence to this as a
possible explanation for the improved sintering in ternary carbide samples over the binary
carbide samples without uranium carbide.
Hypostoichiometric ternary carbide samples, such as T9 through T12, which did not
achieve temperatures much above 2500 K due to problems with the furnace, all showed a lack
of consolidation similar to most of the binary carbide samples. Further, no evidence of liquid
phase sintering in these samples was evident from the SEM images. Later samples, T16
through T18 did show evidence of liquid phase sintering however these samples were sintered
at temperatures in excess of 2800 K but for only short intervals due to difficulties maintaining

140
this temperature. These elevated temperatures above 2800 K are necessary for melting the
hypostoichiometric UC component that is shown concentrated in the grain boundaries of
samples T16, T17, and T18 (Figures 3-25, 3-26, and 3-27 respectively).
The melting points of the refractory carbides ZrC and NbC are much higher at
temperatures greater than 3800 K and liquid phase sintering in these samples would not be
possible at the temperatures encountered in this study without the presence of UC. So the
binary carbide samples with only ZrC and NbC should require higher sintering temperatures and
not exhibit the same degree of sintering as ternary carbide samples, which agrees with the above
observations.
Ternary Carbides
Microscopy Results
Figure 4-2 was constructed to facilitate comparison of the ternary carbide samples'
relative densities and key processing parameters for further examination and discussion. In
Figure 4-2, the samples have been ordered in terms of percentage of theoretical density
achieved during processing. This ordering alone does not facilitate direct comparison since each
sample has undergone a slightly different processing method. Instead, samples can be
considered in groups with some processing parameters held constant to identify trends among
the various parameters.
Time and temperature
If an attempt is made to separate time as an independent variable, a trend does develop
based on comparison of samples T4, T2, and T12. Each of these samples was cold pressed

Figu
re 4
-2.
Com
paris
on o
f ter
nary
car
bide
sam
ples
rela
tive
dens
ities
with
info
rmat
ion
on p
roce
ssin
g pa
ram
eter
s for
eac
h sa
mpl
e.
141
72.8
74.5
76.3
76.8
81.2
81.3
83.4
86.1
88.0
88.5
88.9
89
90.7
91.9
94.2
96.0
85.9
6065707580859095100
T7
T19
T12
T1
T13
T3
T11
T10
T20
T5
T18
T16
T17
T8
T2
T4
T6
Sam
ple
% Theoretical Density
4m.>2600K, CP 120 MPa
20m.>2600K, No CP
4m.>2400K, CP 80MPa
90m.>2700K, DMC
68m.>2600K, CP ~80MPa
36m.>2500K, CP 120MPa
37m.>2500K, CP 120MPa
6m.>2500K, CP 250MPa
5m.>2800K, CP 120MPa
20m.>2600K, CP 140MPa
38m.>2600K, CP 140 MPa
142m.>2500K, CP 150 MPa
107m.>2500K, CP 120MPa
128m.>2500K, CP 120MPa
40m.>2500K, CP 120MPa
95m.>2500K, CP 120MPa
82m.>2500K, No CP (failed)
142
between 120 and 140 MPa and sintered at 2600 K for various intervals from 4 min. to 38 min.
with longer sintering times leading to higher densities. Similarly, T6 and T11 show the same
trend but for samples sintered at 2500 K.
The relationship of temperature is evident from samples T7, T12, and T8 ordered by
increasing density. All three samples were cold pressed and sintered for very short periods of
approximately 5 min. at different temperatures of 2400 K, 2600 K, and 2800 K respectively.
These comparisons lead to the expected conclusions that longer sintering times and/or higher
temperatures increase the degree of sintering producing a more consolidated material.
However, comparison of samples T2, T4, and T6 show the diminishing results achieved
by going to longer times. Samples T6 (96.0% TD) was processed for more than three times as
long but otherwise under similar conditions as sample T4 (94.2% TD) which was processed for
nearly twice as long as sample T2 (91.9% TD). In each case, the almost doubling of sintering
time serves to make only a small reduction in porosity and points to the difficulty of removing
porosity in the latter stages of sintering. In the final stages, the closed spherical pores shrink by
diffusion of vacancies to grain boundaries. In order to speed up the diffusion process, higher
temperatures would be required.
An apparent inconsistency in these trends seems to be sample T3. It was sintered for
68 min. at 2600 K after cold pressing at approximately 80 MPa. However, some irregularities
occurred during the processing of sample T3 that might in part explain its deviation. First, the
graphite die partially cracked during pressing so it may not have achieved the full benefits of the
estimated 80 MPa pressure that was applied by the cold press prior to the die cracking.
Secondly, the graphite punch stuck in the susceptor during sintering so that the 3 MPa of

143
pressure applied to samples during sintering was not brought to bear until the latter part of the
sintering cycle when the punch was dislodged from the walls of the susceptor.
Yet another apparent inconsistency brought out in Figure 4-2 is the similar densities of
sample T5 with samples T16, T17, and T18 despite its much shorter sintering time of six
minutes compared with the greater than 40 minutes for the later samples. However, because all
four samples exhibited liquid phase sintering, it would be expected that they would achieve rapid
densification due to the liquid phase filling the open pores of the microstructure. The effect of
the longer sintering time for sample T16, T17, and T18 can be seen in the lesser amount of UC
present in the grain boundaries of these samples compared with sample T5. In these cases that
utilize liquid phase sintering, the longer sintering time is not required to achieve densification but
does allow for greater volume diffusion to occur resulting in a more homogenous microstructure.
Pre-compaction
The effect of cold pressing pressure on final sample density is apparent from samples T1
and T2. Both were sintered for 20 min. at 2600 K but T2 was cold pressed at 140 MPa prior
to sintering. The pre-compacted sample, T2, has a much higher density of 91.9% TD vs.
76.8% TD for T1. This pre-compaction brings the particles into closer contact and increases
particle-to-particle contact area, which increases the sintering rate. Therefore, for the same time
and sintering temperature, a greater degree of sintering is achieved. Similar results can be seen
by comparing sample T19 at 74.5% TD (no pre-compaction) with sample T17 at 89.0% TD
(cold pressed at 120 MPa).
Similarly, a comparable density to sample T8 is achieved in sample T5 by doubling the
pre-compaction pressure to 250 MPa but with a lower sintering temperature of 2500 K instead

144
of 2800 K. Additionally, there is some consistency and repeatability apparent in samples T10
and T11. These were processed under the same conditions and have comparable relative
densities.
The effectiveness of the DMC pre-compaction can be estimated from samples T3 and
T13, which have comparable densities with fairly long sintering times. It is important to note that
the DMC compacted samples were sintered without a susceptor and had no pressure applied
during sintering whereas sample T3, like all other samples, had a small pressure of 3 MPa
applied by the punch during sintering. While this pressure is less than that typically used for hot
pressing its effect is perhaps not insignificant since the particles can deform more easily at higher
temperatures and any applied pressure would provide more energy available for sintering.
Therefore, the DMC pre-compaction can be estimated to be at least as effective as cold
pressing at 80 MPa.
Solid Solution Formation and X-ray Diffraction Results
Based on the diffraction patterns of the ternary samples processed in this study, it
becomes apparent that sintering time and temperature play a large role in producing solid
solutions of the mixed carbides. This is in keeping with the aforementioned discussion on the
importance of sintering time and temperature for producing high density (low porosity) mixed
carbides. The early samples, T1 through T6, were all processed at temperatures of 2600 K
and above. X-ray diffraction patterns of all these samples exhibited characteristics of solid
solution mixed carbides. Additionally, samples T13 through T15, which were processed for
long times of 90 min. at greater than 2700 K, all exhibited sharp peaks corresponding to d-
values for solid solution ternary carbides. These examples contrast greatly with the distinct,

145
separate mono-carbide phases exhibited, in particular, by samples T9 through T12. These
latter samples were processed at lower temperatures achieving only 2500 K.
However, both the degree of sintering and the degree of solid solution formation seem
to favor the former samples (T1 through T6) greater than would be expected from a mere 100
K or so difference in temperature. Instead, as pointed out earlier in the discussion of the binary
carbides, it is the enhanced sintering ability afforded through liquid phase sintering that enabled
greater densification of these samples and has also provided for enhanced diffusion to form the
solid solution mixed carbides. Without the liquid phase in the open spaces and grain
boundaries, diffusion is limited to surface and volume diffusion around the contact (neck) region
between carbide particles. As seen from the SEM images of samples T9 through T12, this area
is small in comparison to the greater amount of porous, open areas. The presence of a liquid
phase filling these areas and contacting the various carbide particles over a larger area provides
both for enhanced sintering and solid solution formation as noted in samples T1 through T6 and
T16 through T18.
For samples T14 and T15, no evidence of liquid phase sintering was noted although
temperatures approaching the melting point of WC were achieved with sample T15. However,
the greater degree of solid solution formation in these samples can be attributed to both much
higher temperature (200 K to 400 K higher) and much longer sintering times (60 to 90 min.
longer).
The presence of oxide phases is not unexpected since the furnace was known to be
leaking at different times in the early stages of this work and corresponding roughly to those
samples thus contaminated. Additionally, the presence of secondary phases of carbon and UC2

146
would also not be unexpected since the starting powder of uranium carbide was shown to be a
mixture of UC and UC2 as evidenced by the x-ray diffraction pattern of these powders (see
Figure 3-35). Furthermore, pickup of excess carbon would also be likely during sintering in the
graphite susceptor. This provides a partial explanation for the large graphite peak noted in
sample T11 (see Figure 3-49). This sample contained UH3 and graphite with a target C/M
ratio of 0.95, which would have made the final sintered product hypostoichiometric. The excess
carbon could have been a result of the low degree of sintering achieved for sample T11 leaving
unreacted graphite and uranium or simply a result of excess carbon picked up from the graphite
susceptor wall.
In general, there is good agreement with all the various metrics to which these samples
have been subjected. The x-ray diffraction patterns agree with the SEM images for samples T1
through T7, T16 through T18, and T20 showing a nearly homogenous microstructure. The x-
ray diffraction patterns reveal a largely solid solution material with well defined peaks around d-
values consistent with the mixed carbides—namely between the major components of ZrC and
NbC (see Figures 4-3 through 4-6 for example). The peaks of some samples appear slightly
broadened around the expected value. This broadening may be attributed to some gradients in
mixed carbide concentration due to inadequate sintering of these samples. Nevertheless, these
samples are at least approaching the goal of a dense, uniform solid solution of the mixed
carbides. Longer sintering times or higher temperatures would be needed to achieve this goal.
Other samples with SEM images pointing to only the initial stages of sintering (i.e. T9
through T12 and T19) also show agreement with their x-ray diffraction patterns. These very
broad peaks over the range of d-values (2θ) between the major components or separate peaks

147
corresponding to the original starting material show the samples have not formed a solid solution
(see Figures 4-7 through 4-9).
The elimination of oxide phases requires better control over the furnace atmosphere.
This is not an insurmountable goal especially in light of the absence of oxides detected in
samples processed after the leaking power feedthroughs were replaced on the induction
furnace. Additionally, care must be taken in the handling of the powders prior to being placed
in the furnace. Uranium carbide powders are especially susceptible to reactions with residual
oxygen even in otherwise inert atmospheres (Storms, 1967).
Elimination of secondary carbon and UC2 phases will require better control over
stoichiometry. Hypostoichiometric powder mixtures can easily be prepared, especially if the
starting materials are well characterized. However, elimination of carbon pickup from the
susceptor wall would be difficult. Sintering of the bare mixed carbide sample should be possible
as was done for samples T13 through T15. A refractory carbide pedestal such as ZrC would
be preferable over the graphite pedestal used for these samples to eliminate any remaining
carbon pickup. However, this approach would prevent any pressure from being applied to the
samples during sintering reducing the energy available for sintering. This also eliminates the
means to monitor compaction of the sample using the dial gauge contacting the punch. Other
options such as using a tungsten susceptor have other drawbacks such as possible
contamination of the sample.

2030
4050
6070
8090
100
2θ (
deg
.)
Figu
re 4
-3.
Com
paris
on o
f x-ra
y di
ffrac
tion
patte
rns o
f sam
ple
T1 w
ith th
e or
igin
al st
artin
g po
wde
rs.
0
0.2
0.4
0.6
0.81
intensity
148
T1:
(U, Z
r, N
b)C
ZrC
Nb
CU
C/U
C2

2030
4050
6070
8090
100
2θ (
deg
.)
Figu
re 4
-4.
Com
paris
on o
f x-ra
y di
ffrac
tion
patte
rns o
f sam
ple
T4 w
ith th
e or
igin
al st
artin
g po
wde
rs.
0
0.2
0.4
0.6
0.81
intensity
149
T4:
(U, Z
r, N
b)C
ZrC
Nb
CU
C/U
C2

2030
4050
6070
8090
100
2θ (
deg
.)
Figu
re 4
-5.
Com
paris
on o
f x-ra
y di
ffrac
tion
patte
rns o
f sam
ple
T6 w
ith th
e or
igin
al st
artin
g po
wde
rs.
0
0.2
0.4
0.6
0.81
intensity
150
T6:
(U, Z
r, N
b)C
ZrC
Nb
CU
C/U
C2

2030
4050
6070
8090
100
2θ (
deg
.)
Figu
re 4
-6.
Com
paris
on o
f x-ra
y di
ffrac
tion
patte
rns o
f sam
ple
T16
with
the
orig
inal
star
ting
pow
ders
.
0
0.2
0.4
0.6
0.81
intensity
151
T16
:(U
, Zr,
Nb
)CZ
rCN
bC

2030
4050
6070
8090
100
2θ (
deg
.)
Figu
re 4
-7.
Com
paris
on o
f x-ra
y di
ffrac
tion
patte
rns o
f sam
ple
T10
with
the
orig
inal
star
ting
pow
ders
.
0
0.2
0.4
0.6
0.81
intensity
152
T10
:(U
, Zr,
Nb
)CZ
rCN
bC

2030
4050
6070
8090
100
2θ (
deg
.)
Figu
re 4
-8.
Com
paris
on o
f x-ra
y di
ffrac
tion
patte
rns o
f sam
ple
T12
with
the
orig
inal
star
ting
pow
ders
.
0
0.2
0.4
0.6
0.81
intensity
153
T12
:(U
, Zr,
Nb
)CZ
rCN
bC

2030
4050
6070
8090
100
2θ (
deg
.)
Figu
re 4
-9.
Com
paris
on o
f x-ra
y di
ffrac
tion
patte
rns o
f sam
ple
T19
with
the
orig
inal
star
ting
pow
ders
.
0
0.2
0.4
0.6
0.81
intensity
154
T19
:(U
, Zr,
Nb
)CZ
rCN
bC

155
Pre-Compaction
Throughout this study, different methods of pre-compaction were studied as well as the
effectiveness of different apparatus for achieving consolidation of the mixed powders prior to
sintering. Some of the issues have already been discussed in the chapter on methods leading up
to the final technique employed in much of this study. However, some additional points should
be made with regard to the cold uniaxial pressing of samples. The use of stainless steel dies and
the addition of a binder/lubricant permitted the pressing of samples at high pressures and their
subsequent removal from the die and transfer to the graphite susceptor. However, some
problems did occur with this method. Occasionally, the sample would break into layers as it
was removed from the die as shown in Figure 4-10a. The problem is likely due to rebound of
the compact as it passes the end of the die during ejection. The material can expand radially,
creating tensile stresses and cracks in the sample (see Figure 4-10b) and causing it to break into
layers as shown in Figure 4-10a. This perhaps points to the unsuitability of stearic acid as a
binder/lubricant for these mixed carbide powders.
Hot Pressing
The hot-pressed ZrC-NbC sample, HP2, has a similar microstructure to some of the
cold pressed and sintered binary carbide samples of the same composition. However, it
appears slightly more consolidated and proved much harder than the sintered binary samples
during polishing. This greater degree of sintering supports the estimate of 3100 K for the hot
pressing temperature since it is greater than the 2800 K used in sintering by induction heating.
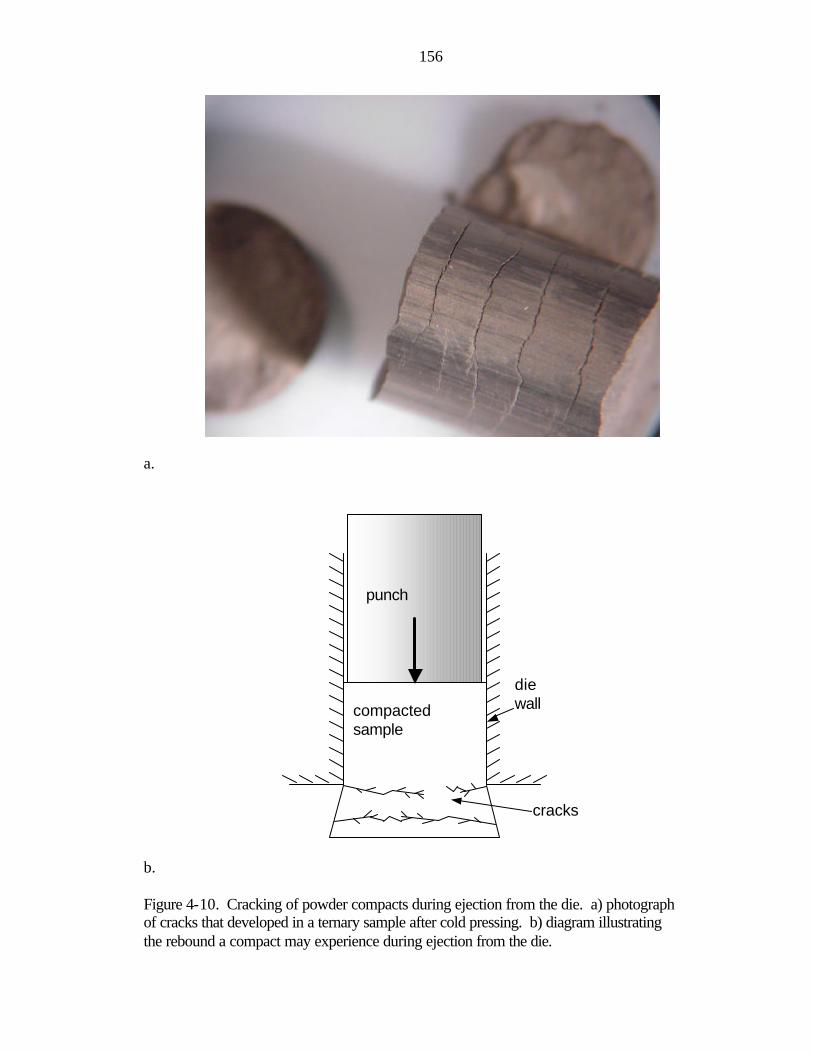
156
a. b. Figure 4-10. Cracking of powder compacts during ejection from the die. a) photograph of cracks that developed in a ternary sample after cold pressing. b) diagram illustrating the rebound a compact may experience during ejection from the die.
compacted sample
punch
die wall
cracks

157
Additional compaction of the samples through hot pressing should be possible since compaction
was noted to be continuing, although very slowly, when the experiment had to be halted due to
equipment problems. This points to the particular usefulness of this method when coincident
high temperatures and high pressures are needed such as in the case of sintering mixed
refractory carbides.
Suggested Processing Methodology
Based on both the achievements and the noted shortcomings of this work, some
improvements can be made in the methodology to better ensure that a consistent and uniform,
high-quality, mixed carbide is produced. The specifications for such a material are listed in
Table 4-1.
Table 4-1. Desired characteristics of mixed carbide nuclear fuels.
Characteristic
Low porosity, >95% TD
Solid solution, homogenous
Single phase, no carbon or UC2
Low impurities (no oxide phases)
In order to achieve these goals a suggested processing scheme is outlined below in
Table 4-2.

158
Table 4-2. Suggested processing methodology for producing high quality mixed carbide nuclear fuels.
Step Comment
Powder characterization Determine C/M using a carbon determinator to reduce/eliminate secondary phases of C and UC2
Handle all powders in an inert atmosphere glove box
Reduce/eliminate reactions with atmosphere contaminating the powders and causing oxide contamination in the mixed carbide
Mix carbide powders with UH3 and graphite to produce a hypostoichiometric mixed carbide
Mix in C/M ratios that allow for carbon pickup that will occur during sintering
Press at 120 MPa or higher Provide good contact between particles for sintering; increase green density
Sinter in a graphite susceptor with >3 MPa applied to the punch according to one of the following schedules:
Eliminate porosity and allow for diffusion to produce a uniform solid solution
A) >2700 K for 60 to 90 min. Allow for liquid phase sintering of mixtures produced from hyperstoichiometric UC/UC2
B) >2800 K for 60 to 90 min. Allow for liquid phase sintering of mixtures derived from UC produced by reacting graphite with uranium from the decomposition of UH3
Sinter without a susceptor on a ZrC pedestal Produce a uniform profile by allowing for diffusion of excess carbon from the surface picked up during sintering in the graphite susceptor

159
CONCLUSIONS AND RECOMMENDATIONS
The intended goal of this work--namely the processing of low porosity, single phase,
solid solution, mixed uranium/refractory metal carbides--was essentially achieved in sample T6.
This sample had a density greater than 95% TD and was almost entirely single phase, solid
solution except for a small amount of UC2 present in the microstructure. A processing time of
20 min. above 2600 K and a total time of 142 min. above 2500 K after cold pressing at 150
MPa was required to achieve this state. In all, 28 carbide samples were processed of which 15
were ternary carbides with 13 of these bearing uranium in 5% or 10% U/M ratio. Based on the
processing results from these samples, it can be concluded that high sintering temperatures
greater than 2600 K for times longer than one hour would be required to achieve the above
stated goal.
Solid solution formation was noted in the majority of samples and corresponded to
those exhibiting evidence of liquid phase sintering. Furthermore, high density (low porosity)
samples were produced by using some method of pre-compaction such as cold uniaxial
pressing and sintering at temperatures greater than 2600 K for at least 20 min. Pre-compaction
is necessary to provide a high green density to the compact and bring the various particles
together increasing their contact area for sintering. High temperatures above 2600 K are
necessary to achieve liquid phase sintering using hyperstoichiometric UC/UC2. This liquid phase
provides rapid densification and enhances both sintering and solid solution formation.

160
While pre-compaction is necessary to achieve high densities, it is often difficult.
Pressing in the same graphite die/susceptor is not satisfactory as it often resulted in cracking of
the die and the intimate contact of the sample with the die wall at high pressures leads to
diffusion bonding during sintering. Pressing in stainless steel or other dies using a
binder/lubricant produces better results but often suffers from cracking of the compact prior to
sintering due to stresses incurred during ejection from the die. Pre-compaction without a
binder/lubricant is possible using dynamic magnetic compaction. More work is required
applying this process to mixed uranium/refractory metal carbides to determine if high density
samples can be produced. Of particular importance is the relationship between particle size and
size distribution and the degree of compaction achieved. A better understanding of this
relationship for this application is necessary to achieve the goal of greater than 95% TD. Other
pre-compaction methods such as isostatic pressing should be investigated for achieving greater
uniformity in pressing and green density.
A proposed processing methodology was outlined in the previous chapter based on
experience gained during this work. In part, this protocol requires better handling procedures
and better control over the processing of the starting powders prior to sintering. This will help
reduce or eliminate the presence of unwanted impurities and oxides in the final mixed carbide
material. Uranium hydride powders were successfully produced from uranium metal rod and
proved effective at maintaining the purity of the final compact. This approach also reduced the
appearance of secondary carbon phases through better control over the C/M ratio than by using
hyperstoichiometric UC/UC2 powders. Additional improvements can likely be made by using
finer powders in the starting powder mixture. This would reduce the sintering time for

161
producing a near fully dense, solid solution mixed carbide. This would also reduce the large
degree of grain growth experienced in samples sintered for long times at these high
temperatures.
Using the methodology developed in this work a series of mixed uranium/refractory
metal carbides have been produced over a range of compositions. Additional samples will be
necessary for testing and qualification under conditions required for space nuclear power
applications. In particular, work is required to study the melting points of these ternary carbides
to determine, in part, their suitability as a nuclear fuel for advanced nuclear thermal propulsion.
Integral with this study of melting point is the full characterization of these samples including C/M
ratio, which has been shown to greatly affect the melting point and behavior of mixed carbides.
Finally, the processing of mixed uranium/refractory metal carbides is challenging,
requiring high temperatures for moderate to long time periods. Additionally, the handling of
powders that are pyrophoric or susceptible to reaction with the ambient atmosphere requires
careful handling procedures. The experience gained through this work in the areas of induction
heating, powder processing, pre-compaction, and melting point determination will enable further
study and qualification of mixed uranium/refractory metal carbides for space nuclear power and
propulsion applications. These or other similar advanced nuclear fuels can then be applied to
meeting the challenges of space exploration in the 21st century.

162
LIST OF REFERENCES
Accary, A. and R. Caillat, "Sintering with a Chemical Reaction as Applied to Uranium Monocarbide," Powder Metallurgy, ed. by W. Leszynski, Interscience Publishers, New York, NY, 1961
Agnew, H. M., "Gas-cooled Nuclear Power Reactors," Scientific American, 244, 6, June
1981, pp. 55-63 Angelo Jr., J. A. and D. Buden, Space Nuclear Power, Orbit Book Company, Inc., Malabar,
FL, 1985 Bale, C. W., and A.D. Pelton, "Optimization of Binary Thermodynamic and Phase Diagram
Data" in Metallurgical Transactions B vol.14b March, American Society for Metals and the Metallurgical Society of AIME, Quebec, Canada, 1982
Barletta, R. E., P. E. Vanier, J. W. Adams, and J. F. Svandrlik, "Carbon Erosion in Hydrogen -
The "Mid-Band" Problem Revisited," in 10th Symposium On Space Nuclear Power and Propulsion, ed. by M. S. El-Genk and M. D. Hoover, AIP Conference Proceedings # 930103, 1993, pp. 245-249
Bennet, G. L., H. B. Finger, T. J. Miller, W. H. Robbins, and M. Klein, "Prelude To The
Future: A Brief History of Nuclear Thermal Propulsion In The United States," in A Critical Review of Space Nuclear Power and Propulsion, ed. by M. S. El-Genk, American Institute of Physics, New York, NY, 1994, pp. 221-267
Butt, D., E. Storms, T. Wallace Sr., and L. Wang, Knowledge Status Report on Mixed
Uranium/Refractory Metal Carbides Useful for Nuclear Thermal Propulsion, LA-CP-93-41, Nuclear Fuels Technology Group, Los Alamos National Lab, 1993
Carmack, W. J., Melting Studies on Refractory Carbides, M. S. Thesis, University of
Washington, 1991 Chelluri, B. and J. P. Barber, "Full-Density, Net-Shape Powder Consolidation Using Dynamic
Magnetic Pulse Pressures," JOM, July 1999, pp.36-37 Cullity, B. D., Elements of X-ray Diffraction, 2nd ed., Addison-Wesley Publishing Company
Inc., Reading MA, 1978

163
Czechowicz, D. G., F. G. Hampel, and E. K. Storms, "High Temperature Mixed Carbide Fuels
for Space Propulsion Reactors," in 8th Symposium On Space Nuclear Power and Propulsion, ed. by M. S. El-Genk and M. D. Hoover, AIP Conference Proceedings #910116, Albuquerque, New Mexico, 6 January 1991, pp. 1059-1063
Davidson, Keith V., Brief Review of Rover Fuel Development at Los Alamos, in 8th
Symposium On Space Nuclear Power and Propulsion, ed. by M. S. El-Genk and M. D. Hoover, AIP Conference Proceedings #910116, Albuquerque, New Mexico, 6 January 1991, pp. 1015-1023
Diaz, N. J. and S. Anghaie, "Summary Report on Base Technology Program for Russian
Nuclear Fuels and High Temperature Materials-Part A. Solid Solution Ternary Uranium Carbides (U, Zr, Nb)C and (U, Zr, Ta)C," in US Government Information Exchange, Albuquerque, NM, September, 1994
D'yakov, E. and M. Tishchenko, Manufacturing and Testing of Solid Solution Ternary
Uranium Carbides (U, Zr, Nb)C and (U, Zr, Ta)C Fuel in Hot Hydrogen, INSPI-University of Florida Report prepared by RI of SIA LUTCH, Podolsk, Russia, July 1994
El-Wakil, M. M., Nuclear Energy Conversion, American Nuclear Society, LaGrange Park,
IL, 1982, pp. 271-274, 443-447 Felice, R. A., "A New Type of Pyrometer Solves Classic Problems," Industrial Heating, 62,
9, Sept. 1995 Fischer, J. J., "Hot-Pressing Mixed Carbides of Ta, Hf, and Zr," Ceramic Bulletin, 43, 3,
1964, pp. 183-185 Furman, E. M., Thermal Hydraulic Design Analysis of Ternary Carbide Fueled Square-
Lattice Honeycomb Nuclear Rocket Engine, M. S. Thesis, University of Florida, 1999
Ganguly, C., P. V. Hegde, G. C. Jain, U. Basak, R. S. Mehrotra, S. Majumdar, and P. R. Roy,
"Development and Fabrication of 70% PuC-30% UC Fuel for the Fast Breeder Test Reactor in India," Nuclear Technology, 72, Jan. 1986, pp. 59-69
Gutierrez, R. L. and R. J. Herbst, Preparation of Carbide-Type, Advanced LMFBR Fuel
Pellets for Irradiation Testing, LA-8304-MS, Los Alamos National Laboratory, 1980 Haggerty, J. S., "Reaction Sintering" in Engineered Materials Handbook Vol. 4, Ceramics
and Glasses, ed. by S. J. Schneider, S. J. Jr., ASM International, The Materials Information Society, 1991, pp. 291-295

164
Harry, G. R., Status of steady-state irradiation testing of mixed-carbide fuel designs, LA-
UR-83-1248, Los Alamos National Laboratory, 1983 Herbst, R. J., and R. B. Matthews, Uranium-Plutonium Carbide as an LMFBR Advanced
Fuel, LA-9259-MS, Los Alamos National Laboratory, 1982 Holden, R. B., Ceramic Fuel Elements, Gordon and Breach Science Publishers, New York,
NY 1966 Kneif, R. A., Nuclear Engineering: Theory and Technology of Commercial Nuclear
Power, Hemisphere Publishing Corporation, Washington, DC, 1992, pp. 241-254 Knight, T. and S. Anghaie, "Processing Of Pseudo-Ternary Carbide Fuels For High
Temperature Space Nuclear Reactors," in 16th Symposium on Space Nuclear Power and Propulsion, edited by M. S. El-Genk, New York, AIP Conference Proceedings, 1999
Koenig, D. R., Experience Gained from the Space Nuclear Rocket Program (Rover), LA-
10062-H, UC-33, Los Alamos National Laboratory, May 1986 Kwon, Oh-Hun, "Liquid-Phase Sintering" in Engineered Materials Handbook Vol. 4,
Ceramics and Glasses, ed. by S. J. Schneider, S. J. Jr., ASM International, The Materials Information Society, 1991, pp. 285-290
Lung, M., Perspectives of the Thorium Fuel Cycle, Seminar at JRC-Ispra July 2, 1996 Lyon, L. L., Performance of (U, Zr)C-Graphite (Composite) and of (U, Zr)C (Carbide)
Fuel Elements in the Nuclear Furnace 1 Test Reactor, LA-5398-MS, Los Alamos National Laboratory, 1973
Massalski, T. B., ed., Binary Alloy Phase Diagrams, Vol. I, American Society for Metals,
Metals Park, OH 1986 Matthews, R. B., Blair, K. Chidester, and K. Davidson, "Carbide Fuels for Nuclear Thermal
Propulsion," in Proceedings of the AIAA/NASA/OAI Conference on Advanced SEI Technologies, AIAA-91-3455, 1991
Matthews, R. B., R. E. Baars, H. T. Blair, D. P. Butt, R. E. Mason, W. A. Stark, E. K.
Storms, and T. C. Wallace, "Fuels for Space Nuclear Power and Propulsion," in A Critical Review of Space Nuclear Power and Propulsion, ed. by M. S. El-Genk, American Institute of Physics, New York, NY, 1994, pp. 179-220

165
Matzke, Hj., Science of Advanced LMFBR Fuels, Elsevier Science Publishers, Amsterdam, The Netherlands, 1986
Maxline Temperature and Acquisition/Control System, Installation and Operation Manual, 4th
edition, IRCON, Inc., Niles, IL, Jan. 1988 Neuer, G., "Spectral and Total Emissivity Measurements of Highly Emitting Materials,"
International Journal of Thermophysics, 16, 1, 1995, pp. 257-265 PSCC, Media Relations, Fort St. Vrain Nuclear Generating Station, Public Service
Company of Colorado, Denver, CO, June 1995 Richerson, D. W., Modern Ceramic Engineering, Marcel Dekker, Inc., New York, NY,
1992 Stinton, D.P., S.M. Tiegs, W.J. Lackey, and T.B. Lindemer, "Rate-Controlling Factors in the
Carbothermic Preparation of UO2-UC2-C Microspheres," Journal of the American Ceramics Society, 62, 11-12, 1979, pp. 596-599
Storms, E. K., The Refractory Carbides, Academic Press, New York, NY, 1967 Storms, E. K., The Behavior of ZrC1-x and UyZr1-yC1-x in Flowing Hydrogen at Very
High Temperatures, LA-12043-MS, Los Alamos National Laboratory, 1992 Taub, J. M., A Review of Fuel Element Development for Nuclear Rocket Engines, LA-
5931, UC33, Los Alamos National Laboratory, June 1975 Tosdale, J. P., Refractory Metal-Carbide Systems, M. S. Thesis, IS-T-219, Ames
Laboratory, Iowa State University, Ames, IA, 1967 Touloukian, Y. S. and D. P. DeWitt, Thermal Radiative Properties-Nonmetallic Solids,
IFI/Plenum, New York, NY, 1972 Walton, James T., "An Overview of Tested and Analyzed NTP Concepts," in Proceedings of
the AIAA/NASA/OAI Conference on Advanced SEI Technologies, AIAA-91-3503, 1991
Wang, L. L., H. G. Moore, and J. W. Gladson, "Synthesis of (U, Zr)C Solid Solutions Under
Exothermic Conditions," In 11th Symposium On Space Nuclear Power and Propulsion, ed. by M. S. El-Genk and M. D. Hoover, AIP Proceedings #940101, Albuquerque, New Mexico, 9 January 1994, pp. 235-244

166
Weimer, A. W., ed., Carbide, Nitride and Boride Materials Synthesis and Processing, Chapman & Hall, New York, NY, 1997, pp. 639-640.
Widargo, R. and S. Anghaie, "Nuclear Design Analysis of Square-Lattice Honeycomb Space
Nuclear Rocket Engine," in 16th Symposium on Space Nuclear Power and Propulsion, edited by M. S. El-Genk, New York, AIP Conference Proceedings, 1999
Zaitzev, V. A., Processing and Testing of Uranium-Zirconium Carbonitrides and Cermet
Composition Fuels, INSPI-University of Florida Report prepared by RI of SIA LUTCH, Podolsk, Russia, July 1994

167
BIOGRAPHICAL SKETCH
Travis Warren Knight was born in Gainesville, Florida on November 4, 1970. Travis
attended schools in Dixie and Union Counties before graduating as Salutatorian from Union
County High School in June 1988. From there, he attended the University of Florida where he
was awarded a Bachelor of Science in nuclear engineering degree with honors in August 1994.
While an undergraduate, Travis worked three semesters as a student engineer (co-op) at River
Bend Nuclear Station in St. Francisville, Louisiana. Following an internship with the Integral
Fast Reactor Program at Argonne National Laboratory-West in Idaho Falls, Idaho, Travis
returned to UF for graduate studies as a Fellow in the Applied Health Physics Fellowship
Program of the Department of Energy. His master's research involved studies in Monte Carlo
radiation transport methods. Following an internship at the Oak Ridge National Laboratory,
Travis returned to UF to conduct research into nuclear fuels and materials for space nuclear
power and propulsion applications. This work was completed in the Ultra-high Temperature
Materials Laboratory of the Innovative Nuclear Space Power and Propulsion Institute (INSPI)
at the University of Florida. During his studies he was supported as a Department of Defense
Fellow in the AASERT program. Travis was also awarded the James E. Swander Memorial
Scholarship in 1998.