Probing Lithiation Kinetics of Carbon-Coated ZnFe O ... - · PDF fileProbing Lithiation...
8
Probing Lithiation Kinetics of Carbon-Coated ZnFe 2 O 4 Nanoparticle Battery Anodes Fernando Martinez-Julian, † Antonio Guerrero, † Marta Haro, † Juan Bisquert, † Dominic Bresser, ‡ Elie Paillard, ‡ Stefano Passerini, ‡,§ and Germa ̀ Garcia-Belmonte* ,† † Photovoltaics and Optoelectronic Devices Group, Departament de Física, Universitat Jaume I, 12071 Castelló , Spain ‡ Institute of Physical Chemistry & MEET Battery Research Centre, University of Muenster, Corrensstr. 28/30 & 46, 48149 Muenster, Germany § Helmholtz Institute Ulm, Karlsruhe Institute of Technology, Albert-Einstein-Allee 11, 89081 Ulm, Germany ABSTRACT: The investigation of the lithiation−delithiation kinetics of anodes comprising carbon-coated ZnFe 2 O 4 nanoparticles is reported in here. The study confirmed that, as occurring with other conversion electrodes, lithiation of ZnFe 2 O 4 nanoparticles is a multistep process involving the presence of intermediate Li−Zn−Fe−O phases as precursors for the formation of amorphous Li 2 O. A detailed knowledge on the reaction kinetics of the involved electrochemical mechanisms has been achieved by using impedance spectroscopy. It has been observed that lithiation reactions introduce a long delay that limits the electrode charging, not related to diffusion mechanisms. The sloping curve following the conversion plateau of the galvanostatic discharge is connected to a retardation effect in the reaction kinetics. This limitation is seen as an additional resistive process originated by the specific lithiation microscopic features. It is concluded that capacitance spectra allow distinguishing two separate processes: formation of kinetically favored intermediate Li−Zn−Fe−O phases and subsequent reaction to produce highly dispersed LiZn and Fe 0 in an amorphous Li 2 O matrix. A detailed electrical model is provided accounting for the overall electrode lithiation process. ■ INTRODUCTION Li-ion batteries have become core devices for the consumer electronics industry. Materials for commercial battery electro- des are mostly chosen from a set of intercalation compounds that reversibly accommodate lithium ions in host sites in the lattice without severely distorting the structure. In most transition metal compounds such as LiCoO 2 , Li- Ni 1−y−z Mn y Co z O 2 , LiFePO 4 , and Li 4 Ti 5 O 12, redox activity is restricted to a few exchanged electrons. Therefore, intercalation materials exhibit intrinsic limitations that make them unviable when high capacity requirements have to be fulfilled as in the case of large scale or automotive applications. 1−3 During the past decades a new family of electrode materials operating under the so-called conversion reaction has been intensely studied. 4 For these compounds lithiation occurs through the reaction that involves a complete metal reduction as M a X b + (bn)Li ↔ aM+ bLi n X, where M = transition metal, X = anion (O, S, N, P, and F), and n = anion formal oxidation state. Conversion reaction is able to accommodate larger amount of Li atoms into the lithium binary compound Li n X, which explains specific capacities exceeding 1000 mAh g −1 as reported for many compounds. Interestingly, conversion materials usually show good reversibility because of the formation of a nanostructured matrix that comprises metallic nanoparticles surrounded by amorphous Li n X phases. Intimate phase contact facilitates reactivity as evidenced by the observation of remaining metallic nanoparticles after extended oxidation/ reduction cycling. 4 Despite their potentialities, conversion compounds present a series of performance limitations that hinders their straightforward application in commercial devices. There is a strong structural rearrangement concomitant to the chemical reaction, usually accompanied by material decohesion and cycling performance loss. A large Coulombic inefficiency is often observed in the first cycle, and a voltage hysteresis, that in some cases even exceeds 1 V, precludes incorporation into commercial batteries. 5 In addition to conversion materials, other reactions of interest include Li alloying with metal and semimetal atoms which are able to give very high capacities, although showing problems related to large volume changes during the dealloying process. An important research effort during the past decade has allowed progressing into the understanding of the conversion reaction mechanism. Structural and chemical changes have been monitored by means of several spectroscopic techniques such as transmission electron microscopy (TEM), electron energy-loss spectroscopy (EELS), 6 X-ray diffraction (XRD), 7 and solid-state nuclear magnetic resonance (NMR). 5 In most cases, it has been identified that the electrochemical mechanism for the transformation of the pristine M a X b phase into Li n X and metallic particles is a multistep process that entails the Received: December 26, 2013 Revised: March 3, 2014 Published: March 7, 2014 Article pubs.acs.org/JPCC © 2014 American Chemical Society 6069 dx.doi.org/10.1021/jp412641v | J. Phys. Chem. C 2014, 118, 6069−6076
Transcript of Probing Lithiation Kinetics of Carbon-Coated ZnFe O ... - · PDF fileProbing Lithiation...

Probing Lithiation Kinetics of Carbon-Coated ZnFe2O4 NanoparticleBattery AnodesFernando Martinez-Julian,† Antonio Guerrero,† Marta Haro,† Juan Bisquert,† Dominic Bresser,‡
Elie Paillard,‡ Stefano Passerini,‡,§ and Germa Garcia-Belmonte*,†
†Photovoltaics and Optoelectronic Devices Group, Departament de Física, Universitat Jaume I, 12071 Castello, Spain‡Institute of Physical Chemistry & MEET Battery Research Centre, University of Muenster, Corrensstr. 28/30 & 46, 48149Muenster, Germany§Helmholtz Institute Ulm, Karlsruhe Institute of Technology, Albert-Einstein-Allee 11, 89081 Ulm, Germany
ABSTRACT: The investigation of the lithiation−delithiation kinetics of anodescomprising carbon-coated ZnFe2O4 nanoparticles is reported in here. The study confirmedthat, as occurring with other conversion electrodes, lithiation of ZnFe2O4 nanoparticles is amultistep process involving the presence of intermediate Li−Zn−Fe−O phases asprecursors for the formation of amorphous Li2O. A detailed knowledge on the reactionkinetics of the involved electrochemical mechanisms has been achieved by usingimpedance spectroscopy. It has been observed that lithiation reactions introduce a longdelay that limits the electrode charging, not related to diffusion mechanisms. The slopingcurve following the conversion plateau of the galvanostatic discharge is connected to aretardation effect in the reaction kinetics. This limitation is seen as an additional resistiveprocess originated by the specific lithiation microscopic features. It is concluded thatcapacitance spectra allow distinguishing two separate processes: formation of kineticallyfavored intermediate Li−Zn−Fe−O phases and subsequent reaction to produce highlydispersed LiZn and Fe0 in an amorphous Li2O matrix. A detailed electrical model is provided accounting for the overall electrodelithiation process.
■ INTRODUCTION
Li-ion batteries have become core devices for the consumerelectronics industry. Materials for commercial battery electro-des are mostly chosen from a set of intercalation compoundsthat reversibly accommodate lithium ions in host sites in thelattice without severely distorting the structure. In mosttransition metal compounds such as LiCoO2, Li-Ni1−y−zMnyCozO2, LiFePO4, and Li4Ti5O12, redox activity isrestricted to a few exchanged electrons. Therefore, intercalationmaterials exhibit intrinsic limitations that make them unviablewhen high capacity requirements have to be fulfilled as in thecase of large scale or automotive applications.1−3 During thepast decades a new family of electrode materials operatingunder the so-called conversion reaction has been intenselystudied.4 For these compounds lithiation occurs through thereaction that involves a complete metal reduction as MaXb +(bn)Li ↔ aM + bLinX, where M = transition metal, X = anion(O, S, N, P, and F), and n = anion formal oxidation state.Conversion reaction is able to accommodate larger amount ofLi atoms into the lithium binary compound LinX, whichexplains specific capacities exceeding 1000 mAh g−1 as reportedfor many compounds. Interestingly, conversion materialsusually show good reversibility because of the formation of ananostructured matrix that comprises metallic nanoparticlessurrounded by amorphous LinX phases. Intimate phase contactfacilitates reactivity as evidenced by the observation ofremaining metallic nanoparticles after extended oxidation/
reduction cycling.4 Despite their potentialities, conversioncompounds present a series of performance limitations thathinders their straightforward application in commercial devices.There is a strong structural rearrangement concomitant to thechemical reaction, usually accompanied by material decohesionand cycling performance loss. A large Coulombic inefficiency isoften observed in the first cycle, and a voltage hysteresis, that insome cases even exceeds 1 V, precludes incorporation intocommercial batteries.5 In addition to conversion materials,other reactions of interest include Li alloying with metal andsemimetal atoms which are able to give very high capacities,although showing problems related to large volume changesduring the dealloying process.An important research effort during the past decade has
allowed progressing into the understanding of the conversionreaction mechanism. Structural and chemical changes havebeen monitored by means of several spectroscopic techniquessuch as transmission electron microscopy (TEM), electronenergy-loss spectroscopy (EELS),6 X-ray diffraction (XRD),7
and solid-state nuclear magnetic resonance (NMR).5 In mostcases, it has been identified that the electrochemical mechanismfor the transformation of the pristine MaXb phase into LinX andmetallic particles is a multistep process that entails the
Received: December 26, 2013Revised: March 3, 2014Published: March 7, 2014
Article
pubs.acs.org/JPCC
© 2014 American Chemical Society 6069 dx.doi.org/10.1021/jp412641v | J. Phys. Chem. C 2014, 118, 6069−6076

intermediate formation of ternary Li−M−X phases before suchconversion takes place. The fluorides/oxides also exhibitadditional reversible capacity at lower voltages beyond theirtheoretical capacity through mechanisms that are still poorlyunderstood. Although evident progress in structural andthermodynamic processes underlying lithiation of conversionmaterials has been achieved, a detailed knowledge on theconversion (and related reactions) kinetics would help having acomplete picture on the electrochemical mechanisms accom-panying the inherent structural rearrangements. In condensedmatter, the reaction rate is largely affected by stronginteractions caused by phase transitions and rearrangements.8
Despite inherent complex thermodynamics, electrode kineticlimitations are commonly connected to the solid-state diffusionof ionic and electronic species. This is the case of intercalationcompounds that exhibit a charging hindrance connected to adelay in the ion uptake caused by the Li+ transport in the hostmaterial. However, we have pointed out recently9 that solid-state reactions as those occurring in conversion and alloyingelectrodes can produce an intrinsic delay linked with thereaction mechanism itself. This is then the specific aim of thiswork: how to extract kinetic information on the lithiationmechanisms occurring in a highly reversible zinc ferritenanoparticle battery electrode.Zinc ferrite electrodes are selected in this work because they
exhibit large specific capacity (>1000 mAh g−1) whilemaintaining rather good kinetic performance upon charge/discharge high rate response.10 This is achieved by carboncoating ZnFe2O4 nanoparticles, resulting in an amorphouscarbon shell covering them. This procedure assures specificcapacities of ca. 1000 mAh g−1 for low specific currents, whichis more than 5 times the specific capacity obtainable forstandard anodes as Li4Ti5O12(LTO). At rates as high as 1 A g−1
only about 10% of the low-rate specific capacity is lost, and therate advantage is preserved when compared to nanoparticulateLTO.3,10 Carbon coating improves significantly not only thehigh rate capability of the resulting electrodes but also thecycling stability as well as the capacity retention after theapplied C rate test. Comparing the discharge voltage profiles forcarbon-coated ZnFe2O4−C and uncoated ZnFe2O4, animportant reduction of the initial voltage drop is observed atelevated C rates for the former material. Additionally, thecarbon coating is observed to enhance the electrode kinetics byensuring electron supply to the nanoparticles.10 This good rateperformance suggests us that ion diffusion cannot be regardedas a limiting process of the electrode kinetic response and thatZnFe2O4−C based anodes are proper candidates to explore thekinetics of the lithiation mechanisms avoiding diffusionhindrance.Lithiation kinetics will be probed here by means of
electrochemical impedance spectroscopy (EIS). This techniquedirectly faces the kinetics of the electrical response of thosemechanisms governing the change in the electrode state ofcharge. We have identified in this work, by using EIS, thatlithiation reactions in conversion materials introduce a longdelay that limits the electrode charging. This limitation is seenas an additional resistive process originated by the specificfeatures of the microscopic lithiation mechanism. Combinedwith the large capacitive process caused by the electrodecharging, the reaction resistance yields a distinctive signature inthe imaginary part of the capacitive spectra. As a result, it isfeasible to extract a reaction frequency that establishes the timescale at which the particular solid-state reaction occurs. The
analysis of the impedance/capacitance response of conversionelectrodes performed here opens new room for understandingkinetic features of the lithiation process that are usually hiddenby relying exclusively upon structural characterization techni-ques.
■ EXPERIMENTAL RESULTSElectrochemical Response. Preparation procedure and
electrochemical response of ZnFe2O4−C nanoparticle anodeshave been fully addressed in previous work.10 A two-electrodeSwagelok cell assembly with lithium metal as the counter/reference electrode was used. The setup includes a Whatmangrade GF/C 260 μm thick as the separator, and the electrolytesolution obtained by dissolving 1 M LiPF6 into a mixture ofethylene carbonate (EC) and dimethyl carbonate (DMC) (EC/DMC, 50:50 w/w). Three first cyclic voltammograms at scanrate 0.05 mV s−1 can be observed in Figure 1a. Remarkably, the
voltammogram does not change significantly upon furthersweeps, confirming a highly reversible uptake and release oflithium once the initial structural changes are completed. Afterthe first scan a large reduction (cathodic) peak is exhibited atapproximately 1.0 V, which was interpreted in terms of themain conversion reaction as ZnxFeyO + 6Li+ + 6e− → Zn0 +2Fe0 + 3Li2O. By means of this reaction, previously formedoxide phases resulting from intermediate Li−Zn−Fe−Ocompounds are transformed into metallic Zn and Fe and Lioxide. A minor shoulder around 1.2 V is believed to be relatedto the formation of intermediate ternary phases including Znand Fe, with Li and O of different compositions. Anodiccurrent shows a maximum at 1.6 V during the oxidation stage.It has been also proposed that, at lower cathodic potentials, analloying reaction involving Zn and Li takes place as Zn0 + Li+ +e− → LiZn. This additional reaction would explain theincrement in the specific capacity below 0.8 V. In summary,the electrode behavior can be assimilated to a typical
Figure 1. (a) Cyclic voltammogram of a ZnFe2O4-C (13.05 wt % C)/SuperC65/CMC (75/20/5) electrode at 0.1 mV s−1 showing thestable response after the first cycle. (b) Voltage profile of thegalvanostatic cycle of a ZnFe2O4-C electrode at 40 mA g−1 C/20 rate(first cycle at 20 mAh g−1 C/40 rate).
The Journal of Physical Chemistry C Article
dx.doi.org/10.1021/jp412641v | J. Phys. Chem. C 2014, 118, 6069−60766070

conversion mechanism including an additional alloying reactionwith Zn and that can be viewed as ZnFe2O4 + 9Li+ + 9e− →LiZn + 2Fe0 + 4Li2O.
10
As observed in Figure 1a, the first scan yields a distinctivecurve caused by the general structural rearrangement of theelectrode material. A detailed analysis of the phase transitionswas published based on in-situ XRD measurements upon initialgalvanostatic lithiation−delithiation.10 That analysis confirmedthe formation of intermediate Li−Zn−Fe−O compounds thatfinally produce metallic Zn and Fe and amorphous Li oxide.Upon delithiation, the materials remain amorphous or, at least,quasi-amorphous, meaning that the resulting crystalline grainsare simply too small to be detected by means of XRD, incommon with other conversion compounds.11,12 After thesubsequent delithiation sweep the formation of amorphousZnO and Fe2O3, or even ZnFe2O4, appears likely as observedfor other transition metal ferrites as CoFe2O4 or NiFe2O4 using57Fe Mossbauer spectroscopy that revealed the completereoxidation of Fe0 to Fe3+.13,14 Although the definite structuralcomposition in the charged (delithiated) state is not yet fullyunderstood,15,16 the previous arguments leads us to propose inFigure 2 the main reactions involved in the lithiation−delithiation of the zinc ferrite nanoparticles.
Galvanostatic charge−discharge test for ZnFe2O4-C electro-des within the voltage range 0.0−3.0 V vs Li/Li+ at a rate of0.04 A g−1 can be seen in Figure 1b after the first scan. Asexpected, a plateau is observed at potentials around 1.0 V,signaling the occurrence of the conversion reaction with theformation of metallic Zn and Fe nanoparticles and the oxideLi2O. At lower charge states, cell voltage decreases steeply, thusindicating that the formations of intermediate phasescomprising Li−Zn−Fe−O are both energetically and kineticallyfavored. At potentials below 0.5 V an increment in the specificcapacity appears as a tail with respect to the conversion-relatedplateau. This additional capacity is believed to be linked withthe aforementioned alloying reaction of Li with metallic Zn.Full information about the electrochemical behavior andstructural characteristics of zinc ferrite electrodes can be seenin a previous work.10
Impedance and Capacitance Responses. EIS isperformed at open-circuit voltage (no direct current flowing)in different charge states, with amplitude of 20 mV in the
frequency range from 106 Hz down to 0.001 Hz. After the firstcycle (Figure 1a), a stable cyclic voltammogram is observedwhich informs on the reversibility of the conversion reaction.The Nyquist plots in Figure 3 consist of two well-defined parts:the high-frequency semicircle and an inclined low-frequencyline. Some of the impedance features are originated from well-known processes.17 At high frequencies, a rather constant arccorresponds to the parallel connection between the double-layer capacitance Cdl ≈ 50 μF and surface charge transferresistance Rct ≈ 25 Ω. An additional series resistance accountsfor the solution contribution Rs ≈ 12 Ω. The high-frequencycircuit elements are observed to be rather voltage independent,which allows connecting them to mechanisms occurring at theinterface. The low-frequency response points to the occurrenceof a voltage-modulated process which gives rise to a capacitive-like behavior. The interpretation relies on the so-calledchemical capacitance that informs on the electrode ability ofvarying the amount c of reacted Li+ upon application of adifferential change in the chemical potential μ (directlyassimilated to the electrode potential upon steady-stateconditions as μ = qU, where q is the positive elementarycharge).18
= ∂∂μC q
cU (1)
By examining Figure 3, one can infer that the impedance of thelow-frequency capacitive part decreases at voltages below 1.2 V.The resistance accompanying the chemical capacitance islargely reduced in the low-voltage range, from ∼20 kΩ at 2.6V down to 100 Ω at 0.2 V. This reduction occurring atconversion potentials signals the enhancement of the electrodecharging current. For intercalation compounds the rate-limitingmechanism is the diffusion of Li+ inside the active material.19
Diffusion of ions gives rise to distinctive impedance patternscharacterized by Warburg-like responses as Z ∝ (iω)−1/2 (beingω the angular frequency and i = (−1)1/2). Models based onspatially restricted ion diffusion were proposed to account forintermediate-frequency arcs relaying on a distribution ofdiffusion lengths20 or electronic transport limitations.21
However, the electrodes analyzed in this work function byconversion reactions that entail an overall material rearrange-ment of both chemical and structural nature. Theseconsiderations lead us to regard the conversion reaction itselfas the rate-limiting process of the change in electrode state ofcharge/discharge. The resistive process accompanying thechemical capacitance is seen as a manifestation of theconversion-related current hindrance.In order to gain a deeper knowledge on the kinetics of the
conversion mechanisms, we propose to show the impedancedata in a representation that highlights capacitive features.Capacitance spectra are calculated from the impedance as22
ω=C
i Z1
(2)
which is a complex function with its real part C′ that increasestoward lower frequencies, signaling the electrode charging. Theimaginary part C″ is related to the inherent resistive processesthat take place during the conversion reaction. Figure 4 showsthe capacitive spectra corresponding to the impedance responsedisplayed in Figure 3. As observed in Figure 4a, C′ spectraexhibit a low-frequency plateau in the range of 1−10 mHz,which is interpreted in terms of the chemical capacitance in eq1. As expected, large capacitances of ca. 0.1 F are measured
Figure 2. Schematic representation of the main processes occurring inthe carbon coated ZnFe2O4-C nanoparticle. The first lithiationproduces a sort of intermediate Li−Zn−Fe−O phases that evolve tothe final structure comprising Fe0 and LiZn immersed into anamorphous Li2O matrix after conversion alloying. Delithiation sweepmost likely produces the formation of ZnO and Fe2O3.
The Journal of Physical Chemistry C Article
dx.doi.org/10.1021/jp412641v | J. Phys. Chem. C 2014, 118, 6069−60766071

when the electrode is polarized at conversion potentials. Thechemical capacitance, extracted from the low-frequency limit,increases for lower potentials in agreement with the occurrenceof the conversion process. A second capacitance plateau isobserved at intermediate frequencies (100 Hz−1 kHz) relatedto Cdl.The imaginary part C″ spectra gather relevant information on
the conversion kinetics. As observed in Figure 4b, C″ exhibits apeak at lower frequencies that corresponds to the inflectionpoint in the C′ step in agreement with the Kramers−Kronigrelations. This peak signals a characteristic frequency (time) ofthe capacitive process that is confined into the low-frequency
range. It is noticed that the peak height follows the increase inC′ plateau. More interestingly, the characteristic frequency fc issituated within the range of 1−10 mHz and undergoesvariations with the cell potential, reaching a maximum at 1.0V. It should be mentioned that fc corresponds to a frequencylocated in the rising part of the impedance spectra in Figure 3.This entails that the underlying mechanism originating the peakin C″ is decoupled from the ac response of Cdl and Rct circuitelements. We suggest here that the characteristic frequencyencountered can be interpreted in terms of the conversionreaction kinetics as a measurement of the conversion time τc.An alternative representation of the capacitance data consists in
Figure 3. Impedance spectroscopy response of a ZnFe2O4-C electrode at different steady-state voltages as indicated. Experimental data and fits usingthe equivalent circuit of Figure 6. In the first panel, it is marked the point at the frequency corresponding to the conversion process as extracted fromthe capacitive analysis.
The Journal of Physical Chemistry C Article
dx.doi.org/10.1021/jp412641v | J. Phys. Chem. C 2014, 118, 6069−60766072

plotting C″ vs C′ in a complex plane as shown in Figure 5a.This kind of plot produces an arc when C″ spectra peak in sucha way that each reaction mechanism can be identified. In thenext section, a detailed model accounting for the equivalentcircuit of the conversion impedance (capacitance) will beprovided.Because conversion is usually a multistep process involving
several intermediate reactions, it is possible to observeadditional reaction peaks at more positive potentials. This isindeed the case studied here. By examining C″ spectra atpotentials >1.8 V, one can observe a clear peak partially maskedby the response corresponding to the low-voltage C″ peak. Thisis displayed in Figure 4c. The high-voltage C″ processresponses much faster (150−400 mHz) than the low-voltagereaction at 1−10 mHz. This secondary mechanism is alsodecoupled from the high-frequency interfacial response takingplace at 0.1−10 kHz, and it is indeed visible in Figure 5b as aclearly distinguishable arc.
■ IMPEDANCE MODEL FOR LITHIATION REACTIONSIn the previous section we have made two identifications fromthe experimental data: (i) The low-frequency plateau in C′spectrum is interpreted in terms of chemical capacitance. Thisis a steady-state value that signals the static limit of thecapacitive process directly linked with the electrode chargingstate. (ii) The peak in C″ spectrum is connected to the kineticsof the reaction as a measurement of the conversion time τc. Byfollowing this approach, it is evident that impedance(capacitance) measurements simultaneously capture energetic(C′ low-frequency plateau) as well as kinetic (C″ peak) aspectsof the conversion process. The simplest way to model theprevious features is a RC series circuit that gives a C″ peak atthe characteristic time τc = RC. This is obviously an ideal casecharacterized by a single conversion time. In real experiments, itis expected to be much more common to deal withdistributions of conversion times as g(τ). The functionaccounting for capacitive response can be easily written as adistribution of RC series circuits23
∫ωτ τ
ωτ=
+μ
∞C C
gi
( )( ) d
10 (3)
with ∫ 0∞g(τ) dτ = 1. This expression gives the real and
imaginary parts as
∫ωτ τ
ω τ′ =
+μ
∞C C
g( )
( ) d10 2 2 (4)
∫ωωτ τ τ
ω τ″ =
+μ
∞C C
g( )
( ) d10 2 2 (5)
Equation 4 assures that Cμ is the low-frequency limit of C′when ω → 0. For experimental data fitting purposes, it is usefulto reduce the freedom degrees of g(τ) to a function with asmaller number of parameters. One simple possibility is using aCole−Cole equation that allows modeling it in terms of
Figure 4. (a) Experimental data corresponding to the real part of thecapacitance C′ spectra of a ZnFe2O4-C electrode measured at differentvoltages. Double-layer and chemical capacitance plateaus are marked.(b) Imaginary part of the capacitance C″ spectra showing the responsepeak. Arrows indicate the conversion frequency. (c) Detail of C″ thatallows observing a second reaction peak at higher voltages related tothe formation of intermediate Li−Zn−Fe−O phases. Solid linescorrespond to fitting results using the equivalent circuit of Figure 6.
Figure 5. Experimental data corresponding to the capacitance C′ plotsof a ZnFe2O4-C electrode measured at different voltages (indicated).(a) Low voltage region exhibiting a differential semicircle related to themain conversion mechanism. (b) Detail of low capacitance in which asecond reaction peak at higher voltages related to the formation ofintermediate Li−Zn−Fe−O phases is observed.
The Journal of Physical Chemistry C Article
dx.doi.org/10.1021/jp412641v | J. Phys. Chem. C 2014, 118, 6069−60766073
individual circuit elements commonly integrated into fittingsoftware packages
ωωτ
=+μ α−C C
i( )
11 ( )c
1(6)
The parameter α (0 < α < 1) accounts for the broadening ofthe conversion time distribution being α = 0 the limit of asingle relaxation time. τc marks the center of g(τ) and obviouslycorrelates with the frequency of C″ peak as τc = 1/2πfc. Thedistribution function corresponding to eq 6 is symmetrical withrespect to ln τc, and it resembles a Gaussian-like distributionconcentrated around −2 < ln(τ/τc) < 2. Therefore, the shape ofC″ will be also symmetric around the peak.The distribution width parameter α can be related to the so-
called constant phase circuit element (CPE). Its impedance isgiven by the expression
ω= αZ
Q i1
( )CPE(7)
that, connected in series with a capacitor C0, gives rise to thefollowing complex capacitance function
ωω
=+ α− −C
CC Q i
( )1 ( )
0
01 1
(8)
The comparison of eqs 6 and 8 allows identifying C0 = Cμ and
τ =α−⎛
⎝⎜⎞⎠⎟
CQc
01/(1 )
(9)
Now, the limiting case α = 0 is assimilated to the singleconversion time case, and the CPE becomes a purely resistivecircuit element. The conversion time in eq 9 allows defining aneffective conversion resistance accounting for the overallresistive contribution of the reaction as
τ=
μR
Ccc
(10)
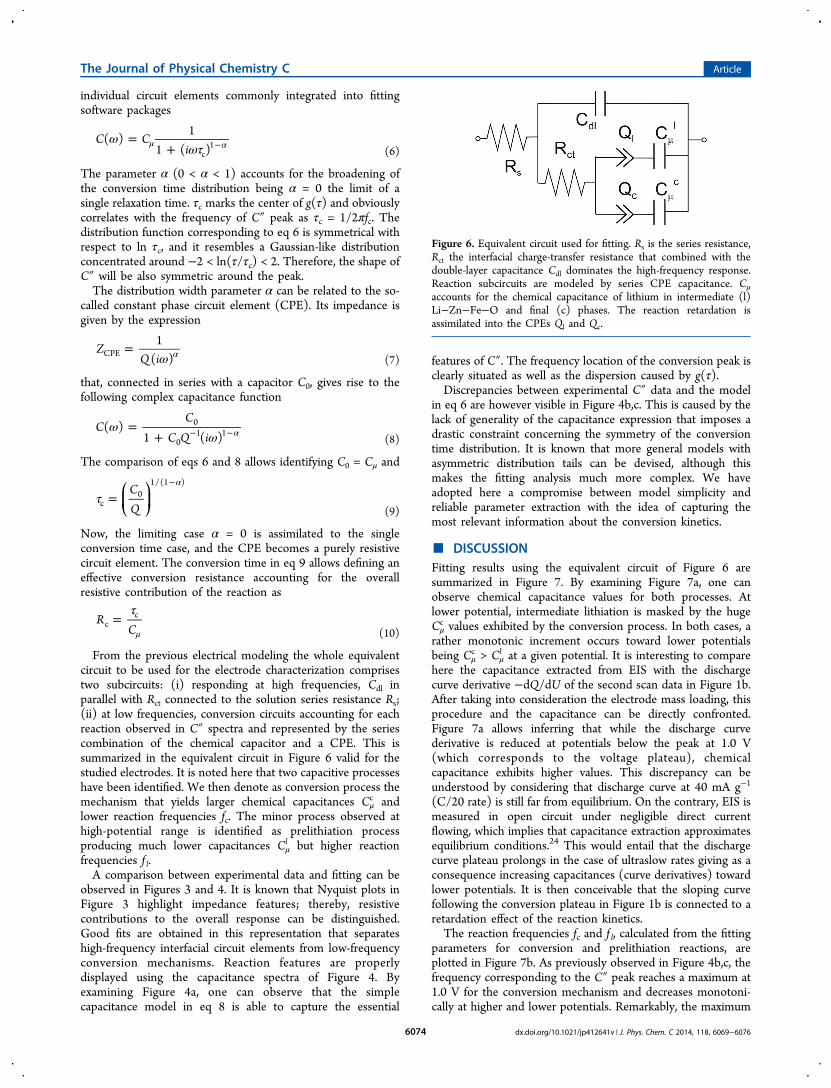
From the previous electrical modeling the whole equivalentcircuit to be used for the electrode characterization comprisestwo subcircuits: (i) responding at high frequencies, Cdl inparallel with Rct connected to the solution series resistance Rs;(ii) at low frequencies, conversion circuits accounting for eachreaction observed in C″ spectra and represented by the seriescombination of the chemical capacitor and a CPE. This issummarized in the equivalent circuit in Figure 6 valid for thestudied electrodes. It is noted here that two capacitive processeshave been identified. We then denote as conversion process themechanism that yields larger chemical capacitances Cμ
c andlower reaction frequencies fc. The minor process observed athigh-potential range is identified as prelithiation processproducing much lower capacitances Cμ
l but higher reactionfrequencies f l.A comparison between experimental data and fitting can be
observed in Figures 3 and 4. It is known that Nyquist plots inFigure 3 highlight impedance features; thereby, resistivecontributions to the overall response can be distinguished.Good fits are obtained in this representation that separateshigh-frequency interfacial circuit elements from low-frequencyconversion mechanisms. Reaction features are properlydisplayed using the capacitance spectra of Figure 4. Byexamining Figure 4a, one can observe that the simplecapacitance model in eq 8 is able to capture the essential
features of C″. The frequency location of the conversion peak isclearly situated as well as the dispersion caused by g(τ).Discrepancies between experimental C″ data and the model
in eq 6 are however visible in Figure 4b,c. This is caused by thelack of generality of the capacitance expression that imposes adrastic constraint concerning the symmetry of the conversiontime distribution. It is known that more general models withasymmetric distribution tails can be devised, although thismakes the fitting analysis much more complex. We haveadopted here a compromise between model simplicity andreliable parameter extraction with the idea of capturing themost relevant information about the conversion kinetics.
■ DISCUSSIONFitting results using the equivalent circuit of Figure 6 aresummarized in Figure 7. By examining Figure 7a, one canobserve chemical capacitance values for both processes. Atlower potential, intermediate lithiation is masked by the hugeCμc values exhibited by the conversion process. In both cases, a
rather monotonic increment occurs toward lower potentialsbeing Cμ
c > Cμl at a given potential. It is interesting to compare
here the capacitance extracted from EIS with the dischargecurve derivative −dQ/dU of the second scan data in Figure 1b.After taking into consideration the electrode mass loading, thisprocedure and the capacitance can be directly confronted.Figure 7a allows inferring that while the discharge curvederivative is reduced at potentials below the peak at 1.0 V(which corresponds to the voltage plateau), chemicalcapacitance exhibits higher values. This discrepancy can beunderstood by considering that discharge curve at 40 mA g−1
(C/20 rate) is still far from equilibrium. On the contrary, EIS ismeasured in open circuit under negligible direct currentflowing, which implies that capacitance extraction approximatesequilibrium conditions.24 This would entail that the dischargecurve plateau prolongs in the case of ultraslow rates giving as aconsequence increasing capacitances (curve derivatives) towardlower potentials. It is then conceivable that the sloping curvefollowing the conversion plateau in Figure 1b is connected to aretardation effect of the reaction kinetics.The reaction frequencies fc and f l, calculated from the fitting
parameters for conversion and prelithiation reactions, areplotted in Figure 7b. As previously observed in Figure 4b,c, thefrequency corresponding to the C″ peak reaches a maximum at1.0 V for the conversion mechanism and decreases monotoni-cally at higher and lower potentials. Remarkably, the maximum
Figure 6. Equivalent circuit used for fitting. Rs is the series resistance,Rct the interfacial charge-transfer resistance that combined with thedouble-layer capacitance Cdl dominates the high-frequency response.Reaction subcircuits are modeled by series CPE capacitance. Cμ
accounts for the chemical capacitance of lithium in intermediate (l)Li−Zn−Fe−O and final (c) phases. The reaction retardation isassimilated into the CPEs Ql and Qc.
The Journal of Physical Chemistry C Article
dx.doi.org/10.1021/jp412641v | J. Phys. Chem. C 2014, 118, 6069−60766074
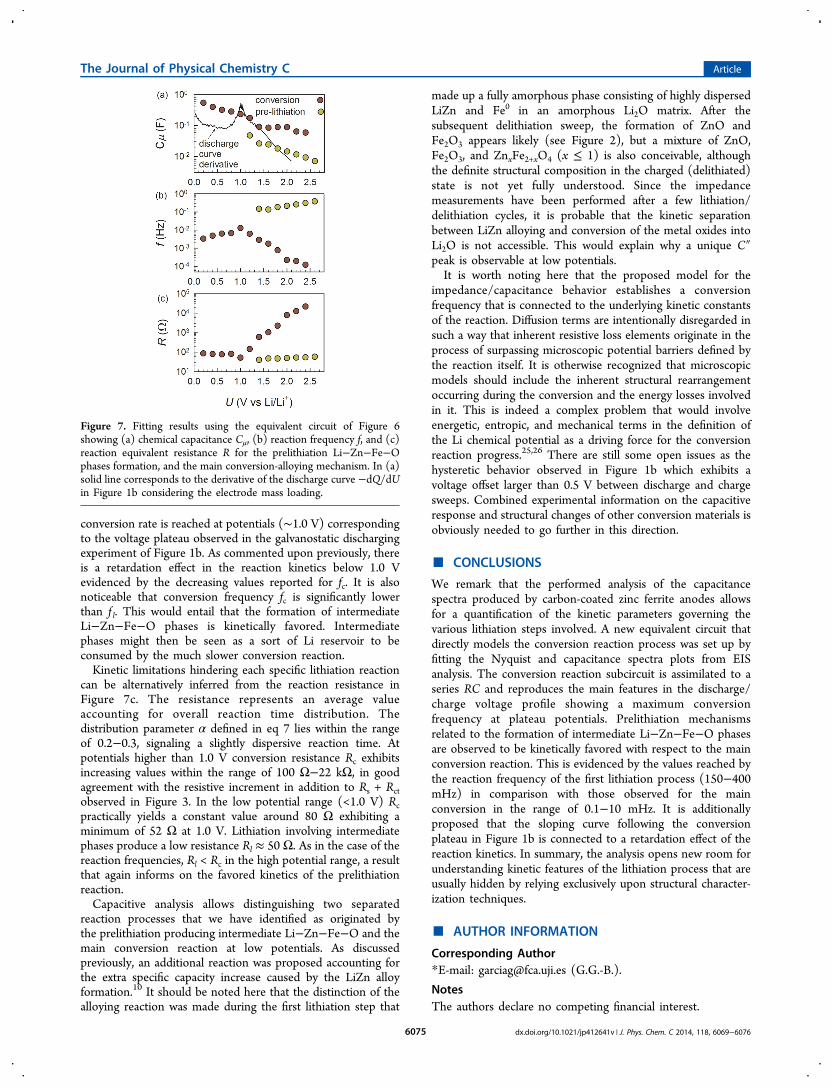
conversion rate is reached at potentials (∼1.0 V) correspondingto the voltage plateau observed in the galvanostatic dischargingexperiment of Figure 1b. As commented upon previously, thereis a retardation effect in the reaction kinetics below 1.0 Vevidenced by the decreasing values reported for fc. It is alsonoticeable that conversion frequency fc is significantly lowerthan f l. This would entail that the formation of intermediateLi−Zn−Fe−O phases is kinetically favored. Intermediatephases might then be seen as a sort of Li reservoir to beconsumed by the much slower conversion reaction.Kinetic limitations hindering each specific lithiation reaction
can be alternatively inferred from the reaction resistance inFigure 7c. The resistance represents an average valueaccounting for overall reaction time distribution. Thedistribution parameter α defined in eq 7 lies within the rangeof 0.2−0.3, signaling a slightly dispersive reaction time. Atpotentials higher than 1.0 V conversion resistance Rc exhibitsincreasing values within the range of 100 Ω−22 kΩ, in goodagreement with the resistive increment in addition to Rs + Rctobserved in Figure 3. In the low potential range (<1.0 V) Rcpractically yields a constant value around 80 Ω exhibiting aminimum of 52 Ω at 1.0 V. Lithiation involving intermediatephases produce a low resistance Rl ≈ 50 Ω. As in the case of thereaction frequencies, Rl < Rc in the high potential range, a resultthat again informs on the favored kinetics of the prelithiationreaction.Capacitive analysis allows distinguishing two separated
reaction processes that we have identified as originated bythe prelithiation producing intermediate Li−Zn−Fe−O and themain conversion reaction at low potentials. As discussedpreviously, an additional reaction was proposed accounting forthe extra specific capacity increase caused by the LiZn alloyformation.10 It should be noted here that the distinction of thealloying reaction was made during the first lithiation step that
made up a fully amorphous phase consisting of highly dispersedLiZn and Fe0 in an amorphous Li2O matrix. After thesubsequent delithiation sweep, the formation of ZnO andFe2O3 appears likely (see Figure 2), but a mixture of ZnO,Fe2O3, and ZnxFe2+xO4 (x ≤ 1) is also conceivable, althoughthe definite structural composition in the charged (delithiated)state is not yet fully understood. Since the impedancemeasurements have been performed after a few lithiation/delithiation cycles, it is probable that the kinetic separationbetween LiZn alloying and conversion of the metal oxides intoLi2O is not accessible. This would explain why a unique C″peak is observable at low potentials.It is worth noting here that the proposed model for the
impedance/capacitance behavior establishes a conversionfrequency that is connected to the underlying kinetic constantsof the reaction. Diffusion terms are intentionally disregarded insuch a way that inherent resistive loss elements originate in theprocess of surpassing microscopic potential barriers defined bythe reaction itself. It is otherwise recognized that microscopicmodels should include the inherent structural rearrangementoccurring during the conversion and the energy losses involvedin it. This is indeed a complex problem that would involveenergetic, entropic, and mechanical terms in the definition ofthe Li chemical potential as a driving force for the conversionreaction progress.25,26 There are still some open issues as thehysteretic behavior observed in Figure 1b which exhibits avoltage offset larger than 0.5 V between discharge and chargesweeps. Combined experimental information on the capacitiveresponse and structural changes of other conversion materials isobviously needed to go further in this direction.
■ CONCLUSIONS
We remark that the performed analysis of the capacitancespectra produced by carbon-coated zinc ferrite anodes allowsfor a quantification of the kinetic parameters governing thevarious lithiation steps involved. A new equivalent circuit thatdirectly models the conversion reaction process was set up byfitting the Nyquist and capacitance spectra plots from EISanalysis. The conversion reaction subcircuit is assimilated to aseries RC and reproduces the main features in the discharge/charge voltage profile showing a maximum conversionfrequency at plateau potentials. Prelithiation mechanismsrelated to the formation of intermediate Li−Zn−Fe−O phasesare observed to be kinetically favored with respect to the mainconversion reaction. This is evidenced by the values reached bythe reaction frequency of the first lithiation process (150−400mHz) in comparison with those observed for the mainconversion in the range of 0.1−10 mHz. It is additionallyproposed that the sloping curve following the conversionplateau in Figure 1b is connected to a retardation effect of thereaction kinetics. In summary, the analysis opens new room forunderstanding kinetic features of the lithiation process that areusually hidden by relying exclusively upon structural character-ization techniques.
■ AUTHOR INFORMATION
Corresponding Author*E-mail: [email protected] (G.G.-B.).
NotesThe authors declare no competing financial interest.
Figure 7. Fitting results using the equivalent circuit of Figure 6showing (a) chemical capacitance Cμ, (b) reaction frequency f, and (c)reaction equivalent resistance R for the prelithiation Li−Zn−Fe−Ophases formation, and the main conversion-alloying mechanism. In (a)solid line corresponds to the derivative of the discharge curve −dQ/dUin Figure 1b considering the electrode mass loading.
The Journal of Physical Chemistry C Article
dx.doi.org/10.1021/jp412641v | J. Phys. Chem. C 2014, 118, 6069−60766075

■ ACKNOWLEDGMENTS
We thank financial support from Generalitat Valenciana (ISIC/2012/008 Institute of Nanotechnologies for Clean Energies)and FP7 European project ORION (Large CP-IP 229036-2).
■ REFERENCES(1) Tarascon, J. M.; Armand, M. Issues and Challenges FacingRechargeable Lithium Batteries. Nature 2001, 414, 359−367.(2) Choi, N.-S.; Chen, Z.; Freunberger, S. A.; Ji, X.; Sun, Y.-K.;Amine, K.; Yushin, G.; Nazar, L. F.; Cho, J.; Bruce, P. G. ChallengesFacing Lithium Batteries and Electrical Double-Layer Capacitors.Angew. Chem., Int. Ed. 2012, 51, 9994−10024.(3) Bresser, D.; Paillard, E.; Copley, M.; Bishop, P.; Winter, M.;Passerini, S. The Importance of “Going Nano” for High Power BatteryMaterials. J. Power Sources 2102, 219, 217−222.(4) Cabana, J.; Monconduit, L.; Larcher, D.; Palacín, M. R. BeyondIntercalation-Based Li-Ion Batteries: The State of the Art andChallenges of Electrode Materials Reacting Through ConversionReactions. Adv. Energy Mater. 2010, 22, E170−E192.(5) Hu, Y.-Y.; Liu, Z.; Nam, K.-W.; Borkiewicz, O. J.; Cheng, J.; Hua,X.; Dunstan, M. T.; Yu, X.; Wiaderek, K. M.; Du, L.-S.; et al. Origin ofAdditional Capacities in Metal Oxide Lithium-Ion Battery Electrodes.Nat. Mater. 2013, DOI: 10.1038/NMAT3784.(6) Wang, F.; Robert, R.; Chernova, N. A.; Pereira, N.; Omenya, F.;Badway, F.; Hua, X.; Ruotolo, M.; Zhang, R.; Wu, L.; et al. ConversionReaction Mechanisms in Lithium Ion Batteries: Study of the BinaryMetal Fluoride Electrodes. J. Am. Chem. Soc. 2011, 133, 18828−18836.(7) Khatib, R.; Dalverny, A.-L.; Saubanere, M.; Gaberscek, M.;Doublet, M.-L. Origin of the Voltage Hysteresis in the CoPConversion Material for Li-Ion Batteries. J. Phys. Chem. C 2013,117, 837−849.(8) Bazant, M. Z. Theory of Chemical Kinetics and Charge TransferBased on Nonequilibrium Thermodynamics. Acc. Chem. Res. 2013, 46,1144−1160.(9) Xu, C.; Zeng, Y.; Rui, X.; Zhu, J.; Tan, H.; Guerrero, A.; Toribio,J.; Bisquert, J.; Garcia-Belmonte, G.; Yan, Q. Amorphous IronOxyhydroxide Nanosheets: Synthesis, Li Storage, and ConversionReaction Kinetics. J. Phys. Chem. C 2013, 117, 17462−17469.(10) Bresser, D.; Paillard, E.; Kloepsch, R.; Krueger, S.; Fiedler, M.;Schmitz, R.; Baither, D.; Winter, M.; Passerini, S. Carbon CoatedZnFe2O4 Nanoparticles for Advanced Lithium-Ion Anodes. Adv.Energy Mater. 2013, 3, 513−523.(11) Poizot, P.; Laruelle, S.; Grugeon, S.; Dupont, L.; Tarascon, J.-M.Nano-Sized Transition-Metal Oxides as Negative-Electrode Materialsfor Lithium-Ion Batteries. Nature 2000, 407, 496−499.(12) Larchera, D.; Sudanta, G.; Lerichea, J.-B.; Chabreb, Y.;Tarascon, J.-M. The Electrochemical Reduction of Co3O4 in a LithiumCell. J. Electrochem. Soc. 2002, 149, A234−A241.(13) Lavela, P.; Tirado, J. L. CoFe2O4 and NiFe2O4 Synthesized bySol−Gel Procedures for Their Use as Anode Materials for Li IonBatteries. J. Power Sources 2007, 172, 379−387.(14) Lavela, P.; Tirado, J. L.; Womes, M.; Jumas, J. C. Elucidation ofCapacity Fading on CoFe2O4 Conversion Electrodes for LithiumBatteries Based on 57Fe Mossbauer Spectroscopy. J. Electrochem. Soc.2009, 156, A589−A594.(15) Sharma, Y.; Sharma, N.; Subba Rao, G. V.; Chowdari, B. V. R.Li-Storage and Cyclability of Urea Combustion Derived ZnFe2O4 asAnode for Li-Ion Batteries. Electrochim. Acta 2008, 53, 2380−2385.(16) Lavela, P.; Tirado, J. L.; Womes, M.; Jumas, J. C. 57FeMossbauer Spectroscopy Study of the Electrochemical Reaction withLithium of MFe2O4 (M = Co and Cu) Electrodes. J. Phys. Chem. C2009, 113, 20081−20087.(17) Reddy, M. V.; Yu, T.; Sow, C. H.; Shen, Z. X.; Lim, C. T.; SubbaRao, G. V.; Chowdari, B. V. R. α-Fe2O3 Nanoflakes as an AnodeMaterial for Li-Ion Batteries. Adv. Funct. Mater. 2007, 17, 2792−2799.(18) Bisquert, J. Chemical Capacitance of Nanostructured Semi-conductors: Its Origin and Significance for Heterogeneous Solar Cells.Phys. Chem. Chem. Phys. 2003, 5, 5360−5364.
(19) Song, J.; Bazant, M. Z. Effects of Nanoparticle Geometry andSize Distribution on Diffusion Impedance of Battery Electrodes. J.Electrochem. Soc. 2013, 160, A15−A24.(20) Levi, M. D.; Aurbach, D. Impedance of a Single IntercalationParticle and of Non-Homogeneous, Multilayered Porous CompositeElectrodes for Li-Ion Batteries. J. Phys. Chem. B 2004, 108, 11693−11703.(21) Meyers, J. P.; Doyle, M.; Darling, R. M.; Newman, J. TheImpedance Response of a Porous Electrode Composed ofIntercalation Particles. J. Electrochem. Soc. 2000, 147, 2930−2940.(22) Garcia-Belmonte, G.; Bueno, P. R.; Fabregat-Santiago, F.;Bisquert, J. Relaxation Processes in the Coloration of AmorphousWO3 Thin Films Studied by Combined Impedance and Electro-Optical Measurements. J. Appl. Phys. 2004, 96, 853−859.(23) Bottcher, C. J. F.; Bordewijk, P. Theory of Electric Polarization;Elsevier: Amsterdam, 1978; Vol. 2.(24) Liu, P.; Vajo, J. J.; Wang, J. S.; Li, W.; Liu, J. Thermodynamicsand Kinetics of the Li/FeF3 Reaction by Electrochemical Analysis. J.Phys. Chem. C 2012, 116, 6467−6473.(25) Garcia-Belmonte, G.; García-Canadas, J.; Bisquert, J. Correlationbetween Volume Change and Cell Voltage Variation withComposition for Lithium Intercalated Amorphous Films. J. Phys.Chem. B 2006, 110, 4514−4518.(26) Levi, M. D.; Aurbach, D.; Maier, J. Electrochemically DrivenFirst-Order Phase Transitions Caused by Elastic Responses of Ion-Insertion Electrodes under External Kinetic Control. J. Electroanal.Chem. 2008, 624, 251−261.
The Journal of Physical Chemistry C Article
dx.doi.org/10.1021/jp412641v | J. Phys. Chem. C 2014, 118, 6069−60766076