Visualizing Non-Equilibrium Lithiation of Spinel Oxide via ... · 1 Visualizing Non-Equilibrium...
29
1 Visualizing Non-Equilibrium Lithiation of Spinel Oxide via In Situ Transmission Electron Microscopy Kai He 1,* , Sen Zhang 2,* , Jing Li 1 , Xiqian Yu 1 , Qingping Meng 1 , Yizhou Zhu 3 , Enyuan Hu 1 , Ke Sun 1 , Hongseok Yun 2 , Xiao-Qing Yang 1 , Yimei Zhu 1 , Hong Gan 1 , Yifei Mo 3 , Eric A. Stach 1 , Christopher B. Murray 2 , and Dong Su 1 1 Brookhaven National Laboratory, Upton, New York 11973, USA. 2 Department of Chemistry, University of Pennsylvania, Philadelphia, Pennsylvania 19104, USA. 3 Department of Materials Science and Engineering, University of Maryland, College Park, Maryland 20742, USA. These authors contributed equally to the work. Correspondence and requests for materials should be addressed to C.B.M. (email: [email protected]) or to D.S. (email: [email protected]). BNL-112013-2016-JA
Transcript of Visualizing Non-Equilibrium Lithiation of Spinel Oxide via ... · 1 Visualizing Non-Equilibrium...

1
Visualizing Non-Equilibrium Lithiation of Spinel Oxide via In Situ Transmission Electron Microscopy
Kai He1,*, Sen Zhang2,*, Jing Li1, Xiqian Yu1, Qingping Meng1, Yizhou Zhu3, Enyuan Hu1, Ke
Sun1, Hongseok Yun2, Xiao-Qing Yang1, Yimei Zhu1, Hong Gan1, Yifei Mo3, Eric A. Stach1,
Christopher B. Murray2, and Dong Su1
1Brookhaven National Laboratory, Upton, New York 11973, USA.
2Department of Chemistry, University of Pennsylvania, Philadelphia, Pennsylvania 19104, USA.
3Department of Materials Science and Engineering, University of Maryland, College Park,
Maryland 20742, USA.
These authors contributed equally to the work. Correspondence and requests for materials should
be addressed to C.B.M. (email: [email protected]) or to D.S. (email: [email protected]).
BNL-112013-2016-JA

2
Spinel transition metal oxides are an important class of materials that are being considered
as electrodes for lithium-ion batteries, due to their low cost and high theoretical capacity.
The lithiation of these compounds is known to undergo a two-step reaction, whereby
intercalation and conversion occur in a sequential fashion. These two reactions are known
to have distinct reaction dynamics, but it is unclear how the kinetics of these processes
affect the overall electrochemical response. Here, we explore the lithiation of nanosized
magnetite (Fe3O4) by employing a new strain-sensitive, bright-field scanning transmission
electron microscopy approach. This method allows direct, real time, high-resolution
visualization of how lithiation proceeds along specific reaction pathways. We have found
that the initial intercalation process follows a well-known two-phase reaction sequence,
whereas further lithiation leads to the coexistence of three distinct phases within single
nanoparticles, an observation that has not been reported to date. This process is found to
be governed by the competition between energetic barriers to the phase transformations
and the overall electrochemical driving force. We use phase field theory to model and
describe these non-equilibrium reaction pathways, and to directly correlate the observed
phase evolution with the bulk discharge profiles that occur in real batteries.
Keywords: Fe3O4 nanoparticles, lithium ion battery, conversion, intercalation, multiple-step, in
situ TEM

3
The spinel transition metal oxide family – which includes LiMn2O4, Li4Ti5O12, Fe3O4,
Co3O4, Mn3O4, among others – is an important group of compounds, and one that sees
considerable use as electrode materials in lithium ion batteries.1-7 Specifically, magnetite (Fe3O4)
is a promising candidate as an anode material, as it is both inexpensive and non-toxic.
Importantly, it also has a high electronic conductivity and can store up to eight Li ions per
formula unit, which leads to a high theoretical specific capacity of 926 mAh g-1.8-20 The structure
of Fe3O4 is inverse spinel ((Fe3+)8a[Fe2+Fe3+]16dO4, denoted by Wyckoff notation), where there
are 64 tetrahedral sites in a unit cell (one-eighth of them are 8a sites occupied by 8 Fe3+ cations,
denoted as), and 32 octahedral sites (half of them are 16d sites occupied by 8 Fe2+ and 8 Fe3+
cations), leaving behind 56 empty tetrahedral (8b and 48f) sites and 16 empty octahedral (16c)
sites in the interstitial space to allow for accommodation of guest Li+ ions.17-20 The lithiation of
spinel iron oxide was investigated by Thackeray et al. using a combination of open-circuit
voltage measurements and X-ray diffraction,16, 17 and they posited that the overall lithiation of
Fe3O4 follows the reaction equation shown in Eq (1):
8 Li + Fe3O4 → 4 Li2O + 3 Fe (1)
They suggested that during the initial stage of lithium insertion, the Fe3+ cations at tetragonal 8a
sites are distorted into the nearby octahedral 16c sites by inserting Li+ ions into the octahedral
16c sites, which leads to a lattice reconstruction of the spinel structure to form the rocksalt
structure, i.e., (Li+xFe3+)16c[Fe2+Fe3+]16dO4.16-21 This is an intercalation process, and thus it does
not lead to a significant volume change. They proposed that further lithiation triggers destruction
of the rocksalt structure along with an extrusion of metallic Fe from the material, which is
commonly known as a conversion reaction. During the conversion reaction, the rocksalt structure

4
transforms into a composite which is composed of both metallic Fe and Li2O. Critically, this
conversion leads to a drastic volume expansion.9-15
Fe3O4 shows dramatic differences in electrochemical performance as a function of
discharge rate (“C rate”), with the intercalation process not readily observed in the discharge
voltage profiles.9-11 These differences cannot be understood from simple consideration of the
reaction equation, which describes how these processes occur in an equilibrium condition. In
one related example, the positive electrode material LiFePO4 (LFP) exhibits a solid solution
transformation at high rates when undergoing an intercalation reaction, specifically when the
two-phase transition process is suppressed above a certain overpotential.22, 23 Thus, it is
suggested that for Fe3O4 the overall charge-discharge performance depends strongly on the
kinetics of specific discharge mechanisms. This in turn determines the realistic redox reaction
characteristics that the battery sees in working conditions.
Finally, it is well known that the rate capability of electrodes can be improved by
reducing the material size from the micrometer to the nanometer regime. This improvement is
due to both the increase in surface area and the reduction of electron/ion diffusion length.24-26
However, in the case of nanoscale electrodes, the overall kinetics of lithiation are further
complicated by local inhomogeneities that can occur in the electrochemical conditions. Besides
the presence of both intercalation and conversion reactions, all of these facts underscore the
importance of understanding the phase transitions of Fe3O4 that occur in non-equilibrium
conditions, as it is these parameters that must be optimized when considering spinel-based
electrode materials in electrochemical applications.22

5
In this work, we investigate how non-equilibrium intercalation and conversion reactions
proceed by studying the lithiation process in real time. X-ray scattering or Mӧssbauer
spectroscopy are most often used to identify the phase transformations that occur in nanosized
electrode materials,16, 19 but these techniques have the disadvantage of providing only average
information, and generally they lack the ability to probe reaction kinetics in real time. Critically,
it is important to undertake lithiation studies in situ, as ex situ studies may provide inaccurate
information due to changes that may occur during removal of the electrode materials from an
actively lithiated condition.22, 27 In contrast, transmission electron microscopy (TEM) allows
direct, real time information to be obtained from structures at the atomic scale. The need for in
situ observations of this type has been increasingly recognized, and thus there have been many
recent reports of the use of in situ TEM to study alloying and conversion reactions.28-38 However,
directly visualizing phase transitions that occur during intercalation reactions is challenging
because the volume change that occurs during this type of reaction is negligible.39-42 This
prevents the use of standard diffraction contrast imaging techniques. In this work, we have
utilized a strain-sensitive bright-field scanning transmission electron microscopy (BF-STEM)
imaging technique to overcome this challenge. This approach allows us to observe the phase
changes that occur in monodisperse Fe3O4 nanoparticles in situ during the intercalation reaction,
and follow the subsequent conversion reaction directly. By integrating ex situ synchrotron X-ray
and in situ TEM approaches, we capture in detail the mechanisms by which lithiation occurs and
relate this directly to the reaction kinetics. Furthermore, we support these observations with both
DFT calculations and non-equilibrium phase-field theory to describe the atomistic processes
from first principles and phenomenological perspective, respectively. This work highlights the

6
importance of exploiting advanced TEM techniques to reveal reaction inhomogeneities at the
nanoscale.
Results and Discussion
Material structures and electrochemical properties. The as-synthesized Fe3O4
nanoparticles are ca. 80 nm truncated octahedrons, as shown in Figure 1a and Supplementary
Figure S1. Atomic-resolution high-angle annular dark-field (HAADF) STEM images (as in
Figure 1b) indicates that the pristine Fe3O4 nanoparticles are single-crystalline with the inverse
spinel structure (𝐹𝑑3𝑚 space group) and terminated with {111} crystal planes. In order to
characterize the electrochemical performance, voltage profiles at different C-rates (1C, C/10, and
C/200, or 926 mA g-1, 92.6 mA g-1, and 4.63 mA g-1, respectively) are shown in Figure 1e. The
first discharge capacity is 1080 mAh/g at C/200, and it decreases to 916 mAh/g and 914 mAh/g
for C/10 and 1C, respectively, close to the theoretical capacity of 926 mAh/g. The capacity
excess in the initial discharge is generally believed due to side reactions involving electrolyte
decomposition and formation of solid electrolyte interphases,43-45 while the following cyclic tests
show an excellent rate performance (Figure S2) that is comparable to previous reports.10-12 After
full discharge (lithiation), the electrode materials have changed their structure and morphology
dramatically to form a nanocomposite consisting of ultrafine (<5 nm) Fe nanoparticles and an
amorphous Li2O matrix phase (Figure 1c), as confirmed by electron diffraction (Figure 1d). It is
noted that two distinct plateaus appear in the C/200 discharge curve, corresponding to the
intercalation reaction and conversion reaction, respectively,13-15, 17 whereas the intercalation
plateau is absent from the relatively faster discharge curves at rates of 1C and C/10. This can be
due to enhancements in the reaction kinetics that can occur at high discharge current densities
(such as voltage polarization). To justify this hypothesis, we employed the galvanostatic

7
intermittent titration technique (GITT)46 for a discharge cycle at C/10 to measure the open-circuit
voltage (OCV) profile: this reflects the equilibrium redox potentials at different states of charge
(SOCs). Figure 1f clearly indicates the voltage polarization between the OCV and regular
discharge profile, and confirms the existence of an intercalation plateau which is related to the
charge rate. The intercalation process can generally be expressed as Eq (2):
x Li + Fe3O4 (spinel) → LixFe3O4 (rocksalt) (2)
where x is the lithium content per formula. For an intercalation reaction, x is supposedly between
0 and 2,16-18 and its upper limit depends on the total amount of lithium ions accommodated at the
tetragonal 8a sites.16, 17 Further lithiation would trigger the conversion reaction. This is also
confirmed by high-resolution TEM (HRTEM) imaging of ex situ lithiated LixFe3O4 with Li
content x = 2, 3, 4, 5, 6, 7, 8 (Figure S3). These HRTEM images and selected area electron
diffraction (SAED) patterns show the transition from rocksalt LixFe3O4 to Fe+Li2O composite in
a gradually proceeding fashion. Since the intercalation reaction only involves Li content x < 2, it
is crucial to focus our study on the first half of the lithiation. To study the intercalation process
further, we utilized synchrotron X-ray diffraction (SXRD) to identify the phase changes at
various SOCs of x = 0, 0.5, 1, 1.5, 2, 3 and 4, as shown in Figure 1g,h. The series of SXRD
patterns show that the electrode materials transfer from spinel structure to rocksalt structure with
increasing Li composition (detailed indexing is presented in Supplementary Figure S4). From the
enlarged patterns in Figure 1h, we indeed identified the two stable Fe3O4 and LiFe3O4 phases.
The nanosized Fe phase that resulted from the conversion reaction cannot be captured by SXRD
even up to x = 4: however, its presence was confirmed using TEM (Supplementary Figure S5).
These observations clearly indicate that SXRD – due to its lack of sensitivity in detecting
nanoscale particles, and its averaging of the overall phase information – is not able to precisely

8
determine either the initiation of the conversion reaction, or to follow its evolution. Additionally,
the absence of an intercalation plateau in the cycling profiles of 1C and C/10 implies that the
intercalation process is bypassed at high rates. Although the SXRD results clearly show the
existence of a rocksalt intermediate phase which arises from the intercalation reaction, the
presence of this phase might also be due to a possible structure relaxation and phase separation
that occurs post-mortem. Effects of this type have been reported in LFP system, where ex situ
characterization is shown to inaccurately describe the reaction processes that are occurring.21 In
addition, the intercalation phase transition can either follow a two-phase model or solid-solution
process depending on the details of the reaction kinetics, a process which cannot be resolved
from the ex situ study. To solve these issues, we have utilized in situ electron microscopy
approaches to determine which reaction pathways occur in spinel oxide.
Phase evolution by in situ electron diffraction. We utilized a dry cell setup for our in
situ TEM investigation.36-38 This approach can precisely track the phase evolution at very high
spatial resolution. Since there are no liquid organic electrolyte involved in the reactions, to verify
the consistency in the phase transitions between the ex situ and in situ experiments, we tracked
the dynamical phase evolution using in situ electron diffraction throughout the entire lithiation
process, as shown in Figure 2a and Movie 1 The radially integrated intensity profiles from a
series of time-sequenced SAED patterns are plotted as a function of lithiation time, with the
intensity represented by false colors (Figure 2a). It is obvious that both the position and intensity
of the Bragg reflections change as the lithiation proceeds, verifying the overall phase
transformation from pristine Fe3O4 to the eventual Fe and Li2O composite (and in the same
manner as the ex situ results). Using the intensity profiles of Fe3O4 (311) and Fe (110) SAED
peaks as a measure, the gradual evolution of the phase transformation becomes clear, as depicted

9
in Figure 2b. It is also worth noting that the Bragg peaks of the Fe3O4 phase display a negative
shift in reciprocal space (as indicated by arrows in Figure 2a) during the initial stage of lithiation
(up to ~1000 s), which corresponds to an increase in the lattice parameter as Li+ ions are inserted
into the Fe3O4 lattice (Figure 2c). This lattice parameter increase is quantitatively consistent with
the phase transition from Fe3O4 to LiFe3O4, as extracted from our SXRD measurements. After
~1000 s, the lattice expansion becomes more severe, indicating that the subsequent lithiation was
dominated by the conversion reaction, as per Eq (3).
(8-x) Li + LixFe3O4 → 4 Li2O + 3 Fe (3)
Visualization of two-step lithiation by in situ STEM. After verifying that the phase
transformation occurs using in situ SAED, we performed an in situ STEM observation to follow
how the structure evolves during the entire lithiation process in real space, as shown in Figure 3a
and Movie 2. The time-sequenced BF-STEM images record the intensity of the transmitted
electrons scattered to lower angles as well as the direct beam (involving the most coherent
electron scattering). This signal is strain sensitive and thus enables direct visualization of the
small lattice changes that occur during the intercalation process (Figure S6).47 We show that this
is essential observing intercalation reactions in real time. This is contrast to other, more
conventional imaging techniques (such as HAADF-STEM, or BF/DF TEM) which does not have
the requisite image sensitivity (composition / strain) to directly observe this process. The first
intercalation step follows the reaction described in Eq (2) to generate the lithium-inserted
LixFe3O4 phase (shown with a lighter contrast). These regions will be further lithiated in the
subsequent conversion reaction, which is also accompanied by the extrusion of ultrafine metallic
Fe nanoparticles to form a composite with the amorphous Li2O. For better visualization, we use
false colors to distinguish the pristine Fe3O4 (red), Li-inserted Fe3O4 (blue), and completely

10
conversion composite (green) phases and their evolution as a function of time. This was also
verified using electron energy-loss spectroscopy (EELS) in STEM (Supplementary Figure S7).
We note that, under realistic electrochemical environment, the lithiation process shows a non-
equilibrium reaction pathway, i.e., the conversion reaction starts to take place before the
intercalation completely finishes. This may be likely due to the fact that the diffusion of lithium
on the Fe3O4 particle surface is faster than that through the lithiated LixFe3O4 phase, which can
cause a sufficiently large lithium concentration at the particle surface and thereby trigger the
conversion reaction to happen at an early stage (but still after the intercalation reaction). It is
obvious that both intercalation and conversion reactions follow a “shrinking-core” mode,
proceeding from the outer surface to the inner region.37 Specifically, the initial intercalation
trajectory does not exhibit any preferential directions, in accord with the zigzag Li+ diffusion
paths in three-dimensional (3D) tunnels;16 whereas the subsequent conversion tends to propagate
through the outer facets, i.e. {111} planes. As an approximate measure of reaction kinetics, we
quantified the projected areas of the three phases versus the lithiation time, displayed in Figure
3b. This figure shows that the propagation speed of the intercalation process is about one order
of magnitude faster than the following conversion reaction (Figure 3c). We note that these
measurements are from one single particle, where the electrochemical conditions are supposed to
be identical. This is consistent with the fact that full conversion needs multiple Li-ion transfers,
when compared with the intercalation process. We do not believe this to be an effect resulting
from local electrochemical inhomogeneity.
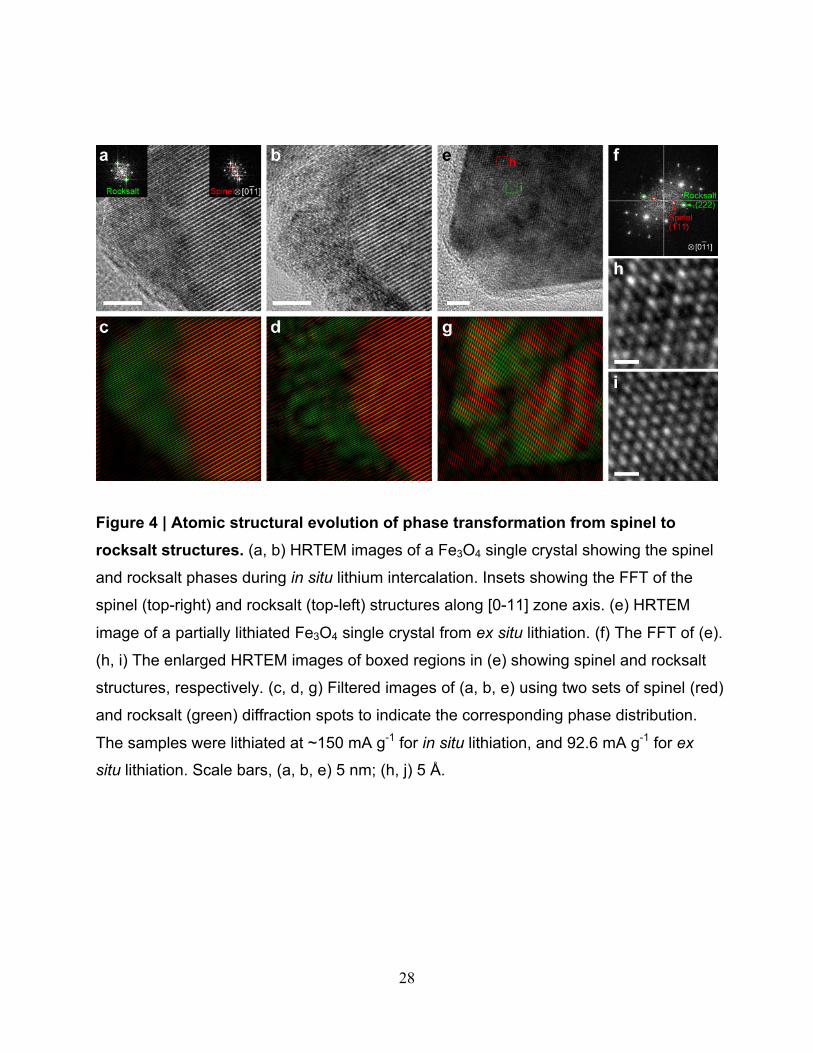
High-resolution TEM characterization. For a fundamental understanding of the
intercalated phase, we conducted HRTEM imaging to track the atomic structure changes for both
in situ and ex situ scenarios, as shown in Figure 4. A new phase with the rocksalt structure was

11
observed in situ as Li+ ions were inserted into the spinel Fe3O4 phase (Figure 4a,b). Using two
sets of diffraction spots from the fast Fourier transform (FFT, Figure 4a insets), we can
separately map the distribution of the spinel (red) and rocksalt (green) phases and thus visualize
the propagation of the intercalation front in the reacting Fe3O4 crystal (Figure 4c,d). Similarly, in
an ex situ lithiated sample that was discharged to 0.9 V, we reproduced this result, and found a
similar mixture of spinel and rocksalt phases (Figure 4e,g). In the pristine spinel Fe3O4 crystals,
Fe cations occupy the tetrahedral 8a sites and octahedral 16d sites, which gives the uneven TEM
contrast (dim at the diamond center) shown in Figure 4h. Upon lithium insertion, all the cations
migrate to the octahedral sites (16c and 16d), leading to a uniform contrast (Figure 4i). This
means that the inserted Li ions occupy the 16c sites and also repel the adjacent Fe cations from
the 8a to the 16c sites to form LixFe3O4 crystals with the rocksalt structure, with lithium
composition up to x= 1. It is also noted from previous reports that the excess Li ions (up to x = 2)
could possibly insert into the 8b and 48f sites to form Li2Fe3O4 phase without Fe extrusion.16, 17
However, this particular phase was not experimentally identified from TEM observations.
Nevertheless, the intercalation process goes through a two-phase mode and forms an
intermediate phase of LixFe3O4.16-18 Thereafter, the conversion reaction occurs and the LixFe3O4
phase is decomposed into Li2O and metallic Fe nanocrystals, which can be observed as the
speckles in Figure 4b,d. Combining both in situ TEM imaging and ex situ SXRD results, we now
can conclude that the intercalation proceeds in a two-phase “nucleation and growth” manner,
resulting in sharp interfacial boundaries between the spinel and rocksalt phases, as expressed in
Eq (2).
First principles calculations and phase-field modeling. Density functional theory
(DFT) computation has been performed to calculate the voltage profile of the lithiation process

12
under the thermodynamic equilibrium condition.48-52 The calculated reaction pathway has
multiple voltage plateaus (green dashed curve in Figure 5a) with intermediate phases, such as
LiFeO2, Li2FeO2 and Li5FeO4 (Figure 5b). Given that the LiFe3O4 is an intermediate phase
experimentally observed from SXRD, our DFT calculations also considered a two-step reaction
route (red curve in Figure 5a), including the intercalation plateau (Li + Fe3O4 → LiFe3O4) and
the conversion plateau (LiFe3O4 → Li2O + Fe). The ground-state LiFe3O4 structure as illustrated
in the inset crystal models of Figure 5a possesses a similar structural framework (i.e., [Fe]16dO2
octahedron) that was inherited from the spinel Fe3O4 structure. Consistent with the ground-state
LiFe3O4 structure calculated in the DFT computation, Li ions insert into the octahedral 16c
openings, and repel the nearby 8a Fe ions to the other surface-sharing 16c site, which forms the
structure identical to that observed in the HRTEM images in Figure 4. In addition, since the
octahedral 16c sites are interconnected as a 3D channel, the initial intercalation would proceed in
a disordered path, which explains the irregular patterns that are observed during the shrinking-
core process in Figure 3. After all of the octahedral 16c sites are filled by Li, the rocksalt lattice
becomes more isotropic to the incoming Li ions, which makes the subsequent conversion most
likely to propagate across the outline of crystal, again as observed in Figure 3.
Discussion. Given the basics of chemical thermodynamics, the equilibrium lithiation
should go through the LiFe3O4 phase and the subsequent Fe+Li2O composite in two non-
overlapping processes, as proposed by Thackeray et al.16-18 However, our in situ results show a
clear overlap between the two steps, suggesting that the kinetic effects play an important role
during lithiation. On the other hand, the phase-field theory, taking into account the effect of
overpotentials, has succeeded in explaining the electrochemical kinetics in lithium-ion battery
systems. 53-55 We performed the phase-field simulations in the frame of non-equilibrium

13
thermodynamics based on the Butler-Volmer equation55, 56 and the Cahn-Hilliard equation.23, 57
To simulate the two-step reaction, we constructed a homogeneous free-energy function with
three local minima corresponding to the pristine, intercalation, and conversion phases,
respectively. In addition, the kinetic contributions from overpotential and volumetric strain have
also been included (details in Supplementary Information). The calculated discharge voltage
profile is shown in Figure 5c, which qualitatively agrees with the experimental curves in Figure
1e. Figure 5d shows the calculated lithium compositional profiles as a function of time (x axis is
the dimensionless lithiation direction and y axis is the Li composition, details shown in Movie 3).
It is found that the formation of LiFe3O4 phase is predominant in the early stage of lithiation,
whereas the conversion reaction initiates immediately afterward and propagates before the
complete intercalation, resulting in a mixed lithiation behavior, which is in excellent agreement
with the in situ STEM observation (Figure 3a). It is well known that the lithiation process (redox
stage and reaction speed) in a real battery is heterogeneous due to the fluctuation of local
environments.22 Here we reasonably assume that the local electrochemical conditions are
identical for these two reactions within one nanoparticle. By comparing the in situ STEM results
with phase-field simulation, we believe that the coexistence of Fe3O4, LixFe3O4, and Fe+Li2O
phases are due to the competition between the intercalation and conversion reactions. The overall
electrochemical kinetics dictates to the applied C-rate, which in turn determines the propagation
speeds of the interfaces of Fe3O4/LixFe3O4 and LixFe3O4/Fe+Li2O. Although the reaction speed
of intercalation is much faster, the conversion reaction accommodates more Li ions. Therefore,
in terms of total lithium insertion capacity, both reactions give important contributions to the
overall energy storage rate.

14
The kinetic lithiation mechanism we proposed here can accommodate the following
phenomena which could not be interpreted by the equilibrium theory. (1) As for the discharge
profiles in Figure 1e and in literature,9-11 even the intercalation reaction has not completed, the
occurrence of conversion reaction on the surface will reduce the apparent discharge voltage
which consequently flattens the first plateau. (2) As for the previous debate on the existence of
metallic Fe extrusion,16-19 due to the kinetic effect, the conversion reaction can happen at the
same time of the intercalation reaction, which induces the formation of metallic Fe. For the
discharge process at a low rate, the extrusion of metallic Fe is not expected to be observed.
In summary, we have investigated the lithiation mechanism of spinel magnetite using in
situ strain-sensitive BF-STEM technique as well as DFT and phase-field simulations. By explicit
visualization of the two-step intercalation-conversion process of the lithiation in Fe3O4
nanocrystals, we found that the initial lithium incalatation leads to formation of the rocksalt
LiFe3O4 phase in a two-phase reaction mode, and the lithium intercalation process significantly
overlaps with the subsequent conversion reaction within a single nanoparticle, leading to
indistinctness of the discharge profiles. This senario aslo clarifies the mechanism of metallic Fe
extrusion during the intercalation process. Our findings have elucidated the ionic occupancy on
the atomic level and revealed how rate-dependent kinetic effects can affect the reaction pathway
at the single-particle scale. These findings highlight the importance of advanced in situ electron
microscopy techniques in the field of lithium ion batteries and provide valuable insights to
improve the electrochemical performances of other spinel lithium metal oxide cathode materials.

15
Methods
Materials. Iron acetylacetonate (Fe(acac)3, 99%), oleic acid (OAc, 90%), benzyl ether (BE,
99%), nitrosonium tetrafluoroborate (NOBF4, 95%) were purchased from Sigma-Aldrich and
used without any further purification. All solvents, including hexane, isopropanol, toluene,
dimethylformamide (DMF), were in ACS reagent grade and were purchased from Fisher
Scientific and used without further purification. Nanoparticle synthesis was performed using
standard Schlenk techniques.
Sample preparation. The Fe3O4 nanoparticles were synthesized by the decomposition of
Fe(acac)3 in the presence of oleic acid. In a typical synthesis, 2 mmol of Fe(acac)3 was mixed
with 1.28 ml of OAc and 10 ml of BE. The mixture was magnetically stirred and was kept under
vacuum at 100 ºC to generate a dark red solution. After evacuation at 100 ºC for 1 hour to
remove all impurities and moisture, the system was filled with N2 and the solution was further
heated to 290 ºC at a rate of about 15 °C/min and kept at this temperature for 20 minutes. After
cooling to room temperature, the NPs were separated by adding isopropanol, followed by
centrifugation (8500 rpm, 5 min). The NPs were further purified by sequential operations of
dispersing in hexane, precipitation by adding isopropanol, and centrifugation. The as-synthesized
Fe3O4 nanoparticles were surface-passivated by OAc which can be ligand-exchanged by NOBF4
according to literature.58 0.1 g of NOBF4 was added into 10 ml DMF, resulting in immediately a
light green solution. This NOBF4 DMF solution is added to the hexanes solution (10 ml) of
Fe3O4 NPs (100 mg). The mixture was shaken for 10 min, followed by the addition of 25 ml of
toluene. The NOBF4-modified Fe3O4 NPs were collected through centrifugation (7000 rpm, 8
min). The Fe3O4 NPs after ligand exchange can be solubilized in DMF with sonication. To
remove residual organics, The NPs were further purified by two cycles of re-dispersing in DMF

16
and precipitation by adding toluene-centrifugation. The NPs were either stored in DMF or
evacuated at the room temperature overnight to make dry powder for further experiments.
Electrochemical measurements. Composite electrodes were prepared with 80 wt% active
material, 10 wt% polyvinylidene fluoride (PVDF) and 10 wt% acetylene carbon black in N-
methyl-2-pyrrolidone (NMP) and cast onto copper current collectors. 2032-type coin cells were
assembled in an argon-filled glove box using the composite electrode as the positive electrode
and Li metal as the negative electrode. A Celgard separator 2400 and 1 M LiPF6 electrolyte
solution in 1:1 w/w ethylene carbonate (EC) /dimethyl carbonate (DMC) were used to fabricate
coin cells. Battery testing was performed on computer controlled systems (Arbin BT2000 and
BioLogic VMP3) at 21oC.
TEM characterization. The in situ TEM electrochemical cell was incorporated into a
Nanofactory TEM-STM specimen holder, in which Fe3O4 nanoparticles dispersed onto a TEM
half-grid with amorphous carbon support are analogous to the Fe3O4-C composite electrode, Li
metal is coated onto a piezo-driven W probe as the counter electrode, with a thin layer of Li2O
formed on Li metal as the solid electrolyte.36-38 The Li and Fe3O4 were loaded onto the holder in
an Ar-filled glovebox and then transferred to TEM column using a sealed Ar bag to avoid air
exposure. During the in situ electrochemical tests, a constant negative DC potential was applied
to Fe3O4 electrode against the Li source during the lithiation process, and the lithiation processes
were captured by real-time imaging in either TEM or STEM mode. We estimated the average
discharge current density across the entire particle surface to be 0.017 mA/cm2. The ex situ
samples after discharge in coin cells were examined accordingly. The in situ BF-STEM
measurements were performed on a JEOL 2100F TEM operated at 200 kV. We have used a
convergence angle of 12 mrad and a collection angle cut off at ~20 mrad. The high-resolution

17
STEM imaging and analytical EELS were conducted on a Hitachi HD2700C STEM operated at
200 kV and equipped with a probe aberration corrector (spatial resolution < 1 Å, energy
resolution 0.35 eV).
Theoretical calculations. The density functional theory (DFT) calculations were performed
using the Vienna Ab initio Simulation Package (VASP) within the projector augmented-wave
approach with the Perdew−Burke−Ernzerhof generalized-gradient approximation (GGA). The
DFT parameters were consistent with the parameters used in Materials Project (MP).48 A
Hubbard U term of 5.3 eV is adopted for Fe2+ and Fe3+ in accordance with the MP and the
previous testing.51, 52 The ground-state crystal structures of LiFe3O4 were obtained by
enumerating 380 symmetrically distinctive configurations of Li/Fe disordering at the 16c sites
using pymatgen.49 Several magnetic orderings in ferromagnetic, antiferromagnetic, and
ferrimagnetic structures are tested for iron oxide compounds, such as Fe3O4, FeO, LiFe3O4, and
LiFeO2, to identify the lowest energy state (more details provided in Supplementary Information).
The voltage plateaus are obtained using the DFT energies of all relevant compounds in the Li-
Fe-O ternary space from the MP.50
The phase-field simulations were performed using the electrochemistry theory based on non-
equilibrium thermodynamics developed by Bazant and coworkers.53-55 The standard
phenomenological model based on the Butler-Volmer equation55, 56 and the Cahn-Hilliard
equation23, 57 was used for modeling the electrochemical kinetics. A homogeneous free-energy
was comprised using piecewise functions of polynomial with continuity and differentiability at
the segment points. The overpotential and strain energy are also considered in the simulation.
More details are shown in Supplementary Information.
18
References
1. Poizot, P., Laruelle, S., Grugeon, S., Dupont, L. & Tarascon, J. M. Nano-sized transition-metal oxides as negative-electrode materials for lithium-ion batteries. Nature 407, 496-499 (2000).
2. Tarascon, J. M. & Armand, M. Issues and challenges facing rechargeable lithium batteries. Nature 414, 359-367 (2001).
3. Whittingham, M. S. Lithium Batteries and Cathode Materials. Chem. Rev. 104, 4271-4301 (2004).
4. Goodenough, J. B. & Kim, Y. Challenges for Rechargeable Li Batteries. Chem. Mater. 22, 587-603 (2010).
5. Ferg, E., Gummow, R. J., de Kock, A. & Thackeray, M. M. Spinel Anodes for Lithium-Ion Batteries. J. Electrochem. Soc. 141, L147-L150 (1994).
6. Cabana, J., Monconduit, L., Larcher, D. & Palacin, M. R. Beyond Intercalation-Based Li-Ion Batteries: The State of the Art and Challenges of Electrode Materials Reacting Through Conversion Reactions. Adv. Mater. 22, E170-E192 (2010).
7. Malini, R., Uma, U., Sheela, T., Ganesan, M. & Renganathan, N. G. Conversion reactions: a new pathway to realise energy in lithium-ion battery—review. Ionics 15, 301-307 (2009).
8. Taberna, P. L., Mitra, S., Poizot, P., Simon, P. & Tarascon, J. M. High rate capabilities Fe3O4-based Cu nano-architectured electrodes for lithium-ion battery applications. Nat. Mater. 5, 567-573 (2006).
9. Mitra, S., Poizot, P., Finke, A. & Tarascon, J. M. Growth and Electrochemical Characterization versus Lithium of Fe3O4 Electrodes Made via Electrodeposition. Adv. Func. Mater. 16, 2281-2287 (2006).
10. Zhou, G. et al. Graphene-Wrapped Fe3O4 Anode Material with Improved Reversible Capacity and Cyclic Stability for Lithium Ion Batteries. Chem. Mater. 22, 5306–5313 (2010).
11. Ji, L. et al. Fe3O4 nanoparticle-integrated graphene sheets for high-performance half and full lithium ion cells. Phys. Chem. Chem. Phys. 13, 7170–7177 (2011).
12. Zhang, W. M., We, X. L., Hu, J. S., Guo, Y. G. & Wan, L. J. Carbon Coated Fe3O4 Nanospindles as a Superior Anode Material for Lithium-Ion Batteries. Adv. Func. Mater. 18, 3941-3946 (2008).
13. He, Y., Huang, L., Cai, J. S., Zheng, X. M. & Sun, S. G. Structure and electrochemical performance of nanostructured Fe3O4/carbon nanotube composites as anodes for lithium ion batteries. Electrochim. Acta 55, 1140-1144 (2010).

19
14. Xiong, Q. Q. et al. Synthesis of Hierarchical Hollow-Structured Single-Crystalline Magnetite (Fe3O4) Microspheres: The Highly Powerful Storage versus Lithium as an Anode for Lithium Ion Batteries. J. Phys. Chem. C 116, 6495-6502 (2012).
15. Hariharan, S., Saravanan, K., Ramar, V. & Balaya, P. A rationally designed dual role anode material for lithium-ion and sodium-ion batteries: case study of eco-friendly Fe3O4. Phys. Chem. Chem. Phys. 15, 2945-2953 (2013).
16. Thackeray, M. M., David, W. I. F. & Goodenough, J. B. structural characterization of the lithiated iron oxides LixFe3O4 and LixFe2O3 (0<x<2). Mater. Res. Bull. 17, 785–793 (1982).
17. Thackeray, M. M. et al. Spinel electrodes for lithium batteries – a review. J. Power Sources 21, 1-8 (1987).
18. Thackeray, M. M. Spinel Electrodes for Lithium Batteries. J. Am. Ceram. Soc. 82, 3347-3354 (1999).
19. Fontcuberta, J., Rodriguez, J., Pernet, M., Longworth, G. & Goodenough, J. B. Structural and magnetic characterization of the lithiated iron oxide LixFe3O4. J. Appl. Phys. 59, 1918-1926 (1986).
20. Sivakumar, V., Kumar, S., Ross, C. A. & Shao-Horn, Y. Electrochemical Lithium Insertion of into Iron Oxide Spinel Thin Films and Nanoparticles: Changes in Structure and Magnetic Properties. ECS Trans. 2, 1-11 (2007).
21. Islam, M. S. & Catlow, C. R. A. J. Solid State Chem. 77, 180-189 (1988).
22. Liu, H. et al. Capturing metastable structures during high-rate cycling of LiFePO4 nanoparticle electrodes. Science 344, 1252817 (2014).
23. Li, Y. et al. Current-induced transition from particle-by-particle to concurrent intercalation in phase-separating battery electrodes. Nat. Mater. 13, 1149-1156 (2014).
24. Arico, A. S., Bruce, P., Scrosati, B., Tarascon, J. M. & van Schalkwijk, W. Nanostructured materials for advanced energy conversion and storage devices. Nat. Mater. 4, 366-377 (2005).
25. Jamnik, J. & Maier, J. Nanocrystallinity effects in lithium battery materials: Aspects of nano-ionics Part IV. Phys. Chem. Chem. Phys. 5, 5215-5220 (2003).
26. Malik, R., Burch, D., Bazant, M. & Ceder, G. Particle Size Dependence of the Ionic Diffusivity. Nano Lett. 10, 4123-4127 (2010).
27. Malik, R., Zhou, F. & Ceder, G. Kinetics of non-equilibrium lithium incorporation in LiFePO4. Nat. Mater. 10, 587–590 (2011).
28. Huang, J. Y. et al. In Situ Observation of the Electrochemical Lithiation of a Single SnO2 Nanowire Electrode. Science 330, 1515-1520 (2010).

20
29. Liu, X. H. et al. In situ atomic-scale imaging of electrochemical lithiation in silicon. Nat. Nanotechnol. 7, 749-756 (2012).
30. Liu, Y. et al. In Situ Transmission Electron Microscopy Observation of Pulverization of Aluminum Nanowires and Evolution of the Thin Surface Al2O3 Layers during Lithiation-Delithiation Cycles. Nano Lett. 11, 4188-4194 (2011).
31. McDowell, M. T. et al. Studying the Kinetics of Crystalline Silicon Nanoparticle Lithiation with In Situ Transmission Electron Microscopy. Adv. Mater. 24, 6034-6041 (2012).
32. McDowell, M. T. et al. In Situ Observation of Divergent Phase Transformations in Individual Sulfide Nanocrystals", Nano Lett. 15, 1264-1271 (2015).
33. Gu, M. et al. In Situ TEM Study of Lithiation Behavior of Silicon Nanoparticles Attached to and Embedded in a Carbon Matrix. ACS Nano 6, 8439-8447 (2012).
34. Gu, M. et al. Probing the Failure Mechanism of SnO2 Nanowires for Sodium-Ion Batteries. Nano Lett. 13, 5203-5211 (2013).
35. Nie, A. et al. Atomic-Scale Observation of Lithiation Reaction Front in Nanoscale SnO2 Materials. ACS Nano 7, 6203-6211 (2013).
36. He, K. et al. Sodiation via Heterogeneous Disproportionation in FeF2 Electrodes for Sodium-Ion Batteries. ACS Nano 8, 7251-7259 (2014).
37. He, K. et al. Transitions from Near-Surface to Interior Redox upon Lithiation in Conversion Electrode Materials. Nano Lett. 15, 1437-1444 (2015).
38. He, K. et al. Sodiation Kinetics of Metal Oxide Conversion Electrodes: a Comparative Study with Lithiation. Nano Lett. 15, 5755-5763 (2015).
39. Zhu, Y. et al. In Situ Atomic-Scale Imaging of Phase Boundary Migration in FePO4 Microparticles During Electrochemical Lithiation. Adv. Mater. 25, 5461-5466 (2013).
40. Niu, J. et al. In situ observation of random solid solution zone in LiFePO4 electrode. Nano Lett. 14, 4005-4010 (2014).
41. Sun, Y. et al. Direct atomic-scale confirmation of three-phase storage mechanism in Li4Ti5O12 anodes for room-temperature sodium-ion batteries. Nat. Commun. 4, 1870 (2013).
42. Lu, X. et al. Lithium storage in Li4Ti5O12 spinel: The full static picture from electron microscopy. Adv. Mater. 24, 3233-3238 (2012).
43. Laruelle, S. et al. On the Origin of the Extra Electrochemical Capacity Displayed by MO/Li Cells at Low Potential. J. Electrochem. Soc. 149, A627-A634 (2002).

21
44. Ponrouch, A., Taberna, P. L., Simon, P. & Palacin, M. R. On the origin of the extra capacity at low potential in materials for Li batteries reacting through conversion reaction. Electrochimica Acta 61, 13-18 (2012).
45. Hu, Y. Y. et al. Origin of additional capacities in metal oxide lithium-ion battery electrodes. Nat. Mater. 12, 1130-1136 (2013).
46. Weppner, W., & Huggins, R. A. Determination of the Kinetic Parameters of Mixed-‐Conducting Electrodes and Application to the System Li3Sb. J. Electrochem. Soc. 124, 1569-1578 (1977).
47. Pennycook, S. J. & Nellist, P. D. Scanning Transmission Electron Microscopy Imaging and Analysis. 97-101, (Springer Science & Business Media, 2011).
48. Jain, A. et al. A high-throughput infrastructure for density functional theory calculations. Comp. Mater. Sci. 50, 2295–2310 (2011).
49. Ong, S. P. et al. Python Materials Genomics (pymatgen): A Robust, Open-Source Python Library for Materials Analysis. Comp. Mater. Sci. 68, 314–319 (2013).
50. Jain, A. et al. The Materials Project: A materials genome approach to accelerating materials innovation. APL Mater. 1, 011002 (2013).
51. Jain, A. et al. Formation enthalpies by mixing GGA and GGA+U calculations. Phys. Rev. B 84, 045115 (2011).
52. Wang, L., Maxisch, T. & Ceder, G. Oxidation energies of transition metal oxides within the GGA+U framework. Phys. Rev. B 73, 195107 (2006).
53. Bazant, M. Z. Theory of Chemical Kinetics and Charge Transfer based on Nonequilibrium Thermodynamics. Acc. Chem. Res. 46, 1144-1160 (2013).
54. Bai, P., Cogswell, D. A. & Bazant, M. Z. Suppression of Phase Separation in LiFePO4 Nanoparticles During Battery Discharge. Nano Lett. 11, 4890-4896 (2011).
55. Biesheuvel, P. M., van Soestbergen, M. &Bazant, M. Z. Imposed currents in galvanic cells. Electrochimica Acta 54, 4857-4871 (2009).
56. Newman, J. Electrochemical Systems, 2nd Ed. (Prentice Hall, 1991).
57. Cahn, J. W. & Hilliard, J. E. Free Energy of a Nonuniform System. I. Interfacial Free Energy. J. Chem. Phys. 28, 258-267 (1958).
58. Dong, A. et al. A Generalized Ligand-Exchange Strategy Enabling Sequential Surface Functionalization of Colloidal Nanocrystals. J. Am. Chem. Soc. 133, 998–1006 (2011).

22
Acknowledgements
This research used resources of the Center for Functional Nanomaterials, which is a U.S. DOE
Office of Science Facility, at Brookhaven National Laboratory under Contract No. DE-
SC0012704. X.Y. and X.-Q.Y. were supported by the U.S. DOE, the Assistant Secretary for
Energy Efficiency and Renewable Energy, Office of Vehicle Technologies under Contract No.
DE-SC00112704. The authors acknowledge the technical support by Dr. Wenqian Xu from
Beamline 17-BM-B of Advanced Photon Source at Argonne National Laboratory. S.Z., H.Y. and
C.B.M. acknowledge the support of MRSEC award No. DMR-1120901. S.Z. also acknowledges
the support of the NatureNet Science Fellowship. Q.M. and Yimei Z. were supported by
DOE/BES, Division of Materials Science and Engineering, under Contract No. DE-SC0012704.
Work by J. L. and E. A. S. are supported as part of the Center for Mesoscale Transport Properties,
an Energy Frontier Research Center supported by the U.S. Department of Energy, Office of
Science, Basic Energy Sciences, under award #DE-SC0012673. Yizhou Z. and Y.M.
acknowledge the support of the Minta Martin award at University of Maryland, and the
computational resources from Extreme Science and Engineering Discovery Environment
(XSEDE) supported by National Science Foundation Grant No. TG-DMR130142 and from
University of Maryland supercomputing resources. We thank Dr. Peng Bai for helpful discussion
on phase-field simulaitons.
Author contributions
K.H., S.Z., D.S. and C.B.M conceived and designed the experiments. K.H., D.S. and J.L.
performed in situ and ex situ TEM experiments. S.Z., H.Y., and C.B.M. synthesized the Fe3O4
samples. X.Y., X.-Q.Y., J.L., K.S. and H.G. conducted electrochemical tests. Yizhou Z. and Y.M.

23
performed DFT simulation. Q.M. performed phase-field simulation. K.H. prepared the figures
and wrote the manuscript with D.S., S.Z., E.A.S., Yimei Z. and C.B.M. D.S. supervised the
project. All the authors participated in discussion of the results.
Additional information
Supplementary Information accompanies this paper at
http://www.nature.com/naturecommunications
Competing financial interests: The authors declare no competing financial interests.
Reprints and permissions information is available online at
http://npg.nature.com/reprintsandpermission

24
Figure 1 | Electrode materials and electrochemical performance. (a) STEM image
of the pristine Fe3O4 single crystals. Inset showing the crystals in the truncated
octahedral shape. (b) High-resolution HAADF-STEM image showing spinel structure
along [1-10] zone axis. Inset showing enlarged STEM image compared to the atom

25
model. (c) TEM image and (d) SAED pattern of the fully lithiated electrode, confirming
the nanocomposite of Fe nanocrystals in amorphous Li2O matrix. Scale bars, (a, c) 20
nm; (b) 1nm. (e) First-cycle charge/discharge profiles of coin-cell batteries at rates of 1C,
C/10, and C/200 (i.e., 926 mA g-1, 92.6 mA g-1, and 4.63 mA g-1). (f) GITT and OCV
profiles in the first discharge cycle measured at C/50 (18.5 mA g-1). (g) SXRD patterns
of LixFe3O4 at various SOCs (x = 0, 0.5, 1, 1.5, 2, 3, 4). (h) Enlarged SXRD patterns
showing detailed peak shifts of (311), (222) and (440) reflections. Fe3O4 and LiFe3O4
phases are marked by black and red arrows. X-ray wavelength is 0.72768 Å.

26
Figure 2 | Phase evolution probed by in situ electron diffraction. (a) Electron
diffraction intensity profile (the color map in the middle) as a function of reaction time
during an in situ lithiation of Fe3O4 nanoparticles (see Movie 1). The SAED patterns and
corresponding radially integrated intensity profiles obtained at pristine (0s) and fully
lithiated (3400s) states are shown below and above the color map, respectively. Arrows
indicate diffraction peak shift towards a lower value in the reciprocal space. The sample
was lithiated at a rate of ~980 mA g-1. (b) Intensity profiles of Fe3O4 (311) and Fe (110)
Bragg reflections during the lithiation, indicating the phase evolution of Fe3O4 and Fe. (c)
Lattice parameter measured from Fe3O4 (311) and (511) reflections showing an
incremental shift as a function of lithiation time, which quantitatively agrees with the
SXRD results. Blue lines indicate lattice parameters of Fe3O4 and LiFe3O4 measured by
SXRD in Figure 1g.

27
Figure 3 | In situ observation of two-step phase transformation during lithiation process. (a) BF-STEM image series showing phase evolution upon lithiation. The
overlaid false colors indicate different phases: pristine Fe3O4 (red), Li-inserted LixFe3O4
(blue), and Fe+Li2O composition after conversion (green). Scale bar, 20 nm. The
sample was lithiated at a rate of ~2700 mA g-1. (b) Projected areas of the three phases
as a function of time. (c) Propagation speed of intercalation and conversion as a
function of time.
28
Figure 4 | Atomic structural evolution of phase transformation from spinel to rocksalt structures. (a, b) HRTEM images of a Fe3O4 single crystal showing the spinel
and rocksalt phases during in situ lithium intercalation. Insets showing the FFT of the
spinel (top-right) and rocksalt (top-left) structures along [0-11] zone axis. (e) HRTEM
image of a partially lithiated Fe3O4 single crystal from ex situ lithiation. (f) The FFT of (e).
(h, i) The enlarged HRTEM images of boxed regions in (e) showing spinel and rocksalt
structures, respectively. (c, d, g) Filtered images of (a, b, e) using two sets of spinel (red)
and rocksalt (green) diffraction spots to indicate the corresponding phase distribution.
The samples were lithiated at ~150 mA g-1 for in situ lithiation, and 92.6 mA g-1 for ex
situ lithiation. Scale bars, (a, b, e) 5 nm; (h, j) 5 Å.
29
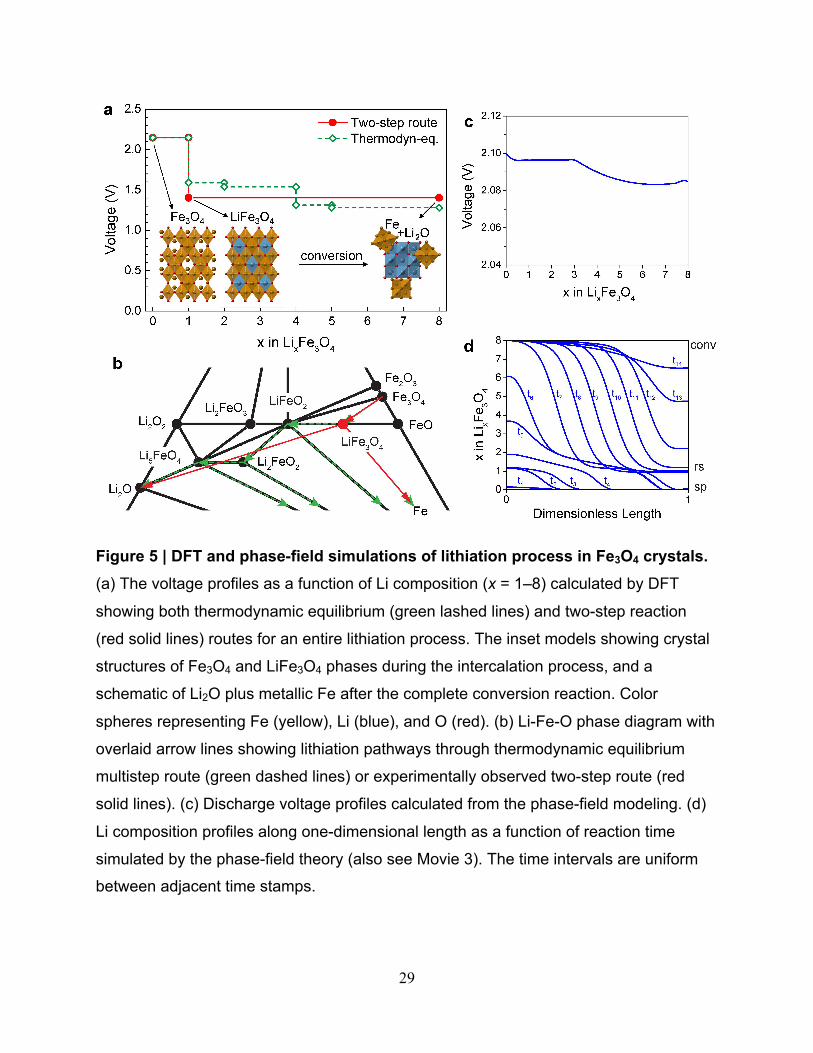
Figure 5 | DFT and phase-field simulations of lithiation process in Fe3O4 crystals. (a) The voltage profiles as a function of Li composition (x = 1–8) calculated by DFT
showing both thermodynamic equilibrium (green lashed lines) and two-step reaction
(red solid lines) routes for an entire lithiation process. The inset models showing crystal
structures of Fe3O4 and LiFe3O4 phases during the intercalation process, and a
schematic of Li2O plus metallic Fe after the complete conversion reaction. Color
spheres representing Fe (yellow), Li (blue), and O (red). (b) Li-Fe-O phase diagram with
overlaid arrow lines showing lithiation pathways through thermodynamic equilibrium
multistep route (green dashed lines) or experimentally observed two-step route (red
solid lines). (c) Discharge voltage profiles calculated from the phase-field modeling. (d)
Li composition profiles along one-dimensional length as a function of reaction time
simulated by the phase-field theory (also see Movie 3). The time intervals are uniform
between adjacent time stamps.