Pro Bono Economics Report for National Cost of outcomes ... National... · 2 Pro Bono Economics is...
31
Pro Bono Economics Report for National Numeracy Cost of outcomes associated with low levels of adult numeracy in the UK March 2014 Pro Bono Economics Reg. Charity No. 1130567 National Numeracy Reg. Charity No. 1145669
Transcript of Pro Bono Economics Report for National Cost of outcomes ... National... · 2 Pro Bono Economics is...

1
Pro Bono Economics Report for National Numeracy Cost of outcomes associated with low levels of adult numeracy in the UK
March 2014
Pro Bono Economics Reg.
Charity No. 1130567
National Numeracy Reg.
Charity No. 1145669

2
Pro Bono Economics is delighted to introduce this report, the results of analysis undertaken
by Rose Martin and Helen Hodgson, with Andy Maloney and Inna Rayner.
Pro Bono Economics was founded in 2009 with the aim of bringing the skills of economists
into the third sector, working pro bono. Many charities could benefit from the expertise of
economists, particularly in helping to understand measurement, impact and value. We think
that by bringing together economists and charities we can not only benefit individual
charities, but also publish analysis that can help the sector more broadly.
We hope this report will support the work of National Numeracy in bringing to the public’s
attention the problem of low adult numeracy in the UK, and will help them in developing
approaches to address the issue.
We would like to thank the team at National Numeracy for their support throughout the
project, and Emily Hunt who brought her expertise and insights to peer reviewing this
report.
The analysis was carried out under the auspices of Pro Bono Economics by volunteer analysts
employed by the National Audit Office. It was peer-reviewed by economist Emily Hunt in a voluntary
and personal capacity. The work is the responsibility of the volunteers involved and does not
represent the corporate positions of their employers.

3
Contents
1 Executive summary ......................................................................................................................... 4
2 Scope ............................................................................................................................................... 9
3 Background ..................................................................................................................................... 9
3.1 Rationale ................................................................................................................................. 9
3.2 Definition of numeracy ........................................................................................................... 9
4 Method ......................................................................................................................................... 10
4.1 Summary of our approach .................................................................................................... 10
4.2 Analytical issues affecting what we can and cannot conclude ............................................. 11
4.2.1 Extrapolation from microeconometric studies ............................................................. 11
4.2.2 Aggregation of figures across the UK ............................................................................ 12
4.2.3 Causal evidence ............................................................................................................. 12
4.2.4 Incomplete evidence base on the impacts of low numeracy ....................................... 13
4.2.5 Assumption of homogeneity of the relationship between outcomes and numeracy .. 13
4.2.6 Implications ................................................................................................................... 13
5 Findings ......................................................................................................................................... 14
5.1 Employment .......................................................................................................................... 14
5.1.1 Previous research on the earnings premium ................................................................ 14
5.1.2 Previous research on unemployment and the likelihood of being in work .................. 16
5.1.3 Previous research on the impacts of lower skills on employers ................................... 18
5.1.4 Our estimates: earnings-related costs .......................................................................... 18
5.1.5 Our estimates: unemployment-related costs ............................................................... 22
5.2 Health .................................................................................................................................... 23
5.3 Crime ..................................................................................................................................... 26
5.4 Financial planning and pensions ........................................................................................... 27
5.5 Inter-generational transfer ................................................................................................... 27
5.5.1 Effect on children’s numeracy if parents have low numeracy ...................................... 27
5.5.2 Effect on children’s wider skills if parents have low numeracy .................................... 28
6 Concluding section: comparison with previous findings, and suggestions for further research .. 29
7 Bibliography .................................................................................................................................. 29
4
1 Executive summary
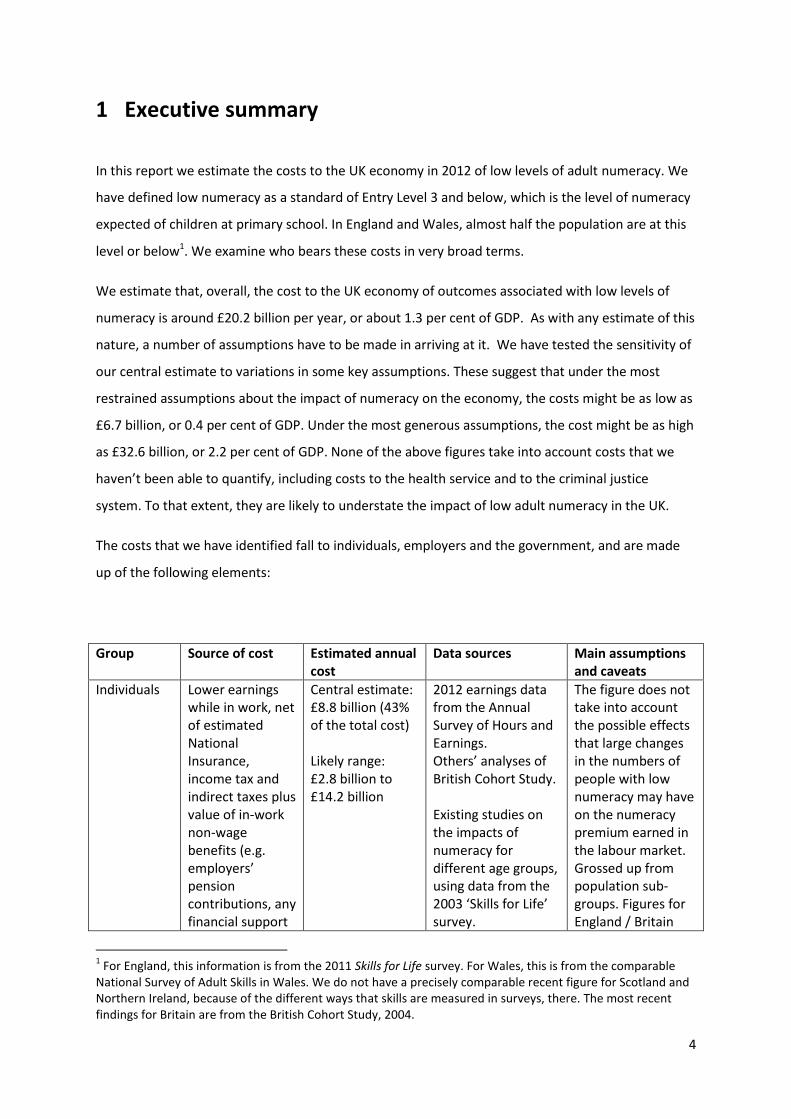
In this report we estimate the costs to the UK economy in 2012 of low levels of adult numeracy. We
have defined low numeracy as a standard of Entry Level 3 and below, which is the level of numeracy
expected of children at primary school. In England and Wales, almost half the population are at this
level or below1. We examine who bears these costs in very broad terms.
We estimate that, overall, the cost to the UK economy of outcomes associated with low levels of
numeracy is around £20.2 billion per year, or about 1.3 per cent of GDP. As with any estimate of this
nature, a number of assumptions have to be made in arriving at it. We have tested the sensitivity of
our central estimate to variations in some key assumptions. These suggest that under the most
restrained assumptions about the impact of numeracy on the economy, the costs might be as low as
£6.7 billion, or 0.4 per cent of GDP. Under the most generous assumptions, the cost might be as high
as £32.6 billion, or 2.2 per cent of GDP. None of the above figures take into account costs that we
haven’t been able to quantify, including costs to the health service and to the criminal justice
system. To that extent, they are likely to understate the impact of low adult numeracy in the UK.
The costs that we have identified fall to individuals, employers and the government, and are made
up of the following elements:
Group Source of cost Estimated annual cost
Data sources Main assumptions and caveats
Individuals Lower earnings while in work, net of estimated National Insurance, income tax and indirect taxes plus value of in-work non-wage benefits (e.g. employers’ pension contributions, any financial support
Central estimate: £8.8 billion (43% of the total cost) Likely range: £2.8 billion to £14.2 billion
2012 earnings data from the Annual Survey of Hours and Earnings. Others’ analyses of British Cohort Study. Existing studies on the impacts of numeracy for different age groups, using data from the 2003 ‘Skills for Life’ survey.
The figure does not take into account the possible effects that large changes in the numbers of people with low numeracy may have on the numeracy premium earned in the labour market. Grossed up from population sub-groups. Figures for England / Britain
1 For England, this information is from the 2011 Skills for Life survey. For Wales, this is from the comparable
National Survey of Adult Skills in Wales. We do not have a precisely comparable recent figure for Scotland and Northern Ireland, because of the different ways that skills are measured in surveys, there. The most recent findings for Britain are from the British Cohort Study, 2004.

5
for childcare, etc.) Age and skill distributions from the 2011 ‘Skills for Life’ survey. Non-wage labour costs calculated on the basis of the proportion given in HM Treasury’s ‘Green Book’.
applied to whole UK. Non-wage in-work benefits assumed equal to non-wage labour costs. Excludes lost earnings from increased risk of unemployment.
Employers Less post-tax profit due to lower output /productivity of workers.
Central estimate: £3.2 billion (16% of the total cost) Likely range: £1.0 billion to £5.2 billion
Based on grossing up post-tax benefits to individuals by ratio of share of profits to labour income in GDP
Assumes no change in labour and profits shares of GDP if numeracy increased.
Government Exchequer costs associated with payments to individuals of Jobseekers Allowance, foregone direct and indirect taxes on lower earnings of those in work.
Central estimate: £8.2 billion Likely range: £2.9 billion to £13.2 billion
Based on others’ analysis of the England Skills for Life 2003 survey; official claimant count statistics; and distribution information from the 2011 English Skills for Life survey; DWP estimates of the fiscal returns to moving individuals from JSA into work. Based on earnings calculations above; HMRC records of tax rates; ONS information on the effects of taxes at different levels of income.
Benefits payments to individuals limited to Jobseeker’s Allowance; estimate does not take into account other income-related benefits. Grossed-up estimates based on average rates of tax and earnings.
TOTAL Central estimate: £20.2 billion Likely range: £6.7 billion to £32.6 billion

6
Figure 1 : Who bears the costs?
Source: PBE volunteer estimates
We used findings from a number of previous studies, in addition to publicly available data on the
labour market, to arrive at these estimates. Our estimates are based on the crucial assumption that
improved outcomes associated with higher levels of numeracy would scale up to the whole
population. This means for example that we are assuming that a big increase in the numbers of
working age adults with higher numeracy does not affect the wage premium that numeracy
currently commands.

7
Another crucial assumption is that better outcomes associated with higher numeracy are fully
caused by that numeracy differential. The evidence supporting that assumption is reasonably strong.
It is largely based on econometric studies that strip out the effects of a wide range of individual
characteristics such as age, gender, social background. However, it does not strip out the possible
confounding effects of numeracy-relevant factors that can’t be measured in existing studies, such as
unmeasured cognitive or soft skills.
A 2009 report by KPMG The long-term costs of numeracy difficulties, carried out for the Every Child a
Chance Trust, found that the annual costs to the public purse from the lifetime effects of a failure to
master basic numeracy skills in the primary school years were up to £2.4 billion a year. Of this total,
£1.9 billion (i.e. 78%) related to the forgone tax revenues and increased unemployment benefits
from employment costs. Neither of these figures is comparable to those produced in this report, for
a large number of reasons. The chief difference is that the KPMG estimate is the lifetime costs for
one cohort of around 36,000 Year 7 primary school children with numeracy difficulties. It includes
for example additional education costs such as special needs education and the costs of truancy. But
it does not include the costs to the individual of lower earning, only the foregone taxes on those
earnings.
By contrast, the estimates in this report relate to the one-year cost to individuals in the whole
working age population, to firms and to the public purse.
Beyond the costs associated with poorer labour market fortunes, lower profits for firms and lower
net tax receipts from government, summarised above, there are other ways that low numeracy
could incur costs for individuals and for the government. Although we have not been able to
quantify these, due to a lack of reliable or relevant data, their effect will be to increase the estimates
of the costs of numeracy we have made above. In this paper we discuss the evidence on the links
between numeracy and:
health outcomes
rates of crime
personal and social skills such as self-esteem and confidence
financial planning, including poor pension planning, leading to costs for individuals and
suboptimal allocation of resources; and
educational outcomes for the children of those with low levels of numeracy, leading to
additional costs for schools and long-term costs for the children themselves.
8
When deciding how best to tackle the costs of low numeracy, simply knowing where the greatest
costs fall is not sufficient. It is important to understand what types of interventions are most
effective and cost-effective in order to prioritise action. This is an issue beyond the scope of our
analysis.
We see this paper as the starting point for debate and further work. Further analysis and
investigation which could usefully be done in the future includes:
Investigating whether the labour market penalty attached to low numeracy has
increased – as some authors have suggested – in recent years.
Investigating whether it is possible to make a reasonably robust estimate of the life-
time cost of low numeracy to individuals, perhaps using pseudo-cohort analysis as has
been used to estimate the life-time value of a degree. There may be data limitations
that prevent applying this approach to a skill as compared with a qualification.
However, a metric such as this which could be related to something meaningful to
adults - e.g. to the cost of a house - would have some salience for individuals and may
motivate more desire to seek help to improve numeracy.
Synthesising and extending the evidence on ‘what works’ to improve adult numeracy;
and
Investigating the cost-effectiveness of policies, programmes and interventions to
improve adult numeracy.

9
2 Scope
National Numeracy is a charity focused on children and adults with low numeracy. Its aim is to
challenge prevailing attitudes, influence public policy and research, and identify and promote
effective approaches to improving numeracy.
National Numeracy asked Pro Bono Economics volunteers to help estimate the costs to the UK
economy of low levels of adult numeracy, and who bears these costs. This is the issue that we
examine in this paper.
There are related questions which are outside the scope of this project. In particular, we have not
looked into:
the impact of children’s or adults’ maths or numeracy classes on skills, or on outcomes such
as earnings
the costs of provision of maths or numeracy classes.
Both these questions should, of course, be weighed up by any organisation that is planning policies
relating to adult numeracy interventions to reduce the costs of low numeracy.
3 Background
3.1 Rationale
There is a wide body of research linking low levels of numeracy to poorer labour market, health and
social outcomes. Such outcomes incur costs which fall on individuals, employers, and the state.
However, there has been little attempt to quantify of these costs, although there are exceptions,
particularly KPMG (2009).
Numeracy is required for successful functioning in many aspects of modern daily life. For example,
adults need this skill when interpreting their pay slip, watching and understanding the news, paying
their bills, choosing broadband providers, or taking medicine. The ability to understand IT systems,
set targets and have financial awareness is essential for many jobs.
3.2 Definition of numeracy
National Numeracy defines numeracy in line with the OECD’s Programme for International Student
Assessment PISA definition2. PISA is an international survey of the abilities of 15 year olds conducted
among OECD countries every 3 years. Numeracy represents an individual’s capacity to identify and
understand the role that mathematics plays in the world, to make well-founded judgements, and to
use and engage with mathematics in ways that meet the needs of that individual’s life as a citizen.
It implies the essential skills needed for solving problems, processing information, making decisions
and interpreting data. Being numerate is about appreciating number relationships and interpreting
answers, and not just about doing calculations.
2 See the National Numeracy website: http://www.nationalnumeracy.org.uk/what-is-numeracy/index.html
10
Adults with lower levels of numeracy skills may develop low self-esteem, may be unable to help their
children with their homework and may not deal successfully with domestic finances.
More widely, a lack of numeracy skills has in the past been linked to lower wages, higher
unemployment, social problems, school exclusions, truancy and crime.
4 Method
4.1 Summary of our approach
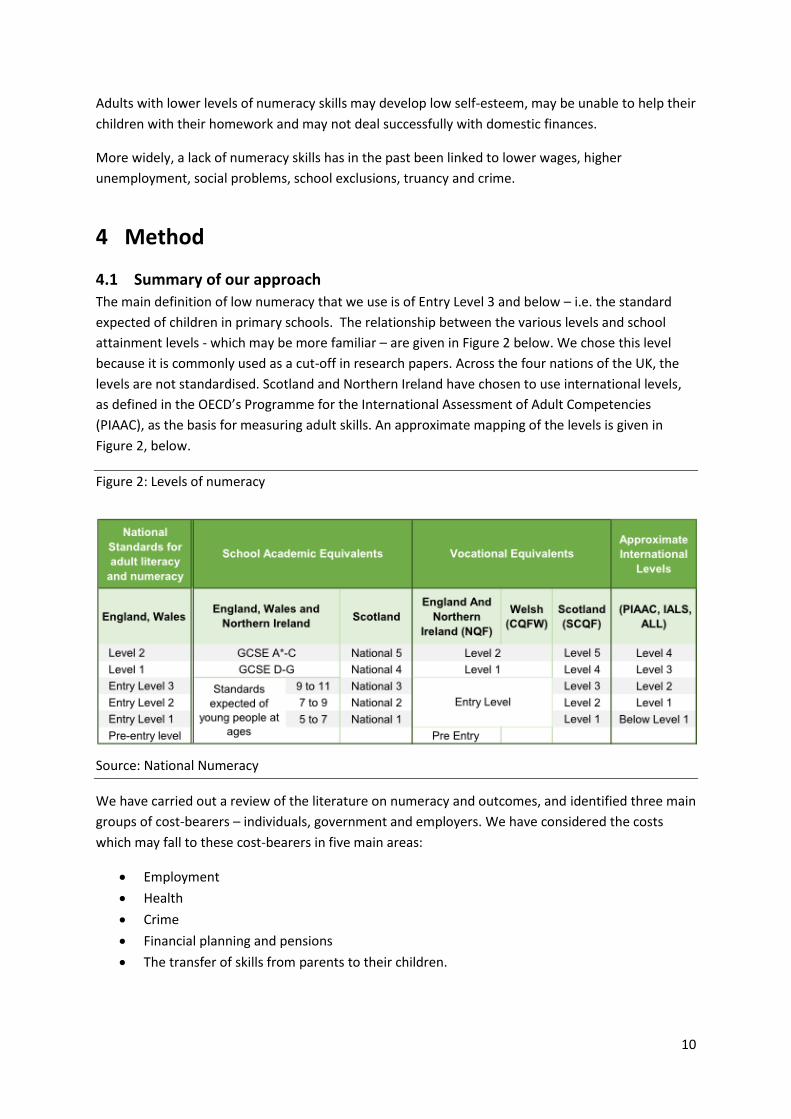
The main definition of low numeracy that we use is of Entry Level 3 and below – i.e. the standard
expected of children in primary schools. The relationship between the various levels and school
attainment levels - which may be more familiar – are given in Figure 2 below. We chose this level
because it is commonly used as a cut-off in research papers. Across the four nations of the UK, the
levels are not standardised. Scotland and Northern Ireland have chosen to use international levels,
as defined in the OECD’s Programme for the International Assessment of Adult Competencies
(PIAAC), as the basis for measuring adult skills. An approximate mapping of the levels is given in
Figure 2, below.
Figure 2: Levels of numeracy
Source: National Numeracy
We have carried out a review of the literature on numeracy and outcomes, and identified three main
groups of cost-bearers – individuals, government and employers. We have considered the costs
which may fall to these cost-bearers in five main areas:
Employment
Health
Crime
Financial planning and pensions
The transfer of skills from parents to their children.

11
For the last two outcomes listed above (financial planning and pensions, and the transfer of skills
from parents to children), we were unable to quantify costs due to a lack of reliable and relevant
information on these topics. However, for the first three, we have estimated the costs using
research findings about the relationship between outcomes and numeracy, in combination with data
on the labour market and on costs published by the Office for National Statistics and government
departments. Our calculations are, broadly speaking, based on the following inputs, following the
general method outlined in the KPMG (2009) report:
Identify the number of people affected by a problem (population numbers).
Identify the additional risk of having a particular problem, and therefore incurring a cost, for
those with low numeracy (defined as Entry Level 3 or below) compared with those with the
next level of numeracy above it (Level 1).
o We only consider this where we can – with reasonable confidence – isolate the
additional impact of low numeracy over and above potentially confounding factors
on those problems. In other words, we aim to determine from the research
literature the additional effect that low numeracy has on wages, health etc. over and
above other factors such as age, gender and social background. We have based our
findings only on research results which establish a statistically significant
relationship between low numeracy and the problem in question.
o The estimates for these risks are taken from others’ analyses of major numeracy
surveys. As with all estimates derived from surveys, there is some uncertainty
around them. We have investigated the degree of this uncertainty, by giving the
costs associated with the 95 per cent confidence interval for the estimates, where
standard errors are given, or by altering assumptions to test the sensitivity of the
results to the assumptions used. The wide margins around the central estimate that
result from these sensitivity tests demonstrate that the cost estimates are highly
dependent on the initial assumptions, demonstrating the care with which the figures
should be interpreted.
Establish unit cost information for each specific type of cost.
4.2 Analytical issues affecting what we can and cannot conclude
4.2.1 Extrapolation from microeconometric studies
We have built up our picture of costs based on results from a number of microeconometric studies.
The advantages and limitations of this approach are discussed in Cattan and Crawford (2013), who
discuss micro and macroeconomic approaches to assessing the economic benefits of education.
Advantages of using microeconometric studies include the potential to base findings on rich
datasets, and to draw on methods which exploit these datasets as fully as possible.
One of the main disadvantages is the lack of consideration of general equilibrium effects. In
other words – building up a picture from individual-level data does not take into account the
way the system might react to large-scale change. In the case of this study, we discuss the
returns to increased levels of numeracy for an individual, and scale these up to estimate
what the benefits would be if these returns were applied to everyone with numeracy at or
below Entry Level 3. However, if everyone with low numeracy really did improve their skills,
the nature of the market would have changed, and the returns might be very different from

12
those estimated by the micro-econometric studies. This means there is a need for caution
when considering the implications for policy. The real returns might be either higher or
lower.
Another disadvantage of the approach is given in Cattan and Crawford’s paper: returns to
attainment are often estimated at one particular age. Although, as Cattan and Crawford
note, this is not a problem inherent to microeconometric analysis, in fact in the case of
numeracy research the estimates are generally constructed without consideration for the
lifecycle. However, there are some exceptions such as Grinyer (2005 – who uses cross-
sectional data to look at different age groups) and Jenkins et al (2011), and we have drawn
on longitudinal analysis where it is available.
An alternative approach is to use macro studies of the impact of skills on economic growth – for
example using international variations to understand the drivers of economic growth. This was not
appropriate for our purposes, because we wanted to understand to what extent different parties
bear the costs of low numeracy.
4.2.2 Aggregation of figures across the UK
Surveys which provide data about numeracy levels and other characteristics, allowing us to make
estimates about the outcomes associated with low levels of numeracy, are often not consistent in
their coverage of the four nations of the UK, or in the definitions used. Where possible, we have
used estimates relating outcomes to numeracy from British studies, i.e. covering England, Scotland
and Wales, although in some cases we have had to use estimates from England only. We have
applied these estimates to the whole of the UK, i.e. including Northern Ireland, to reach our figure.
We believe this is a reasonable approximation because findings from the OECD’s Programme for the
International Assessment of Adult Competencies (PIAAC) are broadly similar for England and
Northern Ireland, which seems to make it reasonable to extrapolate from British to UK data. We
have extrapolated from English data to the whole of the UK only where there are no other estimates
readily available.
4.2.3 Causal evidence
We have not been able to find gold-standard evidence of the causal connections between low levels
of numeracy and the costs to individuals, employers, or the state. Instead, we use evidence of a
slightly lower standard that is available and which is suggestive of a causal link. The type of evidence
we have used comes from econometric studies using methods which take account of confounding
factors in order to isolate the additional impact numeracy on the outcomes of interest (e.g. wage
returns) as far as possible.
Making a causal connection between two variables requires very strong evidence. The gold
standard for drawing such conclusions is a randomised controlled trial, in which individuals
are randomly assigned to two groups, one of which receives a ‘treatment’, while the other
does not. This is clearly not possible for numeracy – individuals cannot be assigned poor
skills.
The next best standard of evidence is from longitudinal data which tracks skill development,
alongside other outcomes, over time. However, such data are rare, and although some panel
datasets track skills over time, there is no recent information. We do, though, draw on
studies which have used such data. Even longitudinal studies, though, measure numeracy

13
only rarely, which means some of the literature analyses the data in a way which does not
exploit the studies’ longitudinal nature.
Some statistical methods (such as propensity score matching) which can help compare like
with like even in the absence of longitudinal or experimental data, require very rich datasets.
We did not identify any relevant UK studies that used this method or similar ones. Using
such techniques ourselves was not feasible given the wide scope of this study, the tight
timescale and few resources.
Instead, the studies we use to draw conclusions mostly use regression methods. Multivariate
regressions allow us to look at the relationship between cost-incurring outcomes (such as
unemployment) and numeracy, while taking into account observed differences between
individuals (such as gender, age and social background). However, such analysis is limited by
the data available, particularly for data taken from one point in time only, because it
necessarily omits characteristics which are not captured in the dataset (such as soft skills).
Not accounting for these unobserved factors may cause us to overestimate the costs of
numeracy by an unmeasurable amount: regression coefficients may be upwardly biased.
4.2.4 Incomplete evidence base on the impacts of low numeracy
It is also possible that we have underestimated costs. There are likely to be other areas in which
costs are incurred, but which we could not find evidence for, in the literature we identified. For
example, the financial disadvantages from poorer employment (which we do cover) are likely to
create knock-on effects. Some of these knock-on effects are discussed in this paper. For example,
increased incidence of health conditions, and increased crime prevalence, among those with low
numeracy are likely to be related to income deprivation. However others, such as homelessness,
which are clearly disadvantageous to individuals and also incur costs to the state, have not been
studied extensively (although receive some mention, for example housing and homelessness in
Parsons and Bynner, 2007). We therefore have not been able to quantify their extent and include
them in our review.
4.2.5 Assumption of homogeneity of the relationship between outcomes and numeracy
Our approach is broad-brush and based on average “effects” of low numeracy. Where existing
research suggests that the relationship between low numeracy and the outcome in question differs
for different groups (for example, the relationship between earnings and low numeracy differs by
age-group) we attempt to adjust for this by carrying out separate calculations for different groups.
However, some assumption of homogeneity remains. By relying on regression methods which are
based on the means within groups, we omit the fact that there will be variation within those groups
that is not accounted for in our estimates
4.2.6 Implications
For all these reasons, our findings should be regarded as broad brush indicative estimates only. Costs
refer to the poorer outcomes associated with low numeracy: we have not established a direct causal
connection between lower numeracy and costs.

14
5 Findings
5.1 Employment
Costs in relation to employment arise from:
Lower levels of employment among the working age population as a whole. We focus on the
impact on state payment of unemployment benefits.
Lower levels of productivity among those in work, as measured by earnings. This may result
in:
o foregone wages and in-work employment benefits for individuals
o foregone profits for employers
o foregone net tax receipts for the state. We have attempted to estimate this as fully
as possible, but we have not been able to include the effect on the public purse of,
for example, in-work income-related benefits such as Working Tax Credits, but we
have not been able to quantify this from the data.
5.1.1 Previous research on the earnings premium
BIS (2012) found in the 2011 ‘Skills for Life’ survey for England that 42 per cent of respondents who
reported some weakness in basic skills believed that weaknesses in numeracy, had affected their job
opportunities (Figure 3).
Figure 3: Proportions who felt that a weakness in basic skills had impacted on their job
opportunities in 2003 and 2011 (%)
Note: Base is those who gave a negative rating of their reading, writing or numeracy skills.
Source: BIS (2012), analysis of England’s Skills for Life survey
The literature finds consistently that higher numeracy is associated with higher earnings, even when
other factors such as age and gender are considered. There are fairly consistent indications that the
premium for numeracy is between 4 and 11 per cent when background characteristics are controlled
for. For our cost figure, we have used the 9 per cent figure in Vignoles (2008), since the figure is

15
based on the British Cohort Study, covering England, Wales and Scotland; the finding lies roughly in
the middle of the estimates in the literature so appears reasonable; it uses an econometric approach
which controls for a wide range of characteristics; and it uses an appropriate levels comparison
(Entry Level skills compared to Level 1).
Vignoles et al (2008) found, using the British Cohort Study, that (controlling for
characteristics such as family background, early cognitive ability and education level) people
with Level 1 numeracy earned 9 per cent more than those with below Level 1 numeracy, and
that the difference is similar for men and for women.
Machin et al (2001) found a wage premium at age 37 of 9% for men and 4% for women, for
Level 1 numeracy over Entry level, when controlling for ability, soft skills and highest
qualification. However, these results were not statistically significant, possibly due to being
based on a small sample size. (Reported in Grinyer, 2005.)
McIntosh and Vignoles (2000) found a 9% wage premium for Level 1 numeracy, controlling
for family background and ability at age 7, or a 6% premium for Level 1 numeracy,
controlling for family background, age 7 ability, age 16 ability and education level.
All this is broadly consistent with the finding from Crawford and Cribb (2013), that a one
standard deviation increase in age 10 maths scores is associated with earning between 10.2
per cent and 10.8 per cent higher in respondents' thirties.
Interestingly, Vignoles et al (2008) find, by comparing results from surveys in 1991 and in 2004, that
the value of basic numeracy in the labour market has increased since the 1990s. Other authors (for
example OECD, 2013) have also asserted that numeracy is becoming increasingly important in the
labour market. The changing relationship between numeracy and outcomes merits further
investigation.
Our own estimates focus on the present day, and for these we need to bear in mind some of the
complicating factors highlighted by other research, discussed below.
Our analysis focuses on the wage premium for individuals achieving Level 1 numeracy, compared
with Entry Level 3 or below. However, this may be an over-simplification. Finer-grained analysis by
Grinyer (2005) found a higher premium for moving from Entry Level 2 or below to Entry Level 3,
compared with the premium for moving from Entry Level 3 to Level 1. Grinyer also examined how
the earnings premium varies for different age groups, and found that the earnings premium for Level
1 numeracy, compared with Entry Level, is zero or conceivably negative before the age of 30. The
premium then increases, before dipping down at about the age of 50.
However, more positive evidence for the existence of an earnings premium for those over 50 comes
from Jenkins et al (2011), who examined older adults (aged 50+) with jobs. Their study used
regression analysis and found that, taking into account gender, age, highest qualification and
cognitive function, pay is higher for those with higher numeracy. Although the levels used by the
English Longitudinal Survey of Ageing, which Jenkins and colleagues use for their analysis are not the
same as the main qualification framework that we use, their results do provide evidence that it is
reasonable to assume some numeracy earnings premium in later life, not just for younger people.
We have carried out sensitivity analyses to examine the effects of varying the size of the premium at
different ages, within reasonable boundaries indicated by the research.

16
5.1.2 Previous research on unemployment and the likelihood of being in work
Jenkins et al (2011) used data on work histories in the English Longitudinal Study of Ageing,
collected as part of the survey, which suggested that low numeracy is associated with
previous spells out of work, and this pattern held true for both men and women (Figures 4
and 5). This suggests that younger adults with low numeracy are more likely to have spells
out of work. However, the authors found that, after controlling for other factors such as
individuals’ backgrounds, there is no evidence that numeracy is related to likelihood of an
older adult being in work.
For younger age groups, Grinyer (2005) provides a very useful summary of research carried
out before the mid 2000s.
o Grinyer considers both the likelihood of economic activity (compared to inactivity,
defined as those neither in work nor looking for work), and the likelihood of being a
jobseeker (unemployed and looking for work) for different levels of basic skills,
holding constant background characteristics.
o He finds that higher numeracy levels – particularly the contrast between Entry Level
2 and Entry Level 3 numeracy – increase the probability of being economically
active. However, economic inactivity is also likely to relate to factors which are not
measured in the Skills for Life survey, so we would be cautious about including this
in our costs.
o More relevant for us is Grinyer’s finding that the probability of being employed,
rather than being a jobseeker, increases by 2 per cent for those with Level 1
numeracy skills compared to Entry Level 3 and below. This finding appears stronger
for men than for women, although this difference is not statistically significant –
probably due to the small sample size for jobseekers.
o This is consistent with other findings cited in Grinyer’s paper, and with the more
recent research cited above.

17
Figure 4
Source: Jenkins et al (2011)
Figure 5
Source: Jenkins et al (2011)
18
We have not, however, used this research to estimate the unemployment costs of low numeracy.
We would have had to have made considerable assumptions about the wages of people entering the
labour market, which would not have been supportable, especially given the (large) size of the
estimate.
5.1.3 Previous research on the impacts of lower skills on employers
There are a number of ways in which low levels of numeracy may cause employers to bear costs
from less productive staff. Employers may be unable to recruit the right staff, and/or existing
employees may not be able to perform their job effectively, all of which may result in lower turnover
and profits for firms.
Employers who reported in the UKCES Employers’ Skill Survey that they had vacancies that
were difficult to fill because of skill shortages (29 per cent of vacancies) were asked what
skills were lacking. 26 per cent of employers said that numeracy was a problem.
Fifteen per cent of employers said in the same survey that their staff were not fully
proficient. Of these, 23 per cent said that numeracy was the cause of the gap.
Of the 71 per cent of employers who said some of their employees would need to upskill
over the next 12 months, 13 per cent said numeracy upskilling would be needed.
(Winterbotham et al, 2014)
The CBI’s much smaller survey of employers finds considerable higher levels of
dissatisfaction among employers, although this may be due to the small sample size (of 294
employers, compared to more than 91,000 in the UKCES survey) and the self-selecting
respondents. The survey found that 51 per cent of employers are aware of weaknesses in
their employees’ numeracy skills, and 31 per cent are not satisfied with the level of
numeracy of school leavers entering the work place.
(CBI / Pearson, 2013)
5.1.4 Our estimates: earnings-related costs
Our calculations are given in our appendix, but our approach is set out in more detail below.
5.1.4.1 Impact on individuals
The biggest effect of low numeracy that we estimated is that on the earnings of individuals. We
carried out calculations separately for full and part time workers of different age groups (in 10-year
bands), to take into account the different average wage and tax levels for these sets of people. We
applied Grinyer’s (2005) findings that the earnings premium varies over the life course.
We estimated the baseline annual earnings for people with Entry Level 3 numeracy, using
findings from Vignoles et al (2008), which sets out the raw earnings premium associated
with different levels of numeracy. We applied this premium to average earnings data taken
from the Annual Survey of Households and Earnings.
We used findings, again from Vignoles et al (2008), which indicate that, taking into account
other observed characteristics including literacy, family background, early cognitive ability
and education level, people with Level 1 numeracy earn about 9 per cent more than those
with Entry Level numeracy.

19
We used data on the number of workers in these age groups, estimating the number of
Entry Level workers using the distribution in the 2011 Skills for Life survey for England.
We estimated the National Insurance contributions and Income Tax using average rates
published by HMRC – we did this separately for full and part-time workers.
To represent non-wage benefits to individuals of being in higher-paid work (e.g. greater
employer pension contributions, maternity/paternity pay, holidays etc.), we multiplied the
net-of-tax wage benefit by the ratio of non-wage labour costs to labour costs suggested for
use in option appraisals by HM Treasury’s ‘Green Book’3. Non-wage labour costs are the
employer costs associated with labour and cover such costs as employer contributions to
pension schemes, maternity pay, and other employee benefits. The non-wage cost estimate
in the Green Book will include employer National Insurance contributions, so we subtracted
an estimate for these, for this element of non-wage costs.
Net of taxes, the earnings premium is estimated at £8.8 billion.
We carried out sensitivity tests:
We used the standard errors and other information given in Vignoles et al (2008) to
calculate a 95 per cent confidence interval for the 9 per cent premium, and calculated a
range of estimates using these lower and upper bounds.
We used a range of assumptions about the impact of numeracy at different ages:
o Our most conservative assumption was that numeracy only attracts a premium in
mid-life (ages 30 to 49). This is possible, because our main estimate for the premium
comes from a cohort study of people at age 34; Grinyer (2005) also found that the
premium peaks in middle age.
o Our least conservative assumption still takes into account the finding that the
premium peaks in mid-life. We assumed that numeracy does attract a premium
between the ages of 22 and 59, but that the premium is lower (we assumed 5 per
cent for our point estimate) in the 22 to 29 and 50 to 59 age ranges, compared to
the 30 to 49 age range.
This produced a range of £2.8 billion to £14.2 billion for the net estimate, indicating the high degree
of sensitivity to varying these assumptions.
3 The Green Book is HM Treasury’s guidance to public sector bodies about policy appraisal.
https://www.gov.uk/government/uploads/system/uploads/attachment_data/file/220541/green_book_complete.pdf

20
Our estimates for the range of premia for individuals moving from Entry Level to Level 1 skills (in
2012 values), per person , are given below:
Full time employees, by age group – values in £
16-17 18-21 22-29 30-39 40-49 50-59 60+
Lower bound premium -
-
-
1,070
1,186
-
-
Point estimate premium -
-
985
2,433
2,695
1,496
-
Upper bound premium -
-
1,683
3,858
4,274
2,557
-
Part time employees, by age group – values in £
16-17 18-21 22-29 30-39 40-49 50-59 60+
Lower bound premium -
-
-
423
387
-
-
Point estimate premium -
-
394
961
881
506
-
Upper bound premium -
-
673
1,524
1,397
865
-
We have not included foregone earnings through unemployment as a cost to individuals, because
our judgement was that the assumptions needed to arrive at an estimate for this element were
unsupportably heroic.
We netted off estimate NI contributions and Income Tax plus estimated indirect taxes, as these are
counted as income to the public sector. Our methods for estimating these are explained in section
5.1.4.2 below.
We then added on to the post-tax impact on individuals’ wages the estimated value of non-wage
benefits from employment. These would include employer’s contributions to pension schemes,
maternity/paternity pay, holiday and sick leave etc. and any other employee benefits. We have used
an estimate of non-wage labour costs given in the Green Book – 27 per cent of gross wages. We
applied this to the gross earnings premium calculated in the section above. From this, we subtracted
an estimate of employers’ National Insurance contributions.
5.1.4.2 Impact on the state
We summed the estimated National Insurance contributions and Income Tax, using (for Income Tax)
average rates at different income levels published by HMRC. We applied these rates to (separately)
the different gross earnings premia for full and part-time workers of different age groups.

21
We also considered the impact on the state of lost indirect taxes, using estimators for proportions of
gross income spent on indirect taxes at different levels of income4. We applied this to our gross
earnings figures in line with the method used to calculate the indirect tax payment rate.
This yields the following figures:
Figure 6
Cost type Lower bound Point estimate Upper bound
Employer National Insurance contributions
£0.5 billion £1.7 billion £2.8 billion
Employee National Insurance contributions
£0.5 billion £1.5 billion £2.4 billion
Income Tax £0.5 billion £1.5 billion £2.4 billion
Indirect taxes £0.7 billion £2.3 billion £3.8 billion
Total £2.3 billion £7.0 billion £11.4 billion
Note: the lower bound total differs slightly from the apparent sum of the costs, due to rounding.
Source: PBE volunteer estimates
5.1.4.3 Impact on employers
Although there is some evidence from various employer surveys that lack of numeracy skills are
problematic for employers, and can therefore be assumed to limit their opportunities to expand and
make more profits at home and in international markets, the numbers from those surveys cannot be
used to estimate the scale of the foregone profits across the economy. For example, the findings do
not allow us to identify precisely how many members of staff are affected, the size of the impact on
productivity, nor what level of numeracy is causing the problem. For example, we do not know to
what degree employers are claiming insufficient numbers of maths graduates, and to what degree it
is about a shortage of people with basic arithmetic skills.
Instead, we have taken a different approach. Profits generally account for about 20% of GDP and
compensation of employees accounts for about 54%. Assuming these shares remained unchanged if
numeracy levels were to increase, we estimated the impact on employers by multiplying the net
impact on employees by the ratio of the share of profits in GDP to the share accounted for by
employees. We used 2012 values for those factor shares (19.8% and 53.9% respectively) published
by ONS5 to give a current figure.
This gives a central estimate for the value of foregone profits of about £3.2 billion.
Again, we subjected this to the sensitivity tests applied to the base earnings calculations. Our range
for the total value of profits lost to employers is £1.0 billion to £5.2 billion.
4 ONS (2013), The Effects of Taxes and Benefits on Household Income, 2011/12.
5 ONS July 2013: National Accounts at a Glance, Figure 1.5:
http://www.ons.gov.uk/ons/dcp171776_318931.pdf

22
5.1.5 Our estimates: unemployment-related costs
We should be particularly conscious of the strong assumptions about what would happen to
unemployment if there were a big increase in numeracy levels. It is very difficult to estimate what
impact on the numeracy premium and on unemployment a big increase in numeracy levels would
have. We have made the simplifying assumption that an increase in numeracy would not reduce the
numeracy premium and lead to further increases in employment due to employers using more
labour-intensive methods of production. In economics terms this is therefore a partial equilibrium
analysis made in the absence of sufficient evidence about the elasticity of employers’ demand for
numeracy skills.
Unemployment-related costs include:
lost income for individuals (net of unemployment benefits);
foregone profits for employers from the additional output and sales they could make from
the extra workers they could employ if they had the right numeracy skills;
the higher total unemployment benefits and foregone tax revenues the state is paying
because of the numeracy-related unemployment,
We have not attempted to quantify the loss of individual earnings or employers’ profits due to the
strong and extensive assumptions required. Instead, we focus on the impact on Jobseeker’s
Allowance claimants. This does, though, mean that we are likely to have underestimated the costs
associated with unemployment.
Although, as described in section 5.1.2, Grinyer (2005) found a significant relationship between
numeracy and the likelihood of being employed (rather than a jobseeker) for both men and women,
we follow the example of KPMG (2009) in taking the conservative assumption that women may not
take up Jobseeker’s Allowance. This assumption also fits with Grinyer’s separate analysis, reported in
the same paper, of male and female employment rates. For that (presumably due to the small
sample sizes, and unlike the analysis considering men and women taken together) the coefficient
reflecting the relationship between numeracy and employment was statistically significant for
neither men nor women. However, the analysis indicated that the coefficient for women was
approximately zero, while the coefficient for men suggested that those with Level 1 numeracy skills
were about 2 per cent more likely to be employed than those with Entry Level skills. Grinyer’s results
are shown in Figure 7.

23
Figure 7
Source: Grinyer (2005), page 55
We have estimated the existing number of male Jobseekers Allowance claimants with Entry Level
numeracy skills, using the rate found in the 2011 Skills for Life survey for England, and applying it to
the claimant count in the UK as a whole.
We have then used the ‘Skills for Life’ 2011 survey to look at what effect a 2 percentage point
increase in employment would have on the proportion of people with Entry Level numeracy skills
who are unemployed. We find that a 2 per cent increase in employment would lead to a 17 per cent
reduction in unemployed job seekers. We apply this reduction to our estimate for the number of
claimants with Entry Level numeracy skills.
For our costs, we used the Department for Work and Pensions’ estimate that the net fiscal benefit
for someone moving from Jobseeker’s Allowance into employment is £9,800 per year. This figure
includes benefit savings, increases in tax revenues and National Health Service cost savings
estimates, taken from DWP’s Policy Simulation Model and other DWP analysis6.
We carried out sensitivity tests to examine how varying the 2 percentage point increase affects the
results. We used a lower bound of 1 per cent and an upper bound of 3 per cent.
This method gives us a potential cost to the state of £1.2 billion per year for the unemployment
costs of low numeracy, with a lower bound of £0.6 billion and an upper bound of £1.8 billion.
5.2 Health
Low levels of numeracy are associated with poorer health. Evidence of this can be seen in the 2011
‘Skills for Life’ Survey which shows that the proportion of respondents who say they are in “good” or
“very good” health declines with numeracy level, as shown in Figure 8 below.
6
http://www.publications.parliament.uk/pa/cm201213/cmhansrd/cm130206/text/130206w0006.htm#column_352W

24
This is supported by findings in the more recent Programme for the International Assessment of
Adult Competencies (PIAAC) survey, which showed that those who had a health problem or disability
that limited them “a lot” had lower scores in numeracy compared to those reporting milder or no
health problems or disability (BIS, 2013). Moreover, the lower the level of numeracy, the more likely
an individual is to report poor health.
Figure 8: Self-reported health by numeracy level
Source: England’s 2011 Skills for Life survey, weighted (unweighted N = 5,817)
However, these results are raw correlations and do not take into account other background factors.
It may be that people who have poorer health have low engagement with education, or that older
people (who have poorer health) are also more likely to have low numeracy, rather than that low
numeracy is in itself directly linked to poor health.
If low numeracy does reduce people’s health and well-being, this is a wider impact of low numeracy
that carries costs for individuals in the form of foregone enjoyment of life, but also in terms of the
costs to them of pharmacy medicines, time (perhaps off work) to visit doctors etc. Poorer health will
also show up in reduced labour market earnings, which are already accounted for in the
employment section above.
In addition to the costs to individuals, there will also be taxation-funded costs to the public purse
from higher NHS treatment and care costs.
The evidence base in this area is much weaker than that for the labour market. The review by
Vorhaus et al (2011), about adult literacy and numeracy, states that there simply is not enough
evidence about literacy and numeracy to draw conclusions.
However, we have identified some relevant studies, including one published since the Vorhaus et al
review.
Sabates and Parsons (2012) used the British Cohort Study to examine how adult basic skills can
contribute to better health in adulthood. They used findings on basic skills from the 2004 wave of

25
the survey, and findings on health from the 2004 and 2008 waves. The authors found that low adult
numeracy skills were associated with deteriorating self-reported health, and with worsening health-
limiting conditions. The findings stand even after controlling for a range of other characteristics,
including childhood factors such as socio-economic background, health in childhood, and reading
and maths ability in childhood. However, after controlling for these factors the authors found no
association between adult numeracy and depression or smoking.
The authors found that, after controlling for highest educational qualification, childhood
circumstances and other socio-economic factors, people with numeracy at Entry Level 2 and
Entry Level 3 were 0.04 percentage points more likely to have deteriorating health status
between ages 34 and 38, compared with cohort members with Level 2 numeracy skills.
After controlling for similar factors, cohort members with Entry Level 2 numeracy were 2.14
times more likely than those with Level 2 numeracy to have health-limiting conditions.
Those with Entry Level 3 numeracy were 1.49 times more likely than those with Level 2
numeracy to have health-limiting conditions.
Although models with fewer controls indicate a relationship between low numeracy and
likelihood of smoking and depression, including controls such as whether the respondent
had had a health condition in childhood results in the relationship being no longer
statistically significant.
Sabates and Parsons’ analysis is limited by the nature of the British Cohort Study. The BCS cohort
that the authors use is made of people born in 1970. So, any analysis can only be of people in their
thirties at the time that the data was collected. Especially given the authors’ finding on the
deterioration of health, we might expect the relationship between health outcomes and numeracy
to become stronger over the life course.
This finding is reinforced by Jenkins et al (2011), who have analysed the English Longitudinal Survey
of Ageing, on adults aged 50 and over. They found that, controlling for very basic characteristics
(age, gender and highest qualification) older adults with low numeracy are more likely to smoke, and
less likely to report good, very good, or excellent health, compared to those with high numeracy.
Jenkins and colleagues also found that, “relative to those with high levels of numeracy, those in the
low numeracy groups also tended to be more likely – the odds were approximately two-thirds higher
– to report depressive symptoms even after allowing for a range of other influences on the
likelihood of being depressed”.
We have therefore turned to other research to provide further context, even though Sabates and
Parsons (2011) and Jenkins et al (2011) are the only papers we have identified which directly
examine the relationship between numeracy and health, while controlling for other factors.
Feinstein (2002) suggests that there is a strong link between overall educational qualifications
achieved and physical and mental health in old age that remains after confounding factors such as
age, family background and occupation are taken into account. Feinstein also finds a link between
education and health-related behaviours, such as smoking, drinking and obesity, and between
education and depression. However, the paper does not distinguish the separate effects of low
mathematical qualifications, and certainly not of numeracy in adulthood. This is important for us,
given that numeracy in adulthood is a skill rather than a qualification.

26
Given the paucity of suitable evidence, we have not been able to provide a robust quantification of
costs, and particularly would not be able to produce an estimate comparable with our employment
costs, which focus on the transition from Entry Level to Level 1 skills.
Poorer health outcomes such as these would result in costs to:
individuals, in the form of reduced quality of life and (for working age people) poorer
employment-related outcomes
the NHS and other care providers, in the form of liability for errors and burden on the
system.
5.3 Crime
As quoted on the National Numeracy website: a quarter of young people in custody have a
numeracy level below that expected of a seven-year-old, and 65% of adult prisoners have numeracy
skills at or below the level expected of an 11-year-old.
KPMG (2009) drew on previous research by Parsons and Bynner (2006) to estimate a cost of crime,
based on the fact that men who left school at 16 with competent literacy but low numeracy (thus
controlling for the effects of literacy) were more likely to have been arrested by the police,
compared to those with competent literacy and numeracy. The authors estimated that the costs of
involvement with the criminal justice system over the course of a lifetime, for the cohort of 36,000
primary-age pupils that they considered, would be around £165 million per year. However, we have
not been able to identify studies which look at the relationship between numeracy and crime, while
controlling for other background factors. We have therefore not included costs in this report.
The recent study The Crime-reducing effect of Education (Machin et al, 2011) seeks to isolate the
causal empirical connection between crime and education. The study approaches this by analysing
the variations in education induced by changes in compulsory school leaving age laws over time, and
using this to verify impacts upon crime trends.
Their analysis provided strong evidence of a causal impact of education upon property crime;
however results were more volatile with regards to violent crime. The paper goes on to calculate the
net social benefit of increasing education, from decreasing the population with no educational
qualification (moving to their definition of ‘low qualifications’ – the UK census definition of 1-4
GCSEs) by 1%. The estimate of social savings calculated in the study takes into account costs in
anticipation of crime, costs as consequence of crime, and cost to the criminal justice system. This
was netted against the cost of education. The estimated social savings from crime reduction
concluded in their study are in the order of £54 to £109 million, in 2010 prices (a mid point of £81.5
million). However, this method is not comparable to ours, as it looks at a 1 per cent reduction in
those with no educational qualifications, and because this study does not specifically relate to
numeracy. It simply gives us an impression of the relationship between crime and education.
Thus, we have not been able to include any quantification of the costs of crime.

27
5.4 Financial planning and pensions
As a result of our findings on employment and wages, we would expect that people with low levels
of numeracy would make lower pension contributions over their working lives and therefore are
more likely to require means-tested support from the state in old age.
There is also a risk that low levels of numeracy lead to poor financial planning in other areas. The
Money Advice Service MAS (2013) points out that an individual’s financial capability depends on
their skills, knowledge, attitudes, motivation and the opportunities available to them. Skills relating
to numeracy may include financial planning and problem solving.
Sixty-three per cent of MAS’ survey respondents, intended to be representative of the UK
population, had some form of loan or credit (including mortgages), and 21 per cent had experienced
a large unexpected drop in income. So, many people use complex financial products or find
themselves in situations where they need to manage a change in circumstance.
MAS’ survey found that 21 per cent of people lack confidence in managing their money. Sixteen per
cent (and a quarter of those aged over 55) could not correctly identify the available balance on a
sample bank statement. Ten per cent (and one in five of those aged over 55) were unable to identify
the better deal from two financial options. Thirty-five per cent of people (and 43 per cent of those
aged under 35) did not understand that inflation at 5 per cent would erode the purchasing power of
money in an account paying 3 per cent interest. These are indicators of poor numeracy levels.
Using segmentation techniques to analyse their survey, and extrapolating findings to the population,
MAS found that “nine million people need urgent help with managing their money”. As outlined
above, numeracy is just one possible cause, among others, of a lack of financial capability. Because
of this mix of factors, and because of a lack of other data, we cannot reliably estimate the cost of
poor numeracy in terms of reduced financial planning ability, based on these findings. However, we
expect that such difficulties will incur costs for:
individuals, through lost opportunities to optimise their finances, and through increased risk
of costly debt and crisis;
the state and voluntary sector organisations which provide financial support for individuals
who suffer financial crises.
5.5 Inter-generational transfer In this section we consider the effect that parents’ skills have on their children’s numeracy. Again,
this area is hard to quantify and evaluate in monetary terms. Drawing together existing literature,
we have considered the effects on children’s numeracy if their parents have low numeracy, and the
effect on children’s wider skills if parents have low numeracy and/or literacy.
5.5.1 Effect on children’s numeracy if parents have low numeracy
The study ‘New Light on Literacy and Numeracy’ (Parsons and Bynner, 2006) found that parents’
performance in literacy and numeracy assessments correlated with their children’s performance in
cognitive assessments. Analysis of the results of the experiment showed a statistically significant
relationship between poor basic skills performance by parents and poor test performance by their
children. The paper showed that young children aged under 6 years old, with parents at Entry Level 2
for numeracy, were twice as likely to perform poorly in numeracy assessments, compared to

28
children of parents with Level 2 numeracy. The study also found that the relationship was most
apparent at the lowest parental literacy and numeracy levels.
A more recent study has also found strong evidence for an intergenerational numeracy effect. The
study controlled for parental income, occupational status, and qualifications. It found that “if one
parent has a higher numeracy level, his or her child is likely to have a higher numeracy score”. The
main cut-off used was again Entry Level 2 and below compared with Entry Level 3 and above, and
children of parents with the better numeracy skills were found to have better number skills. Children
of parents with the poorest numeracy levels, below Entry Level 2, were found to have “markedly
poorer” numeracy scores than children of parents at Entry Level 2 and above. The study found that
the relationship between parent and child numeracy differed depending on the age group of the
child. It doesn’t however offer a conclusion as to why this relationship differs between age groups.
(Mallows, 2013).
Cohort studies have shown that children’s numeracy at age 10 has an impact on their later earnings:
Crawford and Cribb, 2013, found that a one standard deviation increase in age 10 maths scores is
associated with earning between 10.2 per cent and 10.8 per cent higher in respondents' thirties. This
demonstrates that a poorer start is likely to incur later costs for individuals and for the state.
5.5.2 Effect on children’s wider skills if parents have low numeracy
Low parental numeracy is associated not only with lower numeracy in their children, but also in
lower wider skills of their children.
Studies by de Coulon et al (2011) and de Coulon et al (2008) found that parents with better
numeracy and literacy have children who perform better in early cognitive and non-cognitive tests,
even when controlling for demographic characteristics (for example age, gender) and family
structure (for example number of siblings, lone parenthood). The authors found this for:
cognitive outcomes.
o The impact of parents’ basic skills on children’s outcomes is positive and significant,
even when other factors are controlled for (de Coulon et al 2011 and de Coulon et al
2008).
“a standard deviation increase in parental adult skill is associated with an
intergenerational gain in the child’s cognitive skill of 0.14 of a standard
deviation” (de Coulon et al, 2011)
non-cognitive outcomes – here, a measure of emotional and behavioural difficulties.
o “Adult literacy and numeracy scores are even more highly correlated with children’s
behaviour outcomes than early parental non-cognitive skills. A standard deviation
higher adult literacy/numeracy score is associated with a 0.1 standard deviation
lower (better) SDQ score for the child. This holds when we control for exogenous
child characteristics and when we consider literacy and numeracy separately.” (de
Coulon et al, 2011).
In conclusion, the evidence strongly suggests that a parent’s basic skills and education level both
have a direct impact on the cognitive and non-cognitive skills of their children. This is likely to affect
children’s later labour market, and other, outcomes. Despite this evidence of a link, we have not

29
identified a way to estimate the costs. Future studies might consider whether further work would
make this possible.
6 Concluding section: comparison with previous findings,
and suggestions for further research
We have identified a number of costs to the UK economy from low levels of numeracy. Some we
have been able to estimate by making assumptions about how those costs would apply at the scale
of the whole economy; others we have only been able to list. For those costs to individuals,
employers and the state that we have been able to estimate, we think – as a central estimate –
these amount to about £20.2 billion in one year across the working age population of the UK. By
varying some of the key assumptions within plausible ranges, we think this figure could be as low as
£6.7 billion or as high as £32.6 billion. These estimates do not include the wider non-employment-
related costs to individuals, firms and the public purse.
Previous research (KPMG, 2009) has found that the long-term employment-related costs to the state
are around £1.9 billion. However, this figure is difficult to compare to our figure on the costs to the
state, because it has been calculated with reference to the estimated life-time costs relating to one
particular cohort of 36,000 primary-age children. Our figure for the estimated costs to the state, by
contrast, refers to one-year costs to the entire working age population.
There are many potentially fruitful avenues for further research. For example, future analysis might
usefully exploit individual-level data to come to more granular conclusions about costs. In particular,
findings that the returns to numeracy have increased over time merit further attention. It would also
be worth carrying out a detailed feasibility study to establish whether or not the available data
would support estimating the life-time costs of low numeracy to individuals using pseudo-cohort
analysis. A metric like that would have greater salience to individuals who could compare it with the
costs of other major investments in their lives, such as the cost of a house.
The next step after identifying the impact of a problem is to work out what the best things to do
about it are. Hence it would be useful to synthesise and extend the evidence on ‘what works’ to
improve adult numeracy; and to investigate the relative cost-effectiveness of a range of policies,
programmes and interventions to improve adult numeracy to see where best value for money in
reducing adult numeracy and its associated costs could be achieved.
30
7 Bibliography
Bynner J., Reder S., Parsons S. and Strawn C. (2010), The three divides: The digital divide and its
relationship to basic skills and employment in Portland, USA and London, England, National Research
and Development Centre for Adult Literacy and Numeracy
Cattan S. and Crawford C. (2013), Assessing the economic benefits of education: reconciling
microeconomic and macroeconomic approaches, Centre for Analysis of Youth Transitions
Crawford C. and Cribb J. (2013), Reading and maths skills at age 10 and earnings in later life: a brief
analysis using the British Cohort Study, Centre for Analysis of Youth Transitions
de Coulon A., Meschi E., Vignoles A. (2008), Parents' basic skills and their children's test scores,
National Research and Development Centre for Adult Literacy and Numeracy
de Coulon A., Meschi E., Vignoles A. (2011), Parents' skills and children's cognitive and non-cognitive
outcomes, Education Economics
Desforges C. and Abouchaar A. (2003), The impact of parental involvement, parental support and
family education on pupil achievements and adjustment: a literature review, National Research and
Development Centre for Adult Literacy and Numeracy
Grinyer J. (2005), Literacy, Numeracy and the labour market: Further analysis of the Skills for Life
survey, Department for Education and Skills
Hanushek E.A., Schwerdt G., Wiederhold S., Woessmann L. (2013), Returns to skills around the world:
evidence from PIAAC, Organisation for Economic Co-operation and Development
Jenkins A., Ackerman R., Frumkin L., Salter E. and Vorhaus J. (2011), Literacy, Numeracy and
Disadvantage Among Older Adults in England, National Research and Development Centre for Adult
Literacy and Numeracy
KPMG (2009), The long term costs of numeracy difficulties, for the Every Child a Chance Trust
Mallows D. (2013), The intergenerational transfer of numeracy skills, National Research and
Development Centre for Adult Literacy and Numeracy
Money Advice Service (2013), The Financial Capability of the UK
Parsons S. and Bynner J. (2006), New Light on Literacy and Numeracy, National Research and
Development Centre for Adult Literacy and Numeracy
Parsons S. and Bynner J. (2007), Illuminating disadvantage: Profiling the experiences of adults with
Entry level literacy or numeracy over the lifecourse, National Research and Development Centre for
Adult Literacy and Numeracy
Sabates R. and Parsons S. (2012), The Contribution of Basic Skills to Health Related Outcomes During
Adulthood: Evidence from the BCS70, Department for Business, Innovation and Skills

31
Vignoles A., de Coulon A. and Marcenaro-Gutierrez O. (2008), The value of basic skills in the British
labour market, National Research and Development Centre for Adult Literacy and Numeracy
Winterbotham M., Vivian D., Shury J. and Davies B. (2014), UK Commission’s Employer Skills Survey
2013: UK Results, UK Commission for Employment and Skills