
PRM - Thailivestreamsetlive.thailivestream.com/.../events/pdf/041217074548-Oppday-PRM.pdf ·...
25
PRM 3Q2017 Financial Performance Opportunity Day 4 December 2017
Transcript of PRM - Thailivestreamsetlive.thailivestream.com/.../events/pdf/041217074548-Oppday-PRM.pdf ·...

PRM 3Q2017 Financial Performance
Opportunity Day
4 December 2017
1
The information contained in this presentation is strictly confidential and is provided by Prima Marine Public Company Limited (the "Company") to you
solely for your information. Neither this presentation nor any part hereof may be (i) used or relied upon by any other party or for any other purpose; (ii)
copied, photocopied, duplicated or otherwise reproduced in any form or by any means; or (iii) redistributed, passed on or otherwise disseminated, to
any other person either in your organization or elsewhere, without the prior written consent of the Company and its respective affiliates or advisors.
By attending this presentation, participants agree not to remove this document, or any materials provided in connection herewith, from the
conference room where such documents are provided without express consent from the Company and its respective affiliates or advisors.
Although care has been taken to ensure that the information in this presentation is accurate, and that the opinions expressed are fair and reasonable,
no representations or warranties, express or implied, are made as to, and no reliance should be placed on, the accuracy, fairness or completeness of
the information presented or contained in this presentation. The information is subject to change without notice, its accuracy is not guaranteed, has
not been independently verified and it may not contain all material information concerning the Company and its subsidiaries. None of the Company nor
any of its respective affiliates or advisors nor any of its or their respective members, directors, officers, employees or affiliates assumes any
responsibility or liability for, the accuracy or completeness of, or any errors or omissions in, any information contained herein. Accordingly, none of
the above nor any other person accepts any liability (in negligence, or otherwise) for any loss arising from or in connection with any use of this
presentation or its contents.
This presentation is for information purposes only and does not constitute or form part of any offer or invitation by or on behalf of the Company for
sale or subscription of or solicitation or invitation of any offer to or recommendation to buy or subscribe for any securities of the Company, nor shall it
or any part of it form the basis of or be relied on in connection with any contract, commitment or investment decision in relation thereto (“Securities”)
in Thailand or any other jurisdiction. Any recipient considering a purchase of Securities is hereby reminded that any such purchase should be made
solely on the basis of the information contained in a final offering document (which may be different from the information contained in this
presentation ) and subject to the selling restrictions set out therein. No public offering of the Securities will be made in any other jurisdiction outside
of Thailand where such an offering is restricted or prohibited. This presentation should not be construed as legal, tax, investment or other advice. The
information contained herein does not take into consideration the investment objectives, financial situation or particular needs of any particular
investor, and should not be treated as giving investment advice.
In addition, this presentation contains certain financial information and results of operation, and may also contain certain projections, plans,
strategies, and objectives of the Company, that are not statements of historical fact which would be treated as forward looking statements that reflect
the Company's current views with respect to future events and financial performance. These views are based on a number of estimates and current
assumptions which are subject to business, economic and competitive uncertainties and contingencies as well as various risks which are in many cases
beyond the control of the Company, and which may change over time and may cause actual events and the Company's future results to be materially
different than expected or indicated by such statements. No assurance can be given that future events will occur, that projections will be achieved, or
that the Company's assumptions are correct. Such forward‐looking statements are not guarantees of future performance and accordingly, the actual
results, financial condition, performance or achievements of the Company may differ materially from those anticipated by the Company in the forward
looking statements. The recipient is cautioned not to place undue reliance on these forward looking statements.
In providing this presentation, the Company does not undertake to provide any recipient with access to any additional information or to update the
information contained in this presentation or to correct any inaccuracies herein which may become apparent.
Disclaimer
I. Business Overview
2
I.
II.
IV. Business Outlook & Investment Plan
III. Consolidated Financial Performance
Contents
▪ Trading Business
▪ FSU
▪ Offshore Business
▪ Ship Management
Performance by Business Segment

I. Business Overview
3
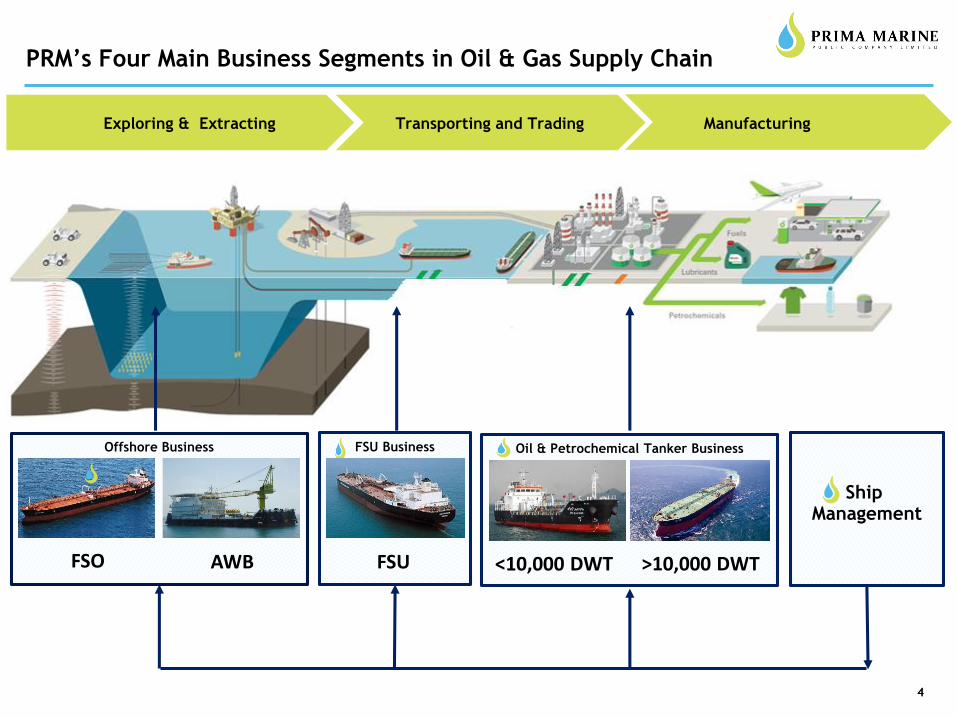
Exploring & Extracting Transporting and Trading Manufacturing
44
PRM’s Four Main Business Segments in Oil & Gas Supply Chain
Ship Management
Offshore Business
FSO AWB
FSU Business
FSU
Oil & Petrochemical Tanker Business
<10,000 DWT >10,000 DWT
5
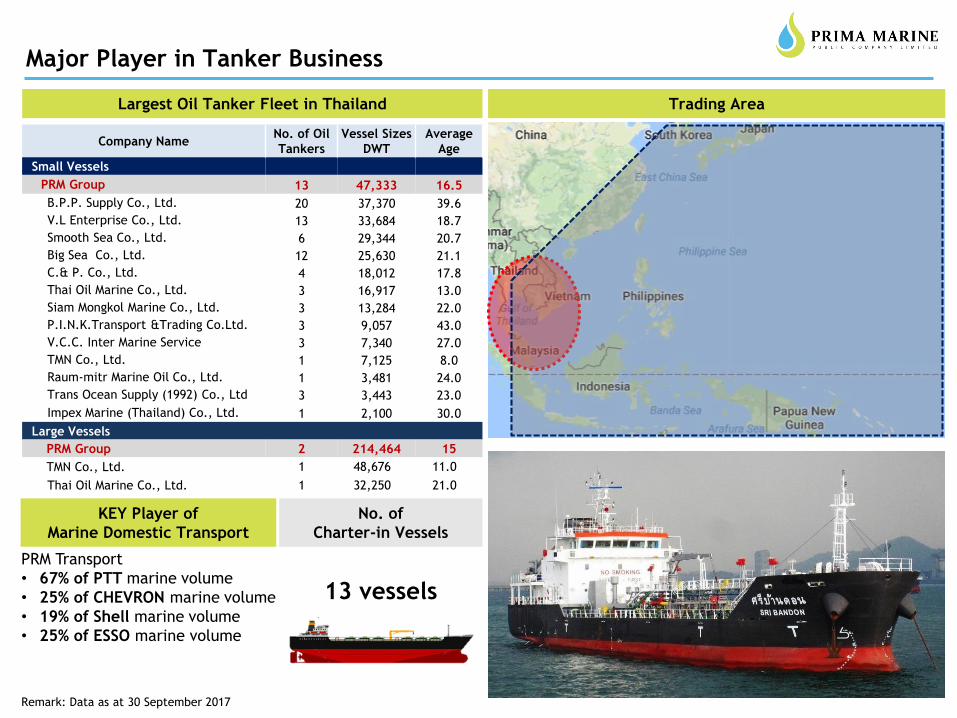
Major Player in Tanker Business
Trading Area
Company NameNo. of Oil
Tankers
Vessel Sizes
DWT
Average
Age
Small Vessels
PRM Group 13 47,333 16.5
B.P.P. Supply Co., Ltd. 20 37,370 39.6
V.L Enterprise Co., Ltd. 13 33,684 18.7
Smooth Sea Co., Ltd. 6 29,344 20.7
Big Sea Co., Ltd. 12 25,630 21.1
C.& P. Co., Ltd. 4 18,012 17.8
Thai Oil Marine Co., Ltd. 3 16,917 13.0
Siam Mongkol Marine Co., Ltd. 3 13,284 22.0
P.I.N.K.Transport &Trading Co.Ltd. 3 9,057 43.0
V.C.C. Inter Marine Service 3 7,340 27.0
TMN Co., Ltd. 1 7,125 8.0
Raum-mitr Marine Oil Co., Ltd. 1 3,481 24.0
Trans Ocean Supply (1992) Co., Ltd 3 3,443 23.0
Impex Marine (Thailand) Co., Ltd. 1 2,100 30.0
Large Vessels
PRM Group 2 214,464 15
TMN Co., Ltd. 1 48,676 11.0
Thai Oil Marine Co., Ltd. 1 32,250 21.0
KEY Player of
Marine Domestic Transport
PRM Transport
• 67% of PTT marine volume
• 25% of CHEVRON marine volume
• 19% of Shell marine volume
• 25% of ESSO marine volume
Largest Oil Tanker Fleet in Thailand
Remark: Data as at 30 September 2017
No. of
Charter-in Vessels
13 vessels

Major Player in FSU Business
6
• International oil trading companies found FSU to be complementary
to its onshore storage and optimize the logistic costs
Lower Investment
Shorter time to launch
Additional location equals better optimization
Profit enhancement through blending and heating services
✓
✓
✓
✓
Complementary
• FSU is a vessel acted as the storage unit in ocean, which has
become an emerging trend as the oil storage solution
FSU
Complementary Oil
and Gas Storage
Existing Onshore Oil
and Gas Storage
Malaysia
Transportation
route to other
ports
FSU – Emerging Trend
Collaborating with oil major players
in expanding FSU business in Thailand
• Bongkot Star (BKS) is the 1st
VLCC to introduce FSU in
Thailand
• BCP JV with PRM to use BKS
as oil storage next to Sri
Chang Island
(Unit : Vessels)
No.1 & Only One FSU
Operator in Thailand
No. 1 in storage capacity of FSUs in key port of Malaysia
(Port of Tanjung Pelepas)1 1
Market Share in Key Port of Malaysia (Tanjung Pelepas)
FSU positions next to Singapore, hub of oil trading in Asia
Sole Player of FSU Business in Thailand
6

Myanmar
Thailand
Laos
Vietnam
Gulf of
Thailand
Malaysia
Offloading
Accommodation
• FSO vessels anchor near the rigs to support oil
and gas exploration as offshore oil offloading unit
• Provide accommodation, foods and drinks, basic
medical treatment, as well as recreation activities
for engineers and staffs working on oil rig
No. of vessels
Ow
n F
leet
Total 2 192,923 DWT
1 96,168 DWT
JV
Fle
et
196,755 DWT
Total DWT
FSO
Offshore Fleet Composition
Aframax
Aframax
No. of vessels Total capacity
Accommodation Work Barge (AWB)
Ow
n F
leet
1300 Passengers
PRM’s FSO fleet offers essential supporting services to oil exploration and
production including:
(As of 30 June 2017)
Sriracha Eagle
Southern Pearl
Navathanee
Offshore Business Fleet Location Essential services for oil exploration and production activities
No. 1 in number of FSO among Thai service provider in Gulf of Thailand1
Major Player in Offshore Business
7
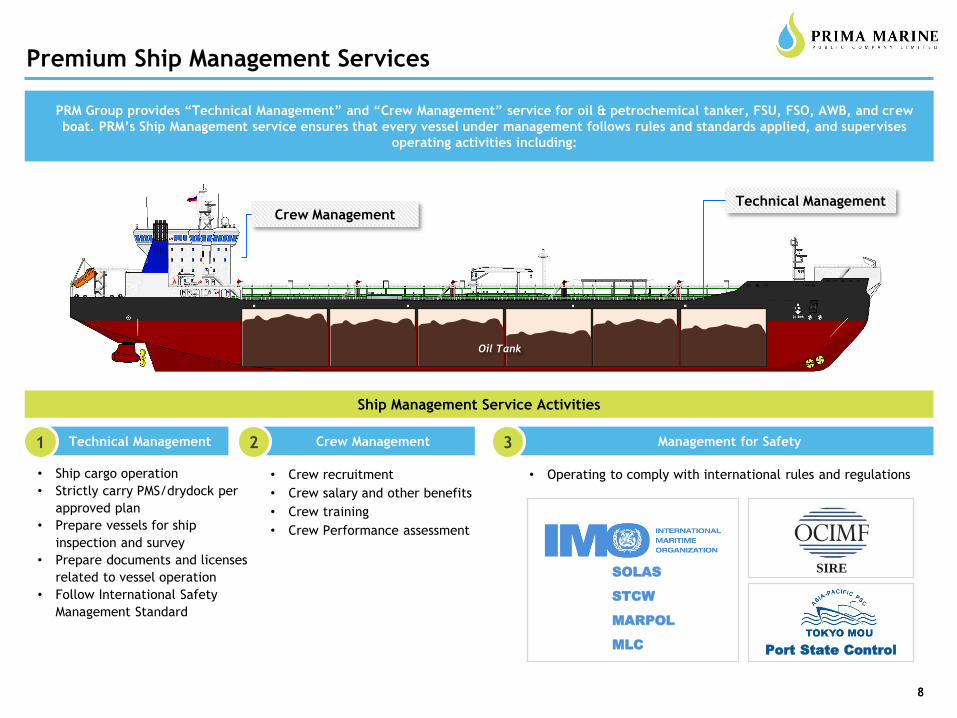
Crew ManagementTechnical Management
PRM Group provides “Technical Management” and “Crew Management” service for oil & petrochemical tanker, FSU, FSO, AWB, and crew
boat. PRM’s Ship Management service ensures that every vessel under management follows rules and standards applied, and supervises
operating activities including:
• Crew recruitment
• Crew salary and other benefits
• Crew training
• Crew Performance assessment
Oil Tank
• Ship cargo operation
• Strictly carry PMS/drydock per
approved plan
• Prepare vessels for ship
inspection and survey
• Prepare documents and licenses
related to vessel operation
• Follow International Safety
Management Standard
Ship Management Service Activities
MARPOL
MLC
STCW
SOLASSIRE
Port State Control
Technical Management1 Crew Management2
Premium Ship Management Services
88
Management for Safety3
• Operating to comply with international rules and regulations
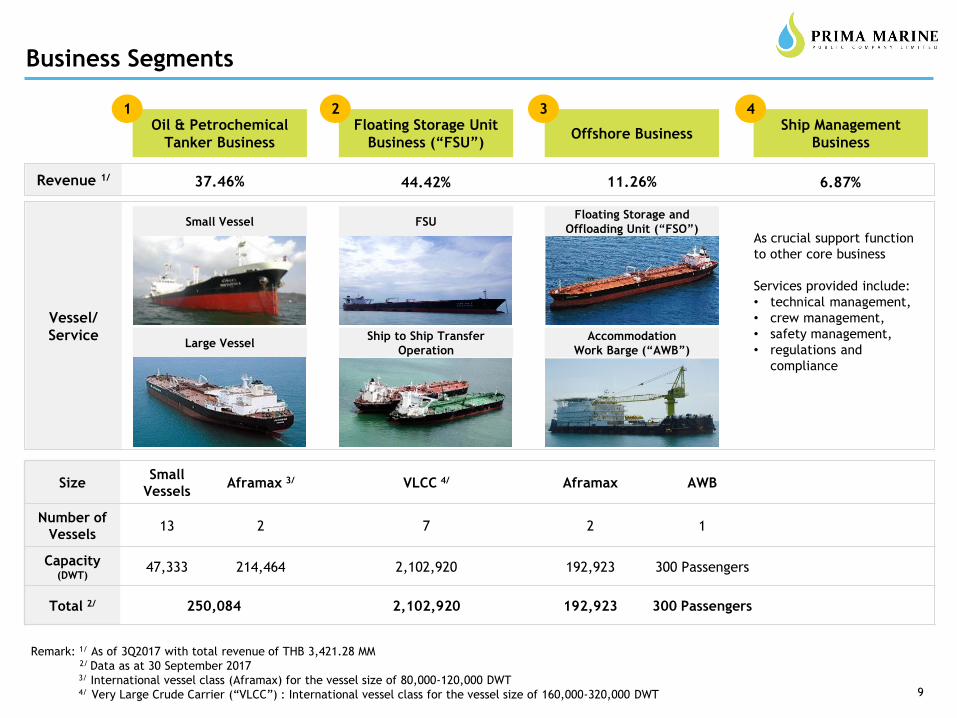
Revenue 1/
Vessel/
Service
As crucial support function
to other core business
Services provided include:
• technical management,
• crew management,
• safety management,
• regulations and
compliance
Small Vessel
Large Vessel
FSUFloating Storage and
Offloading Unit (“FSO”)
Accommodation
Work Barge (“AWB”)
Oil & Petrochemical
Tanker BusinessOffshore Business
Floating Storage Unit
Business (“FSU”)
Ship Management
Business
Remark: 1/ As of 3Q2017 with total revenue of THB 3,421.28 MM2/ Data as at 30 September 20173/ International vessel class (Aframax) for the vessel size of 80,000-120,000 DWT4/ Very Large Crude Carrier (“VLCC”) : International vessel class for the vessel size of 160,000-320,000 DWT
37.46% 44.42% 11.26% 6.87%
1 2 3 4
9
SizeSmall
VesselsAframax 3/ VLCC 4/ Aframax AWB
Number of
Vessels13 2 7 2 1
Capacity (DWT)
47,333 214,464 2,102,920 192,923 300 Passengers
Total 2/ 250,084 2,102,920 192,923 300 Passengers
Business Segments
Ship to Ship Transfer
Operation

II. Performance by Business Segment
1010

11
Performance : Trading Business
PRM Trading Trading Performance
13,500
15,500
27,750
3,039 -
10,000
20,000
30,000
40,000
50,000
2015 2016 Q1 '17 Q2 '17 Jul '17 Aug '17 Sep '17 Oct '17
USD
/Day
Time Charter Market
MR Aframax VLCC AHTS
Q2/17 Q3/17 Q3/16 YTD17 YTD16
<20,000 DWTNo of vessels 12 13 11 13 11
Capacity (DWT) 44,333 47,333 32,334 47,333 32,334
Utilization (%) 86% 85% 85% 88% 89%
>20,000 DWT No of Vessels 2 2 2 2 1
Capacity (DWT) 214,464 214,464 214,464 214,464 214,464
Utilization (%) 75% 72% 87% 79% 93%
Trading Business:
• A new small vessel (3,000 DWT) was added in Q3/2017 for hired by PTT
• All small vessels services were based on term contracts with a minimum volume of 80% of capacity commitment.
• Current PRM’s market share of each customer (<20,000 DWT):
• 67% of PTT marine vol.• 25% of Chevron marine vol.• 19% of Shell marine vol.• 25% of Esso marine vol.

12
Performance : Trading Business
Revenue
Gross Profit
Unit: Million Baht
Unit: Million Baht
Trading Performance
Trading Business:
• The new vessel added in Q3 was attributable to the higher revenue for this group
• GP of two large vessels (100,000 DWT each) was suffered from very low spot rate in Q3/2017
• Financial performance of the two vessels is expected to improve significantly as they were time chartered to BCP 6 months and UNIPEC (from China) 1 year in November 2017
596.7574.3
535.3
2Q2017 3Q2017 3Q2016
34.5
7.4
71.3
2Q2017 3Q2017 3Q2016
1,724.41,381.2
YTD2017 YTD2016
88.1
228.1
YTD2017 YTD2016
13
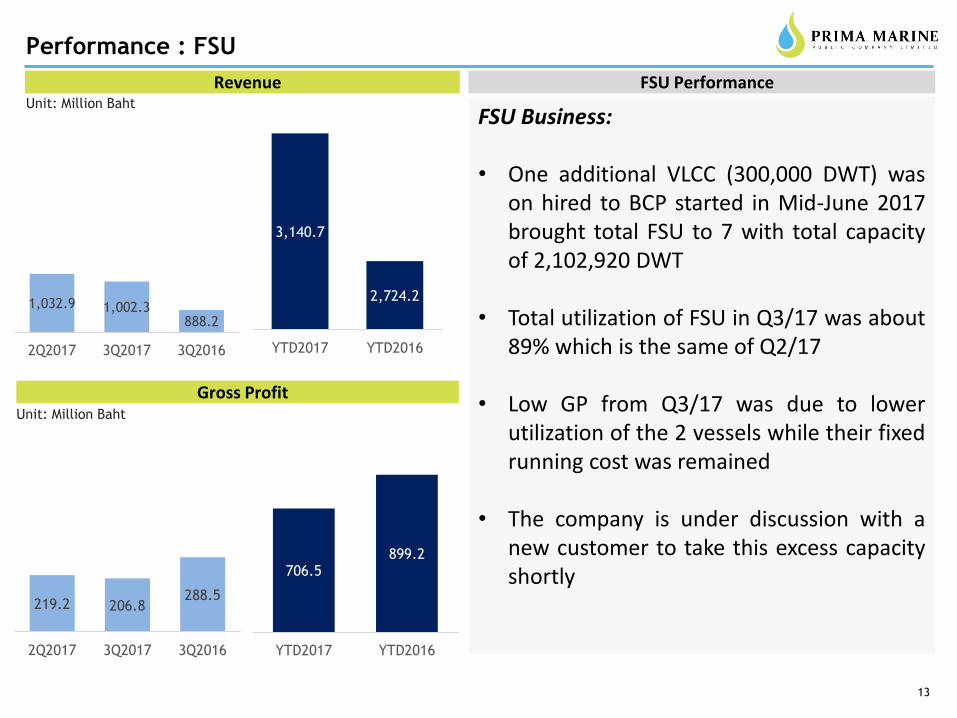
Performance : FSU
FSU Business:
• One additional VLCC (300,000 DWT) was on hired to BCP started in Mid-June 2017 brought total FSU to 7 with total capacity of 2,102,920 DWT
• Total utilization of FSU in Q3/17 was about 89% which is the same of Q2/17
• Low GP from Q3/17 was due to lower utilization of the 2 vessels while their fixed running cost was remained
• The company is under discussion with a new customer to take this excess capacity shortly
1,032.9 1,002.3888.2
2Q2017 3Q2017 3Q2016
Unit: Million Baht
Revenue
Gross Profit
219.2 206.8288.5
2Q2017 3Q2017 3Q2016
3,140.7
2,724.2
YTD2017 YTD2016
706.5899.2
YTD2017 YTD2016
FSU Performance
Unit: Million Baht

14
Performance : Offshore Business
Unit: Million Baht
Revenue
Gross Profit
Offshore Business Performance
Unit: Million Baht
153.5107.9
150.7
2Q2017 3Q2017 3Q2016
38.1
9.7
37.1
2Q2017 3Q2017 3Q2016
385.2
424.2
YTD2017 YTD2016
65.5
85.5
YTD2017 YTD2016
Offshore Business:
• Offshore business consisted of 2 floating storage and offloading (FSO) vessels and 1 Accommodation Work Barge (AWB)
• Utilization of the two FSO vessels remains constant in Q3/17 as they were charter out to Coastal Energy Corporation (CEC) until 2020
• The contract of AWB with PTTEP was expired since mid July 2017. The customer is expected to rehire the vessel early next year.
• Currently the AWB vessel was laid-up at Sattahip which will reduce the running cost from 1.5 MTHB to 0.2 MTHB per month.
• Requirement for AWB is expected to measure significantly following the upcoming new E&P licensing and Bongkot & Erawan is effective which will increase activities for new exploration and production as well as decommissioning of the unused offshore rigs.

15
Performance : Ship Management
Ship Management Business:
• Increase in Ship management revenue derived from serviced product to new third party’s one FSU in Singapore at one container vessel in Thailand
• Total number of vessels under management included
Own vessels: • AWB 1 • FSO 2• Small Tanker 15• Large Tanker 2• FSU 7
TOTAL 26
Third Party vessels: • Container 1 • FSU 1
TOTAL 2
• Ship management contract for another third party container vessels was signed for commencement in Q4/17
Unit: Million Baht
Revenue
Gross Profit
Ship Management Performance
Unit: Million Baht
87.9130.9
85.4
2Q2017 3Q2017 3Q2016
22.4
36.9
9.8
2Q2017 3Q2017 3Q2016
299.2
277.6
YTD2017 YTD2016
71.0
36.2
YTD2017 YTD2016

III. Consolidated Financial Performance
1616
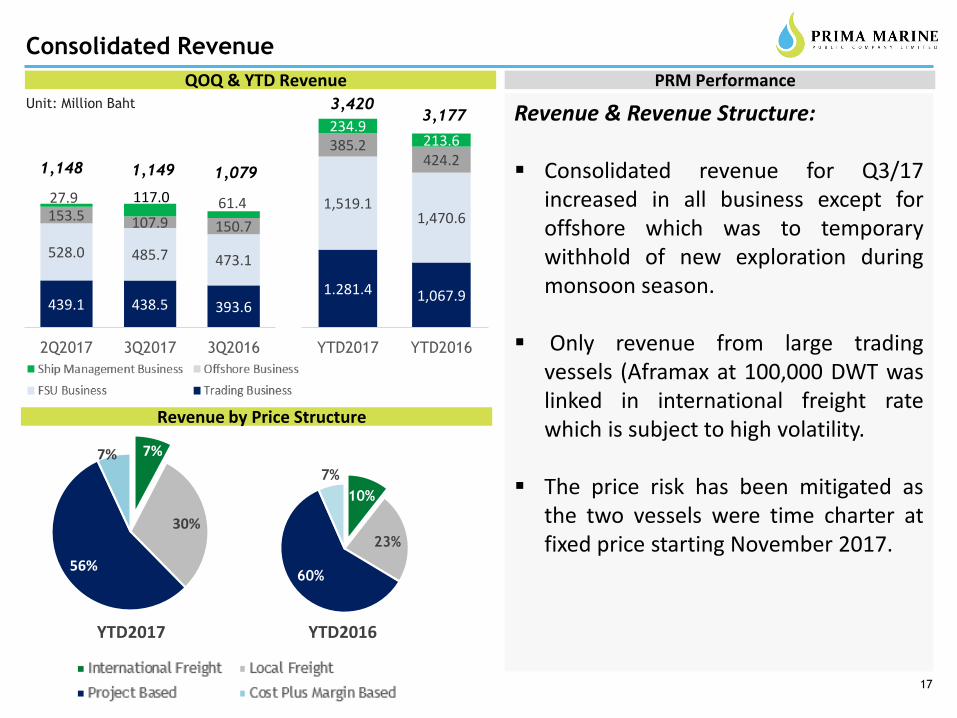
Consolidated Revenue
17
Unit: Million Baht
QOQ & YTD Revenue
YTD2017 YTD2016
7%
30%
56%
7%
10%
23%
60%
7%
439.1 438.5 393.6
528.0 485.7 473.1
153.5 107.9 150.7
27.9 117.0 61.4
2Q2017 3Q2017 3Q2016
1,149 1,079
Revenue by Price Structure
Revenue & Revenue Structure:
▪ Consolidated revenue for Q3/17 increased in all business except for offshore which was to temporary withhold of new exploration during monsoon season.
▪ Only revenue from large trading vessels (Aframax at 100,000 DWT was linked in international freight rate which is subject to high volatility.
▪ The price risk has been mitigated as the two vessels were time charter at fixed price starting November 2017.
PRM Performance
1,148
1.281.4 1,067.9
1,519.11,470.6
385.2424.2
234.9213.6
YTD2017 YTD2016
3,1773,420

20.52 3.15 (18.42)
227.89 183.43
315.19
39.05
13.04
31.08 23.80
62.14
79.02
2Q2017 3Q2017 3Q2016
Trading FSU
Offshore Ship Management
50.3 90.9
639.9
878.9
70.2
80.6
171.5
198.7
YTD2017 YTD2016
Consolidated Gross Profit
18
Unit: Million Baht
Gross Profit by Business Segment
Gross Profit:
▪ Decline in gross profit for Q3/17 as against Q3/16 and YTD/17 as against YTD/16 was due to lower utilization of vessels following to increase in number of vessels during the year which their fixed cost of services were not proportioned according to their utilization.
▪ Depreciation for the vessels was also increased as a result of downward adjustment of scrap value of the vessels using scrap price as at December 31, 2016 which lower than December 31, 2015.
▪ The scrap value is expected to increase in 2017 and the depreciation will be adjusted accordingly.
Gross Profit
Country Tanker Prices as of
November 2017
Tanker Prices as of
Year Ended 2016
Pakistan USD 405/LT USD 310/LT
India USD 395/LT USD 300/LT
Bangladesh USD 390/LT USD 320/LT
PRM Performance
311
262
407
932
1,249
5%
69%
8%
18%
Trading FSU Offshore Ship Management
YTD2017
1%
70%
5%
24%
3Q2017

204.8 189.6
85.4 61.9 4.7
39.5
653.7
1,003.5
YTD2017 YTD2016
931.9
1,249.0
16.7
45.4
YTD2017 YTD2016YTD2017 YTD2016
Consolidated Net Profit
19
Unit: Million Baht
QOQ Net Profit
Net Profit for Q3/17 dropped compared to Q2/17 by 25.6 MTHB or a decrease of 13%
▪ Selling and admin expense for Q3/17 increased from Q3/16 by 17 MTHB. to 82 MTHB. which corresponded to higher revenue.
▪ Financing cost for Q3/16 increased by 11 MTHB. following higher borrowing to finance new vessels.
▪ FX gain for Q3/17 was 30.4 MTHB, higher than Q3/16 by 12.5 MTHB.
▪ As the result, net profit of Q3/17 declined by 145 MTHB. or a decrease of 35% compared to 3Q/16; net profit for YTD/17 was lower than YTD/16 by 350 MTHB. or 35%
YTD Net Profit
PRM Performance
Unit: Million Baht
50.0 51.030.0 31.421.8
10.5
164.7
323.0
3Q2016
261.8
406.9
4.7
9.0
3Q2017 3Q20163Q2017

Total Assets, Liabilities, Equity and D/E ratio
20
ASSET▪ Current assets increased by 2,979 Million Baht
mainly from the increase in-cash and cash at bankgenerated from IPO
▪ Non-current assets decreased by 195 Million Bahtfrom accumulated depreciation.
LIABILITY▪ Current liabilities decreased by 402 Million Baht
from the repayment of O/D and short-term loans.▪ Non-current liabilities decreased by 336.61
Million Baht derived from repayments of long-term loans from financial institution.
SHAREHOLDER’S EQUITY▪ Shareholder’s equity increased by 3,523 Million
Baht from IPO and increased in net profit affectby dividend payouts.
D/E RATIO▪ D/E ratio decreased to 0.8x after listed in SET; and
targeted D/E ratio as of 1.5x
Statement of Financial Position Updated
Note: YTD Data as at 30 Sep 2017
Unit: Million Baht
3,795
816
7,372
7,567
30-Sep-17 YTD2016
Current Asset
Non Current Asset
1,729 2,131
3,256 3,592
6,182
2,660
30-Sep-17 YTD2016
Current Liabilities
Non Current Liabilities
Shareholders' Equity
11,167
8,383
Year Ended 2016As at 30 Sep 2017

IV. Business Outlook & Investment Plan
2121

Business Expansion Plan
Oil & Petrochemical Tanker Business1
▪ Key drivers for the oil & petrochemical tanker business are
o Domestic oil product demand which will be continuously supported by demand growth
o Penetration of EV technology which is expected to be moderate
o Transportation of oil product to Southern part of Thailand by tankers which is the most
efficient and economical
o Improvement of tanker quality and average age which will be instrumental to achieve
higher volume as customers place more emphasize on safety environmental protection
FSU Business2
▪ The FSU business will continuously be supported by
o Limited onshore land available to build tank farm for physical trading in Singapore
o Fuel’s specification change
o Increase in global oil demand and supply
Offshore Business3
▪ The offshore business will be supported by
o Stable crude oil price
o Thai government regulation on Thai flag vessel (Cabotage Law) will enhance PRM’s
opportunity in offshore business
o Petroleum Concession Act expected to become effective
22

23
Existing Vessels/1 3-Year Investment Schedule/2 Key Supporting Factors of Future Projects
▪ Growing demand of domestic oil consumption, backed by growing
Thai Tourism industry
▪ Expansion domestic major oil companies’ terminal tank, especially the
southern part of Thailand
FSO Fleets
• Penetrate in regional market to capture growing oil demand
• Petrochemical Transportation
11
2016
-
-
2
2017 2018 2019
+3 +1
+3
+1
- - -
- - -
+2 +6 +3
- +2 -
▪ Increase in demand for blending activity of FSU due to Sulphur
emission regulation (IMO) by 2020
▪ Rising need on FSU service due to oil reserve count issues
▪ Opportunity to capture upside from rebounding of oil price at
historically low
▪ Potential increase in domestic and southeast Asia Offshore business
activity
▪ Petroleum Concession Act
Note : Data as at 30 September 2017
Trading (Small)
Trading (Large)
Oil a
nd C
hem
ical
Tankers
Trading (Small)
Trading (Large)
DOMESTIC
INTERNATIONAL
FSU FleetsFSU
Off
shore
6 +1 +1 +3
3
Future Projects
Large Trading VesselsSpot Charter changed to Time Charter▪ Northern Star : Time charter with UNIPEC for 1 Years ++(Effective as of 1 Nov 2017 onwards)
▪ Radiant Star : Time charter with BCP for 6 Months + 3 Months(Effective as of 15 Nov 2017 onwards)
Current Movement

24
Q&A
THANK YOU


