PRIVATE EQUITY MARKET OF THE VISEGRAD...
15
Ekonomicko-manazerske spektrum 2018, Volume XII, Issue 1, pp. 1-15 1 ISSN 1337-0839 (print) / 2585-7258 (online) PRIVATE EQUITY MARKET OF THE VISEGRAD GROUP Jozsef Popp 1,a,* , Judit Olah 2,b , Veronika Machova 3,c and Agnieszka Jachowicz 4,d 1 Debreceni Egyetem, Gazdaságtudományi Kar, Ágazati Gazdaságtan és Módszertani Intézet, Boszorményi út. 138, 4032 Debrecen, Hungary 2 Debreceni Egyetem, Gazdaságtudományi Kar, Alkalmazott Informatika és Logisztika Intézet, Boszorményi út. 138, 4032 Debrecen, Hungary 3 University of Economics Prague, Faculty of Business Administration, W. Churchill 4, 130 67 Prague, Czech Republic 4 University of Dabrowa Gornicza, Department of International Enterprise and Finance, Str. Cieplaka 1c, 41-300 Dabrowa Górnicza, Poland a [email protected], b [email protected], c [email protected], d [email protected] *Corresponding author Cite as: Popp, J., Olah, J., Machova, V., Jachowicz, A. (2018). Private equity market of the Visegrad group, Ekonomicko-manazerske spektrum, 12(1), 1-15. Available at: dx.doi.org/10.26552/ems.2018.1.1-15 Abstract: Private equity is medium to long-term finance provided in return for an equity stake in potentially high growth unquoted companies. Private equity is capital that is not listed on a public exchange. Private equity is composed of funds and investors that directly invest in private companies, or that engage in buyouts of public companies, resulting in the delisting of public equity. Institutional and retail investors provide the capital for private equity, and the capital can be utilized to fund new technology, make acquisitions, expand working capital, and to bolster and solidify a balance sheet. Private equity investment comes primarily from institutional investors and accredited investors, who can dedicate substantial sums of money for extended time periods. In most cases, considerably long holding periods are often required for private equity investments in order to ensure a turnaround for distressed companies or to enable liquidity events such as an initial public offering or a sale to a public company. Thus, the aim of the paper is to compare the usage of the private equity by small and medium-sized enterprises in V4 countries with a focus on the accessibility and preferences. The paper is divided into several parts. The first part is devoted to the literature review of theoretical resources of the private equity term, its distribution and its usage in the region. The second part is dedicated to theoretical definition of private equity issues and concepts which are connected with private equity investments. The paper is focused on the analytical research of issue. A comparative analysis is used to compare the use of the private equity in selected countries. The correlation and regression analyses, which determine factors of influence on country attractiveness for private equity investors, were realized. Keywords: private equity; venture capital; Visegrad group; regression. JEL Classification: D25, G24, O52 1. Introduction Private equity (PE) may be defined as shares representing ownership of or an interest in an entity – that is not publicly listed or traded. A source of investment capital, private equity
Transcript of PRIVATE EQUITY MARKET OF THE VISEGRAD...

Ekonomicko-manazerske spektrum
2018, Volume XII, Issue 1, pp. 1-15
1 ISSN 1337-0839 (print) / 2585-7258 (online)
PRIVATE EQUITY MARKET OF THE VISEGRAD
GROUP
Jozsef Popp1,a,*, Judit Olah2,b, Veronika Machova3,c and Agnieszka Jachowicz4,d
1Debreceni Egyetem, Gazdaságtudományi Kar, Ágazati Gazdaságtan és Módszertani Intézet,
Boszorményi út. 138, 4032 Debrecen, Hungary 2Debreceni Egyetem, Gazdaságtudományi Kar, Alkalmazott Informatika és Logisztika Intézet,
Boszorményi út. 138, 4032 Debrecen, Hungary 3University of Economics Prague, Faculty of Business Administration, W. Churchill 4, 130 67 Prague,
Czech Republic 4University of Dabrowa Gornicza, Department of International Enterprise and Finance, Str. Cieplaka
1c, 41-300 Dabrowa Górnicza, Poland [email protected], [email protected], [email protected], [email protected]
*Corresponding author
Cite as: Popp, J., Olah, J., Machova, V., Jachowicz, A. (2018). Private equity market of the Visegrad
group, Ekonomicko-manazerske spektrum, 12(1), 1-15.
Available at: dx.doi.org/10.26552/ems.2018.1.1-15
Abstract: Private equity is medium to long-term finance provided in return for an equity stake
in potentially high growth unquoted companies. Private equity is capital that is not listed on a
public exchange. Private equity is composed of funds and investors that directly invest
in private companies, or that engage in buyouts of public companies, resulting in
the delisting of public equity. Institutional and retail investors provide the capital for private
equity, and the capital can be utilized to fund new technology, make acquisitions, expand
working capital, and to bolster and solidify a balance sheet. Private equity investment comes
primarily from institutional investors and accredited investors, who can dedicate substantial
sums of money for extended time periods. In most cases, considerably long holding periods are
often required for private equity investments in order to ensure a turnaround for distressed
companies or to enable liquidity events such as an initial public offering or a sale to a public
company. Thus, the aim of the paper is to compare the usage of the private equity by small and
medium-sized enterprises in V4 countries with a focus on the accessibility and preferences. The
paper is divided into several parts. The first part is devoted to the literature review of theoretical
resources of the private equity term, its distribution and its usage in the region. The second part
is dedicated to theoretical definition of private equity issues and concepts which are connected
with private equity investments. The paper is focused on the analytical research of issue. A
comparative analysis is used to compare the use of the private equity in selected countries. The
correlation and regression analyses, which determine factors of influence on country
attractiveness for private equity investors, were realized.
Keywords: private equity; venture capital; Visegrad group; regression.
JEL Classification: D25, G24, O52
1. Introduction
Private equity (PE) may be defined as shares representing ownership of or an interest in an
entity – that is not publicly listed or traded. A source of investment capital, private equity

Private Equity Market
of the Visegrad Group
Authors: Jozsef Popp et. al.
ISSN 1337-0839 (print) / 2585-7258 (online) 2
actually derives from high net worth individuals and firms that purchase shares of private
companies or acquire control of public companies with plans to take them private, eventually
become delisting them from public stock exchanges. Most of the private equity industry is
made up of large institutional investors, such as pension funds, and large private equity firms
funded by a group of accredited investors.
In continental Europe, the term private equity is synonymous with the term venture capital.
Both terms stand for a medium or a long-term financing provided in order to gain a part of
equity of a company, shares of which are not publicly traded and that have a potential to
generate wealth in the future. The investment period is usually between 4 to 7 years. In the
USA, private equity has always been divided in two subgroups; (i) venture capital (used for
financing of small companies in the initial phase of growth and (ii) buyout and buy-in
transactions (taking over control of companies in a later stage of development). As the majority
of documents published by European Private Equity & Venture Capital Association (EVCA)
inclines to the American comprehension of the term private equity, we shall do the same or
mention if not. Private equity investments are quite risky; therefore, financial investors need to
be well organized to control the risk. They establish private equity funds. PE funds are special
purpose companies intended to collect sources from investors to invest them in a target
company or in other private equity funds.
Private equity funds are generally structured as limited partnership, which is controlled by a
private equity firm that acts as the general partner. The limited partnership is often called fund
and the general partners are designated as the management company. The management
company cooperates with the fund on the contractual basis and is in charge of searching
investment opportunities, carries out the evaluation of profitability, realizes the projects,
monitors them and then resells the purchased companies. Even though, the management
company that stands behind the selecting process, it is upon the fund to decide in the end.
Therefore, each fund has an investor committee composed of investors and often also of
representatives of the management company, which pronounces the final decision about a
project. The reason for choosing the limited partnership form stems from the fact that the limited
partnership form is usually defined quite vaguely in the national legislation, which enables the
founder to make particular specification on behalf of different types of investors in the
partnership agreement, according to Dvorak & Prochazka (1998).
Most PE funds are founded for a limited period of time, usually 8 or 10 years, when they
typically make about 20 separate investments with usually no single investment exceeding 10%
of the total commitments. At the end of their life, they are obliged to liquidate all the
investments. Existence of the fund is divided into three overlapping stages:
1. Investment stage – this stage usually lasts for about three years and is dedicated to capital
collection, to the search for target companies and finally to the investment itself. Concerning
the collection of capital from investors, a PE fund prefers several subsequent drawdowns to
collecting the whole amount at once. This requires the investor to hold sufficiently liquid assets
to be able to satisfy the call immediately as it occurs, only two or three weeks in advance. If he
is not able to comply with the requirement, he is exposed to a penalty. In the EVCA
terminology, this technique is called the “just-in-time drawdowns”. It is used to minimize the
amount of cash that remains in the fund without being invested. The more uninvested cash the
fund holds, the lower the internal rate of return, which measures its performance; therefore, the
less profitable the fund appears.
2. Maturity stage – maturity stage is in the name of growth and expansion of the invested
capital, monitoring the cash flows, management of the company and control of the risk and

Ekonomicko-manazerske spektrum
2018, Volume XII, Issue 1, pp. 1-15
3 ISSN 1337-0839 (print) / 2585-7258 (online)
strategy. This stage usually lasts for 4–7 years, during which it becomes evident, which projects
were good investments and which were the loss-making one.
3. Exit stage – this is the final stage which shows the real profits for investors as well as for
the management company of the fund. There is no optimal duration of the third stage as the best
moment to resell a company is strictly individual. Every management company usually
manages a few funds at some moment, each of them in a different stage. Therefore, whenever
one fund reaches the “harvest period”, the profits are distributed among investors and the fund
is closed, there is another fund that is entering the exit stage and the management company
usually establishes a new fund soon after.
1.1 Literature Review
Various academic studies and authors define private capital (PE) differently depending on
the nature of the economy. In general, private equity is a type of non-listed stock. It is a source
of investment capital from institutions with amount of capital to invest and acquire ownership
in a company, argued by Stowell (2018).
Private equity includes a risky, long-term and profitable commitment and provides a strong
financial base and expertise to the company. Isaksson et al. (2004) defined private capital as a
specific form of corporate finance that is globally one of the largest non-bank sources of
medium to long-term capital. Leeds (2015) defined private capital as a financing source of early
and late stages of private companies from third party investors looking for a high return based
on the corporate risk profile and the short-term illiquidity of these investments. Burdel (2009)
explains private capital as a shelter against the short-term vision and volatility of stock markets
and provides a stable platform for rapid, highly concentrated growth at key points in the
corporate development. He argues that private capital is less liquid than publicly traded shares
and is therefore thought to be a long-term investment. Mason & Harisson (1999), in a broader
sense, understand private capital as investment by institutions, companies, and wealthy
individuals in non-listed companies that have high growth potential and can become significant
players in the international market.
Private capital is a form of investment. It is included in an alternative type of investment in
a security. In the widest sense, investment means giving up a certain value in order to obtain a
certain future value, argued by Sharp & Alexander (1994). Similarly, Kaplan & Strömberg
(2009) went on a similar path, claiming that the investment is understood to be the acquisition
of such an asset, which in the future will bring some economic benefit to its owner or will be
evaluated in the future. In private equity, this asset is a share in a particular company. Investor's
entry into the funded company is therefore not only a financial injection but also a partnership.
Link et al. (2012), and Bygrave & Timmons (1992) broaden this definition in their studies.
They dealt with the influence of an investor in the funded company and concluded that the PE
investor activity generally leads to above-average performance of the funded company and also
leads to a higher internationalization rate.
Gervasoni & Sattin (2006) claim that private equity can finance anything with investment
potential. Investments can be given for the development of new products, new technologies, or
investment can be used to expand production or consolidate the financial position of an
enterprise. However, the purpose of redemption of a share in an enterprise may also be to
resolve a problem associated with the arrangement of ownership of an enterprise or its overall
reorganization. EVCA (2007) argues that private equity is the provision of equity for medium-
or long-term horizon, provided by financial investors to companies that are not traded on a
public stock exchange and have high growth potential. The goal of private equity is to help
companies achieve their growth ambitions by providing them finance, strategic advice and

Private Equity Market
of the Visegrad Group
Authors: Jozsef Popp et. al.
ISSN 1337-0839 (print) / 2585-7258 (online) 4
information at very important stages of their development. Private equity does not only cover
the financing required for the business operation but it also includes financing at later stages of
the life cycle. In its definitions, there are three main notions to be distinguished venture capital,
private equity and business angels. Venture capital is a type of private equity that focuses on
emerging companies, start-up. The term private equity refers to the form of the capital
investment in private companies that are not traded on the stock exchange. Venture capital is
therefore a subset of private equity. Capital of business angels is a specific form of private
equity of investors who are not formally associated and provide their capital individually,
according to Nyvltova & Reznakova (2007). Veber (2008) searched the use of private equity in
various countries. The principle is that the private equity fund enters into the company in the
form of a capital increase. In this way, the company will acquire the necessary resources, and
after a few years, the equity capital of the private equity fund will be redeemed and the
investments will be returned to the fund. The main objective of the private equity fund is to
invest, evaluate, sell, and re-invest in other opportunities. The fact that PE funds play an
important as financial mediator on the private equity market was declared in the study of
Stowell (2018) and Diaconu (2012).
Companies funded by private equity may achieve many benefits. Kortum & Lerner (2000)
argued that private equity has a strong positive impact on the rise of ideas and inventions.
Sharing technologies in the economy in return increases productivity and company profits.
Fryges & Wright (2014) showed that German companies with the capital from private investors
invested more in research and development and were more creative and willing to share
technologies than other companies were. Achleitner & Klöckner (2005) concluded that the
average employment rate is higher in companies funded by venture capital.
Venture capital has attracted more attention in practice and literature by delivering a positive
impact on companies with high growth potential linked to innovation by producing new
technologies, increasing profits, industrial development and increasing employment. National
governments have recognized the importance of funds and investing in high-risk activities and
admitted that the corporate access to fund resources can be crucial for their research, profits and
visibility. The low rate of capital may be problematic when considering their important role in
innovation increasing.
2. Methodology and Aims of the research
The main aim of the study is to compare the use of private equity as a source of investment
of small and medium-sized enterprises in Visegrad group and to provide a view of the
development and usage of private equity.
In the analytical section, the situation of the private equity use in the V4 countries is depicted
and the focus is on the factors that affect the way of private equity obtaining. Firstly, the PE
situation in Central and Eastern Europe is described in the period of last four years. The analyses
of investments in small and medium sized companies in the V4 counties is conducted to
determine the source of capital investors provide considering the corporate life cycle. Secondly,
the country attractiveness for a PE investor is measured, using the global attractiveness index
of countries in the area of PE capital. The author analyses the factors and sub-factors of the
index and the score achieved, and the results of the V4 countries in 2017 are portrayed. Finally,
a method of correlation analysis is used to determine which factor most affects the resulting score achieved in the attractiveness index. By regression analysis, we form a regression
equation to estimate the value for the next period. We compare the given value with the best
countries and values as well as with the global competitiveness index of the countries.

Ekonomicko-manazerske spektrum
2018, Volume XII, Issue 1, pp. 1-15
5 ISSN 1337-0839 (print) / 2585-7258 (online)
All the data are presented for SMEs, although some of the data obtained may contain
information about large enterprises. This data does not distort the formulations and results
because in all V4 countries the share of small and medium-sized enterprises is at least 99 %
(Eurostat), which means that the variance is negligible.
3. Results
The countries of the Visegrad group belong to Central and Eastern Europe (CEE), having
similar historical (part of the Eastern Bloc), geographic or economic backgrounds. For the past
eight years, the CEE has achieved stable numbers in the volume of PE resources to finance
private equity of SMEs, however, it is far from reaching the level they achieved in the years
before the financial crisis (2006-2008).
Figure 1: Volume of investments in CEE region, 2003-2016
Source: EVCA
As it may be seen, the greatest volume of the PE sources were gained in 2007. For the past
eight years, only the year 2014 deflects from the steady trend, when the positive leap came, and
the CEE countries raised funding of 1.48 billion euros, which on the other hand represents only
36.7% compared to 2007. The increase in the year 2014 was even more noticeable due to the
decrease in the total volume of resources across Europe that year. This can be explained by high
GDP growth, low inflation and decrease in unemployment in many CEE countries, creating an
attractive space for PE investors. When comparing the last two years, we observe that in 2016
CEE countries increased their PE resources by € 237 million. This change represents a 61.7%
increase compared to previous year 2015 and sets positive expectations in the future years.
The boom in the volume of PE investments provided by SMEs in CEE countries was in
2006, the volume of investments grew by 2008 when it reached its maximum. This increase
was due to the considerable potential of this area, which attracted institutional investors and PE
funds. In the following year, there has been a slight decline, but in 2010 the world economic
and financial crisis influenced alsi the situation on the CEE market resulting in a huge fall in
investment and stagnation continued until 2013, when the crisis was finally overcome and the
investors` confidence was regained. In 2013, the CEE invested 847 million euros, with the share
of V4 countries accounting for 75.4% of total investments. In 2014, the share of V4 investments
fell to 55.4% and rose to at least 60% in 2015 and 2016 (EVCA, 2016). These shares show that
in the CEE region, the economic power in the PE investment sector is a majority. Looking at

Private Equity Market
of the Visegrad Group
Authors: Jozsef Popp et. al.
ISSN 1337-0839 (print) / 2585-7258 (online) 6
the results of specific V4 countries in more detail, we find that one country significantly
outperforms others (Figure 2).
Figure 2: PE investments in mil. € in V4 countries
Source: EVCA
Figure 2 demonstrates that Slovakia is the country with lowest level of PE investments.
However, positive is the fact that the popularity of the private equity in Slovakia has arisen
recently, which presents its potential for new investors (EVCA, 2016). According to the
available data, we can assume that in 2015 an average of EUR 1.36 mil. was invested in one
enterprise, whereas in 2016 it was on average less than 500 thousand euros. The decline in
investment in SMEs resulted in increased volume of investment in seed and start-up SMEs,
which require a lower initial capital ratio and a reduction in the number of managerial buy-outs.
Among the countries, but especially from the perspective of the time horizon, there are
differences in the level of investment per enterprise. These differences have arisen with the
different types of PE investment. Therefore, in Tables 1 and 2, it is shown which types of
investments the country has provided for 2015 and 2016.
Table 1: Volume of investments in thousands € considering the type of investment (2015)
Type of investment capital Slovakia Poland Czech Republic Hungary
Seed financing 1,740 4,691 300 3,021
Start-up financing 4,619 17,761 1,300 18,729
First stage financing 2,750 6,421 70 3,068
Expansion financing 7,000 79,385 8,750 38,482
Rescue capital 0 0 0 0
Debt replacement capital 0 22,708 0 0
Managerial buy-outs 13,400 686,784 3 407 95,000
TOTAL 29,509 817,750 13,827 158,300
Source: EVCA
Table 2: Volume of investments in thousands € considering the type of investment (2016)
Type of investment capital Slovakia Poland Czech
Republic Hungary
Seed financing 3,170 1,671 712 3,117
Start-up financing 6,801 15,067 3,488 26,025

Ekonomicko-manazerske spektrum
2018, Volume XII, Issue 1, pp. 1-15
7 ISSN 1337-0839 (print) / 2585-7258 (online)
First stage financing 0 4,696 0 2,109
Expansion financing 2,750 113,080 4,860 57,111
Rescue capital 0 0 0 0
Debt replacement capital 0 9,958 0 0
Managerial buy-outs 0 580,940 159,059 365
TOTAL 12,721 725,413 168,119 88,726
Source: EVCA
We can see that rescue and replacement capitals are not very popular in V4 countries. Only
Poland provided replacement capital (nearly 23 million in 2015 and almost 10 million in 2016),
none of the V4 countries invested in the rescue capital. On the other hand, the most popular
investments are in management buy-outs, despite the fact that all countries except the Czech
Republic had declined investments compared to 2015 and in addition, there is no management
buy-out or investment in early development in 2016 in Slovakia. However, there is a positive
development in investments in seed and start-up SMEs. Slovakia, in the volume of seed
financing SMEs in 2016 outperformed Poland and also became the country with the largest
investments in seed financing of SMEs in the CEE. Poland continued to focus on management
buy-outs, but the expansion financing increased significantly (42 %) in the determined period.
In Hungary, as well as in Poland, they experienced a decline in management buy-outs. The
radical decreases in the number of management buy-outs in Slovakia and Hungary was caused
by a lack of investor capital in such kind of investments. The same situation was with Czech
PE funds, expansion investments were falling, whereas the seed and start-up investments
increased. However, the Hungarian investments mainly differed in management byu-outs,
which increased significantly compared to the previous year, up to more than 155 million euros.
Global attractiveness index of the PE capital
PE markets are most often focused on developing markets that attract investors to the
opportunity of high economic growth. However, economic growth is not the only factor that
reflects the attractiveness of the country for investment. The existence of a prosperous PE
market and environment requires many socio-economic and institutional preconditions.
Therefore, not every developing country is sufficiently mature within these assumptions. Too
early entry into these countries could be a disadvantageous strategy. Therefore, the
attractiveness index monitors the development of the assumptions and shows their
improvements, allowing investors to get a better overview of foreign markets and to estimate
the right time to invest.
The global attractiveness index summarizes the factors that form national PE markets into a
single composite measurement. These factors from the sensitive PE markets were extensively
studied in the literature. This literature was reviewed and the information gathered for the index
was validated for several years, contributing to a better understanding of the driving force of
international PE activity. The ability and reliability to select the factor correctly evolved and
deepened at each new annual issue of the index. These factors are derived from the research
and are divided into six subchapters (Groh et al., 2010). These subchapters illustrate the
structure of the index, each representing one of the six key features of the country attractiveness
for investors of PE capital: economic activity, depth of the capital market, taxation, investor
protection and Corporate Governance, human and social environment, business culture and
business opportunities. Table 3 summarizes the results of V4 countries when assessing the
attractiveness of PE investors in 2017.
Private Equity Market
of the Visegrad Group
Authors: Jozsef Popp et. al.
ISSN 1337-0839 (print) / 2585-7258 (online) 8
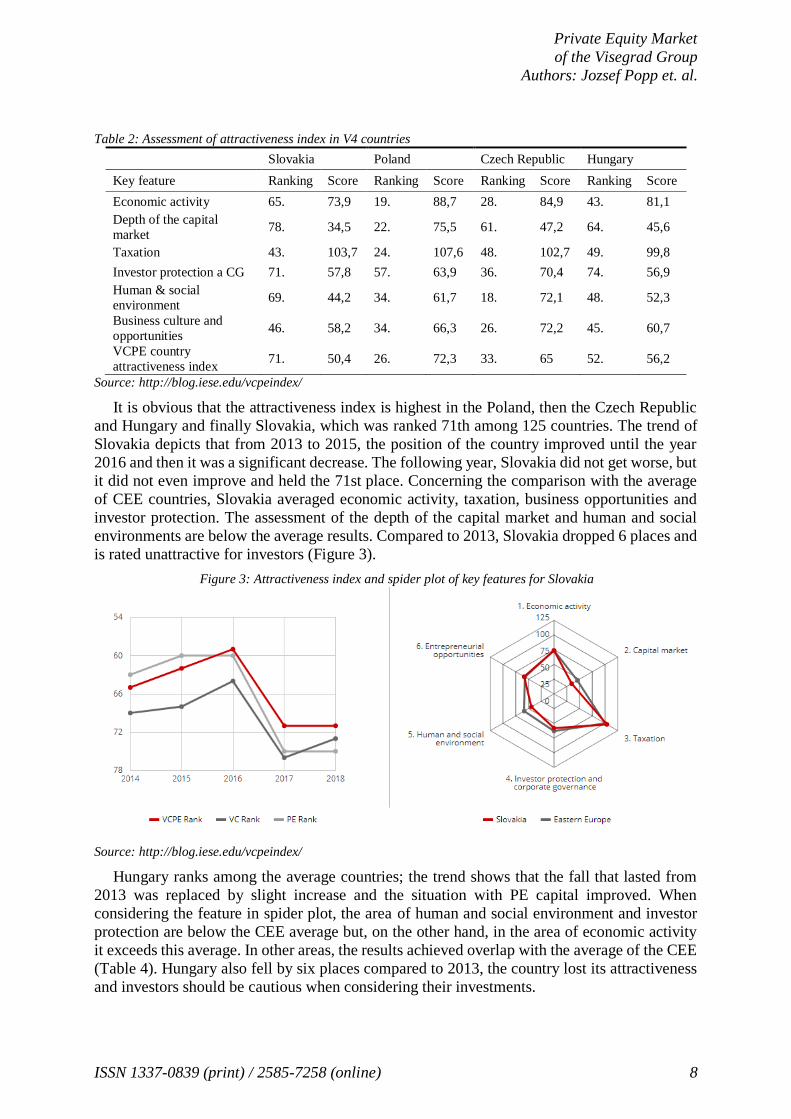
Table 2: Assessment of attractiveness index in V4 countries
Slovakia Poland Czech Republic Hungary
Key feature Ranking Score Ranking Score Ranking Score Ranking Score
Economic activity 65. 73,9 19. 88,7 28. 84,9 43. 81,1
Depth of the capital
market 78. 34,5 22. 75,5 61. 47,2 64. 45,6
Taxation 43. 103,7 24. 107,6 48. 102,7 49. 99,8
Investor protection a CG 71. 57,8 57. 63,9 36. 70,4 74. 56,9
Human & social
environment 69. 44,2 34. 61,7 18. 72,1 48. 52,3
Business culture and
opportunities 46. 58,2 34. 66,3 26. 72,2 45. 60,7
VCPE country
attractiveness index 71. 50,4 26. 72,3 33. 65 52. 56,2
Source: http://blog.iese.edu/vcpeindex/
It is obvious that the attractiveness index is highest in the Poland, then the Czech Republic
and Hungary and finally Slovakia, which was ranked 71th among 125 countries. The trend of
Slovakia depicts that from 2013 to 2015, the position of the country improved until the year
2016 and then it was a significant decrease. The following year, Slovakia did not get worse, but
it did not even improve and held the 71st place. Concerning the comparison with the average
of CEE countries, Slovakia averaged economic activity, taxation, business opportunities and
investor protection. The assessment of the depth of the capital market and human and social
environments are below the average results. Compared to 2013, Slovakia dropped 6 places and
is rated unattractive for investors (Figure 3).
Figure 3: Attractiveness index and spider plot of key features for Slovakia
Source: http://blog.iese.edu/vcpeindex/
Hungary ranks among the average countries; the trend shows that the fall that lasted from
2013 was replaced by slight increase and the situation with PE capital improved. When
considering the feature in spider plot, the area of human and social environment and investor
protection are below the CEE average but, on the other hand, in the area of economic activity
it exceeds this average. In other areas, the results achieved overlap with the average of the CEE
(Table 4). Hungary also fell by six places compared to 2013, the country lost its attractiveness
and investors should be cautious when considering their investments.

Ekonomicko-manazerske spektrum
2018, Volume XII, Issue 1, pp. 1-15
9 ISSN 1337-0839 (print) / 2585-7258 (online)
Figure 4: Attractiveness index and spider plot of key features for Hungary
Source: http://blog.iese.edu/vcpeindex/
The Czech market is growing year by year, reflecting the attractiveness for investors. The
areas that need to be improved to belong to the group of the most attractive countries of the
world are the depth of the capital market and taxation. In other areas, the average of CEE
countries was exceeded, particularly in the area of enterprise opportunities and the human and
social environment (Figure 5). The positive development trend over the last four years gave the
country an index rating of a high attractive country with investment recommendation.
Figure 5: Attractiveness index and spider plot of key features for the Czech Republic
Source: http://blog.iese.edu/vcpeindex/
Poland had the best position among the CEE countries. In the area of human and social
environment and investor protection, Poland is around the average of the CEE region. In other
areas, the country is above this boundary. Due to the size and strength of the Polish PE market,
it is considerably higher than the CEE in terms of economic activity and the depth of the capital
market. In the last four years, Poland is the same group of countries as the Czech Republic,
which is an attractive country for investor; it is advised to invest in it or to increase the existing
investments.

Private Equity Market
of the Visegrad Group
Authors: Jozsef Popp et. al.
ISSN 1337-0839 (print) / 2585-7258 (online) 10
Figure 6: Attractiveness index and spider plot of key features for Poland
Source: http://blog.iese.edu/vcpeindex/
Correlation and regression analyses
We need to determine dependent and independent variables. Dependent variable is the
resulting score of the country attractiveness index (VCPE) and factors of the attractiveness
index are considered independent variables, i.e. business culture and business opportunities,
taxation, economic activity, human and social environment, capital market depth and investor
Protection and Corporate Governance. We determine a value of 0.01 for the significance level
(α) in regression analysis, which means that we admit 1% error in the hypothesis testing. When
testing the regression analysis, we compare the significance level with the p-value. If the p-
value is lower than the significance level, we reject the null hypothesis that the regression model
is statistically insignificant and accept the alternative hypothesis, that the regression is
statistically significant. And, vice versa, if the p-value is greater than the significance level, we
do not reject the null hypothesis that the regression is statistically insignificant.
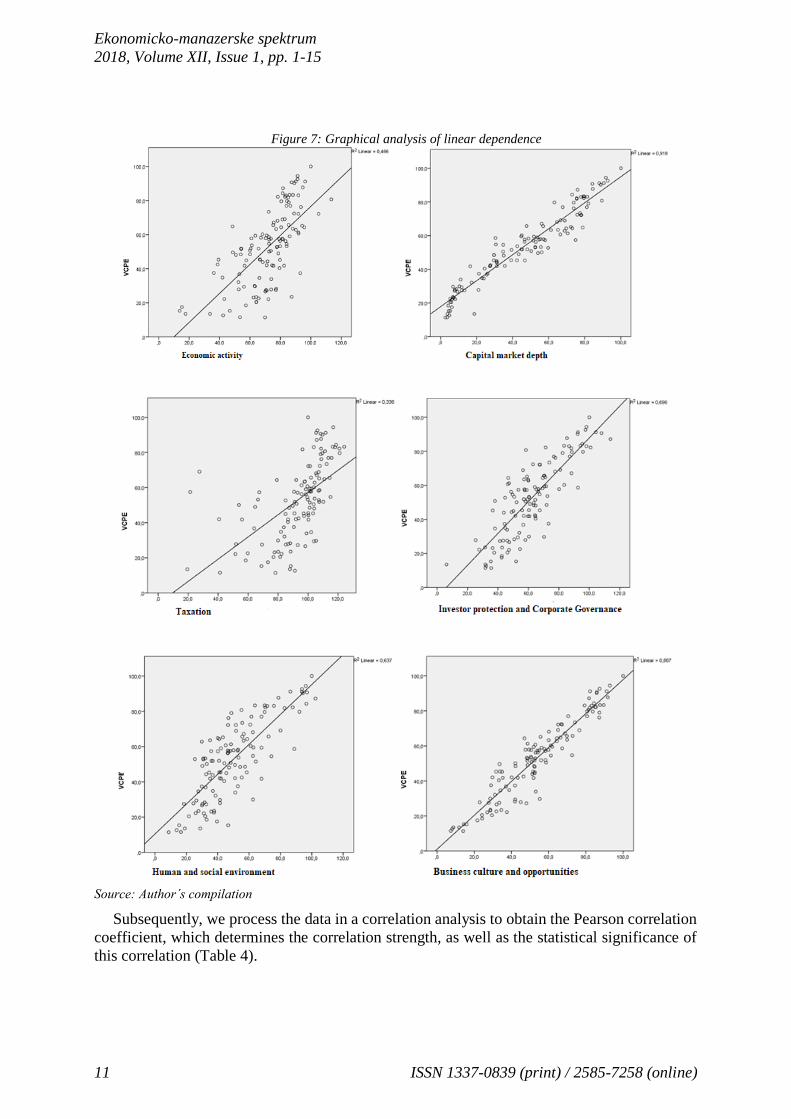
First, we use graphical analysis to check the linear dependence of the VCPE index of
attractiveness, to each factor of attractiveness, and we express it in a point graph (Figure 7). In
the graphical analysis, we found that all factors are linearly dependent on the country
attractiveness index. Obviously, there are no significant outsiders. In the graphs at the top right
we can see the coefficients of determination, which determines the quality of the regression
model. Thus, it explains how many per cents of the variable variability (VCPE attractiveness
index) is captured by the given line. The closer to the value of 100 %, the better the linear
model. It is clear that the highest value has the factor of the capital market depth, which explains
91.8 % of the dependent variables variability. Following is the factor of business culture and
business opportunities, describing 88.7 % of the variability. Moderate linear dependence is
typical of other factor: investor protection and corporate governance and the human and social
environment explain the variability at 69.6 % and 63.7 %, respectively. The factors that least
describe the attractiveness index are the factors of economic activity (46.6 %) and taxation (33.6
%).
Ekonomicko-manazerske spektrum
2018, Volume XII, Issue 1, pp. 1-15
11 ISSN 1337-0839 (print) / 2585-7258 (online)
Figure 7: Graphical analysis of linear dependence
Source: Author´s compilation
Subsequently, we process the data in a correlation analysis to obtain the Pearson correlation
coefficient, which determines the correlation strength, as well as the statistical significance of
this correlation (Table 4).
Private Equity Market
of the Visegrad Group
Authors: Jozsef Popp et. al.
ISSN 1337-0839 (print) / 2585-7258 (online) 12
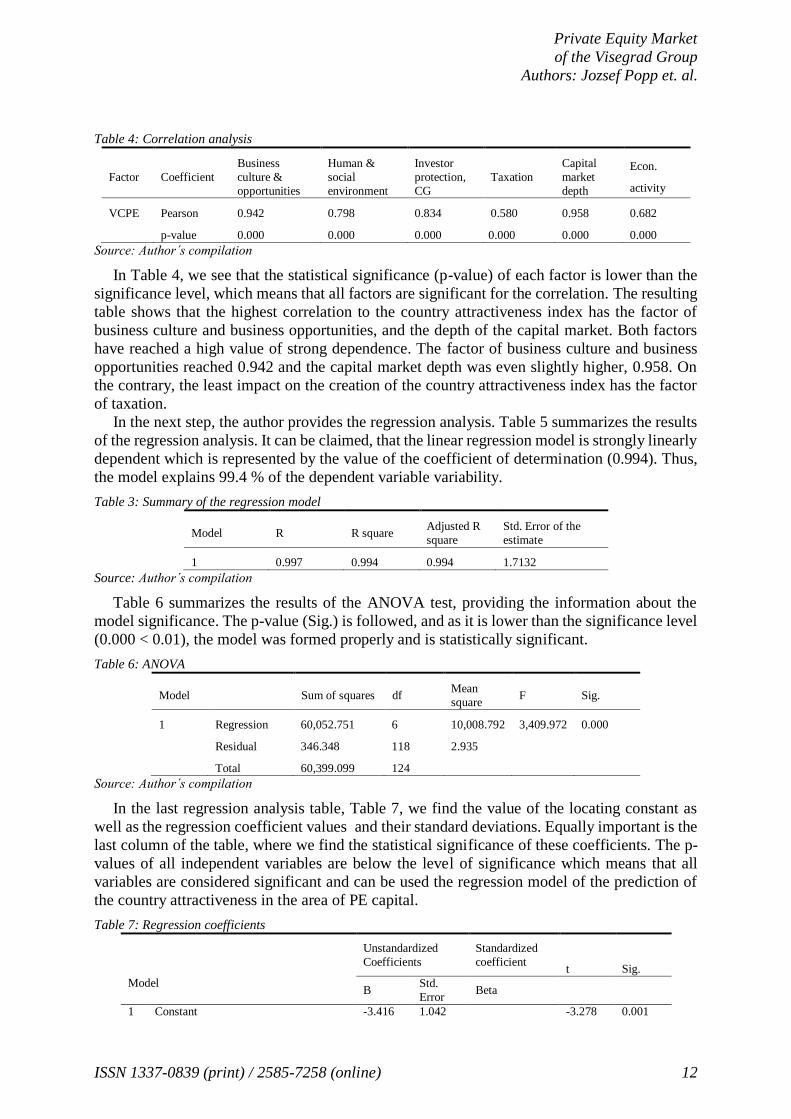
Table 4: Correlation analysis
Factor Coefficient
Business
culture &
opportunities
Human &
social
environment
Investor
protection,
CG
Taxation
Capital
market
depth
Econ.
activity
VCPE Pearson 0.942 0.798 0.834 0.580 0.958 0.682
p-value 0.000 0.000 0.000 0.000 0.000 0.000
Source: Author´s compilation
In Table 4, we see that the statistical significance (p-value) of each factor is lower than the
significance level, which means that all factors are significant for the correlation. The resulting
table shows that the highest correlation to the country attractiveness index has the factor of
business culture and business opportunities, and the depth of the capital market. Both factors
have reached a high value of strong dependence. The factor of business culture and business
opportunities reached 0.942 and the capital market depth was even slightly higher, 0.958. On
the contrary, the least impact on the creation of the country attractiveness index has the factor
of taxation.
In the next step, the author provides the regression analysis. Table 5 summarizes the results
of the regression analysis. It can be claimed, that the linear regression model is strongly linearly
dependent which is represented by the value of the coefficient of determination (0.994). Thus,
the model explains 99.4 % of the dependent variable variability.
Table 3: Summary of the regression model
Model R R square Adjusted R
square
Std. Error of the
estimate
1 0.997 0.994 0.994 1.7132
Source: Author´s compilation
Table 6 summarizes the results of the ANOVA test, providing the information about the
model significance. The p-value (Sig.) is followed, and as it is lower than the significance level
(0.000 < 0.01), the model was formed properly and is statistically significant.
Table 6: ANOVA
Model Sum of squares df Mean
square F Sig.
1 Regression 60,052.751 6 10,008.792 3,409.972 0.000
Residual 346.348 118 2.935
Total 60,399.099 124
Source: Author´s compilation
In the last regression analysis table, Table 7, we find the value of the locating constant as
well as the regression coefficient values and their standard deviations. Equally important is the
last column of the table, where we find the statistical significance of these coefficients. The p-
values of all independent variables are below the level of significance which means that all
variables are considered significant and can be used the regression model of the prediction of
the country attractiveness in the area of PE capital.
Table 7: Regression coefficients
Model
Unstandardized
Coefficients
Standardized
coefficient
t
Sig.
B Std.
Error Beta
1 Constant -3.416 1.042 -3.278 0.001

Ekonomicko-manazerske spektrum
2018, Volume XII, Issue 1, pp. 1-15
13 ISSN 1337-0839 (print) / 2585-7258 (online)
Economic activity 0.076 0.012 0.061 6.049 0.000
Capital market depth 0.451 0.011 0.560 39.926 0.000
Taxation 0.046 0.010 0.042 4.450 0.000 Investor protection, CG 0.115 0.017 0.103 6.615 0.000
Social & Human Environment 0.150 0.015 0.164 9.987 0.000
Business culture & opportunities 0.212 0.020 0.206 10.368 0.000
Source: Author´s compilation
The regression model may be written as:
𝑦 = −3,416 + 0,076 ∗ 𝑥1 + 0,451 ∗ 𝑥2 + 0,046 ∗ 𝑥3 + 0,115 ∗ 𝑥4 + 0,150 ∗ 𝑥5 + 0,212 ∗ 𝑥6 (1)
The function of the regression model is then used to determine the future attractiveness of
the country in the area of the PE capital. We compare the resulting score estimated by the
regression model with the predicted score according to the PE annual report of the global
attractiveness index. We will also evaluate the resulting score in relation to the score that the
country achieved in the Global Competitiveness Index for 2017/2018. The Global
Competitiveness Index assesses the ability of countries to achieve sustainable economic growth
in the medium term horizon, thereby ensuring a high level of prosperity for the country citizens.
It integrates macroeconomic and microeconomic business aspects of competitiveness and links
them into one index. It analyses the level of public institutions, infrastructure, macroeconomic
stability, population health and basic education, higher education and training, efficiency of the
goods market, labour market efficiency, financial market maturity, technological readiness,
market size, business process excellence and innovation level. The index is published annually
by the World Economic Forum and evaluates 144 countries. The resulting country score can
range from 1, which is minimal competitiveness to 7, which represents maximum
competitiveness. The final comparison of all mentioned methods is depicted in the Table 8.
Table 8: Comparison of the regression model with other global indices
Country Slovakia Czech Republic
Hungary Poland
Regression model Abs. 48.3 63.7 55.6 73 Rel. 48.3 % 63.7 % 55.6 % 73 %
VPCE index Abs. 50.5 65.7 57.7 72.4
Rel. 50.5 % 65.7 % 57.7 % 72.4 %
Competitiveness index Abs. 4.33 4.77 4.33 4.59 Rel. 61.9 % 68.1 % 61.9 % 65.6 %
% difference between regression model and VPCE
-2.2 %
-2.0 %
-2.1 %
0.6 %
% difference between regression model and comp. index
-13.6 %
-4-4 %
-6.3 %
7.4 %
Source: Author´s compilation
To sum up, the results of the VCPE index measured by the formed regression model differ
only slightly from the values estimated by the country attractiveness index (the highest
difference is of 2.2 %), which confirms the formation of model with high prediction ability.
However, there are differences between indices of attractiveness and competitiveness, which
are larger for some countries, e.g. for Slovakia, where the difference of the VCPE index from
the regression model was 13.6% lower than the competitiveness index. For the remaining
countries, the difference was not as remarkable and did not exceed 10%. In all countries except
Poland, the ratio between attractiveness and competitiveness was lower in negative aspect to
the country attractiveness. However, Poland achieved a high position among the world selection
of countries in the attractiveness index, but it did not stand well in the Competitiveness Index.

Private Equity Market
of the Visegrad Group
Authors: Jozsef Popp et. al.
ISSN 1337-0839 (print) / 2585-7258 (online) 14
4. Discussion
Private equity, since its first explanation, has been a subject of many studies and object of
interest of many experts. Maula et al. (2005) concluded that private equity is the reason of the
extraordinary ability of the American economy to transform innovative ideas from university
and research laboratories into high growth companies. In the United States, and also in the UK,
after the Second World War, private equity was perceived as one of the means of economic
recovery and as a defensive tool before the economic recession (Lerner et al., 2012). Both
governments started to be engaged in the support of private equity funds. On the contrary, the
role of private equity capital in Central and Eastern Europe was different from that played in
developed market economies. Private equity only helped to develop globally as a very specific
financial instrument used in industries. The immaturity of the private equity market in the CEE
was declared by a small number of PE investors focusing on companies in high tech sectors,
stated by Kislingerova & Novy (2005). The development of the PE markets in the CEE region
was described by other authors, e.g. Filatotchev et al. (1996), and Karsai et al. (1999) who
followed the investment decisions of regional investors compared to those operating on global
markets. They also analysed the characteristics of CEE markets and their main barriers. It was
proved that although the markets have some common features in the area of investment, the
greater risk of the region lies in the understanding of investment trends and the fact that market
development requires higher quality projects and wider possibility of disinvestment. Gregorova
(2007) in her review claims that only a small number of companies in the region get capital in
the early stages of their development, which may explain the poor quality of the projects and
the lack of infrastructure for the specified transactions. Another barrier is the small number of
informal investors, according to Szerb et al. (2007). Groh & Liechtenstein (2009) studied the
attractiveness of CEE countries for PE investors. Their study is based on questionnaires
addressed to institutional investors. They tried to find out the importance of the investment
criteria of the development markets, leading to a ranking of the attractiveness of developing
countries for PE investors. The study showed that CEE countries are less attractive than the
EU-15 average. In this region, investors are attracted by low corporate tax rates, but discouraged
by their low liquidity on national capital markets.
The situation in the CEE region, especially in the countries of the Visegrad group, in the area
of PE capital was the main aim of the research of the paper. The private equity investments in
the V4 countries reached more than 60% share on the PE investments in Central and Eastern
Europe in 2017. However, Slovakia has the smallest share of V4 countries. It was founded, that
Slovakia is behind in the volume of PE investments mainly due to a lack of investment in
management buy-outs. However, the most important aim was to identify the influence factors
of the PE capital, which was done using the results of the correlation and regression analysis in
which we processed data from the country attractiveness index in the area of private equity.
Based on the results, two most influential factors affecting the country attractiveness index are
the depth of the capital market and business culture and business opportunities. The formed
regression model help predict the attractiveness of the country for PE investors and the
comparative analysis proved perfect prediction ability of the regression model.
References
Achleitner, A.K., Kloeckner, O. (2005). Employment Contribution of Private Equity and Venture Capital in
Europe. Výskumná správa. Mníchov, Germany: Technische Universität München.
Burdel, S. (2009). Private Equity Secondaries: Opening the Liquidity Tap. Thunderbird International Business
Review, 51(6), 533-537.

Ekonomicko-manazerske spektrum
2018, Volume XII, Issue 1, pp. 1-15
15 ISSN 1337-0839 (print) / 2585-7258 (online)
Bygrave, W.D. & Timmons, J.A. (1986). Venture Capital’s Role in Financing Innovation for Economic Growth.
Journal of Business Venturing, 1(2), 161-176.
Diaconu, M. (2012). Characteristics and Drivers of Venture Capital Investments Activity in Romania. Theoretical
and Applied Economics, 19(7), 93-114.
Dvorak, I. & Prochazka, P. (1998). Rizikový a Rozvojový Kapitál. Venture Capital. Praha, Česká republika:
Management Press.
EVCA (2007). Central and Eastern Europe Statistics 2006. EVCA Special Paper. [online]. [cited 11. August
2017]. Available on the internet: <https://bit.ly/2HSaNb6>
EVCA (2017). 2016 European Private Equity Activity [online]. 2017. [cited 11. August 2017]. Available on the
internet: <https://bit.ly/2uJjEEn>
Filatotchev, I. et al. (1996). Corporate Restructuring in Russian Privatizations: Implications for US Investors.
California Management Review, 37(2), 87- 100.
Fryges, H. & Wright, M. (2014). The Origin of Spin-offs: A Typology of Corporate and Academic Spin-Offs.
Small Business Economics, 43(2), 245-259.
Gervasoni, A. & Sattin, F.L. (2006). Private Equity e Venture Capital: Mauale di Investimento Nel Capitale
Rischio. 3. Vydanie, Miláno, Italy: Edizioni Angelo Guerinin e Associati.
Gregorova, L. (2007). The Knowledge-Based Economy in Central and Eastern Europe (Countries and Industries
in a Process of Change). Politická ekonomie, 55(2), 278-281.
Groh, A.P. & Liechtenstein, H. (2009). How Attractive is Central Eastern Europe for Risk Capital Investors?
Journal of International Money and Finance, 27(4), 625-647.
Isaksson, A. et al. (2004). Institutional Theory and Contracting in Venture Capital: The Swedish Experience.
Venture Capital, 6(1), 47-71.
Kaplan, S.N. & Stromberg. P. (2009). Leveraged Buy-Outs and Private Equity. Journal of Economics
Perspectives, 23(1), 121-146.
Karsai, J. et al. (1999). Transition and Active Investors: Venture Capital in Hungary, Poland and Slovakia. Post-
communist Economies, 9(1), 27-46.
Kislingerova, E. & Novy, I. (2005). Chování Podniku v Globalizujícím se Prostředí. Praha, Česká republika: C.
H. Beck.
Kortum, S. & Lerner, J. (2000). Assessing the Contribution of Venture Capital to Innovation. RAND Journal of
Economics, 31(4), 674-692.
Leeds, R. (2015). Private Equity Investing in Emerging Markets. Basingstoke, Great Britain: Palgrave Macmillan.
Lerner, J., Leamon, A. & Hardymon, F. (2012). Venture Capital, Private Equity, and the Financing of
Entrepreneurship. Hoboken, New Jersey: Wiley.
Link, A.N., Ruhm, C.J. & Siegel D.S. (2013). Private Equity and the Innovation Strategies of Entrepreneurial
Firms: Empirical Evidence from the Small Business Innovation Research Program. Managerial and Decision
Economics, 35(2), 103-113.
Mason, C.M. & Harrison, R.T. (1999). Venture Capital: Rationale, Aims and Scope. Venture Capital, 1(1), 1-46.
Maula, M., Autio, E. & MURRAY, G. (2005). Corporate Venture Capitalists and Independent Venture Capitalists:
What Do They Know, Who Do They Know and Should Entrepreneurs Care? Corporate Entrepreneurship and
Venturing, 10(1), 101-126.
Nyvltova, R. & Reznakova, M. 2007. Mezinárodní Kapitálové Trhy Jako Zdroj Financování. Praha: Grada
Publishing.
Sharp, W., Alexander, G.J. & Bailey, J.V. (1994). Investments. Englewood Cliffs: Prentice Hall.
Stowell, D.P. (2018). Investment Banks, Hedge Funds, and Private Equity. London, Great Britain: Academic Press
Ltd.
Szerb, L., Rappai, G., Makra, Z. & Terjesen, S. (2007). Informal Investment in Transition Economies: Individual
Characteristics and Clusters. Small Business Economics, 28(2), 257-271.
Veber, J. (2008). Podnikání Malé a Střední Firmy. Praha, Česká republika: Grada Publishing, a. s.