Principles of Transmission and Detection of Digital Signals · Principles of Transmission and...
30
0 Principles of Transmission and Detection of Digital Signals Asrar Ul Haq Sheikh King Fahd University of Petroleum & Minerals Saudi Arabia 1. Introduction The subject of digital communications pertains to transmission and reception of digital signals. The transmitter functions include periodically choosing a signal out of many possible, converting it into a waveform that suits the transmission media followed by its transmission. The functions of the receiver include reception of the transmitted signals, processing them using the statistical properties of the received waveforms and making decisions to recover the information signals with minimum probability of error. Because of its extensive use of probability and random processes, the study of digital communication is quite abstract. The performance of digital communication heavily depends on the way the transmission medium affects the transmitted waveforms. The transmission medium alters the signal waveforms during their passage through it, therefore signal waveforms must be designed so that these are least affected by the propagation medium and are easier to detect and reproduce the information signal with a minimum probability of error. It can be safely stated that formatting the information signals (operations at the transmitter) and making decisions at the receiver are mainly determined by the affect of the channel on the transmitted waveforms. In order to establish principles of signal transmission and its detection, we begin with the simplest of scenarios where the channel adds noise to the transmitted signal but does not alter the waveform; this type of channel is known as additive Gaussian noise (AWGN) channel. The principles thus established are later used to study the performances of several digital communication systems operating over channels that fade and disperse the signal waveforms. The channels may also be contaminated by interference - intelligent or otherwise. It is interesting to note that the telegraphic system introduced in 1844 was an example of digital communication. The long distance telegraphy across Atlantic started in 1866. The search for a suitable code (signal design) to send digital signals resulted in Baudot code in 1875, which interestingly found application many decades later when teletypewriter was invented. After this, the status of digital communication did not make much progress primarily due to the invention of telephone, an analog device, by A. G. Bell in 1876. This invention led to rapid progress in analog communications with analog voice as the primary application until revival of digital communications in 1960 when IBM proposed an eight bit characters code called EBCDIC code; though in 1963 this code lost the standardization battle to a 7-bit code with an alphabet size of 128 characters called American Standard Code for Information Interchange (ASCII). Further improvement took place when ANSI Standard X3.16 introduced in 1976 and CCITT Standard V.4 added an additional bit as a "Parity Check" 1 www.intechopen.com
Transcript of Principles of Transmission and Detection of Digital Signals · Principles of Transmission and...
0
Principles of Transmission andDetection of Digital Signals
Asrar Ul Haq SheikhKing Fahd University of Petroleum & Minerals
Saudi Arabia
1. Introduction
The subject of digital communications pertains to transmission and reception of digitalsignals. The transmitter functions include periodically choosing a signal out of many possible,converting it into a waveform that suits the transmission media followed by its transmission.The functions of the receiver include reception of the transmitted signals, processing themusing the statistical properties of the received waveforms and making decisions to recoverthe information signals with minimum probability of error. Because of its extensive use ofprobability and random processes, the study of digital communication is quite abstract.
The performance of digital communication heavily depends on the way the transmissionmedium affects the transmitted waveforms. The transmission medium alters the signalwaveforms during their passage through it, therefore signal waveforms must be designed sothat these are least affected by the propagation medium and are easier to detect and reproducethe information signal with a minimum probability of error. It can be safely stated thatformatting the information signals (operations at the transmitter) and making decisions atthe receiver are mainly determined by the affect of the channel on the transmitted waveforms.In order to establish principles of signal transmission and its detection, we begin with thesimplest of scenarios where the channel adds noise to the transmitted signal but does not alterthe waveform; this type of channel is known as additive Gaussian noise (AWGN) channel.The principles thus established are later used to study the performances of several digitalcommunication systems operating over channels that fade and disperse the signal waveforms.The channels may also be contaminated by interference - intelligent or otherwise.
It is interesting to note that the telegraphic system introduced in 1844 was an example ofdigital communication. The long distance telegraphy across Atlantic started in 1866. Thesearch for a suitable code (signal design) to send digital signals resulted in Baudot code in1875, which interestingly found application many decades later when teletypewriter wasinvented. After this, the status of digital communication did not make much progressprimarily due to the invention of telephone, an analog device, by A. G. Bell in 1876. Thisinvention led to rapid progress in analog communications with analog voice as the primaryapplication until revival of digital communications in 1960 when IBM proposed an eightbit characters code called EBCDIC code; though in 1963 this code lost the standardizationbattle to a 7-bit code with an alphabet size of 128 characters called American Standard Codefor Information Interchange (ASCII). Further improvement took place when ANSI StandardX3.16 introduced in 1976 and CCITT Standard V.4 added an additional bit as a "Parity Check"
1
www.intechopen.com
2 Will-be-set-by-IN-TECH
bit. These inventions were great but the problem that remained was non-availability of anefficient system which is able to convert analog waveforms into digitally encoded signals,although concepts of sampling and encoding were well established as far back as 1937 whenReeves conceived the so called pulse code modulation (PCM) [Reeves (1937)]. During the1960s, the telecommunication network hierarchy for voice communications was defined onthe basis of 64 kbits/sec pulse code modulation (PCM). The invention of high speed solidstate switching devices in 1970 followed by development of very large scale integrated (VLSI)circuits resulted in early emergence of digital revolution. Though the TDMA was extensivelyused over wired network, its introduction into wireless public network in 1992 resulted inan explosive growth of digital communications. Currently, digital signaling is ubiquitous inmodern communication systems.
2. Digital signal transmission and detection
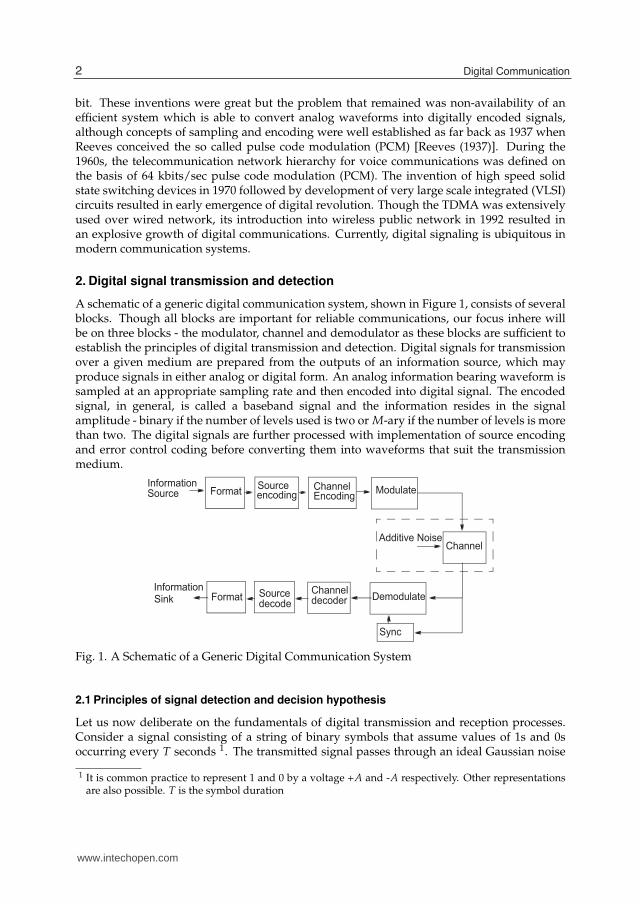
A schematic of a generic digital communication system, shown in Figure 1, consists of severalblocks. Though all blocks are important for reliable communications, our focus inhere willbe on three blocks - the modulator, channel and demodulator as these blocks are sufficient toestablish the principles of digital transmission and detection. Digital signals for transmissionover a given medium are prepared from the outputs of an information source, which mayproduce signals in either analog or digital form. An analog information bearing waveform issampled at an appropriate sampling rate and then encoded into digital signal. The encodedsignal, in general, is called a baseband signal and the information resides in the signalamplitude - binary if the number of levels used is two or M-ary if the number of levels is morethan two. The digital signals are further processed with implementation of source encodingand error control coding before converting them into waveforms that suit the transmissionmedium.
Fig. 1. A Schematic of a Generic Digital Communication System
2.1 Principles of signal detection and decision hypothesis
Let us now deliberate on the fundamentals of digital transmission and reception processes.Consider a signal consisting of a string of binary symbols that assume values of 1s and 0soccurring every T seconds 1. The transmitted signal passes through an ideal Gaussian noise
1 It is common practice to represent 1 and 0 by a voltage +A and -A respectively. Other representationsare also possible. T is the symbol duration
2 Digital Communication
www.intechopen.com
Principles of Transmission and Detection of Digital Signals 3
channel having a bandwidth at least equal to the signal bandwidth. The signal received at thereceiver is a replica of the transmitted signal scaled by the propagation loss and accompanied
by additive white Gaussian noise (AWGN) having a two sided power spectral density No2 . The
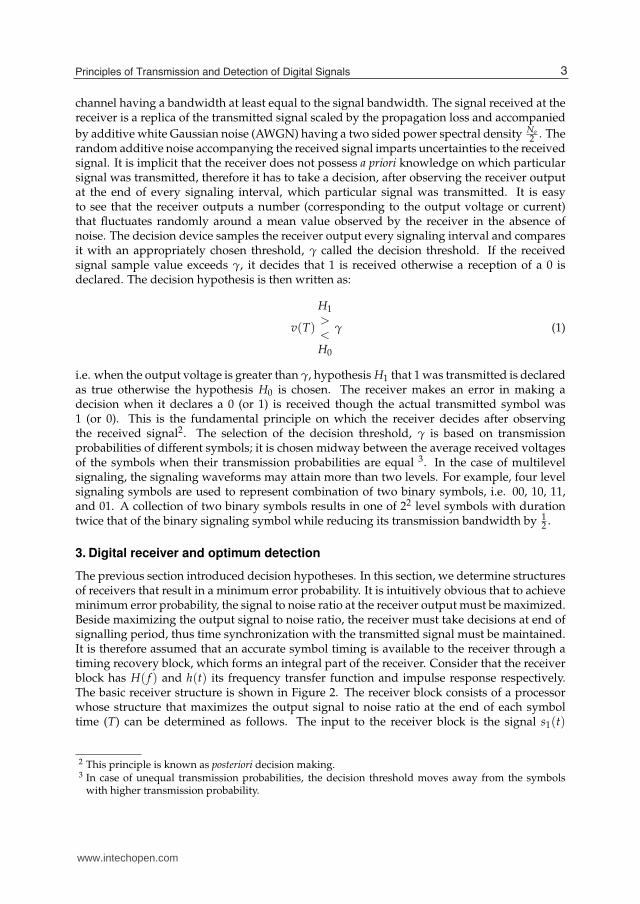
random additive noise accompanying the received signal imparts uncertainties to the receivedsignal. It is implicit that the receiver does not possess a priori knowledge on which particularsignal was transmitted, therefore it has to take a decision, after observing the receiver outputat the end of every signaling interval, which particular signal was transmitted. It is easyto see that the receiver outputs a number (corresponding to the output voltage or current)that fluctuates randomly around a mean value observed by the receiver in the absence ofnoise. The decision device samples the receiver output every signaling interval and comparesit with an appropriately chosen threshold, γ called the decision threshold. If the receivedsignal sample value exceeds γ, it decides that 1 is received otherwise a reception of a 0 isdeclared. The decision hypothesis is then written as:
v(T)
H1
>
<
H0
γ (1)
i.e. when the output voltage is greater than γ, hypothesis H1 that 1 was transmitted is declaredas true otherwise the hypothesis H0 is chosen. The receiver makes an error in making adecision when it declares a 0 (or 1) is received though the actual transmitted symbol was1 (or 0). This is the fundamental principle on which the receiver decides after observingthe received signal2. The selection of the decision threshold, γ is based on transmissionprobabilities of different symbols; it is chosen midway between the average received voltagesof the symbols when their transmission probabilities are equal 3. In the case of multilevelsignaling, the signaling waveforms may attain more than two levels. For example, four levelsignaling symbols are used to represent combination of two binary symbols, i.e. 00, 10, 11,and 01. A collection of two binary symbols results in one of 22 level symbols with durationtwice that of the binary signaling symbol while reducing its transmission bandwidth by 1
2 .
3. Digital receiver and optimum detection
The previous section introduced decision hypotheses. In this section, we determine structuresof receivers that result in a minimum error probability. It is intuitively obvious that to achieveminimum error probability, the signal to noise ratio at the receiver output must be maximized.Beside maximizing the output signal to noise ratio, the receiver must take decisions at end ofsignalling period, thus time synchronization with the transmitted signal must be maintained.It is therefore assumed that an accurate symbol timing is available to the receiver through atiming recovery block, which forms an integral part of the receiver. Consider that the receiverblock has H( f ) and h(t) its frequency transfer function and impulse response respectively.The basic receiver structure is shown in Figure 2. The receiver block consists of a processorwhose structure that maximizes the output signal to noise ratio at the end of each symboltime (T) can be determined as follows. The input to the receiver block is the signal s1(t)
2 This principle is known as posteriori decision making.3 In case of unequal transmission probabilities, the decision threshold moves away from the symbols
with higher transmission probability.
3Principles of Transmission and Detection of Digital Signals
www.intechopen.com
4 Will-be-set-by-IN-TECH
Threshold Comparison Decision
Z(T)si(t) + n(t)
Threshold = �Z(T)
H1
H2
�
Decision Rule:
Filter
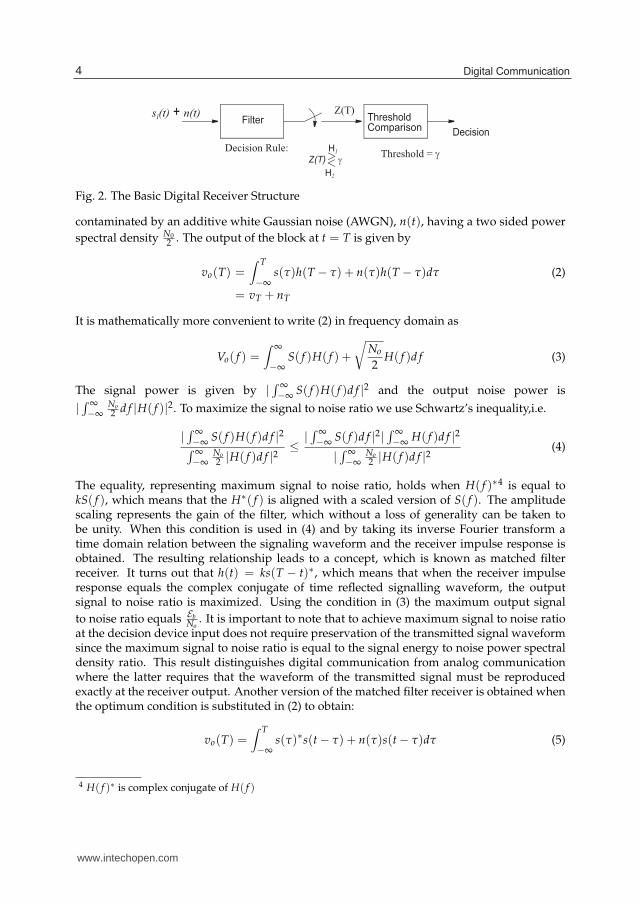
Fig. 2. The Basic Digital Receiver Structure
contaminated by an additive white Gaussian noise (AWGN), n(t), having a two sided power
spectral density N02 . The output of the block at t = T is given by
vo(T) =∫ T
−∞s(τ)h(T − τ) + n(τ)h(T − τ)dτ (2)
= vT + nT
It is mathematically more convenient to write (2) in frequency domain as
Vo( f ) =∫ ∞
−∞S( f )H( f ) +
√
No
2H( f )d f (3)
The signal power is given by |∫ ∞
−∞S( f )H( f )d f |2 and the output noise power is
|∫ ∞
−∞No2 d f |H( f )|2. To maximize the signal to noise ratio we use Schwartz’s inequality,i.e.
|∫ ∞
−∞S( f )H( f )d f |2
∫ ∞
−∞No2 |H( f )d f |2
≤|∫ ∞
−∞S( f )d f |2|
∫ ∞
−∞H( f )d f |2
|∫ ∞
−∞No2 |H( f )d f |2
(4)
The equality, representing maximum signal to noise ratio, holds when H( f )∗4 is equal tokS( f ), which means that the H∗( f ) is aligned with a scaled version of S( f ). The amplitudescaling represents the gain of the filter, which without a loss of generality can be taken tobe unity. When this condition is used in (4) and by taking its inverse Fourier transform atime domain relation between the signaling waveform and the receiver impulse response isobtained. The resulting relationship leads to a concept, which is known as matched filterreceiver. It turns out that h(t) = ks(T − t)∗, which means that when the receiver impulseresponse equals the complex conjugate of time reflected signalling waveform, the outputsignal to noise ratio is maximized. Using the condition in (3) the maximum output signal
to noise ratio equals EbNo
. It is important to note that to achieve maximum signal to noise ratioat the decision device input does not require preservation of the transmitted signal waveformsince the maximum signal to noise ratio is equal to the signal energy to noise power spectraldensity ratio. This result distinguishes digital communication from analog communicationwhere the latter requires that the waveform of the transmitted signal must be reproducedexactly at the receiver output. Another version of the matched filter receiver is obtained whenthe optimum condition is substituted in (2) to obtain:
vo(T) =∫ T
−∞s(τ)∗s(t − τ) + n(τ)s(t − τ)dτ (5)
4 H( f )∗ is complex conjugate of H( f )
4 Digital Communication
www.intechopen.com

Principles of Transmission and Detection of Digital Signals 5
Equation (5) give an alternate receiver structure, which also delivers optimum decisions. Thecorrelation receiver as it is called is shown in Figure 3. The two optimum structures definedabove can be used for any signaling format.
An important question that remains relates to measure of digital communication performance.The probability of making an incorrect decision (probability of error), Pe, is a universallyaccepted performance measure of digital communication. Consider a long string of binarydata symbols consisting of 1s and 0s contaminated by AWGN is received by the receiver. Theinput to the decision device is then a random process with a mean equal to s1 = vs, s2 = −vs
depending whether the transmitted signal was 1 or 0 and its distribution is Gaussian becauseof the presence of AWGN. The conditional error probability is then determined by finding thearea under the probability density curve from −∞ to γ when a 1 is transmitted and from γ to∞ when a 0 is transmitted as shown in Figure 4. The error probability is then given by
s(t)
INTOutput data
Decision
T
T
Input
signal
Fig. 3. The Digital Correlation Receiver
P(e) = P(1)P(e|1) + P(0)P(e|0) (6)
where P(e|1) and P(e|0) are respectively given as
P(e|1) =∫ γ
−∞
1√2π
exp
(
− (x − vs1)2
2σ2
)
dx (7)
P(e|0) =∫ ∞
γ
1√2π
exp
(
− (x − vs0)2
2σ2
)
dx
Equations (7) are called as likelihood conditioned on a particular transmitted signal. It isquite clear that for M-ary signaling, there will be M such likelihoods and average probabilityof error is obtained by de-conditioning these likelihoods. The integrals in (7) do not haveclosed form solution and their numerical solutions are tabulated in the form of Q(.) orcomplementary error functions er f c(.). The Q(.) is defined as
Q(z) =1√2π
∫ ∞
zexp(− x2
2)dx (8)
The er f c(.) is related to er f (.) and Q(.) as
er f (z) =2√π
∫ z
0exp(−t2)dt = 1 − 2Q(2
√z)
er f c(z) = 1 − er f (z) =2√π
∫ ∞
zexp(−t2)dt = 2Q(2
√z) (9)
5Principles of Transmission and Detection of Digital Signals
www.intechopen.com
6 Will-be-set-by-IN-TECH
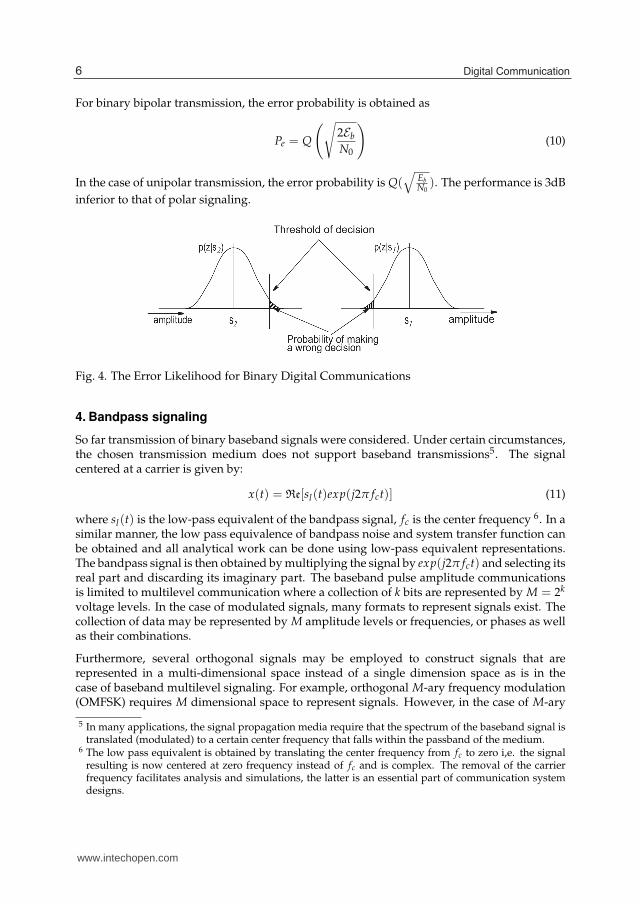
For binary bipolar transmission, the error probability is obtained as
Pe = Q
(√
2Eb
N0
)
(10)
In the case of unipolar transmission, the error probability is Q(√
EbN0
). The performance is 3dB
inferior to that of polar signaling.
Fig. 4. The Error Likelihood for Binary Digital Communications
4. Bandpass signaling
So far transmission of binary baseband signals were considered. Under certain circumstances,the chosen transmission medium does not support baseband transmissions5. The signalcentered at a carrier is given by:
x(t) = Re[sl(t)exp(j2π fct)] (11)
where sl(t) is the low-pass equivalent of the bandpass signal, fc is the center frequency 6. In asimilar manner, the low pass equivalence of bandpass noise and system transfer function canbe obtained and all analytical work can be done using low-pass equivalent representations.The bandpass signal is then obtained by multiplying the signal by exp(j2π fct) and selecting itsreal part and discarding its imaginary part. The baseband pulse amplitude communicationsis limited to multilevel communication where a collection of k bits are represented by M = 2k
voltage levels. In the case of modulated signals, many formats to represent signals exist. Thecollection of data may be represented by M amplitude levels or frequencies, or phases as wellas their combinations.
Furthermore, several orthogonal signals may be employed to construct signals that arerepresented in a multi-dimensional space instead of a single dimension space as is in thecase of baseband multilevel signaling. For example, orthogonal M-ary frequency modulation(OMFSK) requires M dimensional space to represent signals. However, in the case of M-ary
5 In many applications, the signal propagation media require that the spectrum of the baseband signal istranslated (modulated) to a certain center frequency that falls within the passband of the medium.
6 The low pass equivalent is obtained by translating the center frequency from fc to zero i,e. the signalresulting is now centered at zero frequency instead of fc and is complex. The removal of the carrierfrequency facilitates analysis and simulations, the latter is an essential part of communication systemdesigns.
6 Digital Communication
www.intechopen.com

Principles of Transmission and Detection of Digital Signals 7
phase shift keying (MPSK), two dimensional space is sufficient. The signal design nowpertains to locating the signal points in the signal space on the basis of transmission requiringminimum signal power (or energy) and ease of detection. Though the signals are located ina multi-dimensional space, the principle of estimating the error probability in the presence ofGaussian noise described earlier remains unaltered.
4.1 Error performance of binary signalling
For binary bandpass signalling, the general form of the transmitted signal is given as:
s(t) = A(t) cos(2π fot + φ(t)) (12)
The principles established to evaluate BER for baseband signalling can be directly applied tothe bandpass signalling. For example, for different signalling formats, the transmit signal maybe written as
For BASK, si(t) =
√
2Ei(t)
Tcos(2π f0t + φ), i = 0, 1, 0 ≤ t ≤ T,
For BPSK, si(t) =
√
2ET
cos(2π fot + φi(t)), i = 0, 1, 0 ≤ t ≤ T,
For BFSK, si(t) =
√
2ET
cos(2π fit + φ(t)), i = 0, 1, 0 ≤ t ≤ T, (13)
To calculate the probability of error, the output for coherent detection of BPSK is given by√
2ET cos(2π fot) for 0 ≤ t ≤ T plus Gaussian noise. The threshold is located at 0, for which
the error probability is written as Q(√
2ENo
). It is interesting to note that the error probability
may also be written in terms of the Euclidean distance between the signal points in the signal
space, i.e. Q(√
d1,2
No). Following a similar procedure, the BER for BASK and BFSK are given as:
P2 = Q
(√
ENo
)
,for coherent amplitude detection
P2 =1
2exp
(
− E2No
)
,for coherent frequency detection (14)
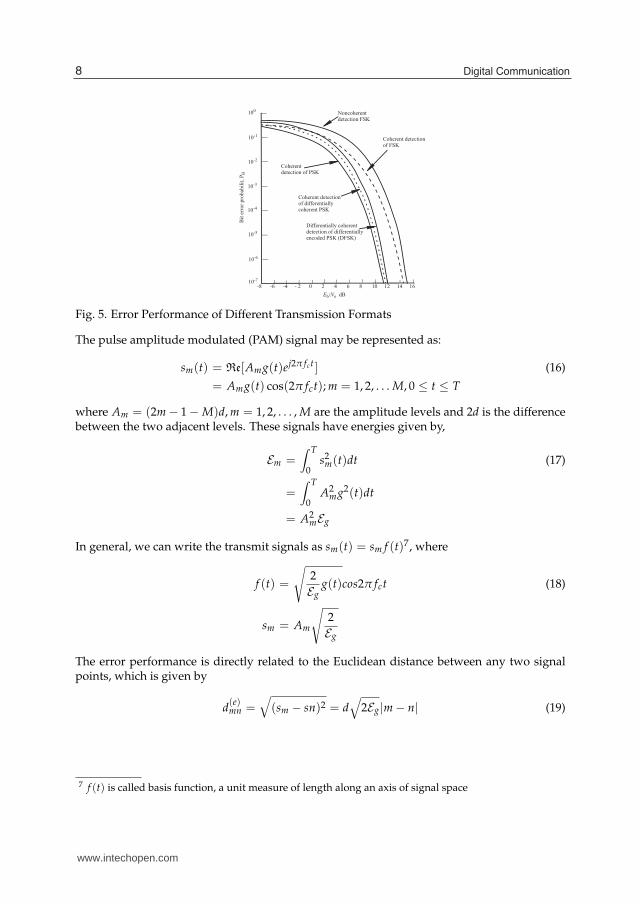
On inspection, we note that the bipolar BASK is similar to BPSK, therefore its BERperformance is also be the same. We can extend the BPSK to quadrature phase shift keyingwhere two quadrature carriers are modulated by information signals. It can be shown thatthe probability of error for QPSK is identical to that of BPSK [Sklar (1988)]. Figure 5 showscomparison of BER of several binary transmission schemes.
4.2 Error performance of M-ary signalling
The procedures of finding error probabilities of binary bandpass signalling can easily beextended to M-ary signalling. This section derives symbol error probabilities for severalM-ary bandpass signaling. In general, the M-ary bandpass signals are represented as:
si(t) = Ai
√
2
Tg(t) cos(ωit) (15)
7Principles of Transmission and Detection of Digital Signals
www.intechopen.com
8 Will-be-set-by-IN-TECH
-8 -6 -4 - 2 0 2 4 6 8 10 12 14 16
100
10-1
10-2
10-3
10-4
10-5
10-6
10-7
Noncoherentdetection FSK
Coherent detectionof FSK
Coherent detection of PSK
Coherent detectionof differentially coherent PSK
Differentially coherentdetection of differentiallyencoded PSK (DFSK)
Eb/No dB
Bit
err
or
pro
bab
ilit
, P
B
Fig. 5. Error Performance of Different Transmission Formats
The pulse amplitude modulated (PAM) signal may be represented as:
sm(t) = Re[Amg(t)ej2π fct] (16)
= Amg(t) cos(2π fct); m = 1, 2, . . . M, 0 ≤ t ≤ T
where Am = (2m − 1 − M)d, m = 1, 2, . . . , M are the amplitude levels and 2d is the differencebetween the two adjacent levels. These signals have energies given by,
Em =∫ T
0s2
m(t)dt (17)
=∫ T
0A2
mg2(t)dt
= A2mEg
In general, we can write the transmit signals as sm(t) = sm f (t)7, where
f (t) =
√
2
Egg(t)cos2π fct (18)
sm = Am
√
2
Eg
The error performance is directly related to the Euclidean distance between any two signalpoints, which is given by
d(e)mn =
√
(sm − sn)2 = d√
2Eg|m − n| (19)
7 f (t) is called basis function, a unit measure of length along an axis of signal space
8 Digital Communication
www.intechopen.com
Principles of Transmission and Detection of Digital Signals 9
and the minimum distance that results in worst error performance is obviously important and
is equal to d
√
Eg
2 . The error probability for Pulse Amplitude Modulation (PAM) is written as:
PM =
(
M − 1
M
)
Pr
(
|r − sm| ≥ d
√
Eg
2
)
(20)
= 2
(
M − 1
M
)
Q
⎛
⎝d
√
Eg
No
⎞
⎠
The multi-level phase shift keying (MPSK) modulated signals is written as
sm(t) = Re
[
g(t)exp
(
j2π(m − 1)
M
)
exp(j2π fct)
]
, m = 1, 2, . . . , M, 0 ≤ t ≤ T (21)
= g(t) cos
(
2π fct +2π(m − 1)
M
)
= g(t) cos
[
2π(m − 1)
M
]
cos(2π fct)− g(t) sin
[
2π(m − 1)
M
]
sin(2π fct)
where M is the number of phases and each phase represents one symbol representing k bits.The Euclidean distance between the signal points is
d(e)mn =
√
Eg[1 − cos(2π(m − n)
M)] (22)
with minimum error distance of
d(e)min =
√
Eg[1 − cos(2π
M)] (23)
The expression for MPSK error performance is given by [Proakis & Salehi (2008)]
Pe =2
log2 MQ
(
sinπ
M
√
2Eblog2 M
No
)
(24)
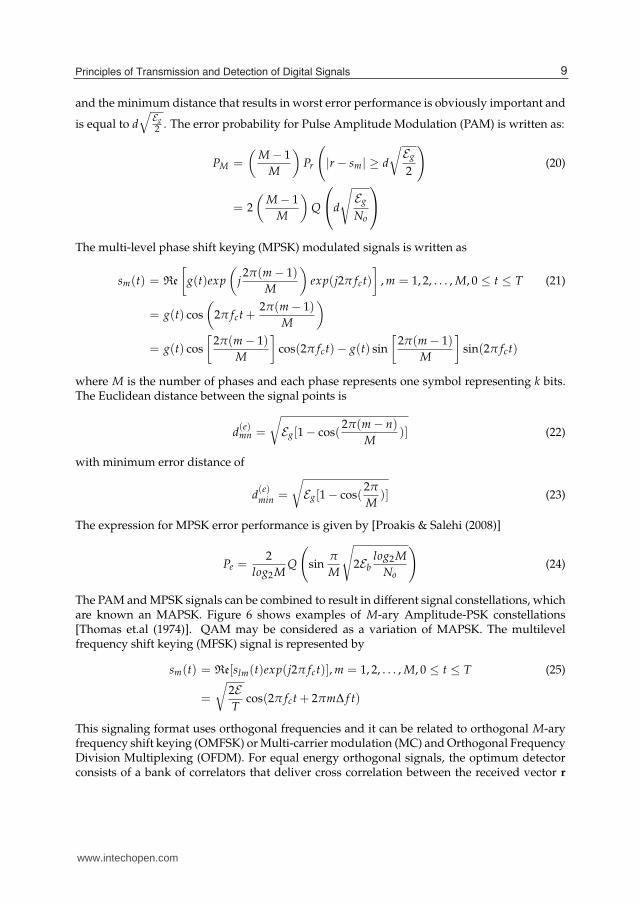
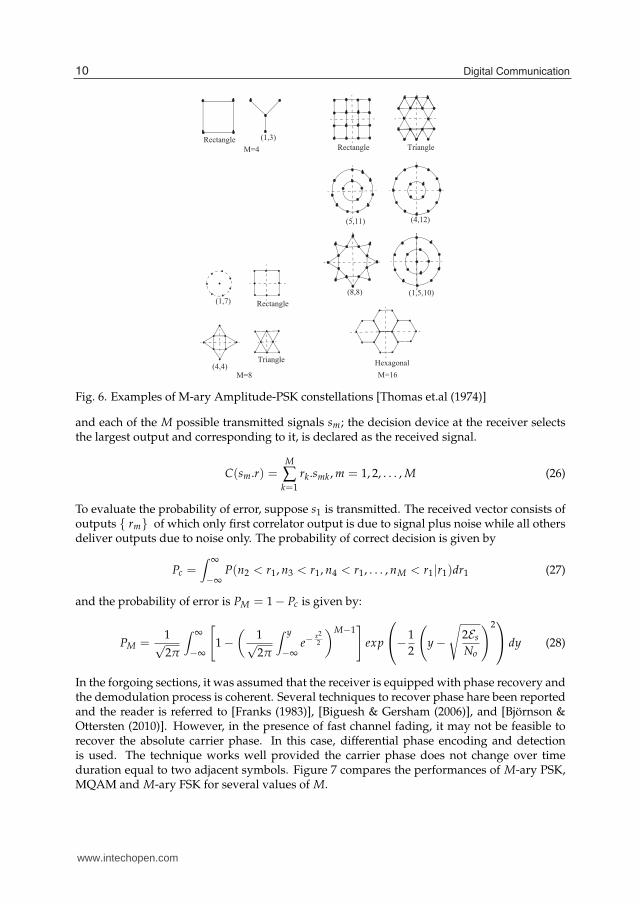
The PAM and MPSK signals can be combined to result in different signal constellations, whichare known an MAPSK. Figure 6 shows examples of M-ary Amplitude-PSK constellations[Thomas et.al (1974)]. QAM may be considered as a variation of MAPSK. The multilevelfrequency shift keying (MFSK) signal is represented by
sm(t) = Re[slm(t)exp(j2π fct)], m = 1, 2, . . . , M, 0 ≤ t ≤ T (25)
=
√
2ET
cos(2π fct + 2πmΔ f t)
This signaling format uses orthogonal frequencies and it can be related to orthogonal M-aryfrequency shift keying (OMFSK) or Multi-carrier modulation (MC) and Orthogonal FrequencyDivision Multiplexing (OFDM). For equal energy orthogonal signals, the optimum detectorconsists of a bank of correlators that deliver cross correlation between the received vector r
9Principles of Transmission and Detection of Digital Signals
www.intechopen.com
10 Will-be-set-by-IN-TECH
Rectangle
M=4
(1,3)
Rectangle Triangle
(5,11) (4,12)
(1,5,10)(8,8)
Hexagonal
(1,7) Rectangle
Triangle(4,4)
M=8 M=16
Fig. 6. Examples of M-ary Amplitude-PSK constellations [Thomas et.al (1974)]
and each of the M possible transmitted signals sm; the decision device at the receiver selectsthe largest output and corresponding to it, is declared as the received signal.
C(sm.r) =M
∑k=1
rk.smk, m = 1, 2, . . . , M (26)
To evaluate the probability of error, suppose s1 is transmitted. The received vector consists ofoutputs { rm} of which only first correlator output is due to signal plus noise while all othersdeliver outputs due to noise only. The probability of correct decision is given by
Pc =∫ ∞
−∞P(n2 < r1, n3 < r1, n4 < r1, . . . , nM < r1|r1)dr1 (27)
and the probability of error is PM = 1 − Pc is given by:
PM =1√2π
∫ ∞
−∞
[
1 −(
1√2π
∫ y
−∞e−
x2
2
)M−1]
exp
⎛
⎝−1
2
(
y −√
2Es
No
)2⎞
⎠ dy (28)
In the forgoing sections, it was assumed that the receiver is equipped with phase recovery andthe demodulation process is coherent. Several techniques to recover phase hare been reportedand the reader is referred to [Franks (1983)], [Biguesh & Gersham (2006)], and [Björnson &Ottersten (2010)]. However, in the presence of fast channel fading, it may not be feasible torecover the absolute carrier phase. In this case, differential phase encoding and detectionis used. The technique works well provided the carrier phase does not change over timeduration equal to two adjacent symbols. Figure 7 compares the performances of M-ary PSK,MQAM and M-ary FSK for several values of M.
10 Digital Communication
www.intechopen.com

Principles of Transmission and Detection of Digital Signals 11
M=2,4 M=8 M=16 M=32 M=64
100
10-1
10-2
10-3
10-4
10-5
10-6
10-7
5 10 15 20 25 30Eb/N0 dB
Pb
M=4096M=1024M=256M=64M=16M=4
M-QAMM-PSK
M=4
8
16
32
64
M=2
MFSK
Fig. 7. Comparison of performance of M-ary transmission systems
4.3 Performance evaluation in the presence of ISI
So far, we considered ideal AWGN channels without any bandwidth restriction but arecontaminated only by AWGN. A majority of channels that are found in real life haveadditional impairments, which range from bandwidth restriction to multipath propagation,interference as well as flat or frequency selective fading. When the channel bandwidthis equal to the signal transmission bandwidth, the transmission rate can be increased bytransmitting signals with controlled ISI. The ISI can be controlled with the use of partialresponse pulses; duo-binary or modified duo-binary signaling pulses are good examples. Forsignal detection two options are available. In the first, the receiver estimates ISI and subtractsit from the detected signal before taking a decision. The second is to pre-code the data prior totransmission. As far as data detection is concerned, sub-optimum symbol by symbol detectionor optimum maximum likelihood estimation (MLE) are possible. The performance is usuallygiven in terms of upper bound of symbol error probability. For MPAM, transmissions withcontrolled ISI, the performance is given by [Proakis & Salehi (2008)] as:
Pe < 2
(
1 − 1
M2
)
Q
(√
(π
4)2 6
M2 − 1
ENo
)
(29)
Due to considerable complexity of MLE, sub-optimum techniques of mitigating channelinduced ISI, another sub-optimum technique effective against ISI, called equalization is used.A number of structures and algorithms have been proposed in the literature, see for example,[Falconer et.al (2002)], [Proakis & Salehi (2008)].
4.4 Digital communication over fading channels
Time variability of signal amplitude, known as fading accruing due to terminal mobility isan important characteristic of wireless channels. The fading sometimes is accompanied byshadowing, whose effect is gradual but lasts longer. The probability of error under fadingor time varying conditions is obtained by first finding the conditional probability of error
at a certain selected value of the signal to noise ratio ( EbNo
) and then averaging it over thesignal variability statistics (fading and shadowing). A number of models have been used
11Principles of Transmission and Detection of Digital Signals
www.intechopen.com

12 Will-be-set-by-IN-TECH
to statistically describe fading and shadowing; Rayliegh being the most commonly used todescribe the fading signal envelope (amplitude) while the signal to noise ratio follows anexponential distribution. These distributions are given as:
Rayleigh Distribution, pR(r) =r
σ2exp
(
− r2
2σ2
)
Ricean Distribution, pR(r) =r
σ2exp
(
− r2 + Q2
2σ2
)
Io
(
rQ
σ2
)
(30)
where Q cos(2π fct) is the line of sight component accompanying the scattered component(waves) having a mean power σ2. Io(.) is the modified Bessel function of the first kind withindex zero. The Ricean distribution is generally defined in terms of Rice parameter K, the
ratio of direct (line of sight or specular component) to the scattered signal power i.e. K = Q2
2σ2 .A larger value of K implies a lower fading depth. The Rayleigh and Ricean distributioncan be explained by the underlying physics of the radio wave propagation. Recently, amore generalized fading model in the form of Nakagami distribution has been used sinceit emulates Rayleigh, Ricean and Log-normal distributions and it fits better the measurementresults. The reason why this model fits the results better lies in its two degrees of freedom.The Nakagami probability density function is given by:
pR(r) = 2( m
2Ω
)m 1
Γ(m)r2m−1exp
(
mr2
2σ2
)
(31)
where mean E[r], and standard deviation Ω are defined as:
E[r] = r =Γ(m + 1
2 )
Γ(m)
√
Ω
m(32)
Ω = 2(rΓ(m)
Γ(m + 12
)2 (33)
and Γ(m) is Gamma function defined as
Γ(m) =∫ ∞
0tm−1e−tdt, m > 0 (34)
The slow fading is modeled as log-normal distribution, which is defined as:
Lognormal fading, pR(r) =
{
1√2πσ(x−b)
exp( (−ln(r−b)−a)2
σ2 ), r > b
0, r > b(35)
This is valid for σ > 0, −∞ < a, b < ∞. The above mentioned concept is applied now toRayleigh distributed signal envelope. For example, the bit error probability for binary DPSKfor a signal to noise ratio of γ given in [Sheikh (2004)] is averaged over the statistics of γ as:
pDPSK−Fading =∫ ∞
0
1
2exp(−γ2)
1
Γexp(−γ
Γ)dγ (36)
12 Digital Communication
www.intechopen.com

Principles of Transmission and Detection of Digital Signals 13
This results in
P2 =1
2(1 + Γ)(37)
For non-coherent system, the probability of error for orthogonal FSK is
P2 =1
1 + 2Γ(38)
When the signal to noise ratio is large, the probabilities of error for different binary systems areinversely proportional to the average signal to noise ratio and in general given by 1
kΓ, where
k = 4, 2, 2 and 1 for coherent PSK, orthogonal FSK, DPSK and non-coherent orthogonal FSKrespectively.
4.4.1 Multilevel signaling in presence of fading
The probability of symbol error for M-ary modulation schemes operating in the presence ofRayleigh fading can be found using the standard procedure but it is computationally quiteintense [Simon & Alouni (2000)] as it involves integration of powers of Q-functions. A simplerway out is to seek tight bounds over the fading statistics. For details, the reader is referred to[Proakis & Salehi (2008)]. Some analytical results are still possible. For example, the symbolerror probability for MPSK operating over Nakagami fading channels, is given by:
Ps(e) =
(
M−1
M
)
⎧
⎨
⎩
1−√
sin2( πM )Γs
1+sin2( πM )Γs
(
M
(M−1)π
)
×
⎡
⎣
π
2+tan−1
⎛
⎝
√
sin2( πM )Γm
1 + sin2( πM )Γs
⎞
⎠cos(π
M)
⎤
⎦
⎫
⎬
⎭
To find the expression for symbol error rate probability for MFSK operating over Nakagamifading channel is quite involved and finding a tight upper bound for expression in integrationis preferred. Reference [Simon & Alouni (2000)] gives an upper bound on symbol errorprobability. In summary, the bit (binary signaling) or symbol (for M-ary signaling) errorprobabilities in general are found by first finding error probability conditioned on a chosensignal to noise ratio, γ, and then de-conditioning it by integrating over the statistics of γ.
4.5 Reliable communication over impaired channels
The previous sections laid foundations for evaluating the performance of digital transmissionsystems operating over noisy, static and fading channels. In this section, recognizing therelatively poorer performance in the presence of channel impairments, additional signalprocessing is needed to improve the performance. In this regard, the use of diversityis very effective. Beside fading, the communication channel may also exhibit frequencyselectivity, which accrues as a result of non-uniform amplitude or non-linear phase responseof the channel over the transmission bandwidth. These two important impairments result inconsiderable performance degradation of digital transmission systems. With increasing useof the Internet, reliable broadband communication is desirable but use of wider transmissionbandwidths for higher transmission rates bring into picture the channel frequency selectivity.In these circumstances, the (bit or symbol) error probability evaluation becomes complex andmany attempts to find a closed form solution have not succeeded and expressions for errorprobability bounds are usually derived.
13Principles of Transmission and Detection of Digital Signals
www.intechopen.com
14 Will-be-set-by-IN-TECH
4.6 Diversity techniques for time varying fading channels
The channel fading significantly degrades the performance of digital communication systems.Diversity reception implies use of more than one signal replicas with an aim to mitigate effectof fading and achieve higher average signal to noise ratio. For example, if the probability ofsignal replica fading below a threshold is p, then the probability of N independently fadingsignal replicas simultaneously falling below the same threshold will be pN . Fortunately, signalpassing through mutually independently fading paths results in multiple signal replicas.Independently fading signal replicas can be created in several ways e.g. by transmitting thesame signal at many frequencies separated by more than the channel’s coherence bandwidth,or receiving the signal at spatially different locations so that the received signals havenegligible correlation at these locations. The receiver may select a signal replica having thehighest signal to noise ratio (selection diversity) or combine replicas (diversity combining) toachieve higher signal to noise ratio. The process of obtaining signal replicas in this manner iscalled as explicit diversity.
Beside using explicit (antenna, frequency, polarization, etc.) diversity, implicit diversity isanother form of diversity, which is realized with transmission of signals occupying bandwidthmuch wider than the channel coherence bandwidth WT ≫ Wc. Spread spectrum signals aregood examples where implicit diversity is realized. In these systems, the receiver resolvesmultipath components of the received signal i.e. the replicas of the transmitted signals areformed after propagating through multipath channel. The number of paths can be manybut usually three to four are used in a typical system. The time resolution of the multipathcomponents is 1
WT, where WT is the transmission bandwidth. For a channel having Tm seconds
delay spread will resolve TmWTWc
paths. The receiver that resolves channel paths is called Rakereceiver.
4.6.1 Performance with diversity in the presence of rayleigh fading
We assume that there are L diversity branches or paths, each carrying the same informationsignal. The signal amplitude on each branch is assumed to fade slowly but independentlywith Rayleigh statistics. The signals on all diversity branches fade independently and areaccompanied by AWGN with the same power spectral density or variance. The low-passequivalent received signals on L-channels can be expressed in the form:
rlk(t) = αkejφk skm(t) + zk(t), k = 1, 2, . . . , L, m = 1, 2 (39)
where αkexp(jφk) represents the kth channel gain factors and phase shifts respectively, skm(t)denotes the mth signal transmitted on the kth channel, and zk(t) denotes the additive whiteGaussian noise on the kth channel. All signals in the set {skm(t)} have the same energyand noise variance. The optimum demodulator for the signal received from the kth channelconsists of two matched filters, one having the impulse response
bk1(t) = s∗k1(T − t) (40)
and the other having the response
bk2(t) = s∗k2(T − t) (41)
In the case of binary transmission sk1(t) = −sk2(t). Thus, binary PSK signalling requires asingle matched filter in each branch. The matched filters are followed by a combiner that
14 Digital Communication
www.intechopen.com
Principles of Transmission and Detection of Digital Signals 15
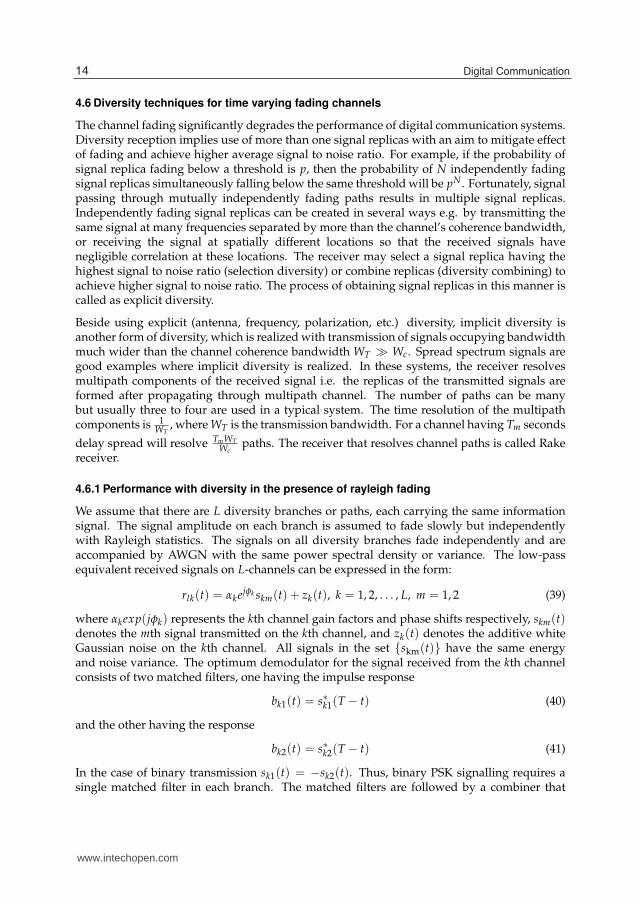
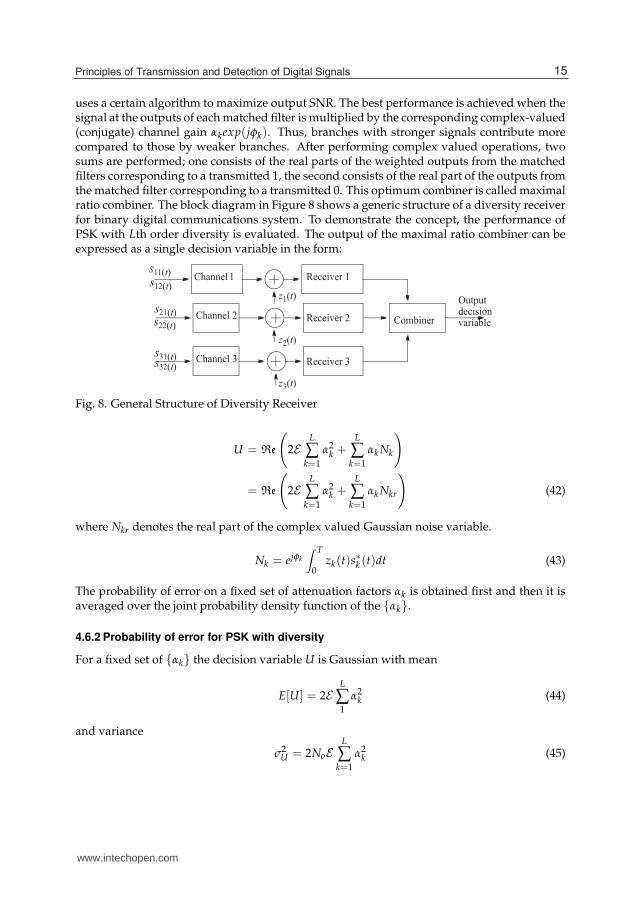
uses a certain algorithm to maximize output SNR. The best performance is achieved when thesignal at the outputs of each matched filter is multiplied by the corresponding complex-valued(conjugate) channel gain αkexp(jφk). Thus, branches with stronger signals contribute morecompared to those by weaker branches. After performing complex valued operations, twosums are performed; one consists of the real parts of the weighted outputs from the matchedfilters corresponding to a transmitted 1, the second consists of the real part of the outputs fromthe matched filter corresponding to a transmitted 0. This optimum combiner is called maximalratio combiner. The block diagram in Figure 8 shows a generic structure of a diversity receiverfor binary digital communications system. To demonstrate the concept, the performance ofPSK with Lth order diversity is evaluated. The output of the maximal ratio combiner can beexpressed as a single decision variable in the form:
Fig. 8. General Structure of Diversity Receiver
U = Re
(
2EL
∑k=1
α2k +
L
∑k=1
αk Nk
)
= Re
(
2EL
∑k=1
α2k +
L
∑k=1
αk Nkr
)
(42)
where Nkr denotes the real part of the complex valued Gaussian noise variable.
Nk = ejφk
∫ T
0zk(t)s
∗k (t)dt (43)
The probability of error on a fixed set of attenuation factors αk is obtained first and then it isaveraged over the joint probability density function of the {αk}.
4.6.2 Probability of error for PSK with diversity
For a fixed set of {αk} the decision variable U is Gaussian with mean
E[U] = 2EL
∑1
α2k (44)
and variance
σ2U = 2NoE
L
∑k=1
α2k (45)
15Principles of Transmission and Detection of Digital Signals
www.intechopen.com
16 Will-be-set-by-IN-TECH
For these values of the mean and variance, the probability that U is less than zero is simply
P2(γ) = Q(
√
2γb
)
(46)
where γb is SNR per bit. The combiner output signal to noise ratio is given as:
γ =ENo
L
∑k=1
α2k =
L
∑1
γk (47)
where γk = E [ α2k
No)] is the instantaneous SNR on the kth channel. In order to proceed further,
we need the probability density function of γ, p(γ). For L = 1, γk = γ1 has a chi-squareprobability density function. The characteristic function of γ1 is given by
Ψγ1 (jv) = E[jvγ1)] =1
1 − jvΓ1, (48)
where Γ1 is the average signal to noise ratio of channel 1, which is assumed to be identical forall channels, i.e.
Γ = Γk =ENo
E[α2k ], (49)
and independent of k. The fading on channels i.e. αk are mutually independent, hence thecharacteristics function for the ∑ γk is simply
Ψγ(jv) = E[jvγ)] =1
(1 − jvΓ)L(50)
The probability density function p(γ) is
pγ =1
(L − 1)ΓLγL−1exp(
γ
Γ) (51)
Now, the conditional probability is de-conditioned by averaging the pγ over the channelfading statistics. For L branch binary PSK,
P2 =∫ ∞
0P2(γ)p2(γ)dγ
= [1
2(1 − μ)]L
L−1
∑k=1
(
L − 1 + kk
)
[1
2(1 + μ)]k (52)
where, by definition
μ =
√
Γ
1 + Γ(53)
when the average SNR per channel, Γ, satisfies the condition Γ ≫ 1, the (52) approximates to
P2 ≈ (1
4Γ)L
(
2L − 1L
)
(54)
for sufficiently large Γ (greater than 10 dB). Equation (54) shows that with diversity the errorprobability decreases inversely with the Lth power of SNR. This procedure is applied toevaluate performance of several transmission formats.
16 Digital Communication
www.intechopen.com

Principles of Transmission and Detection of Digital Signals 17
4.6.3 Error performance of orthogonal FSK with diversity
Consider now the coherently orthogonal detected FSK for which the two decision variables atthe maximal ratio combiner output may be expressed as:
U1 = Re[2EL
∑k=1
α2k + αk Nk1]
U2 = Re[L
∑k=1
αk Nk2] (55)
where it is assumed that signal sk1(t) was transmitted and Nk1 and Nk2 are the two sets ofnoise components at the output of the matched filters. The probability of error is simply theprobability the U2 ≫ U1. When {αk} are fixed, the conditional probability of error for binaryFSK is given by:
P2(γ) = Q(√
γ) (56)
This is then averaged over the fade statistics. The results for PSK still apply if we replace Γ by12 Γ. Thus, the probability of error for coherently demodulated orthogonal FSK is obtained ifthe parameter μ is redefined as
μ =
√
Γ
2 + Γ(57)
For large values of γ, the performance P2, can be approximated as:
P2 ≈ (1
2Γ)L
(
2L − 1L
)
(58)
There is 3dB difference between the performances of PSK and coherent orthogonal FSK. Thisdifference is identical to the performance difference in the absence of fading. The above resultapplies to the case when the signal phase is recovered or estimated accurately. However,in the presence of fast channel fading accurate recovery of the phase becomes difficultand deployment of coherent PSK may not remain feasible and under these circumstancesdifferential phase shift keying (DPSK) or non-coherent FSK is used. In the case of DPSK, theinformation signal is pre-coded prior to transmission.
4.6.4 Error performance for DPSK with diversity
In the case of DPSK, the assumption that the channel parameters, αkexp(−jφk) do not changeover two adjacent symbol periods. The combiner for binary DPSK yields a decision variable,
U = Re[L
∑k=1
(2Eαk1ejφk + Nk1)(2Eαk1ejφk + N∗
k2)] (59)
where Nk1 and Nk2 denote the received noise components at the matched filters’ outputs overthe two consecutive signaling intervals. The probability of error is simply the probability thatU < 0. The conditional error probability is:
P2(γ) = (1
2)2L−1e−γ
L−1
∑k=0
bkγ2k (60)
17Principles of Transmission and Detection of Digital Signals
www.intechopen.com

18 Will-be-set-by-IN-TECH
where γ is given by
bk =1
k!
L−1−K
∑n=0
(
2L − 1L
)
(61)
The average of P2(γ) over the fading statistics, p(γ), yields:
P2 =1
22L−1(L − 1)!(1 + Γ)L
L−1
∑k=0
bk(L − 1 + k)!(Γ
1 + Γ)k (62)
For Γ ≫ 1, the error probability for binary DPSK with diversity is approximated by:
P2 ≈ (1
2Γ)L
(
2L − 1L
)
(63)
4.6.5 Error performance of non-coherent orthogonal FSK with diversity
In the case of non-coherent detection, it is assumed that the channel parameters, {αke−φk} donot change over a signaling period. The combiner for the multichannel signals is a square lawcombiner and its output consists of the two decision variables,
U1 =L
∑k=1
|2Eαke−jφk + Nk1|2
U2 =L
∑k=1
|Nk2|2 (64)
where U1 is assumed to contain the signal. The probability of error is P(U2 > U1). Note thatthe conditional probability of error for DPSK given in (60) applies to square law combinedFSK when γ is replaced by 1
2 γ. The probability of error given in (52) also applies to squarelaw combined FSK with parameter μ defines as
μ =Γ
2 + Γ(65)
An alternative approach is more direct where the probability density functions p(U1) andp(U2) are used in the expression for probability of error. Since the complex random variables{αkejφk}, {Nk1} and {Nk2} are zero mean Gaussian distributed, the decision variables U1
and U2 are distributed according to a chi-square probability distribution with 2L degrees offreedom, that is
p(U1) =1
(2σ21 )
L(L − 1)!UL−1
1 exp
(
− U1
2σ21
)
. (66)
where
σ21 =
1
2E(|2Eαkejφk + Nk1|2) = 2ENo(1 + Γ) (67)
Similarly,
p(U2) =2
(2σ22 )
L(L − 1)!UL−1
2 exp
(
− U2
2σ22
)
(68)
18 Digital Communication
www.intechopen.com
Principles of Transmission and Detection of Digital Signals 19
where σ22 = 2ENo. The probability of error is just the probability that U2 > U1. We get the
same result as in (52) for μ defined in (65). The probability of error can be simplified for Γ ≫ 1.In this case the error probability is given by
P2 = (1
Γ)L
(
2L − 1L
)
(69)
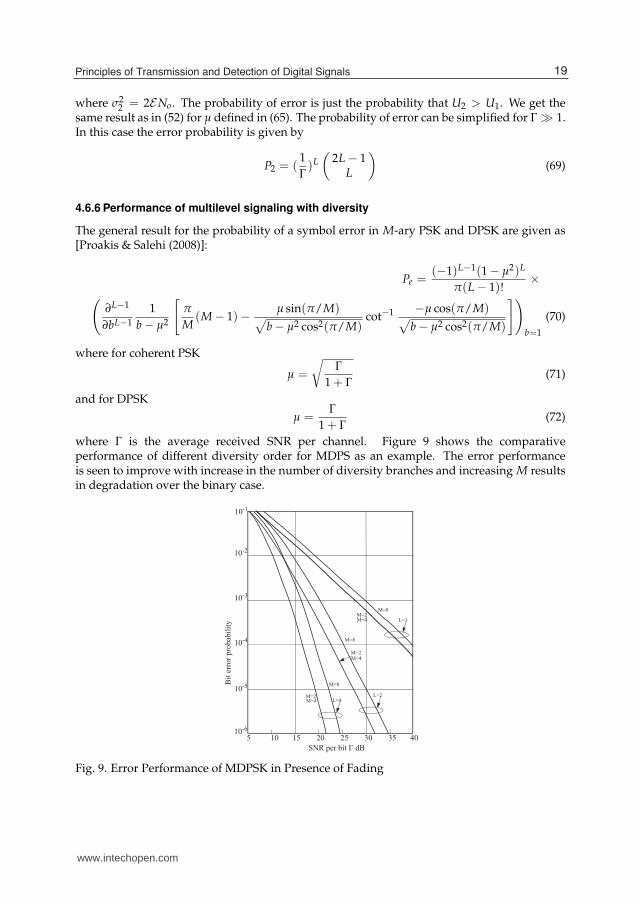
4.6.6 Performance of multilevel signaling with diversity
The general result for the probability of a symbol error in M-ary PSK and DPSK are given as[Proakis & Salehi (2008)]:
Pe =(−1)L−1(1 − μ2)L
π(L − 1)!×
(
∂L−1
∂bL−1
1
b − μ2
[
π
M(M − 1)− μ sin(π/M)
√
b − μ2 cos2(π/M)cot−1 −μ cos(π/M)
√
b − μ2 cos2(π/M)
])
b=1
(70)
where for coherent PSK
μ =
√
Γ
1 + Γ(71)
and for DPSK
μ =Γ
1 + Γ(72)
where Γ is the average received SNR per channel. Figure 9 shows the comparativeperformance of different diversity order for MDPS as an example. The error performanceis seen to improve with increase in the number of diversity branches and increasing M resultsin degradation over the binary case.
M=8M=2M=4
M=8
M=2M=4
L=1
L=2L=4
M=2M=4
M=8
5 10 15 20 25 30 35 4010-6
10-5
10-4
10-3
10-2
10-1
Bit
err
or
pro
bab
ilit
y
SNR per bit � dB
Fig. 9. Error Performance of MDPSK in Presence of Fading
19Principles of Transmission and Detection of Digital Signals
www.intechopen.com

20 Will-be-set-by-IN-TECH
4.7 Spread spectrum communications
Spread spectrum signals are characterized by their bandwidth, which is much wider thanthe information bandwidth, i.e. WT ≫ R, where WT is the transmission bandwidth and Ris the information symbol rate. The bandwidth expansion ratio, Be = WT
R , is also defined asprocessing gain and is given as:
Gp( f ) =transmission bandwidth
post-correlation bandwidth(73)
Components at frequencies which are integer multiples of 1MΔ
, i.e.:
Gs( f ) =1
MΔG( f )
∞
∑k=−∞
δ( f − k
MΔ) (74)
Thus,1Tb
W=
1
WTb=
Tc
Tb=
1
Lc(75)
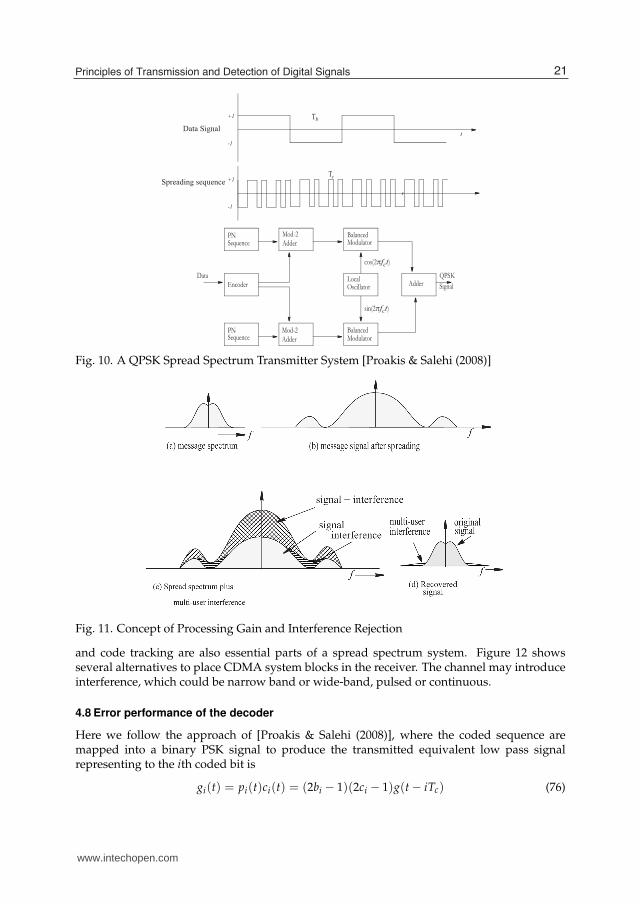
The information signal bandwidth expansion is achieved by superimposing8 it on apseudo-random sequence, which occupies bandwidth much wider than the informationsignal bandwidth. The selection of sequence code determines the degree of privacy andlonger the code the better is it. The bandwidth expansion has another advantage as itspreads the information bearing signals energy over a wide bandwidth thereby effectivelyburying the information bearing signal beneath the noise with resulting signal to noise ratiobecomes very low. This process is sometimes called covert signaling, a necessary requirementin defence communication. This property is also known as Low Probability of Intercept(LPI). The pseudo-random sequence is used as a code key at the receiver to recover theimbedded information signal in the spread spectrum signal. Figure 10 shows an exampleof a typical spread spectrum system. At the receiver, the multiplication of the sequence withthe received signal collapses the expanded bandwidth to that of the information signal, thelatter is recovered by low pass filtering the correlator output. The interference present inthe received signal is spread with the result that desired signal to noise ratio is increased.This is illustrated in Figure 11. In addition, the signals arriving via different paths can beresolved with the use of delayed versions of the spreading code. Most of the discussion aboveis applicable to direct sequence spread spectrum systems. There are several other types ofspread spectrum systems. Frequency hopping is another important form of spread spectrumsystem where the message spectrum is randomly translated to discrete frequencies spreadover a wide bandwidth. The randomly hopped signal spectrum produced at the transmitteris hopped back to the information signal bandwidth at the receiver.
4.7.1 CDMA system architectures
A modulator and a demodulator are the main parts of a spread spectrum system. Themodulator is a multiplier of the signal and the spreading sequence followed by an upconverter to the transmission frequency. The channel encoder and decoder similar to thoseused in a typical digital communication system are employed. The pseudo-random sequenceat the transmitter and the receiver are time synchronized. Synchronization, code acquisition,
8 The process of imposition is equivalent to multiplication of information signal by the spreadingsequence.
20 Digital Communication
www.intechopen.com
Principles of Transmission and Detection of Digital Signals 21
Tb
Tc
Data Signal
Spreading sequence
+1
-1
+1
-1
t
t
Data
PNSequence
Encoder
PNSequence
Mod-2Adder
Mod-2Adder
BalancedModulator
BalancedModulator
LocalOscillator Adder
QPSK
Signal
cos(2 fct)
sin(2 fct)
Fig. 10. A QPSK Spread Spectrum Transmitter System [Proakis & Salehi (2008)]
Fig. 11. Concept of Processing Gain and Interference Rejection
and code tracking are also essential parts of a spread spectrum system. Figure 12 showsseveral alternatives to place CDMA system blocks in the receiver. The channel may introduceinterference, which could be narrow band or wide-band, pulsed or continuous.
4.8 Error performance of the decoder
Here we follow the approach of [Proakis & Salehi (2008)], where the coded sequence aremapped into a binary PSK signal to produce the transmitted equivalent low pass signalrepresenting to the ith coded bit is
gi(t) = pi(t)ci(t) = (2bi − 1)(2ci − 1)g(t − iTc) (76)
21Principles of Transmission and Detection of Digital Signals
www.intechopen.com
22 Will-be-set-by-IN-TECH
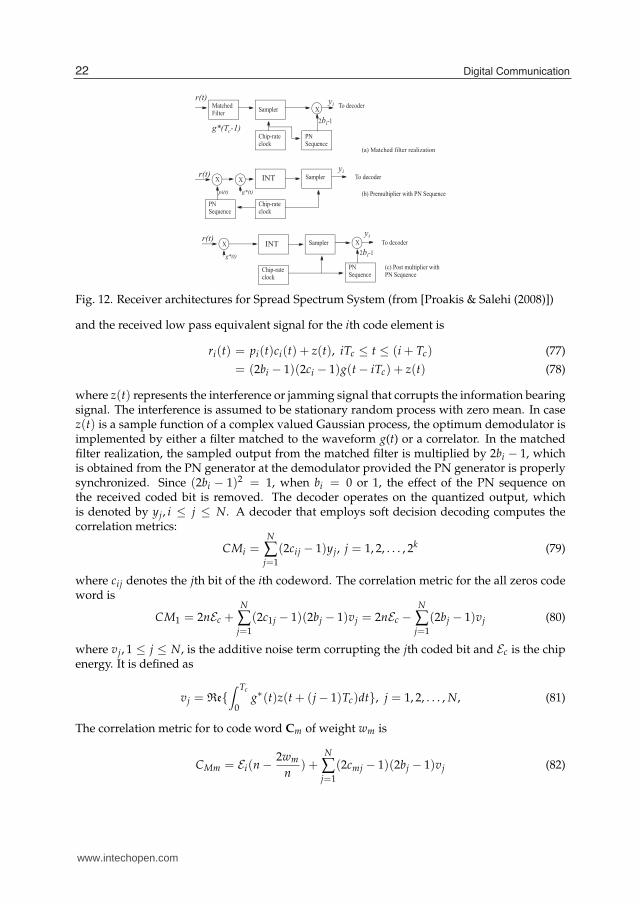
Fig. 12. Receiver architectures for Spread Spectrum System (from [Proakis & Salehi (2008)])
and the received low pass equivalent signal for the ith code element is
ri(t) = pi(t)ci(t) + z(t), iTc ≤ t ≤ (i + Tc) (77)
= (2bi − 1)(2ci − 1)g(t − iTc) + z(t) (78)
where z(t) represents the interference or jamming signal that corrupts the information bearingsignal. The interference is assumed to be stationary random process with zero mean. In casez(t) is a sample function of a complex valued Gaussian process, the optimum demodulator isimplemented by either a filter matched to the waveform g(t) or a correlator. In the matchedfilter realization, the sampled output from the matched filter is multiplied by 2bi − 1, whichis obtained from the PN generator at the demodulator provided the PN generator is properlysynchronized. Since (2bi − 1)2 = 1, when bi = 0 or 1, the effect of the PN sequence onthe received coded bit is removed. The decoder operates on the quantized output, whichis denoted by yj, i ≤ j ≤ N. A decoder that employs soft decision decoding computes thecorrelation metrics:
CMi =N
∑j=1
(2cij − 1)yj, j = 1, 2, . . . , 2k (79)
where cij denotes the jth bit of the ith codeword. The correlation metric for the all zeros codeword is
CM1 = 2nEc +N
∑j=1
(2c1j − 1)(2bj − 1)vj = 2nEc −N
∑j=1
(2bj − 1)vj (80)
where vj, 1 ≤ j ≤ N, is the additive noise term corrupting the jth coded bit and Ec is the chipenergy. It is defined as
vj = Re{∫ Tc
0g∗(t)z(t + (j − 1)Tc)dt}, j = 1, 2, . . . , N, (81)
The correlation metric for to code word Cm of weight wm is
CMm = Ei(n − 2wm
n) +
N
∑j=1
(2cmj − 1)(2bj − 1)vj (82)
22 Digital Communication
www.intechopen.com
Principles of Transmission and Detection of Digital Signals 23
Now we need to determine the probability that CMm > CM1. The difference between CM1 andCMm is
D = CM1 − CMm = 4Ecwm − 2N
∑j=1
cmj(2bj − 1)vj (83)
Since the code word Cm has weight ωm, therefore there are ωm non-zero components inthe summation of noise terms containing in (83). It can be assumed that the minimumdistance of the code is sufficiently large in which case we can invoke central limit theoremfor the summation of noise components. This is valid for PN spread spectrum signals withbandwidth expansion of 10 or more9. Thus, the summation of noise components is modeledas a Gaussian random variable. Since E[(2bi − 1)] = 0 and E(vj) = 0, the mean of the secondterm in (83) is also zero. The variance is
N
∑j=1
N
∑i=1
cmicmjE[(2bj − 1)(2bi − 1)]E[vivj] (84)
The sequence of binary digits from the PN generator are assumed to be uncorrelated, hence
E[(2bj − 1)(2bj − 1)] = δij (85)
andσ2
m = 4wmE[v2] (86)
where E[v2] is the second moment of any element in the set {vj}. The second moment isevaluated to yield
E[v2] =∫ Tc
0
∫ Tc
0g∗(t)g(t)φzz(t − τ)dτdt =
∫ ∞
−∞|G( f )|2Φzz( f )d f (87)
where φzz(τ) =12 E[z∗(t)z(t)] is the autocorrelation function and Φzz( f ) is the power spectral
density of the interference z(t). When the interference is spectrally flat within the bandwidthoccupied by the transmitted signal (the bandwidth of the bandpass channel is W and thatof equivalent lowpass channel is W − L), i.e. Φzz = Jo, | f | ≤ W. Using (87) in (86), we getE[v2] = 2Ec Jo, hence the variance of the interference term in (86) becomes
σ2m = 8Ec Jowm (88)
In this case the probability that D < 0 is
P2(m) = Q(
√
2
JoEcwm) (89)
The energy per coded chip Ec is related to the energy per information bit Eb as
Ec =k
nEb = RcEb (90)
Substituting from (90) in (89), we get
P2(m) = Q(
√
2Eb
JoRcwm = Q(
√
2γbRcwm) (91)
9 Minimum spreading gain of 10 is internationally accepted value.
23Principles of Transmission and Detection of Digital Signals
www.intechopen.com
24 Will-be-set-by-IN-TECH
where γb = Eb/Jo is the SNR per information bit. Finally the code word error probability maybe upper bounded by the union bound as
PM ≤M
∑2
Q(√
2γbRcwm) (92)
where M = 2k. The multiplication of the interference with the signal from the PN generatorspreads the interference to the signal bandwidth W, and the narrow band integrationfollowing the multiplication sees only the fraction 1
Lcof the total interference. Thus the
performance of the DS spread spectrum system is enhanced by the processing gain. 10
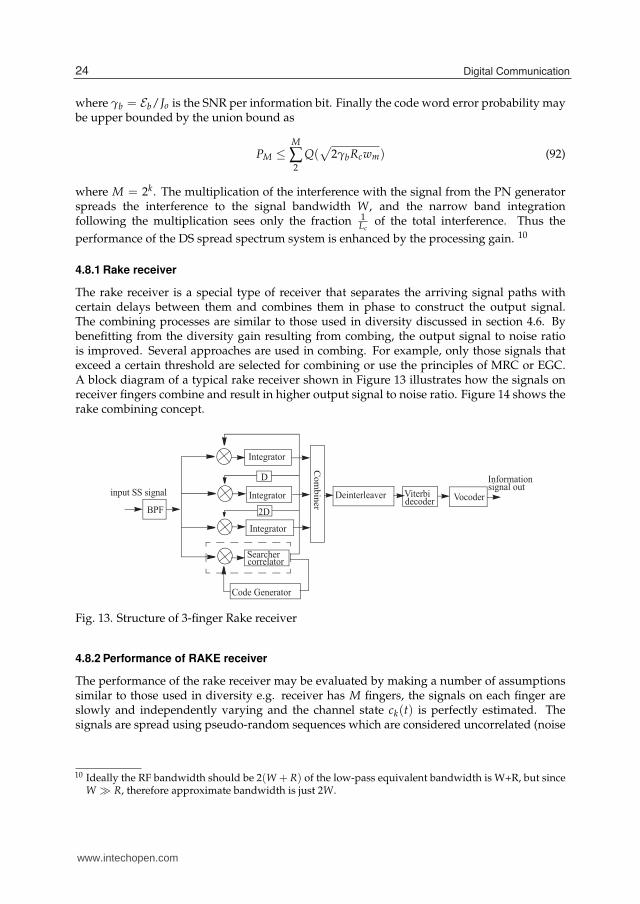
4.8.1 Rake receiver
The rake receiver is a special type of receiver that separates the arriving signal paths withcertain delays between them and combines them in phase to construct the output signal.The combining processes are similar to those used in diversity discussed in section 4.6. Bybenefitting from the diversity gain resulting from combing, the output signal to noise ratiois improved. Several approaches are used in combing. For example, only those signals thatexceed a certain threshold are selected for combining or use the principles of MRC or EGC.A block diagram of a typical rake receiver shown in Figure 13 illustrates how the signals onreceiver fingers combine and result in higher output signal to noise ratio. Figure 14 shows therake combining concept.
Deinterleaver Viterbidecoder Vocoder
BPF
Com
bin
er
Code Generator
Searchercorrelator
D
2D
Integrator
Integrator
Integrator
Informationsignal out
input SS signal
Fig. 13. Structure of 3-finger Rake receiver
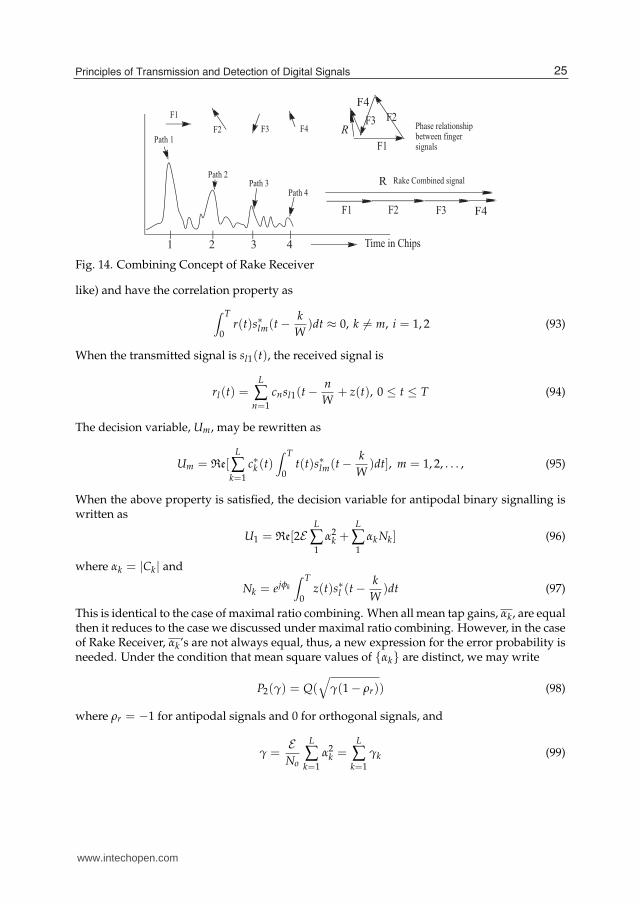
4.8.2 Performance of RAKE receiver
The performance of the rake receiver may be evaluated by making a number of assumptionssimilar to those used in diversity e.g. receiver has M fingers, the signals on each finger areslowly and independently varying and the channel state ck(t) is perfectly estimated. Thesignals are spread using pseudo-random sequences which are considered uncorrelated (noise
10 Ideally the RF bandwidth should be 2(W + R) of the low-pass equivalent bandwidth is W+R, but sinceW ≫ R, therefore approximate bandwidth is just 2W.
24 Digital Communication
www.intechopen.com
Principles of Transmission and Detection of Digital Signals 25
Fig. 14. Combining Concept of Rake Receiver
like) and have the correlation property as
∫ T
0r(t)s∗lm(t −
k
W)dt ≈ 0, k �= m, i = 1, 2 (93)
When the transmitted signal is sl1(t), the received signal is
rl(t) =L
∑n=1
cnsl1(t −n
W+ z(t), 0 ≤ t ≤ T (94)
The decision variable, Um, may be rewritten as
Um = Re[L
∑k=1
c∗k (t)∫ T
0t(t)s∗lm(t −
k
W)dt], m = 1, 2, . . . , (95)
When the above property is satisfied, the decision variable for antipodal binary signalling iswritten as
U1 = Re[2EL
∑1
α2k +
L
∑1
αk Nk] (96)
where αk = |Ck| and
Nk = ejφk
∫ T
0z(t)s∗l (t −
k
W)dt (97)
This is identical to the case of maximal ratio combining. When all mean tap gains, αk, are equalthen it reduces to the case we discussed under maximal ratio combining. However, in the caseof Rake Receiver, αk’s are not always equal, thus, a new expression for the error probability isneeded. Under the condition that mean square values of {αk} are distinct, we may write
P2(γ) = Q(√
γ(1 − ρr)) (98)
where ρr = −1 for antipodal signals and 0 for orthogonal signals, and
γ =ENo
L
∑k=1
α2k =
L
∑k=1
γk (99)
25Principles of Transmission and Detection of Digital Signals
www.intechopen.com
26 Will-be-set-by-IN-TECH
Each γk is distributed according to chi-square distribution with two degrees of freedom, i.e.
p(γk) =1
Γke− γk
Γk (100)
where Γk is the average SNR for the kth path, defined as
Γk =ENo
α2k (101)
Now γ is sum of L statistically independent components {γk}, it can be shown by followingthe procedure similar to the one used for diversity, that the pdf of γ is
p(γ) =L
∑k=1
L
∏i = 1i �= k
Γk
Γk(Γk − Γi)e− γ
Γk (102)
The error probability for binary CDMA signaling is then
P2 =1
2
L
∑k = 1k �= i
Γk
Γk − Γi
[
1 −√
Γk(1 − ρr)
2 + Γk(1 − ρr)
]
(103)
When Γk ≫ 1, the error probability is approximated as
P2 ≈(
2L − 1L
) L
∏k=1
1
2Γk(1 − ρr)(104)
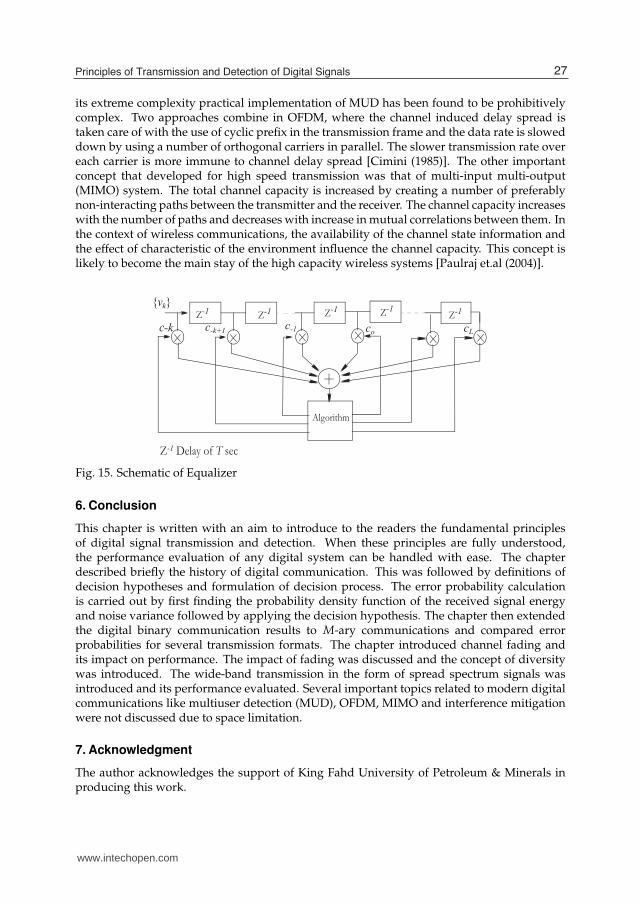
5. High speed communication over time selective fading channels
The past decade saw tremendous increase in the use of Internet over wire line systems andits use has now migrated to wireless communication. The wireless channels being impairedas well as bandlimited place an upper bound on the transmission rate. The limitation oftransmission rate results in restrictions on the type of services that can be offered over thesechannels. Current research is motivated by the desire to increase the transmission speedover wireless systems. Several possibilities exist to achieve this gaol. One possibility isto undo the channel induced impairments over the transmission bandwidth in order topresent the channel as ideal as possible. The performance of digital systems can also beenhanced with the use of channel equalization. In [Lo et.al. (1991)], a combination of diversityand channel equalization has been shown to be a powerful technique. Figure 15 showsa schematic of a typical channel equalizer. The other techniques that are used for highspeed transmission over frequency selective channels are spread spectrum communications,multi-carrier communications, and orthogonal frequency division multiplexing transmission.
Interference mitigation is another effective tool to counter the effect of the channel. Inthis regard serial (SIC), parallel (PIC) and hybrid (HIC) interference canceling techniquesare significant. Theses systems were proposed as suboptimum alternative to multiuserdetectors (MUD), which have excellent immunity against near-far interference but because of
26 Digital Communication
www.intechopen.com
Principles of Transmission and Detection of Digital Signals 27
its extreme complexity practical implementation of MUD has been found to be prohibitivelycomplex. Two approaches combine in OFDM, where the channel induced delay spread istaken care of with the use of cyclic prefix in the transmission frame and the data rate is sloweddown by using a number of orthogonal carriers in parallel. The slower transmission rate overeach carrier is more immune to channel delay spread [Cimini (1985)]. The other importantconcept that developed for high speed transmission was that of multi-input multi-output(MIMO) system. The total channel capacity is increased by creating a number of preferablynon-interacting paths between the transmitter and the receiver. The channel capacity increaseswith the number of paths and decreases with increase in mutual correlations between them. Inthe context of wireless communications, the availability of the channel state information andthe effect of characteristic of the environment influence the channel capacity. This concept islikely to become the main stay of the high capacity wireless systems [Paulraj et.al (2004)].
Fig. 15. Schematic of Equalizer
6. Conclusion
This chapter is written with an aim to introduce to the readers the fundamental principlesof digital signal transmission and detection. When these principles are fully understood,the performance evaluation of any digital system can be handled with ease. The chapterdescribed briefly the history of digital communication. This was followed by definitions ofdecision hypotheses and formulation of decision process. The error probability calculationis carried out by first finding the probability density function of the received signal energyand noise variance followed by applying the decision hypothesis. The chapter then extendedthe digital binary communication results to M-ary communications and compared errorprobabilities for several transmission formats. The chapter introduced channel fading andits impact on performance. The impact of fading was discussed and the concept of diversitywas introduced. The wide-band transmission in the form of spread spectrum signals wasintroduced and its performance evaluated. Several important topics related to modern digitalcommunications like multiuser detection (MUD), OFDM, MIMO and interference mitigationwere not discussed due to space limitation.
7. Acknowledgment
The author acknowledges the support of King Fahd University of Petroleum & Minerals inproducing this work.
27Principles of Transmission and Detection of Digital Signals
www.intechopen.com
28 Will-be-set-by-IN-TECH
8. References
Biguesh, M.; Gershman, A. (2006). Training-based MIMO channel estimation: a studyof estimator tradeoffs and optimal training signals. IEEE Transactions on SignalProcessing, vol 54, (884-893), March.
Björnson, E. Ottersten, B. (2010). A Framework for Training-Based Estimation in ArbitrarilyCorrelated Rician MIMO Channels with Rician Disturbance. IEEE Transactions onSignal Processing, vol 58, (1807-1820), May.
Cimini, Jr., L. J. (1985). Analysis and Simulation of a Digital Mobile Channel Using OrthogonalFrequency Division Multipexing. IEEE Trans. Commun., vol. 33, (665-675), July.
Falconer, D., Ariyavisitakul, S.L., Benyamin-Seeyar, A., Eidson, B. (2002). Frequency DomainEqualization for single-carrier Broadband Wireless Systems, IEEE CommunicationsMagazine, vol.40, (58-66), April.
Foschini, G. J. et.al. Simplified Processing for High Spectral Efficiency WirelessCommunication Employing Multi-Element Arrays. IEEE JSAC, vol. 17, (1841-1852),November.
Franks, L.E. (1983). Carrier and bit synchronization in data communication - A tutorialReview. IEEE Transactions on Communications, vol COM-28, (1107-1121), August.
Kermoal,J. Schumacher, L. Pedersen, K.I. Mogensen, P. Frederiksen, F. (2002). A StochasticMIMO Radio Channel Model With Experimental Validation. IEEE Journal on SelectedAreas Communications, vol 20, (1211-1226), June.
Li,Y. Cimini, L.J. and Sollenberger, N.R. (1998). Robust channel estimation for OFDM systemswith rapid dispersive fading channels. IEEE Transactions on Communications. vol 46,(902-915), July.
Lo, N., Falconer, D.D., and Sheikh, A.U.H. (1991). Adaptive equalization and diversitycombining for mobile radio using interpolated channel estimates.IEEE Transactionson Vehicular Technology, vol 40, (636-645), August.
Nisar, M. D. Utschick W. and Hindelang,T. (2010). Maximally Robust 2-D Channel Estimationfor OFDM Systems.IEEE Transactions on Signal Processing, vol 58, (3163-3172), June.
Paulraj, A. et.al.(2004). An overview of MIMO communications- A key to gigabit wireless,Proc. of the IEEE, vol. xx, (x-xx), Feb.
Proakis, J.G. and Salehi, M. (2008). Digital Communications, 5th Edition McGraw Hill, New York.Reeves, A. H. (1937). French Patent No. 49 159/833 929, July 5.Sheikh, A.U.H. (2004). Wireless Communications: Theory & Techniques, Kluwer, New York.Simon, M, and Alouni, M.S. (2000). Digital Communication Over Fading Channels - A Unified
Approach to Performance Analysis, J. Wiley, New York.Sklar, B. (1988). Digital Communications, Fundamentals and Applications, Prentice Hall, Upper
Saddle River, N.J.Thomas, C.M. Weidner, M.Y. and Durrani, S.H.(1974). Digital Amplitude-Phase Keying with
M-ary Alphabets. IEEE Transactions on Communications, vol 32, (168-180), February.
28 Digital Communication
www.intechopen.com
Digital CommunicationEdited by Prof. C Palanisamy
ISBN 978-953-51-0215-1Hard cover, 208 pagesPublisher InTechPublished online 07, March, 2012Published in print edition March, 2012
InTech EuropeUniversity Campus STeP Ri Slavka Krautzeka 83/A 51000 Rijeka, Croatia Phone: +385 (51) 770 447 Fax: +385 (51) 686 166www.intechopen.com
InTech ChinaUnit 405, Office Block, Hotel Equatorial Shanghai No.65, Yan An Road (West), Shanghai, 200040, China
Phone: +86-21-62489820 Fax: +86-21-62489821
All marketing is digital and everyone should have a digital strategy. Everything is going mobile. "The world hasnever been more social" is the recent talk in the community. Digital Communication is the key enabler of that.Digital information tends to be far more resistant to transmit and interpret errors than information symbolized inan analog medium. This accounts for the clarity of digitally-encoded telephone connections, compact audiodisks, and much of the enthusiasm in the engineering community for digital communications technology. Acontemporary and comprehensive coverage of the field of digital communication, this book explores moderndigital communication techniques. The purpose of this book is to extend and update the knowledge of thereader in the dynamically changing field of digital communication.
How to referenceIn order to correctly reference this scholarly work, feel free to copy and paste the following:
Asrar Ul Haq Sheikh (2012). Principles of Transmission and Detection of Digital Signals, DigitalCommunication, Prof. C Palanisamy (Ed.), ISBN: 978-953-51-0215-1, InTech, Available from:http://www.intechopen.com/books/digital-communication/principles-of-transmission-and-detection-of-digital-signals

© 2012 The Author(s). Licensee IntechOpen. This is an open access articledistributed under the terms of the Creative Commons Attribution 3.0License, which permits unrestricted use, distribution, and reproduction inany medium, provided the original work is properly cited.