Primary Field data acquisition sources
38
Geographic Information Technology Training Alliance D Department of Geosciences - Geography B-DC Lesson 2 / Unit 3 Unit 3: Field data acquisition Lesson : Primary sources Claude Collet
Transcript of Primary Field data acquisition sources

Geographic Information Technology Training Alliance
DDepartment of Geosciences - Geography
B-DC Lesson 2 / Unit 3
Unit 3:
Field data acquisitionLesson :
Primarysources
Claude Collet

2B-DC / L2
Primary sources
Geographic Information Technology Training Alliance
U3: Field data acquisition
March 24, 2003
Content of Lesson
Unit 1: Digital sourcesUnit 2: Remote sensingUnit 3: Field data acquisitionUnit 4: Field survey techniques

3B-DC / L2
Primary sources
Geographic Information Technology Training Alliance
U3: Field data acquisition
March 24, 2003
Unit 2: Field data acquisition
1: Introduction2: Planning3: Data collection

4B-DC / L2
Primary sources
Geographic Information Technology Training Alliance
U3: Field data acquisition
March 24, 2003
1 IntroductionIntroduction

5B-DC / L2
Primary sources
Geographic Information Technology Training Alliance
U3: Field data acquisition
March 24, 2003
Objectives of the Unit
To understand the process of field data acquisition and its major stepsTo relate this process with:
the previous one on Spatial modelling (module B-SM)the following one on regionalisation and GDB setup (module B-AN)
To identify and illustrate concepts and techniques in volved in this process
6B-DC / L2
Primary sources
Geographic Information Technology Training Alliance
U3: Field data acquisition
March 24, 2003
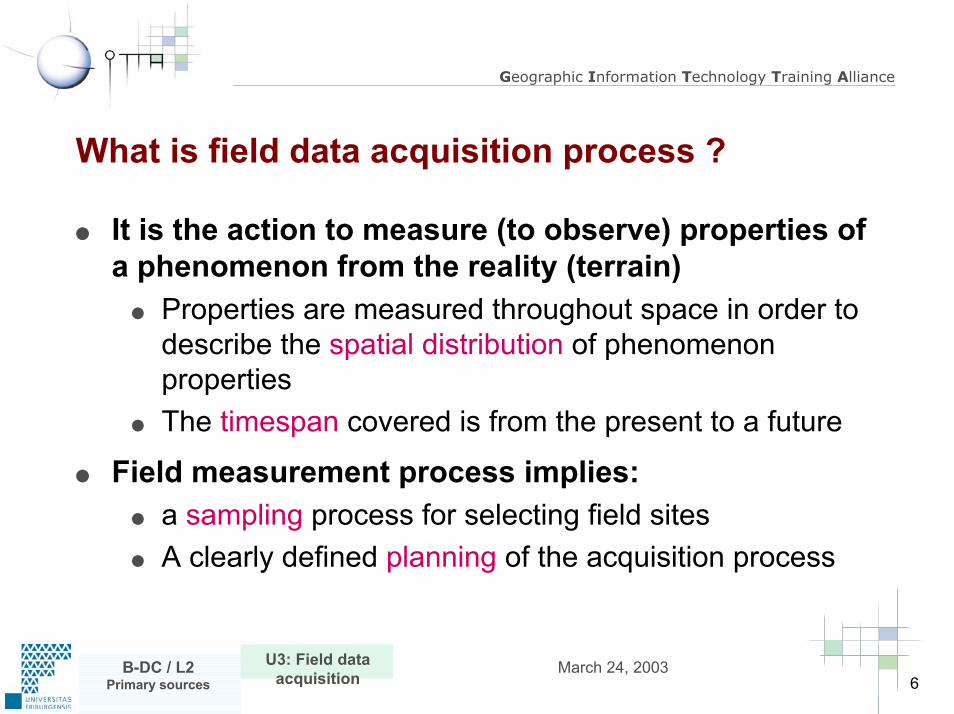
What is field data acquisition process ?
It is the action to measure (to observe) properties of a phenomenon from the reality (terrain)
Properties are measured throughout space in order to describe the spatial distribution of phenomenon propertiesThe timespan covered is from the present to a future
Field measurement process implies:a sampling process for selecting field sitesA clearly defined planning of the acquisition process

7B-DC / L2
Primary sources
Geographic Information Technology Training Alliance
U3: Field data acquisition
March 24, 2003
Not isolate but a linked process
As data are sampled from the reality, one should keep in mind related processes that produce relevant and
representative information:Spatial modelling of the reality (B-SM):
Information collected and structured into the GDB must satisfy the objectives of the reality model
Regionalisation of variables (B-AN):In order to describe the whole surface of the study area, sampled data should be regionalised. This process requires specific properties from the sample to be satisfy, during the data acquisition phase

8B-DC / L2
Primary sources
Geographic Information Technology Training Alliance
U3: Field data acquisition
March 24, 2003
From the field to the geographical database (GDB)
Location samplingLocation samplingSelection of sampling sitesSelection of sampling sites
Data collectionData collectionMeasurement + StorageMeasurement + Storage
SpatialSpatialDataData
RegionalisationRegionalisation processprocessFrom point data to spatial unit From point data to spatial unit
propertiesproperties
1. Field data acquisition 2. Regionalisation
RealityReality
GDBGDBgeographicalgeographical
databaseSpatialSpatialData databaseData

9B-DC / L2
Primary sources
Geographic Information Technology Training Alliance
U3: Field data acquisition
March 24, 2003
The environment of field data acquisition
Information dimensions:Spatial distribution of properties:Acquisition mode:Instrumentation:Acquisition system:Information content:
Thematic, spatial, temporalContinuous, discontinuous
(discrete)SamplingMan driven, automaticFixed network, mobile systemMeasured, interpretedNominal, ordinal, cardinal level

10
B-DC / L2Primary sources
Geographic Information Technology Training Alliance
U3: Field data acquisition
March 24, 2003
2 Planning field data acquisitionPlanning field data acquisition

11
B-DC / L2Primary sources
Geographic Information Technology Training Alliance
U3: Field data acquisition
March 24, 2003
From phenomenon behavior to location properties
How to measure phenomenon behavior according to the defined model of reality?
In the thematic dimension:What characteristic(s) of the phenomenon should be retained in the data?
In the spatial dimension:Where to locate measurement sites in order to express the spatial distribution of phenomenon properties?
In the temporal dimension:When measurements should be acquired?

12
B-DC / L2Primary sources
Geographic Information Technology Training Alliance
U3: Field data acquisition
March 24, 2003
The keyword is RepresentativityThe collected data sample should represent the real
spatial distribution of propertiesIn the thematic dimension:
Measured properties should contain the whole range of diversity present in the study area during the considered period of time
In the spatial dimension:Sites of measurement should be located throughout the study area, even outside
In the temporal dimension:Repeatition of measurements should cover the whole considered period of time
13
B-DC / L2Primary sources
Geographic Information Technology Training Alliance
U3: Field data acquisition
March 24, 2003
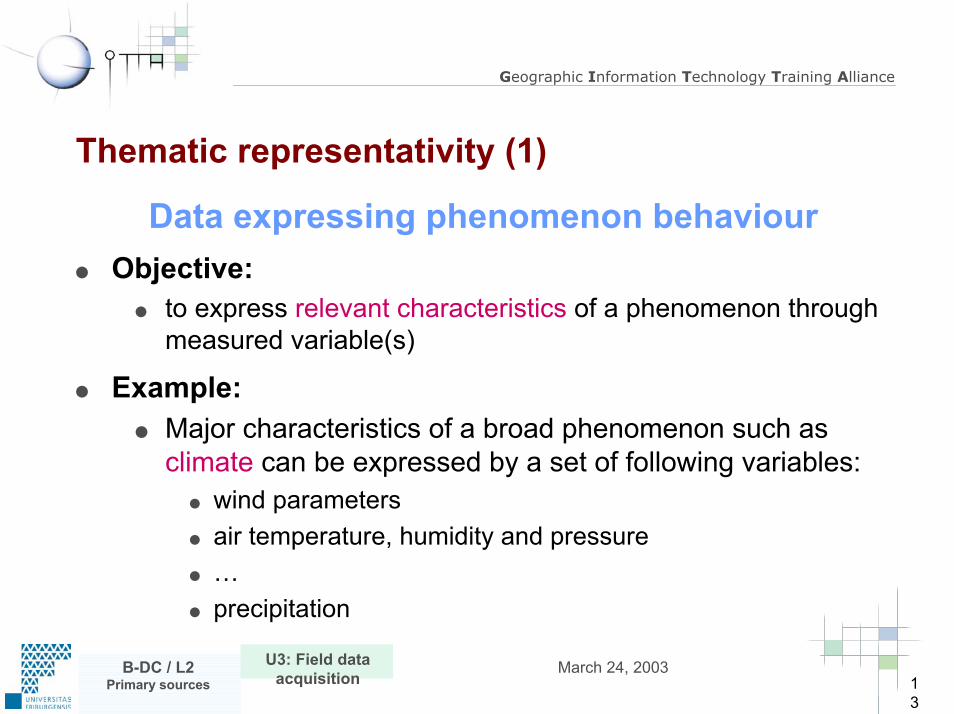
Thematic representativity (1)
Data expressing phenomenon behaviourObjective:
to express relevant characteristics of a phenomenon through measured variable(s)
Example:Major characteristics of a broad phenomenon such as climate can be expressed by a set of following variables:
wind parameters air temperature, humidity and pressure…precipitation
14
B-DC / L2Primary sources
Geographic Information Technology Training Alliance
U3: Field data acquisition
March 24, 2003
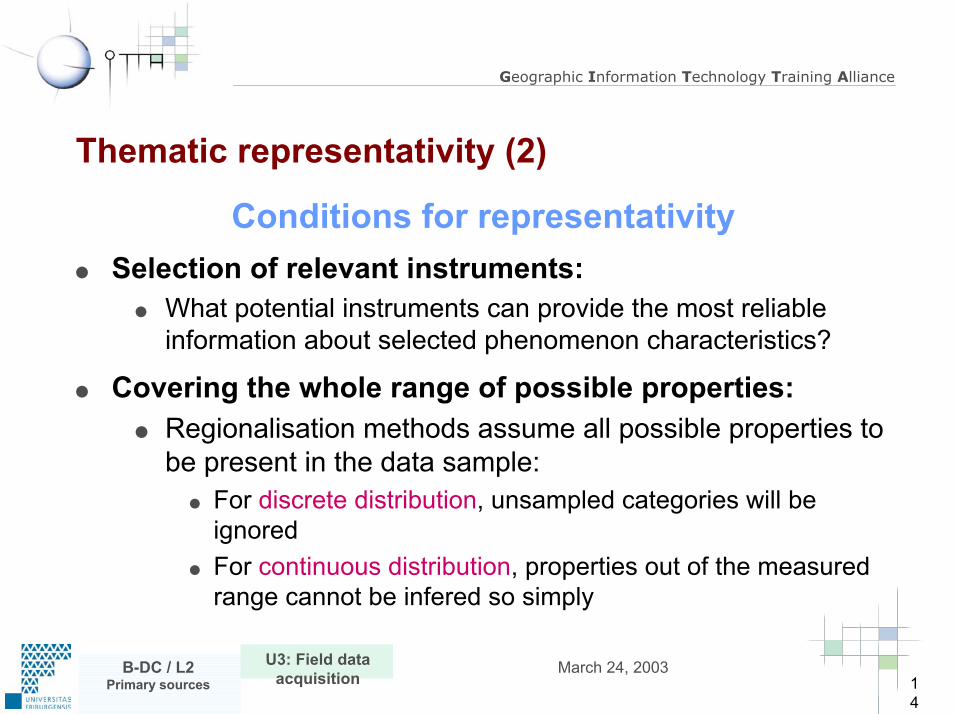
Thematic representativity (2)
Conditions for representativitySelection of relevant instruments:
What potential instruments can provide the most reliable information about selected phenomenon characteristics?
Covering the whole range of possible properties:Regionalisation methods assume all possible properties to be present in the data sample:
For discrete distribution, unsampled categories will be ignoredFor continuous distribution, properties out of the measured range cannot be infered so simply

15
B-DC / L2Primary sources
Geographic Information Technology Training Alliance
U3: Field data acquisition
March 24, 2003
Spatial representativity
From point sample data to the surfaceAssumption:
Most field data are collected from point locations(sites of measurement, stations, …)
Infering properties outside sites of measurement:
Regionalisation is in charge of spatial inference:For predefined objects, their property is the “overall” property measured at their sampled locationsFor resulting objects, property of any location in the study area is estimated from an interpolation process

16
B-DC / L2Primary sources
Geographic Information Technology Training Alliance
U3: Field data acquisition
March 24, 2003
Spatial representativity: for predefined objects (1)From point sample to point features
Usualy properties of point features are acquired with a sample of points at the same location
There is no regionalisationprocess as the measurement property matches the location of the feature to be characterized
8
13
2
145
6
A
8
13
2
145
6
B
C
DE
F
Id : Feature identification
n : Assigned property
n : Measured property
Location of acquisition points Properties assigned to point features

17
B-DC / L2Primary sources
Geographic Information Technology Training Alliance
U3: Field data acquisition
March 24, 2003
Spatial representativity: for predefined objects (2)From point sample to linear features
Several point locations should be selected along each linear feature in order to estimate its “overall” property
The regionalisation process combines point measurements to estimate the property of each linear feature
Id : Feature identification
? : Assigned property after regionalisation
n : Measured property
??
?
?
?
BA
CD
E
Assignationby labelling
1
23 4
5 67
10
11
98
Location of acquisition points Properties assigned to linear features

18
B-DC / L2Primary sources
Geographic Information Technology Training Alliance
U3: Field data acquisition
March 24, 2003
Spatial representativity: for predefined objects (3)From point sample to areal features
Several point locations should be selected within each areal feature in order to estimate its “overall” property
The regionalisation process combines point measurements to estimate the global property of each areal feature
Id : Feature identification
? : Assigned property after regionalisation
n : Measured property
Properties assigned to areal features
Assignationby labelling
1
3
2
45
67 9 10
11
14
12 13
1516
17
8
?
??
?
A
B
C D
Location of acquisition points

19
B-DC / L2Primary sources
Geographic Information Technology Training Alliance
U3: Field data acquisition
March 24, 2003
Spatial representativity: for resulting objects (1)From point sample to areal features
for discrete spatial distribution
Numerous point locations should be selected within the study area in order to infer the distribution of properties in the study area
The regionalisation process generates areal features with homogeneous property
(space partitioning or zoning)
8
13
2
145
6
8
13
2
145
6
D
A B
C
E
F
Id : Feature identification of the resulting object
n : Assigned property
n : Measured property
Zoningby inference
Location of acquisition points Properties assigned to areal features

20
B-DC / L2Primary sources
Geographic Information Technology Training Alliance
U3: Field data acquisition
March 24, 2003
Spatial representativity: for resulting objects (2)From point sample to continuous surface
for continuous spatial distributionNumerous point locations should be selected inside and outside the study area in order to infer the distribution of properties in the study area
The regionalisation process generates point or areal features based on spatial dependancy of properties (spatial interpolation)
Properties assigned to point or areal featuresLocation of acquisition points
Regularily distributed point features
Id : Feature identification of the resulting object
1 2 3 4 5 6 7
8 14
4943
1 2 3 4 5 6
31 36
Interpolationby inference
Regularily distributed areal features (cells)
Id : Feature identification of the resulting object

21
B-DC / L2Primary sources
Geographic Information Technology Training Alliance
U3: Field data acquisition
March 24, 2003
How to assess spatial representativity ?
For predefined spatial features:sufficient point samples should be distributed inside the area or along the linear feature in order to estimate its « overall » (global) property such as the central tendency, often accompanied with the dispersion value
For resulting spatial features:sufficient point samples should be distributed inside and outside the study area in order to estimate a property for any location, through an interpolation process

22
B-DC / L2Primary sources
Geographic Information Technology Training Alliance
U3: Field data acquisition
March 24, 2003
Spatial distributions of points
R=0 R=1 R=2.1419
clustered random systematic(profiles)
systematic(contour lines)
systematicregular
Representativity of the spatial distribution of the phenomenon ?
No Yes
23
B-DC / L2Primary sources
Geographic Information Technology Training Alliance
U3: Field data acquisition
March 24, 2003
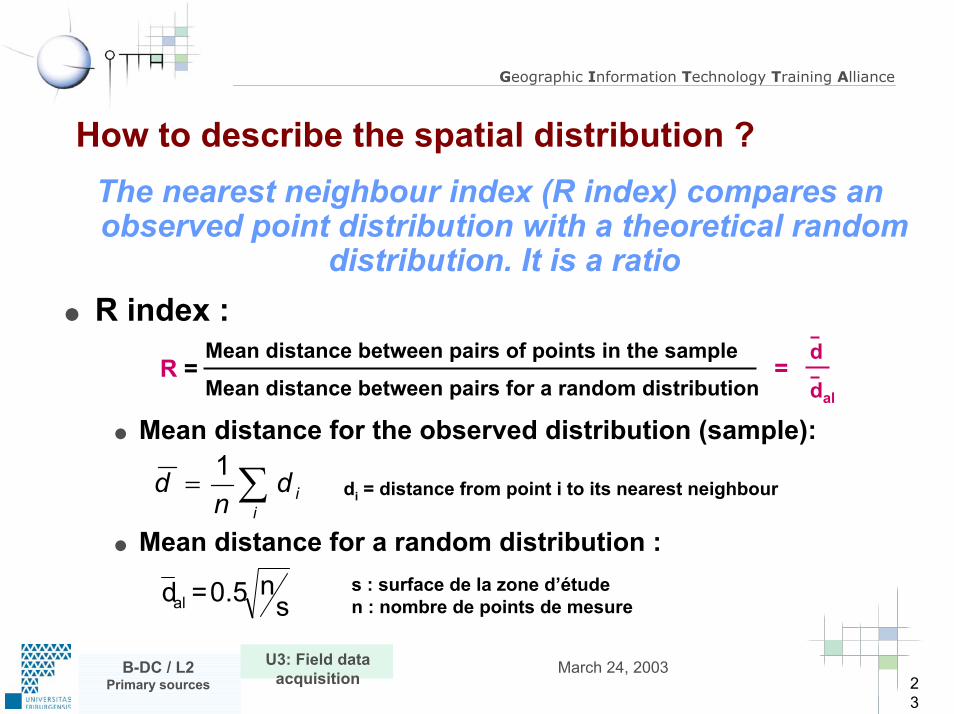
How to describe the spatial distribution ?The nearest neighbour index (R index) compares an observed point distribution with a theoretical random
distribution. It is a ratioR index :
Mean distance for the observed distribution (sample):
Mean distance for a random distribution :
d
dal
Mean distance between pairs of points in the sample=R =
Mean distance between pairs for a random distribution
∑=i
idn
d 1di = distance from point i to its nearest neighbour
sn0.5=dal
s : surface de la zone d’étuden : nombre de points de mesure

24
B-DC / L2Primary sources
Geographic Information Technology Training Alliance
U3: Field data acquisition
March 24, 2003
Comments on the use of R index
Interpretation of the R index value :see previous illustration for the different distributions and their related R value
R = 1 describes a random distribution, 0 ≥ R ≤ 2.1419R value can be statistically tested against a random or regular distribution
How to modify R value from the observed distribution:adding few well located points inside the study area can change a clustered non representative distribution into a random and therefore representative distributionreducing the study area surface can achieve similar effect

25
B-DC / L2Primary sources
Geographic Information Technology Training Alliance
U3: Field data acquisition
March 24, 2003
Spatial sampling techniques
How to produce a spatially representative sample ?The type of spatial distribution to produce is influenced by:
the instrumentation used for field data acquisitionthe phenomenon characteristics to be investigated (variable)the terrain accessibility and the resources available
Several sampling techniques are offered:Simple sampling: random or systematicStratified sampling: random or systematic

26
B-DC / L2Primary sources
Geographic Information Technology Training Alliance
U3: Field data acquisition
March 24, 2003
Simple random sampling
245 255 265X
147
137
127Y
i
Xi
Yi
TechniqueDefine the number of sites n to sampleDefine xi, yi coordinates for each site using a random number table or a random generator
Example of a simple random sample
27
B-DC / L2Primary sources
Geographic Information Technology Training Alliance
U3: Field data acquisition
March 24, 2003
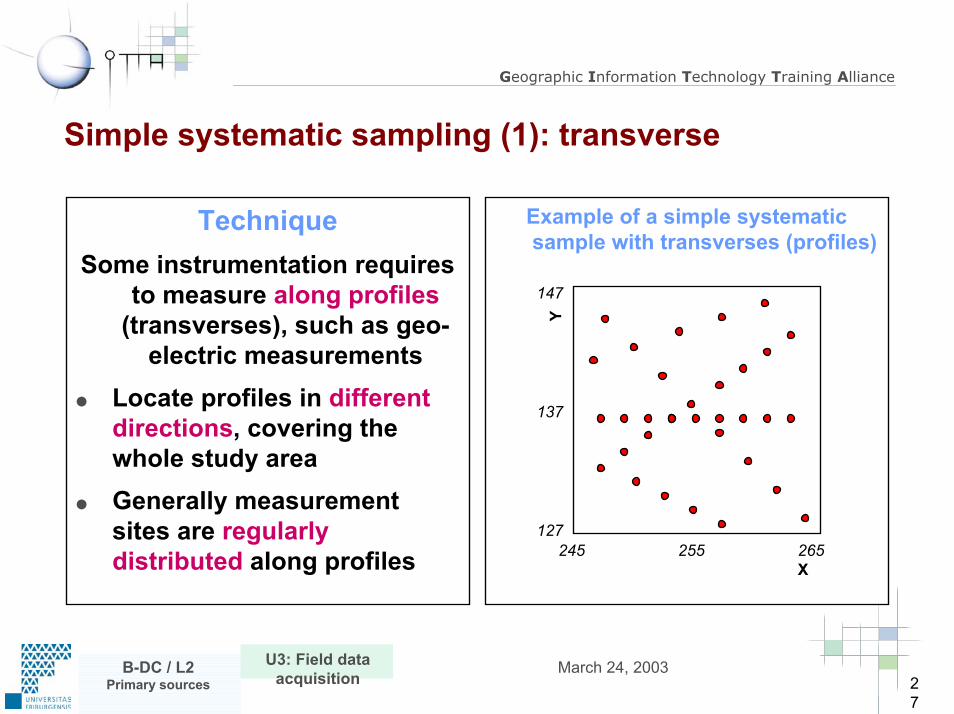
Simple systematic sampling (1): transverse
Example of a simple systematic sample with transverses (profiles)
245 255 265X
147
137
127Y
TechniqueSome instrumentation requires
to measure along profiles(transverses), such as geo-
electric measurementsLocate profiles in different directions, covering the whole study areaGenerally measurement sites are regularly distributed along profiles
28
B-DC / L2Primary sources
Geographic Information Technology Training Alliance
U3: Field data acquisition
March 24, 2003
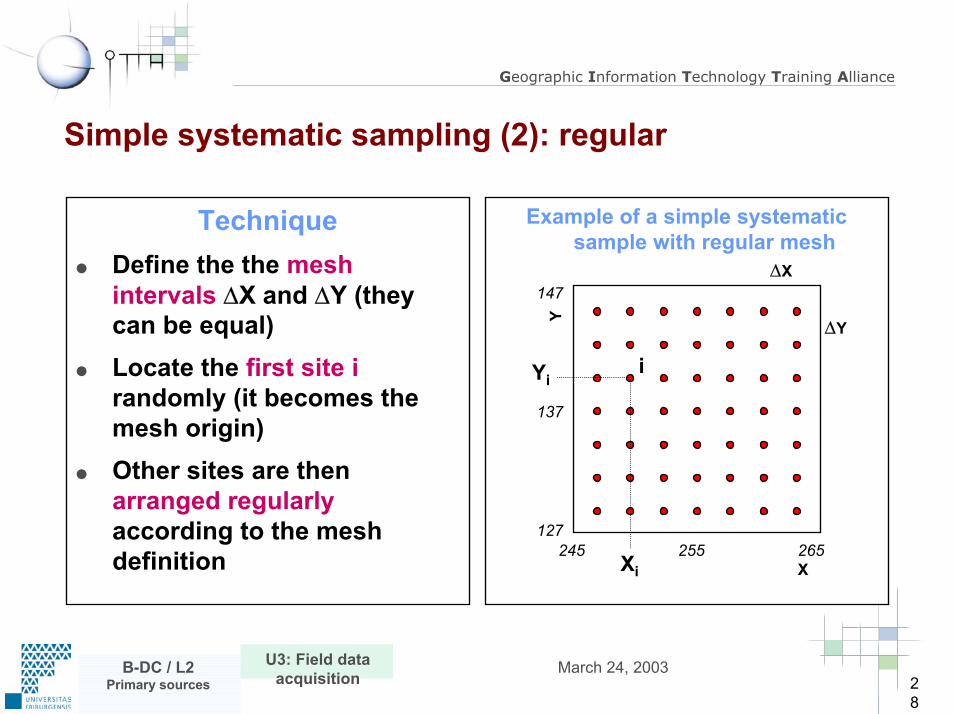
Simple systematic sampling (2): regular
Example of a simple systematic sample with regular mesh
245 255 265X
147
137
127Y
i
Xi
Yi
∆Y
∆X
TechniqueDefine the the mesh intervals ∆X and ∆Y (they can be equal)Locate the first site irandomly (it becomes the mesh origin)Other sites are then arranged regularlyaccording to the mesh definition

29
B-DC / L2Primary sources
Geographic Information Technology Training Alliance
U3: Field data acquisition
March 24, 2003
Stratified sampling (step 1): definition of strataStep 1: definition of strata producing a set of regions
Example of a stratification scheme based on landcover type
245 255 265X
147
137
127Y Forest
Grassland
Forest
TechniqueThe study area is segmented into a set of regions in order to locate a defined number of sites with respect to each stratum or thematic category
Examples: to draw an equal number of sites for the categories forest and grasslandto draw the same number of sites for the 3 objects (regions)

30
B-DC / L2Primary sources
Geographic Information Technology Training Alliance
U3: Field data acquisition
March 24, 2003
Stratified sampling (step 2): sampling within regionStep 2: selection of a sampling technique to apply in each region
Y
X
147
137
127245 255 265
147
137
127245 255 265
Equal representation
Y
X
Stratified random sampling Stratified systematic samplingEqual representation
The 2 strata (forest et grassland) are equally represented with 15 observations randomly distributed: 7+8 and 15
The 2 strata (forest et grassland) are equally represented with 29 observations regularly distributed: 15+14 and 29

31
B-DC / L2Primary sources
Geographic Information Technology Training Alliance
U3: Field data acquisition
March 24, 2003
Temporal representativity
When properties should be acquired ?Selection of the time frame:
According to the model of reality requirements:The period of time to be coveredThe relevant temporal resolution corresponding to the characteristics of the phenomenon to be described (short, medium or long term variations)The synchronicity of measurement throughout space (linked to the temporal variability of the phenomenon)
Not only properties change through time, but consequently spatial features too!

32
B-DC / L2Primary sources
Geographic Information Technology Training Alliance
U3: Field data acquisition
March 24, 2003
Properties change through time
time
Period of time covered
Z High temporal resolution:description of short variations
Prop
erty
Medium temporal resolution:description of medium variations
33
B-DC / L2Primary sources
Geographic Information Technology Training Alliance
U3: Field data acquisition
March 24, 2003
3 Data collectionData collection

34
B-DC / L2Primary sources
Geographic Information Technology Training Alliance
U3: Field data acquisition
March 24, 2003
Acquisition systems
They are means to measure properties from the reality through space and time
They should provide information about:thematic dimension: propertyspatial dimension: locationtemporal dimension: time of measurement
Their components, made of different technologies, are:
the sensor that captures propertiesthe storage device
They influence the acquisition process:sampling technique, production of data in digital form, ...

35
B-DC / L2Primary sources
Geographic Information Technology Training Alliance
U3: Field data acquisition
March 24, 2003
Components of an acquisition systemStorage module
Stores measured signal under following form:
Analog:- alpha-numerical text- graphical- electrical
Digital (media):- magnetic- optical- solid state memory
Sensor module
Senses and translates measured properties as a:
Physical signal
Electrical signal
Chemical signalRealityReality(terrain)(terrain)
The diversity of acquisition systems ranges from a human observer with field pad to an automatic station with wireless data communication

36
B-DC / L2Primary sources
Geographic Information Technology Training Alliance
U3: Field data acquisition
March 24, 2003
Sensor modules
Sensing devicesFor the thematic dimension:
observer, surveyorthermometer, ph-meter
For the spatial dimension:theodolite, GPS
For the temporal dimension:clock, timer
Examples
Observer Theodolite
SondeThermometer

37
B-DC / L2Primary sources
Geographic Information Technology Training Alliance
U3: Field data acquisition
March 24, 2003
Storage modules
Storage devicesDifferent technologies to store data
Form:text: alpha-numericalgraphicelectricdigital
Medium:paper, filmmagnetic, optic, solid state
Examples
Field notes Analog graphic
Magnetic media Solid stateoptic medium

38
B-DC / L2Primary sources
Geographic Information Technology Training Alliance
U3: Field data acquisition
March 24, 2003
Field data in digital form
In order to be processed and structured into the GDB, field data should be set in digital form
From analog to digital formWhen data are stored in an analog form, the conversion into a
digital form requires one of already described digitizing process:Manual entry with the keyboardSemi-automatic digitizing with a digitizing table or on-screen digitizingAutomatic digitizing with a scanner or a camera