Pricing Elements - AESO · Pricing Elements in the Energy Market ... • Under a capacity market...
47
Pricing Elements Energy and Ancillary Service WG8 – October 11, 2017
Transcript of Pricing Elements - AESO · Pricing Elements in the Energy Market ... • Under a capacity market...

Pricing Elements
Energy and Ancillary Service WG8 – October 11, 2017
Pricing Elements in the Energy Market
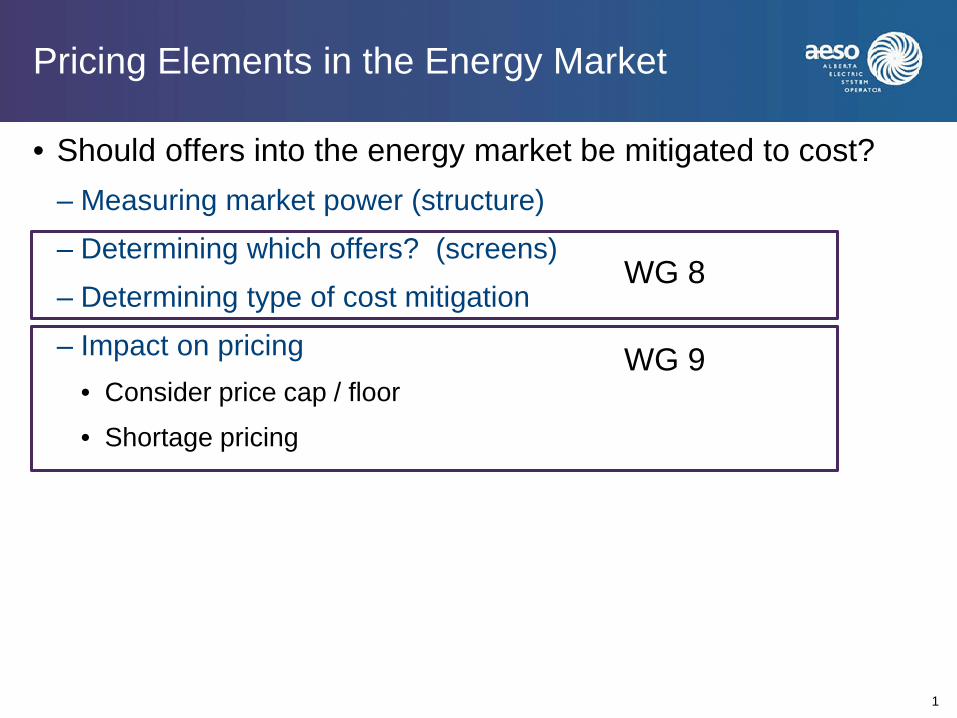
• Should offers into the energy market be mitigated to cost? – Measuring market power (structure) – Determining which offers? (screens) – Determining type of cost mitigation – Impact on pricing
• Consider price cap / floor
• Shortage pricing
1
WG 8
WG 9

Pricing Elements
Component Options Approach Structure Concentration Level
- FEOC reg set at 30% Hold constant
Screens Screens for ability to exercise market power ((based on current asset concentration)
Examine options for screens - Structural screens / RSI - Conduct & Impact - Self evaluation
Offer Mitigation Administrative Levels or Market Based
Examine acceptable costs and options for offer mitigation - SRMC + buffer - Ex ante audit - Soft cap option
Pricing Rules associated with pricing - Price Cap / floor - Shortage pricing - Others – dispatch
tolerance, settlement, etc
Conduct pricing impact analysis - Test for impact on pricing
based on fleet - Examine pricing options as
required
2

Market Power in Alberta
• Under a capacity market framework, competition in the energy market should drive offers to short-run marginal cost (SRMC)
• Conditions exist in AB that hinder competitive outcome: – Small market – Highly concentrated
• Partly mitigated by market share concentration in FEOC reg (30%) – With introduction of capacity market want to ensure that offers
are tested for market power, then mitigated as required to account for separate capacity payment
3

Screens
4

Use of Screens
• To assess which participants have an ability / incentive to exercise market power – Create a screen to test for market power
• If pass screen, offers not mitigated
• If fail screen, offers mitigated
• All energy delivered paid at system marginal price, this simply addresses offer mitigation not payment
• Options – Structural screen – test for pivotal supplier
• Pivotal supplier tests (single and three-pivotal suppler tests)
• Residual supplier Index
– Conduct & Impact Test – Self monitor and evaluate
5

Measures to test competitiveness
• Herfindahl-Hirschman index (HHI) – Measure of market competitiveness using size of firm as input – Equals sum of squares of all firms market share, expressed as a
percentage ranging from 0 to 10 000 (monopoly = 100% x 100%) – More weight to larger firms
• Residual supplier indices – test for pivotal suppliers – Is the firm (plus the next two, for a three-pivotal supplier) needed
to meet demand for that hour? • Want to ensure test for risk of market power without overstating issue
• Three pivotal supplier test in Alberta likely too onerous
• RSI test at some threshold less than 1 more applicable
6

Testing for residual supply/pivotal supply
• A common test for competitiveness of a market is a residual supply or test of pivotal supply where by for every hour, the residual supply for firm (i) is:
• This method tests for the potential for a firm to exercise market power by withholding all (RSIi ≥ 1) or a portion (RSIi < 1) of their capacity.
• Applying the test to a firm for every hour yields a duration curve that illustrates the portion of hours that a firms aggregate supply (across all assets) is needed to meet demand.
• Using a threshold of less than 1 focuses on the key hours when the exercise of market power can be a concern.
7
𝑅𝑅𝑅𝑅𝑅𝑅𝑖𝑖 =∑𝑠𝑠𝑠𝑠𝑠𝑠𝑠𝑠𝑠𝑠𝑠𝑠 − 𝑠𝑠𝑠𝑠𝑠𝑠𝑠𝑠𝑠𝑠𝑠𝑠𝑖𝑖
𝑑𝑑𝑑𝑑𝑑𝑑𝑑𝑑𝑑𝑑𝑑𝑑

Testing for residual supply/pivotal supply (continued)
• Variations of these tests can be applied to determine the residual supply of a single firm or multiple firms (e.g., a three-pivotal supplier test). – As more firms are added to the test, results in a greater
instances of “failing” – Adding more firms serves the purpose of assessing oligopolistic
market power (i.e., the potential for the largest firms in a market to collude to raise prices)
– However, in a concentrated market like Alberta, the three pivotal supplier test may have limited use as it would likely result in failure in almost all hours.
8

Measuring historical competitiveness – 2012 MSA Report …. • These figures, from MSA paper (Measuring Generator Market Power,
2012), demonstrate that during the majority of times, the large firms would fail a structural test of competitiveness if measured at RSI = 1
• Considering a threshold a RSI<1, the test identifies specific hours where the test fails instead of mitigating in all conditions.
– Method using firm-specific residual supplier tests
9
Assumptions for 2021 forecast RSI
• No PPA’s are active and Balancing Pool assets were assigned to their owners.
• Additional assets from the LTO 2017 output were not assigned to existing firms.
• The hourly Available Capabilities were taken from the LTO 2017 output. – The capabilities are gross capabilities.
– Imports were excluded. – Wind and solar are taken into account in the supply.
• For demand, Alberta Internal Load (AIL) forecast from the LTO 2017 was used.
• Five major suppliers were considered for calculating RSI
10

RSI outlook for 2021
11
Further Discussion on Residual Supplier Indices
• RSI tests measures whether or not a firm’s supply is needed to meet demand. – Can be used to gauge the potential for that firm to withhold
capability and impact price or “pivot” the market.
• Setting the threshold level to 1.0 in the duration curve demonstrates the amount of times that the market “needs” all of the firm’s capability to meet demand. – This is a very stringent threshold and perhaps not realistic
because a firm withholding all of their capability would receive no benefit from exercising such market power.
– An alternative to gauge degree of market power is to set this threshold level as some number lower than 1.0
12

Structural Ex-ante Measures
• Test of Residual Supply or Pivotal Supply (see above slides) • Used by PJM • Advantages and Disadvantages
– Advantage – upon setting the threshold, the test is clearly fail or not fail.
– Disadvantage - only measures the potential for market power – not if it’s actually exercised nor if it has adverse outcome. Potential to over-mitigate (thus requiring the need for more administrative measures to counteract)
– May be the case that majority of offers in AB fail, especially if testing RSI/PST = 1
13

Conduct and Impact Ex-ante Measures
• Used by ISO-NE
• Identifying conduct that demonstrates market power
– Does the offer deviate from a pre-determined threshold that proxies SRMC?
• Measuring Impact of offers that exercise market power
– Do the offer and market conditions result in an increase in price above a pre-determined amount?
• If the answer to both these question is “yes,” then the offer is mitigated to SRMC.
• Challenges with conduct and impact tests mainly revolve around identifying SRMC appropriately and identifying the price impact threshold.
• Advantages of using conduct and impact is that it tests and mitigates when market power is being exercised to an unacceptable degree – allows for self-mitigation, to an extent.
14

Ex-post mitigation measures
• Advantages – Less administratively burdensome – After-the-fact knowledge and analysis of actual events can result
in more accurate identification of abuse of market power
• Disadvantages – Potentially higher regulatory/compliance risk for market
participants. You don’t know if you’re breaking rules until after-the-fact • Clear guiding documents could offset this risk
• Considerations for how it can be effectively used in a capacity market framework
15

Summary / Conclusions
• Structural
– HHI – measuring market share concentration • Rough measure, weighted to identify large participants
– RSI to identify 5% of hours where market power issues exist • Because this is a test for potential market power, the threshold levels need to
be assessed carefully to as to not over-mitigate
• Preliminary analysis based on forecast of 2021 an example of how it would focus on companies in particular hours.
• Conduct and Impact
– Further discussion is required if this path is chosen • What level above SRMC constitutes failing “conduct”
• What price increase constitutes failing “impact”
• Ex poste mitigation
– Likely to continue to some degree
16

Offer Mitigation
Title slides – offer mitigation
17
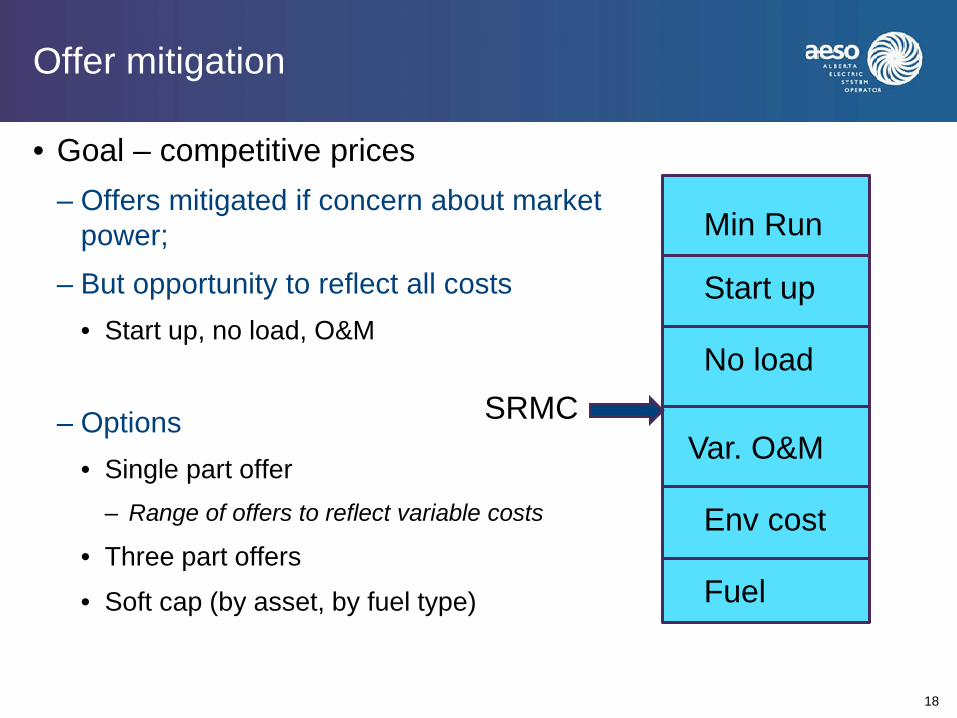
Offer mitigation
• Goal – competitive prices – Offers mitigated if concern about market
power; – But opportunity to reflect all costs
• Start up, no load, O&M
– Options • Single part offer
– Range of offers to reflect variable costs
• Three part offers
• Soft cap (by asset, by fuel type)
18
Fuel
Env cost
Var. O&M
No load
Start up
Min Run
SRMC

Competitive Outcomes
• Short-run Marginal Cost (SRMC) – many cost-elements to consider including; however the goal is to
focus on converging offers to competitive offers which should be measured by SRMC.
– Brattle proposed “all costs that a supplier without market power would include in forming its profit-maximising offer” • includes all costs of generating energy over a dispatch cycle that
would not have been incurred if the generator had been available but not running
• fuel and non-fuel startup costs amortised over a reasonable expectation of output; all fuel costs once the unit is started up (including no-load costs); operating and maintenance costs that increase when producing energy; and any opportunity cost, such as the opportunity cost of fuel that could otherwise have been sold
19
Challenges with determining short-run marginal cost
• How to assess SRMC for – As a starting point, even assuming away cogens, loads, variable
assets that would likely pass the screen, it is still difficult to assess SRMC
– There are standard costs available / used in modelling • Basic entries for costs per technology
• Would have to be adapted as technology changes but sets standard for costs.
– Audit model could allow for costs to be submitted is above “standard” amounts
– Opportunity cost more difficult. • Would still need to consider whether opportunity cost offers are
acceptable and determine how to measure / test
20

Cost assumptions in the 2017 LTO
21
Generation Cost AssumptionsUnit Combined Cycle1 Simple Cycle Coal-to-Gas Wind PV Solar
Installed Capacity (MW) 455 47.5 368-406 50 15Avg. Capacity Factor2 (%) 56% - 71% 3% - 25% 2%-13% 33% - 39% 16% - 19%Heat Rate (GJ/MWh) 6.7 9.6 10 - 12 - -CO2 Emissions3 (Tonne/MWh) 0.375 0.538 0.560-0.672 - -Overnight Capital Costs (2017 $Cdn/kW) $1,500 - $1,950 $1,000 - $1,500 $225 $2,000 $1,330 - $2,100Fixed O&M (2017 $Cdn/kW-yr) $27 $18 $22 $62 $46Variable O&M (2017 $Cdn/MWh) $8 $4 $4 $0 $0Natural Gas Price4 (2017 $Cdn/GJ)
1. 1x1 combined cycle2. Model output by technology over forecast horizon3. Calculated using 56 kg CO2/GJ and Heat Rate4. Range represents annual average prices between 2017 to 2039
$2.61 - $3.49
The cost assumptions in the 2017 LTO form a starting point on cost discussions. These represent standard cost inputs as collected from industry.

Challenges with determining short-run marginal cost
• Because ex-ante mitigation measures result in potential mitigation before actual costs are incurred, reference levels set around SRMC will always be based on estimated or approximated costs.
• The timeframe for evaluation impacts the determination of costs – For example, expectations of cycling and its impact on
maintenance costs, environmental conditions change the calculation on a immediate timeframe
– Given these dynamics, a range around costs may be acceptable
22

Challenges with determining short-run marginal cost
• Single-part offer vs. multi-part offer – If in single part offer, will need to allow range to reflect fact that
SRMC (fuel, env cost, variable O&M) doesn’t reflect full on costs especially depending on cycling costs • Could set range at 20-30% above costs by fuel
– 300% number from other markets reflected competitive zone with no market power, that is no need to bid mitigate
• Could set soft cap and not make it purely cost based.
– A multi part offer specifically is used in optimization models and reflects the incremental costs for start up, no load, minimum run separately • In this model, ranges can have tighter margins as each part of the
offer can more accurately capture a cost-element.
23

Bid mitigation Options
• Type of bid structure – Single part – Multi part
• Range versus soft cap – Submitted costs / ex ante / audit model – SRMC plus range – Soft cap model
24

Bid Structure: Single-part offer vs. multi-part offer
25
• Single-part offer
– Currently used in AB
– Pool participants submit offers for each asset that comprise of a single price associated with a specific quantity
– Single price is meant to capture all of the relevant costs associated with the corresponding volume
• Multi-part offers
– Some jurisdictions employ a multi-part offer that differentiates between cost elements such as: • Start-up costs
• No-load costs
• Incremental energy costs
– Multi-part offers reveal explicit cost elements that enable the potential for more detailed cost schedules (mitigated offers)

Options: Single-part offer vs. multi-part offer and defined costs versus range.
• Because single-part bids must capture all cost elements into one price-quantity offer, there are more “unknown” elements. – Likely an inherent relationship between certainty of cost
estimation and single-part vs. multi-part offer: – Range / offer cap likely larger in single part offer model
26
Highly-Stringent (less “range”)
Less Stringent (more “range”)
Single-part offer
Multi-part offer

SRMC and Reference Levels
• Applying SRMC to a reference level (cost-based offer) • Can be applied at a asset-class/technology-type level or unit-
specific level – Other alternatives?
• What cost elements does SRMC and corresponding reference levels capture?
• How to assess SRMC for
– Co-gen assets – Renewables – Import / hydro assets
27

Reference Levels by Category
• Unit Specific – Most granular level, potential to capture the unique operating
characteristics or each individual asset – Requires market participants to submit information for each asset
• Asset-type/technology – Requires wider set of assumptions regarding costs by technology
• Potentially requiring more wider “bands” around costs
– Further exploration of what differentiates asset-types required
• Market wide – In practice, very similar to current market (system-wide offer cap,
only based in some manner on production cost)
• Others? 28

Cost-elements Included in Reference Levels
• Fuel
• Environmental
• Variable O&M
• Expected cycling and start-up costs?
• No-load costs
• Others? Action item for WG – what can be included?
• Problem with uncertainty of these elements – need for a “range”?
– How to apply this range?
– Two approaches – integrate all these elements (on a best estimate basis) into the calculation of SRMC but keep a lower buffer; OR, include the elements that can be estimated with greatest accuracy and increase the buffer.
29

Soft-cap (offer bands by asset type)
• No need for individual resources to submit cost-offers determined through a regulatory approval process
• Can be wide enough to cover the uncertainty in determining costs.
30

Administering Reference Levels (for future discussion)
• Submitting SRMC – Using proxies for resource-types determined at an industry-wide
basis? – Defined at the an asset-level and submitted by market
participants?
• Approval process?
31

Summary
• Use RSI < 1 for screen – Hourly basis
• Use basis for SRMC for cost mitigation subject to: – Measurement index – at fuel type? – Determining baseline of typical costs – fuel, env, O&M? – Determining range for “other costs” – 20%?
• For discussion
32

Next steps – Modelling, pricing options
33
Next steps – WG9
• Pricing components – Pricing methodology
• Single price / uplifts?
• Settlement interval
• Price cap / floor
• Shortage / scarcity pricing – Link to NDV results / flexibility needs
34

Next Steps
Based on these assumptions for screen / costs, the next step is to calculate any need for changes to price cap/floor / shortage pricing and assess likely pricing in this model and their impact on incentives for investment The goals of this analytical exercise will be to: • Better understand how different ex ante market power
mitigation options may impact energy prices and generator energy market revenues
• Demonstrate how different options would work and identify potential tradeoffs
• Test conclusions given uncertainties in load, generator outages, wind penetration levels, and different scarcity pricing regimes
35
Proposed Modelling and Analysis of Mitigation Alternatives
• The AESO has engaged Brattle so perform some quantitative analysis on the price impact of various mitigation alternatives.
• The following is a review of the draft methodology proposed by Brattle. – Overview and purpose – Market power mitigation scenarios – Market modeling framework and assumptions
• The proposed method is subject to continued review and is being raised to the working group to discuss and provide feedback.
36

Purpose (cont.)
This analysis will not: • Evaluate impact of market power on market efficiency
– This will not be a market power analysis
• Evaluate long-term impacts on supply resource mix absent a capacity market – Will work in tandem with capacity market analysis, to inform
estimates of generator net energy and ancillary services revenues that will “offset” offers in the capacity market
37

Overview
Brattle will use an existing model to analyze the relationship between supplier offer mitigation and market prices in the energy market under a variety of conditions. The analysis will: • Examine the historical and projected relationship between
“tightness” of market (supply minus demand, or supply cushion) and the marginal unit’s offer (& market price)
• Also examine the historical relationship between estimates of generator costs and the marginal unit’s offer (& market price)
• Apply that relationship to a future supply curve and future load levels to estimate market prices on an hourly basis – Assuming alternative market power mitigation options
continued...
38

Overview (cont.)
• We will evaluate the potential impact of the following uncertainties: – Load variability – Generator outages – Intertie availability
39
Overview (cont.)
The analysis will be designed to also address the following:
• Evaluate pricing and revenue sufficiency under different future market pricing approaches:
– Price caps and floors
– Shortage pricing mechanisms
Assumptions used in the analyses will be:
• Available to the working group members
• Consistent with other AESO analyses:
– Use AESO’s 2017 LTO reference case data to the extent possible
The simulations results will be presented to the Working Group
40

Pricing Elements in the Energy Market
When evaluating the potential impact of offer mitigation on market prices, the analyses will test various approaches to mitigate offer prices:
– Consideration for different types of offer mitigation will include: • Unmitigated offers using historical patterns (that are related to supply
cushion)
• Offers at suppliers’ variable operating costs
• Offers at a band around suppliers’ variable operating costs
– Considerations for different price caps and floors – Considerations for different approaches for shortage pricing
41

Our scenarios capture bookends (unmitigated/tight mitigation) and two cases in-between
Proposed Market Power Mitigation Scenarios
Unmitigated Lower Price Cap Soft Offer Cap Tight Mitigation Status Quo—
supply can offer anywhere from
price floor ($0) to general price cap
($999.99)
Unmitigated offers but lower general
price cap
All offers mitigated to within a specified
band (e.g., minimum of +200%
and +$100 marginal cost
All offers mitigated to resource-specific
marginal cost
42

Market Modeling Framework and Assumptions
Future Supply and Demand
Based on the 2017 Long Term Outlook (LTO) • https://www.aeso.ca/grid/fore
casting/
43
Assumption Future year 2030 Load growth 0.9%/year Load shape 2014 Generator retirements
All coal-fired by 2030
Renewable additions
5,000 MW (REP) 30% by 2030
Conventional additions
2,400 MW natural gas conversions
+ 13,900 MW new capacity

Market Modeling Framework and Assumptions
Uncertainty and Monte Carlo
• Load: based on actual hourly variability found in 1998–2014 hourly loads
• Generator availability: based on varying historical capacity installed vs. on outage in 1998–2014
• Intertie availability: based on varying historical flows vs. available transfer capability in 2001–2015
44

Market Modeling Framework and Assumptions
Supply Cushion versus Pool Price
• Non-scarcity conditions – Supply cushion >1,000
MW – Price relationship based
on Aurora outputs
• Scarcity conditions – Supply cushion <1,000
MW – Historical relationship,
adjusted for assumed prices at cap ($1,000) if negative supply cushion
45
Aurora Energy Prices
Offer-based Scarcity Prices
Historical Energy Prices
Non-Scarcity Pricing from Aurora
Operating Reserve
Shortage

Market Modeling Framework and Assumptions
Key Output Metrics
• Energy market revenue margin for each technology – Energy market revenues margins minus going-forward costs
(energy revenues minus variable costs as compared to going-forward costs) – this would show the net-CONE needed under different pricing arrangements
– For generic new entrant combined cycle and combustion turbine – Under different market mitigation approaches; – Given different scarcity pricing regimes; – And under different levels of reserve margins
• Average energy market prices under each case • And, market price profile among certain time periods
(peak/off-peak; scarcity vs. non-scarcity)
46