PRESENTED BY Epoch’s Quarterly Capital Markets in this presentation are forward looking statements...
22
David N. Pearl Executive Vice President and Co-CIO William W. Priest Chief Executive Officer and Co-CIO PRESENTED BY Josepha Kaufman Managing Director Senior Research Analyst The information contained in this presentation is distributed for informational purposes only and should not be considered investment advice or a recommendation of any particular security, strategy or investment product. Information contained herein has been obtained from sources believed to be reliable, but not guaranteed. The information contained in this presentation is accurate as of the date submitted, but is subject to change. Any performance information referenced in this presentation represents past performance and is not indicative of future returns. Any projections, targets, or estimates in this presentation are forward looking statements and are based on Epoch’s research, analysis, and assumptions made by Epoch. There can be no assurances that such projections, targets, or estimates will occur and the actual results may be materially different. Other events which were not taken into account in formulating such projections, targets, or estimates may occur and may significantly affect the returns or performance of any accounts and/or funds managed by Epoch. To the extent this presentation contains information about specific companies or securities including whether they are profitable or not, they are being provided as a means of illustrating our investment thesis. Past references to specific companies or securities are not a complete list of securities selected for clients and not all securities selected for clients in the past year were profitable. Epoch’s Quarterly Capital Markets Outlook July 23, 2014 | The webinar replay will be available on our website: www.eipny.com
-
Upload
phungkhanh -
Category
Documents
-
view
214 -
download
1
Transcript of PRESENTED BY Epoch’s Quarterly Capital Markets in this presentation are forward looking statements...

David N. Pearl
Executive Vice President and Co-CIO
William W. Priest
Chief Executive Officer and Co-CIO
PRESENTED BY
JosephaKaufman
Managing Director Senior Research Analyst
The information contained in this presentation is distributed for informational purposes only and should not be considered investment advice or a recommendation of any particular security, strategy orinvestment product. Information contained herein has been obtained from sources believed to be reliable, but not guaranteed. The information contained in this presentation is accurate as of the datesubmitted, but is subject to change. Any performance information referenced in this presentation represents past performance and is not indicative of future returns. Any projections, targets, orestimates in this presentation are forward looking statements and are based on Epoch’s research, analysis, and assumptions made by Epoch. There can be no assurances that such projections,targets, or estimates will occur and the actual results may be materially different. Other events which were not taken into account in formulating such projections, targets, or estimates may occur andmay significantly affect the returns or performance of any accounts and/or funds managed by Epoch. To the extent this presentation contains information about specific companies or securitiesincluding whether they are profitable or not, they are being provided as a means of illustrating our investment thesis. Past references to specific companies or securities are not a complete list ofsecurities selected for clients and not all securities selected for clients in the past year were profitable.
Epoch’s Quarterly Capital Markets Outlook
July 23, 2014 | The webinar replay will be available on our website: www.eipny.com
If you wish to ask a question, please click on the question mark icon located on the top of the screen.
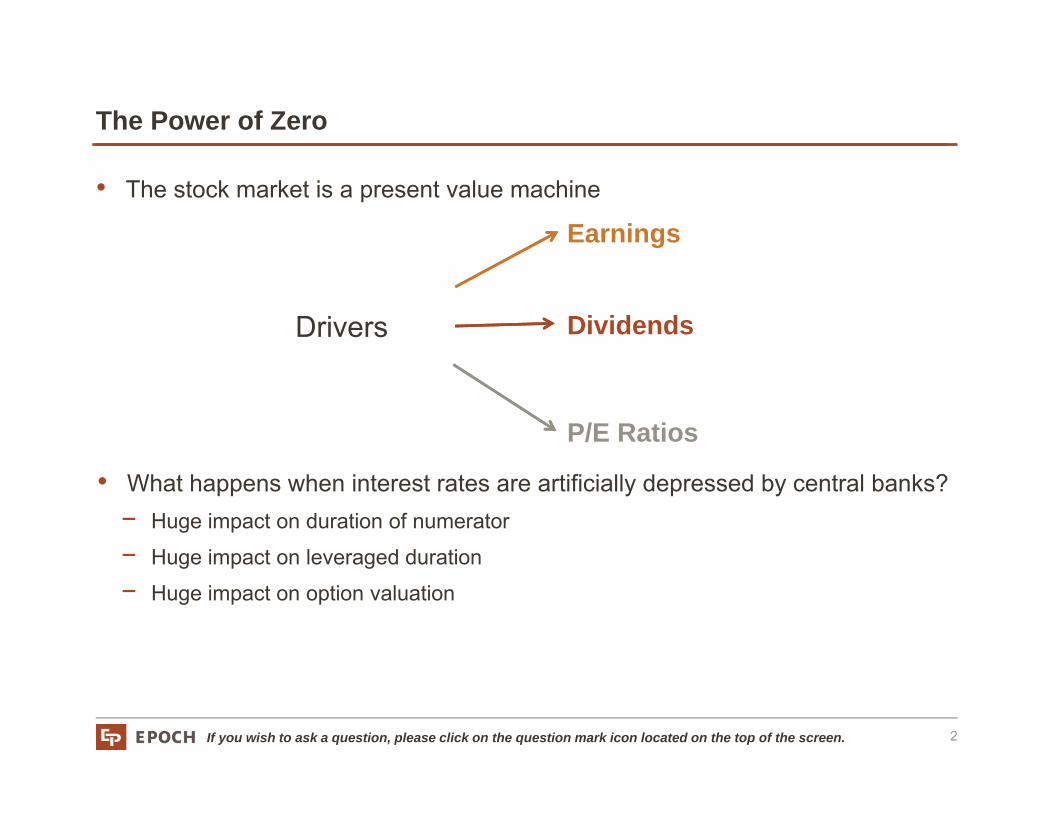
The Power of Zero
2
• The stock market is a present value machine
• What happens when interest rates are artificially depressed by central banks?− Huge impact on duration of numerator
− Huge impact on leveraged duration
− Huge impact on option valuation
Earnings
Dividends
P/E Ratios
Drivers
If you wish to ask a question, please click on the question mark icon located on the top of the screen.
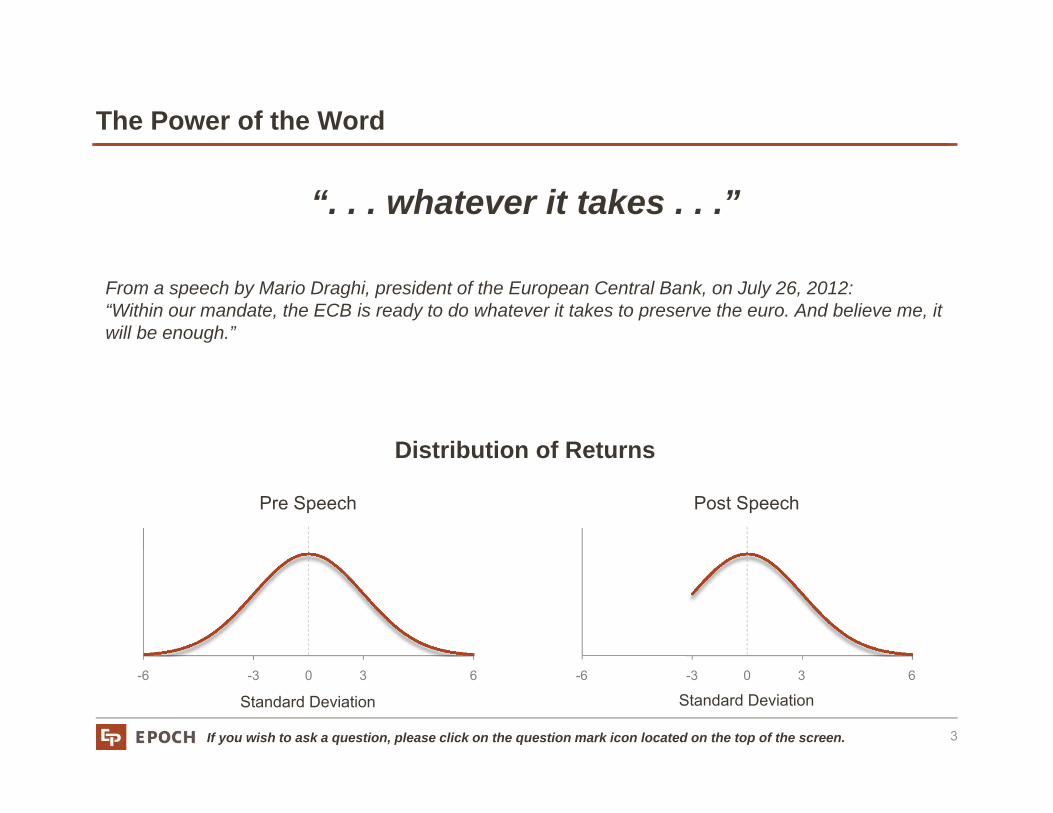
The Power of the Word
3
From a speech by Mario Draghi, president of the European Central Bank, on July 26, 2012: “Within our mandate, the ECB is ready to do whatever it takes to preserve the euro. And believe me, it will be enough.”
“. . . whatever it takes . . .”
Pre Speech Post Speech
Standard Deviation
Distribution of Returns
Standard Deviation0 3 6-3-6 0 3 6-3-6

If you wish to ask a question, please click on the question mark icon located on the top of the screen.
1,250
1,350
1,450
1,550
1,650
1,750
1,850
1,950
2,050S&P 500
S&P 500 and Forward Earnings Multiples
Index
Source: Standard & Poors, Yardini Research, Epoch Investment Partners; June 2014
Quantitative Easing has Fueled Equity Markets
4
12x
13x
14x
15x
Extension of Twist
QE3
QE3 Expanded
Taper Tantrum
No Taper at Meeting
Yellen Nomination
16x
If you wish to ask a question, please click on the question mark icon located on the top of the screen.
0
100
200
300
400
500
600
2007 2008 2009 2010 2011 2012 2013 2014 2015 2016
Fed ECB BoJ BOE
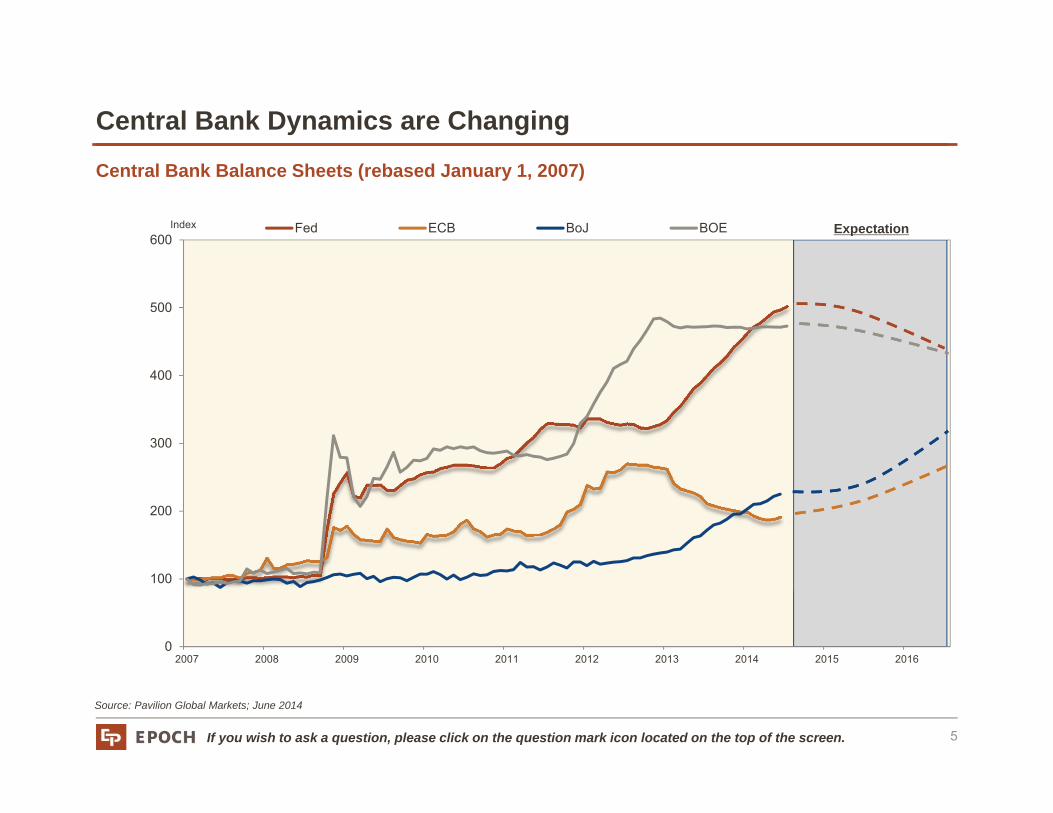
Central Bank Balance Sheets (rebased January 1, 2007)
Source: Pavilion Global Markets; June 2014
Central Bank Dynamics are Changing
5
Index Expectation
If you wish to ask a question, please click on the question mark icon located on the top of the screen.
0
10
20
30
40
50
60
70
80
90
2004 2005 2006 2007 2008 2009 2010 2011 2012 2013 2014
VIX
0
2
4
6
8
10
12
14
2006 2007 2008 2009 2010 2011 2012 2013 2014
Spain Portugal Italy Germany U.S.
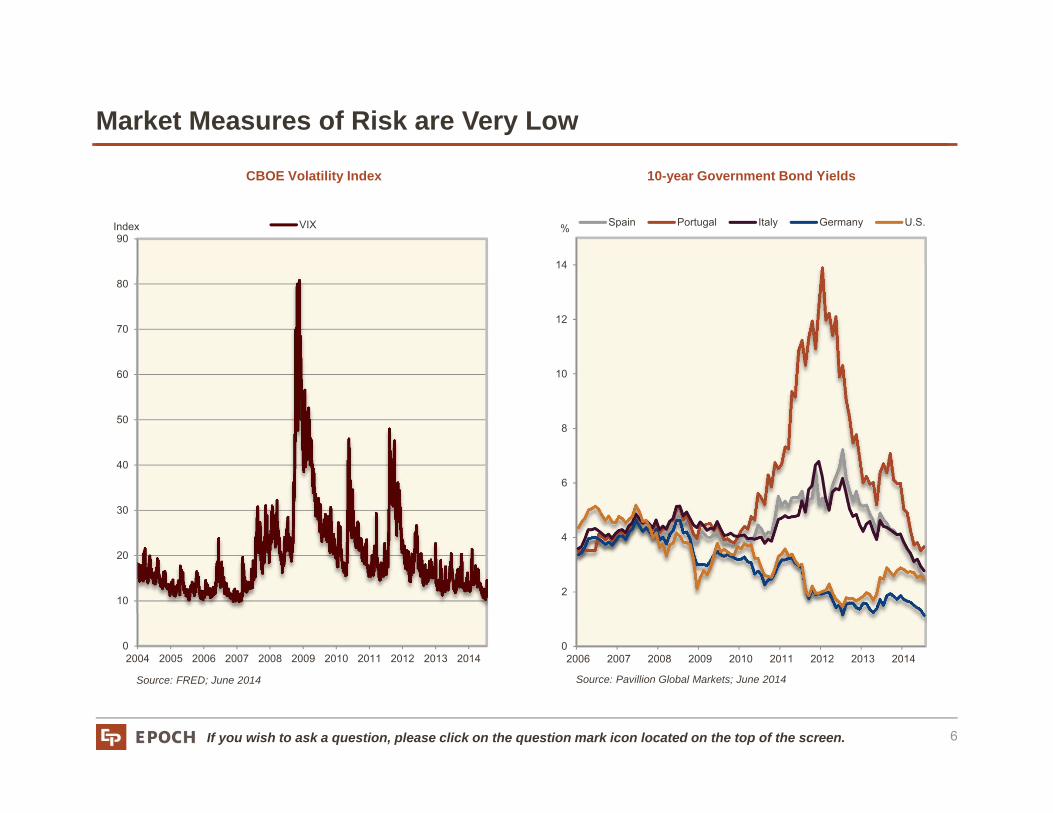
CBOE Volatility Index
Source: FRED; June 2014
Market Measures of Risk are Very Low
6
%Index
10-year Government Bond Yields
Source: Pavillion Global Markets; June 2014
If you wish to ask a question, please click on the question mark icon located on the top of the screen.
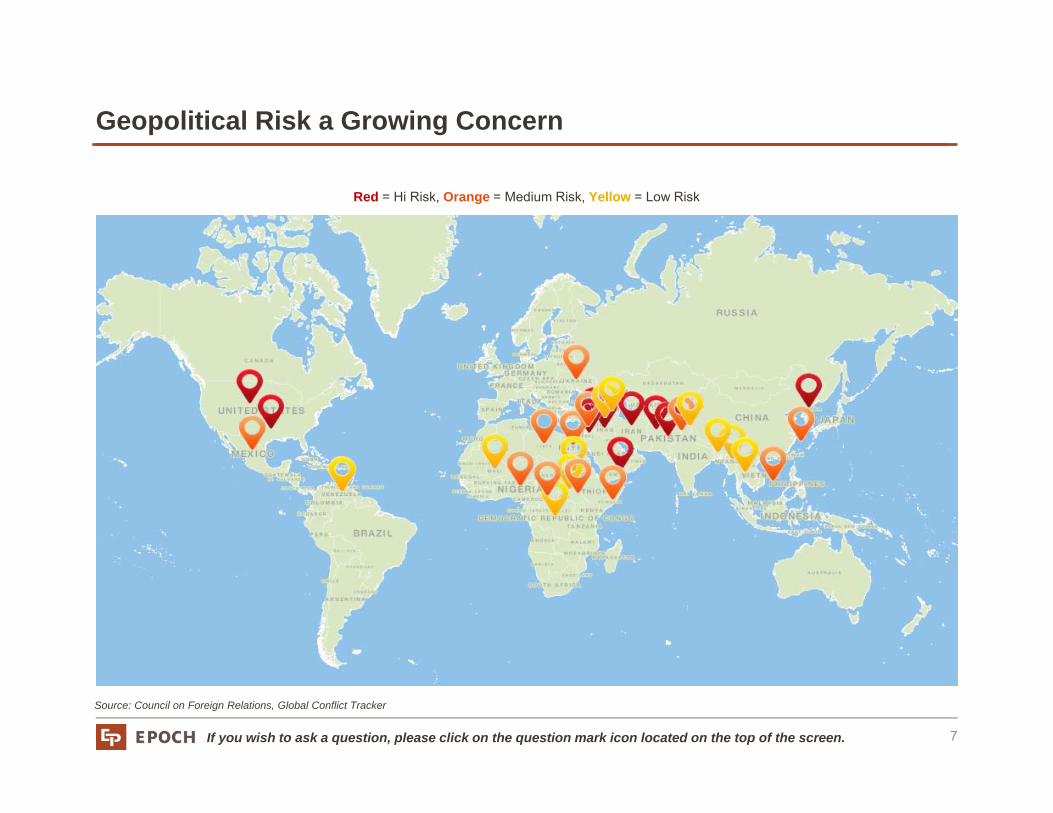
Geopolitical Risk a Growing Concern
Source: Council on Foreign Relations, Global Conflict Tracker
Red = Hi Risk, Orange = Medium Risk, Yellow = Low Risk
7
If you wish to ask a question, please click on the question mark icon located on the top of the screen.
60
70
80
90
100
110
120
2007 2008 2009 2010 2011 2012 2013 2014
Eurozone U.S. Japan U.K.
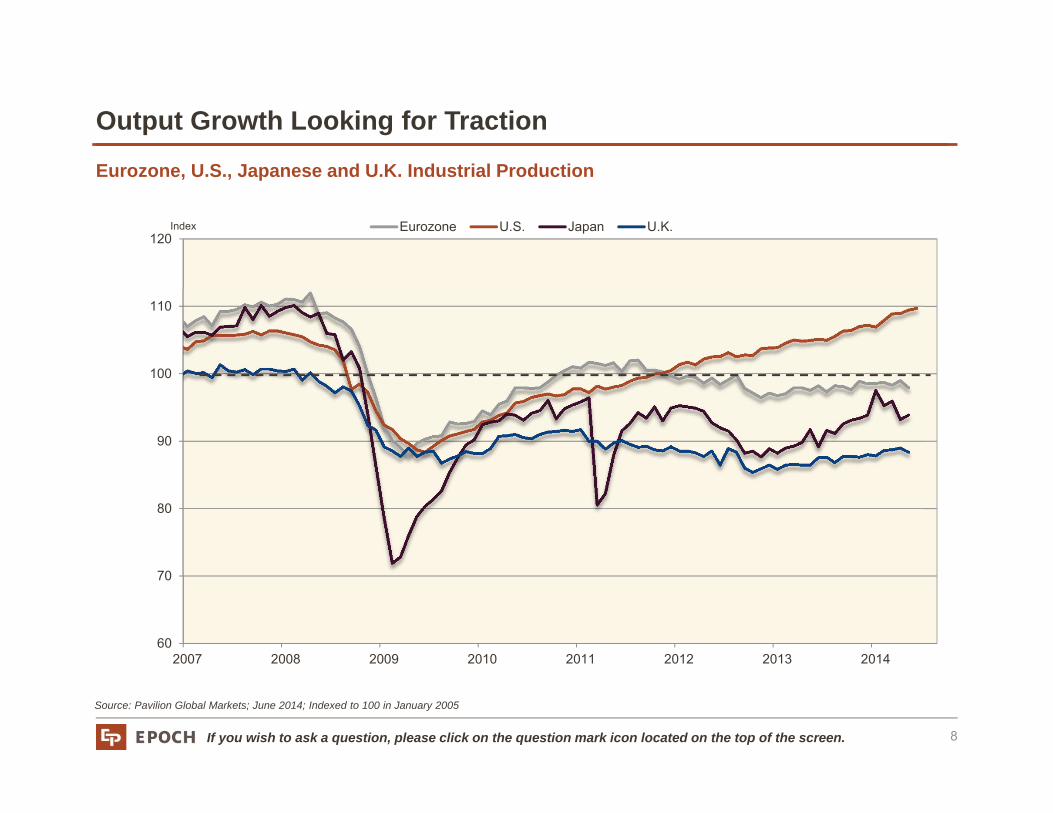
Eurozone, U.S., Japanese and U.K. Industrial Production
Source: Pavilion Global Markets; June 2014; Indexed to 100 in January 2005
Output Growth Looking for Traction
8
Index
If you wish to ask a question, please click on the question mark icon located on the top of the screen.
-1
0
1
2
3
4
5
Jan-06 Jan-07 Jan-08 Jan-09 Jan-10 Jan-11 Jan-12 Jan-13 Jan-14
Euro Area
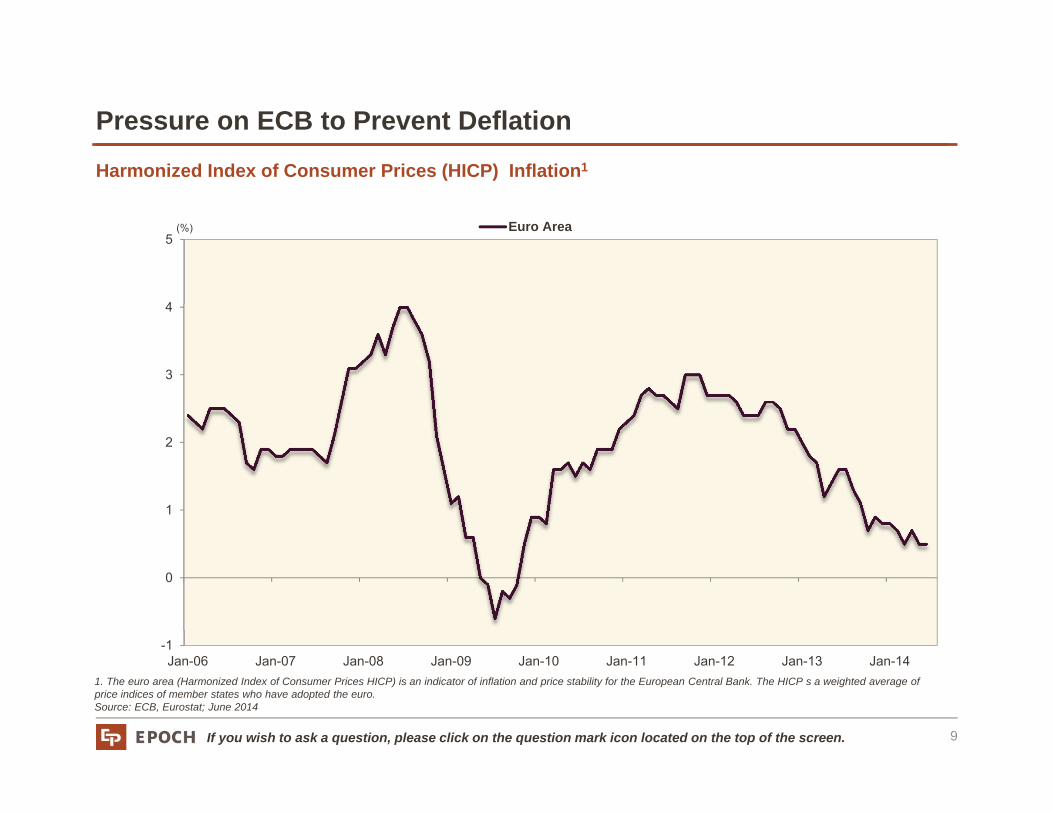
Harmonized Index of Consumer Prices (HICP) Inflation1
1. The euro area (Harmonized Index of Consumer Prices HICP) is an indicator of inflation and price stability for the European Central Bank. The HICP s a weighted average of price indices of member states who have adopted the euro. Source: ECB, Eurostat; June 2014
Pressure on ECB to Prevent Deflation
9
(%)
If you wish to ask a question, please click on the question mark icon located on the top of the screen.
-15
-5
5
15
25
-9 -8 -7 -6 -5 -4 -3 -2 -1 0 1 2 3 4 5 6 7 8
1997 2014
90
100
110
120
-9 -8 -7 -6 -5 -4 -3 -2 -1 0 1 2 3 4 5 6 7 8
1997 2014
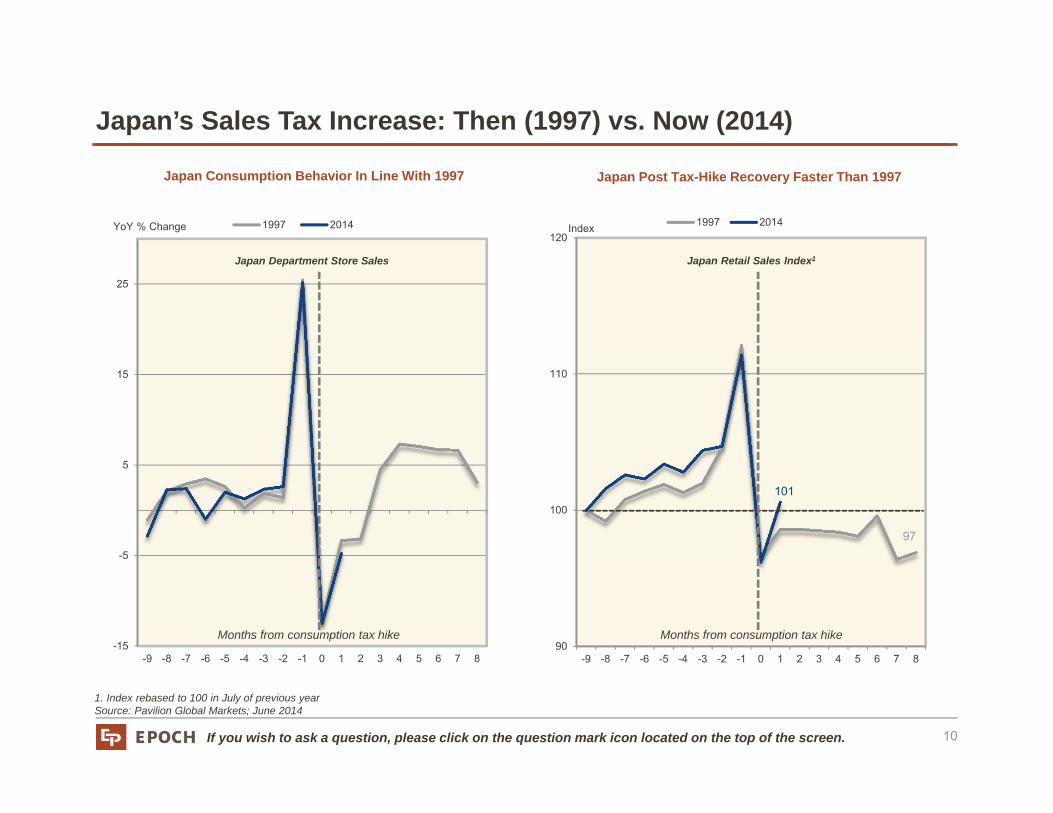
Japan Consumption Behavior In Line With 1997
1. Index rebased to 100 in July of previous year Source: Pavilion Global Markets; June 2014
Japan’s Sales Tax Increase: Then (1997) vs. Now (2014)
10
Index
101
97
Months from consumption tax hikeMonths from consumption tax hike
YoY % Change
Japan Post Tax-Hike Recovery Faster Than 1997
Japan Department Store Sales Japan Retail Sales Index1
If you wish to ask a question, please click on the question mark icon located on the top of the screen.
5
10
15
20
25
30
35
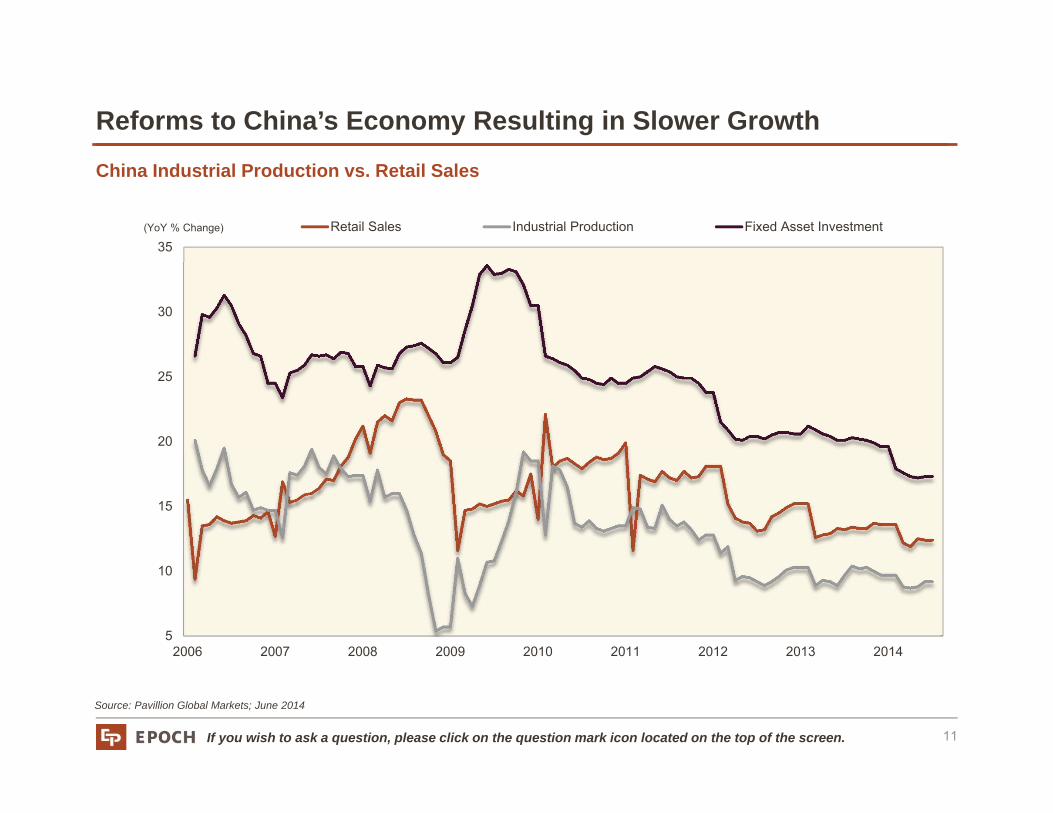
2006 2007 2008 2009 2010 2011 2012 2013 2014
Retail Sales Industrial Production Fixed Asset Investment
China Industrial Production vs. Retail Sales
Source: Pavillion Global Markets; June 2014
Reforms to China’s Economy Resulting in Slower Growth
11
(YoY % Change)

If you wish to ask a question, please click on the question mark icon located on the top of the screen.
European Research Trip: Josepha Kaufman
12
If you wish to ask a question, please click on the question mark icon located on the top of the screen.
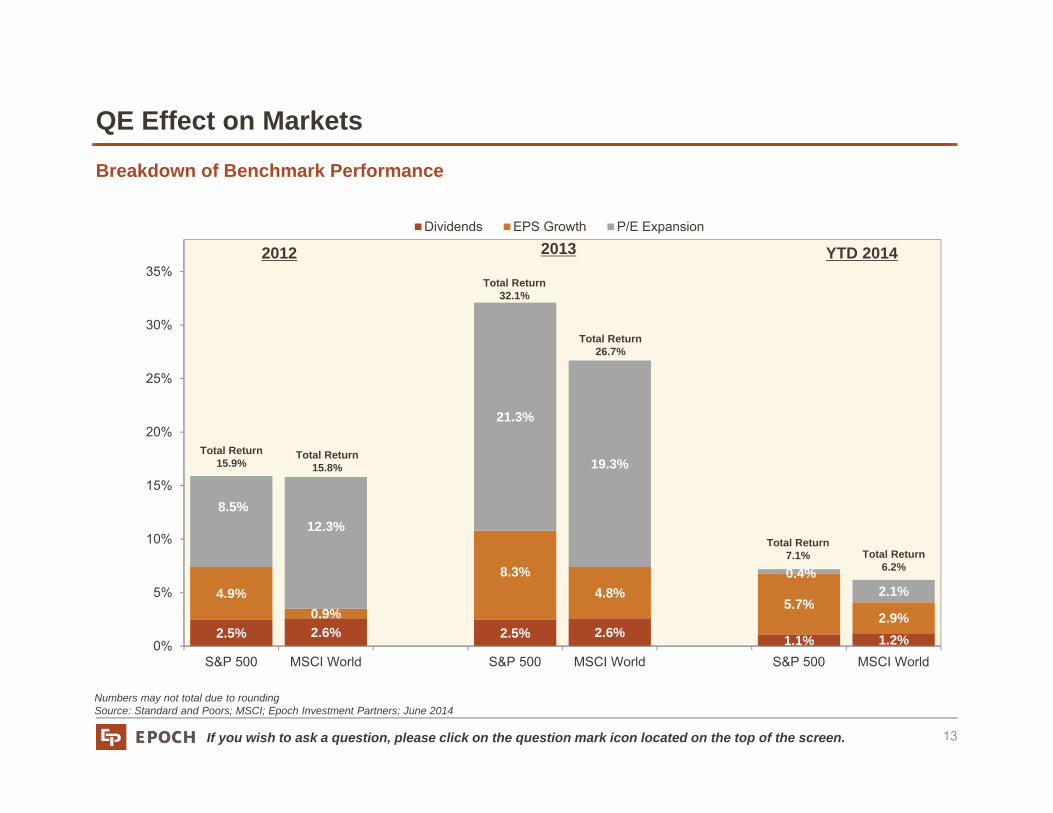
2.5% 2.6% 2.5% 2.6% 1.1% 1.2%
4.9%0.9%
8.3%4.8%
5.7%2.9%
8.5%12.3%
21.3%
19.3%
0.4%2.1%
0%
5%
10%
15%
20%
25%
30%
35%
S&P 500 MSCI World S&P 500 MSCI World S&P 500 MSCI World
Dividends EPS Growth P/E Expansion
Breakdown of Benchmark Performance
Numbers may not total due to roundingSource: Standard and Poors; MSCI; Epoch Investment Partners; June 2014
QE Effect on Markets
13
2012 YTD 20142013
Total Return15.9%
Total Return15.8%
Total Return32.1%
Total Return26.7%
Total Return7.1% Total Return
6.2%
If you wish to ask a question, please click on the question mark icon located on the top of the screen.
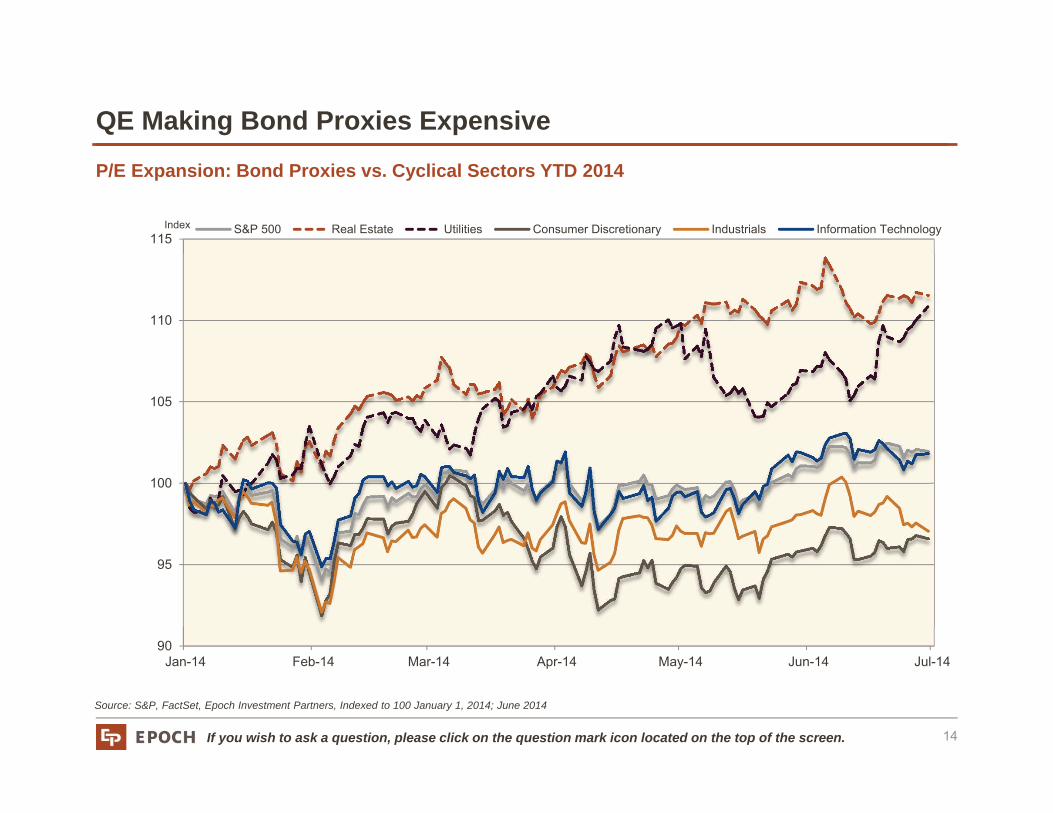
P/E Expansion: Bond Proxies vs. Cyclical Sectors YTD 2014
Source: S&P, FactSet, Epoch Investment Partners, Indexed to 100 January 1, 2014; June 2014
QE Making Bond Proxies Expensive
14
90
95
100
105
110
115
Jan-14 Feb-14 Mar-14 Apr-14 May-14 Jun-14 Jul-14
S&P 500 Real Estate Utilities Consumer Discretionary Industrials Information TechnologyIndex

If you wish to ask a question, please click on the question mark icon located on the top of the screen.
58
59
60
61
62
63
64
65
66
67
68
1948 1958 1968 1978 1988 1998 2008
Workforce as a Percent of Working Age Population
Participation Rate Assuming No Change In Age Participation from 2004-2005 Average
U.S. Labor Participation Rate
Source: Bureau of Labor Statistics, Epoch Investment Partners; June 2014
Much of the Decline in the Participation Rate is Structural
15
(%)
If you wish to ask a question, please click on the question mark icon located on the top of the screen.
0.0
0.5
1.0
1.5
2.0
2.5
3.0
3.5
4.0
4.5
5.0
1985 1987 1989 1991 1993 1995 1997 1999 2001 2003 2005 2007 2009 2011 2013
Recession Avg Hourly Earnings: Total Private Industries
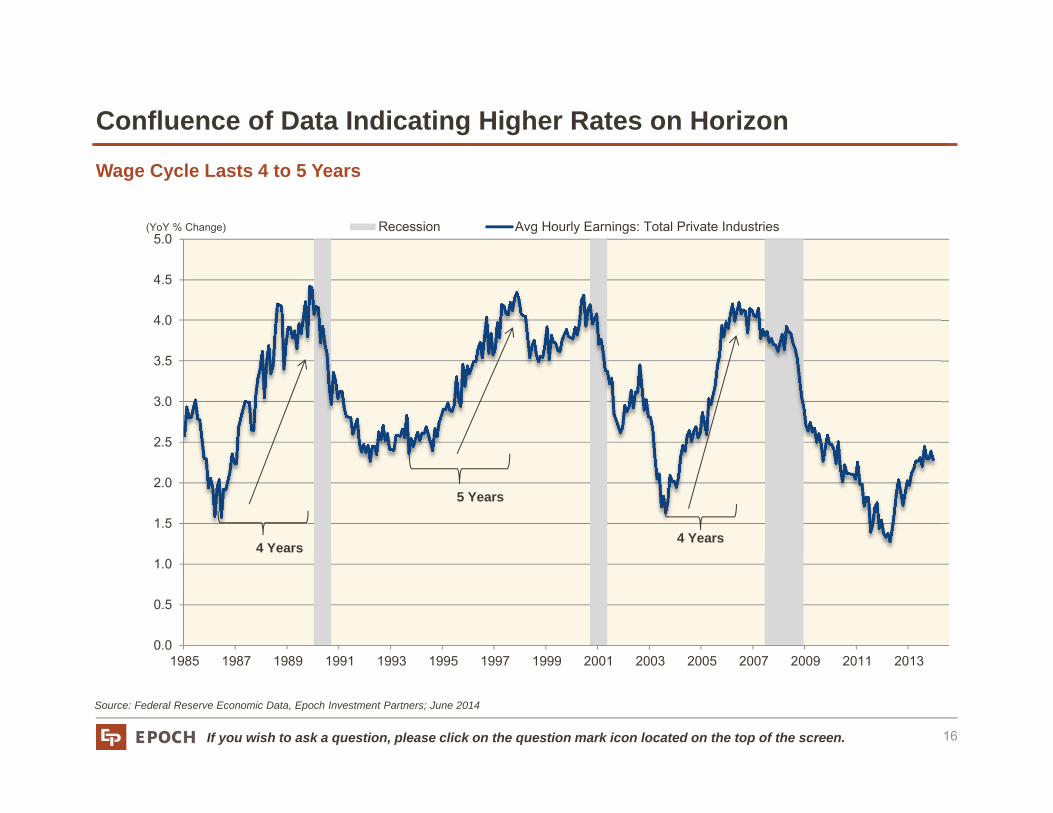
Wage Cycle Lasts 4 to 5 Years
Source: Federal Reserve Economic Data, Epoch Investment Partners; June 2014
Confluence of Data Indicating Higher Rates on Horizon
16
(YoY % Change)
4 Years
5 Years
4 Years
If you wish to ask a question, please click on the question mark icon located on the top of the screen.
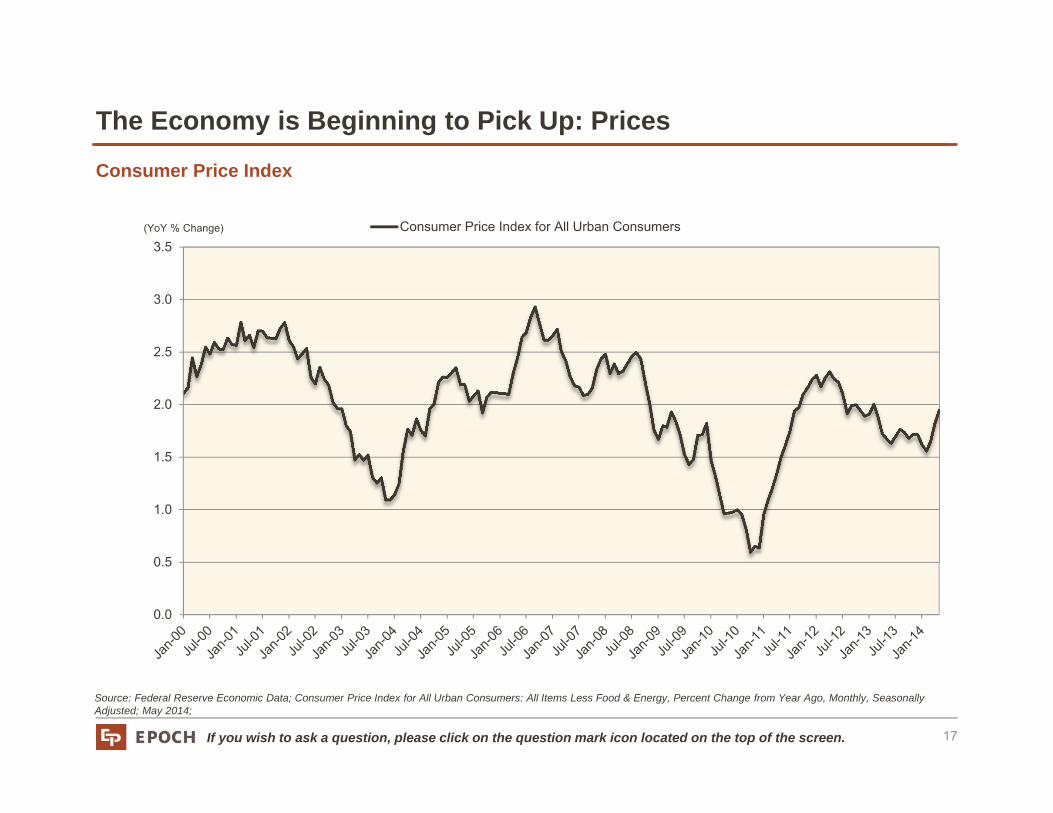
Consumer Price Index
Source: Federal Reserve Economic Data; Consumer Price Index for All Urban Consumers: All Items Less Food & Energy, Percent Change from Year Ago, Monthly, Seasonally Adjusted; May 2014;
The Economy is Beginning to Pick Up: Prices
17
0.0
0.5
1.0
1.5
2.0
2.5
3.0
3.5Consumer Price Index for All Urban Consumers(YoY % Change)

If you wish to ask a question, please click on the question mark icon located on the top of the screen.
1.0
1.5
2.0
2.5
3.0
3.5
4.0(%)
Sequence of the Tightening Thresholds on 10-year U.S. Yields
Source: Exane BNP Paribas, U.S. Treasury; June 2014
When Rates Rise, They Tend To Do So Quickly
18
1st Upward PhaseTrigger: Mention of reducing QE
2nd Upward PhaseTrigger: Coming end QE
3rd Upward PhasePotential Trigger: Rate hikes
If you wish to ask a question, please click on the question mark icon located on the top of the screen.
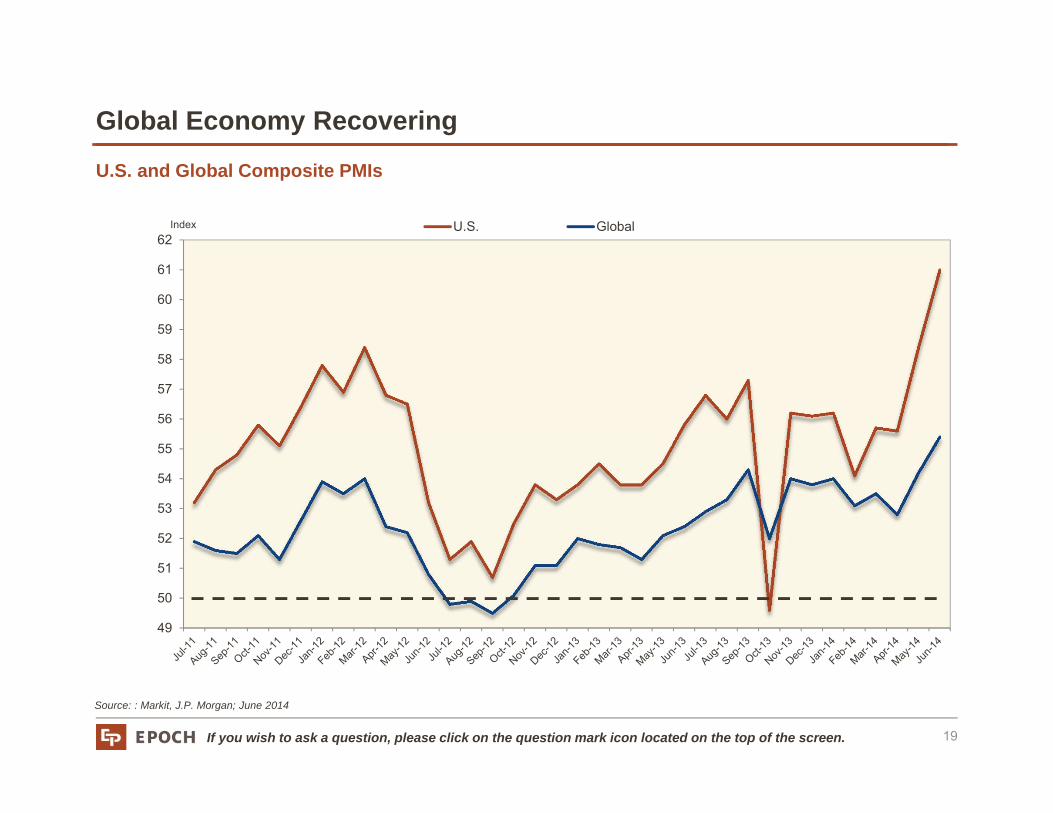
U.S. and Global Composite PMIs
Source: : Markit, J.P. Morgan; June 2014
Global Economy Recovering
19
49
50
51
52
53
54
55
56
57
58
59
60
61
62U.S. GlobalIndex
If you wish to ask a question, please click on the question mark icon located on the top of the screen.
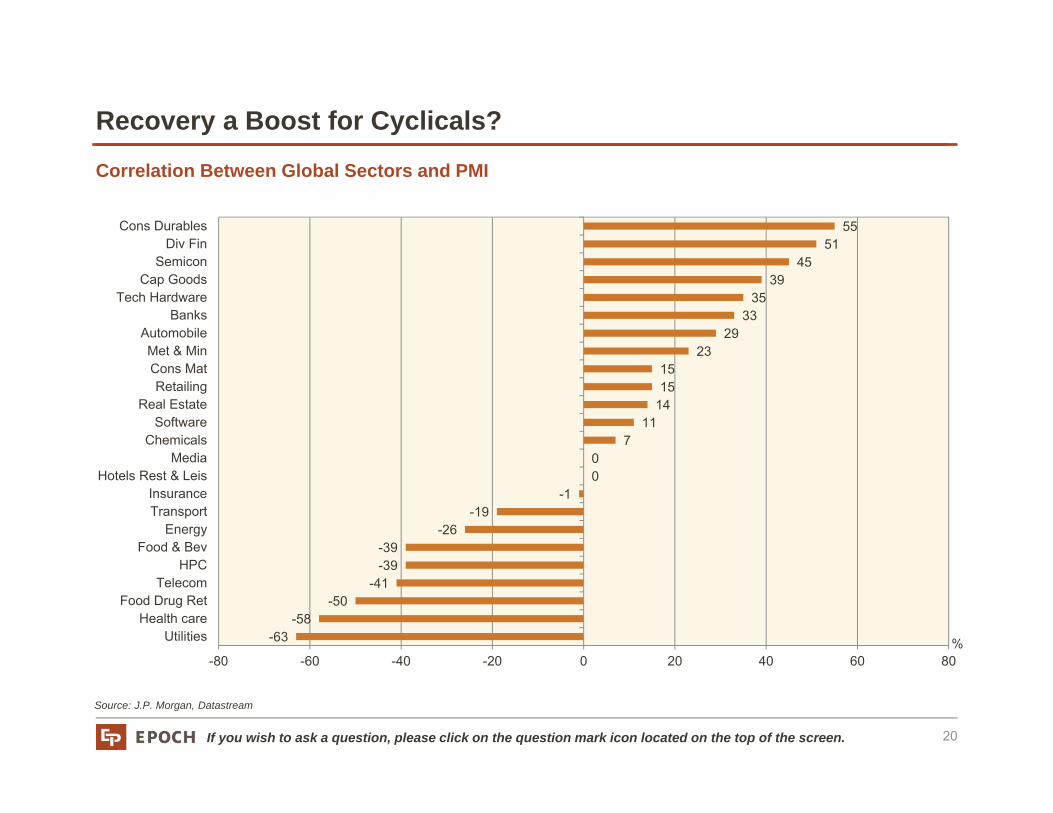
Correlation Between Global Sectors and PMI
Source: J.P. Morgan, Datastream
Recovery a Boost for Cyclicals?
20
-63-58
-50-41
-39-39
-26-19
-100
711
141515
2329
3335
3945
5155
-80 -60 -40 -20 0 20 40 60 80
UtilitiesHealth care
Food Drug RetTelecom
HPCFood & Bev
EnergyTransportInsurance
Hotels Rest & LeisMedia
ChemicalsSoftware
Real EstateRetailing
Cons MatMet & Min
AutomobileBanks
Tech HardwareCap Goods
SemiconDiv Fin
Cons Durables
%

If you wish to ask a question, please click on the question mark icon located on the top of the screen.
Summary
Global Growth Expectations
• Financial health of most economies improving modestly
• Positive growth exists, but still below long-run trend rate
• Geopolitical risk an increasing concern
Effects of Monetary
Policy
• Central banks at different stages in policy cycle
• Growth still not self-sustaining in several regions
Sustainability of Recovery in Euro Zone
and Japan
• Deflation remains a threat in Europe
• Japan experiment continues
China and Emerging Markets
• Structural changes in China continue to be a drag
• Emerging markets continue to be adversely effected by the credit slowdown
U.S. Market Environment
• U.S. economy picking up steam
• Rising wages may foreshadow a rise in rates
• Cyclical sectors look attractive in this environment
As of June 30, 2014
21

If you wish to ask a question, please click on the question mark icon located on the top of the screen.
A replay of this presentation will be available shortly on our website www.eipny.com
Please feel free to contact us at 212-303-7200
Question & Answer Section
22