Quarterly Reflections & Outlook: Economy and Capital Markets · Quarterly Reflections & Outlook:...
8
Quarterly Reflections & Outlook: Economy and Capital Markets Prepared: April 25, 2013 Important disclosures provided on page 8. First Quarter Review: The U.S. Economy Even though the fiscal cliff was narrowly avoided at the start of year — the debt ceiling debates were delayed until May and government shutdowns due to occur in March were dodged via a continuing budget resolution — the U.S. economy did run straight into sequestration spending cuts. The confluence of policy issues appears to have resulted in a moderating economy that is experiencing some improvements in employment and declining inflation. Growth remained a challenge with 4Q 2012 Gross Domestic Product (GDP) growth at just 0.4 percent, with declining government spending joining inventory destocking as slowing economic factors. Consumption has remained the primary positive for the economy, although non-residential investment also chipped in to bring us to a slightly positive economy. Looking to 1Q 2013 economic data, the Institute of Supply Management (ISM) report on manufacturing indicated activity remains constrained in the United States, but may have improved from its slowest levels in 4Q 2012. Leading economic indicators also improved during 1Q 2013. Data seems to indicate some modest growth improvement relative to 4Q 2012, with perhaps better growth to be seen in subsequent quarters. 1993 1995 2000 2005 2010 2012 % Change U.S. Real GDP Growth 10% 8% 6% 4% 2% 0% -2% -4% -6% -8% -10% Quarterly Annualized % Change Yearly Annualized % Change Source: FactSet; gray bars = recessionary periods; 3/31/93-12/31/12 Employment remains a challenge for the U.S. economy with the unemployment rate stuck at 7.6 percent through March. However, nonfarm payrolls have averaged a 200,000 monthly increase in jobs over the past four months, slightly improving on the average pace of 150,000 jobs for 2012. Weekly jobless claims data also improved during 1Q, averaging 25,000 fewer unemployed than during 4Q. Improvements in employment data are likely to continue, however, it may take until well into 2014, if not longer, to reach the Federal Reserve’s target unemployment rate of 6.5 percent. 2004 2008 2010 2006 Mar 2013 Unemployment Rate U.S. Unemployment Rate 11% 10% 9% 8% 7% 6% 5% 4% Source: FactSet; 1/31/03-3/29/13; gray bar = recessionary period U.S. inflation trends remained well below the Federal Reserve’s (Fed) target level of 2 percent for core inflation. The Fed’s preferred inflation measure, core Personal Consumption Expenditures, slowed to a year-over-year rate of just 1.3 percent through 1Q 2013. Relatively high unemployment rates likely mean little in the way of wage growth, while housing is just beginning its recovery. Food and energy prices, however, do tend to be quite volatile. Despite rising Situation Analysis
Transcript of Quarterly Reflections & Outlook: Economy and Capital Markets · Quarterly Reflections & Outlook:...

Quarterly Reflections & Outlook: Economy and Capital MarketsPrepared: April 25, 2013
Important disclosures provided on page 8.
First Quarter Review:The U.S. Economy
Even though the fiscal cliff was narrowly avoided at the start of year — the debt ceiling debates were delayed until May and government shutdowns due to occur in March were dodged via a continuing budget resolution — the U.S. economy did run straight into sequestration spending cuts. The confluence of policy issues appears to have resulted in a moderating economy that is experiencing some improvements in employment and declining inflation.
Growth remained a challenge with 4Q 2012 Gross Domestic Product (GDP) growth at just 0.4 percent, with declining government spending joining inventory destocking as slowing economic factors. Consumption has remained the primary positive for the economy, although non-residential investment also chipped in to bring us to a slightly positive economy. Looking to 1Q 2013 economic data, the Institute of Supply Management (ISM) report on manufacturing indicated activity remains constrained in the United States, but may have improved from its slowest levels in 4Q 2012. Leading economic indicators also improved during 1Q 2013. Data seems to indicate some modest growth improvement relative to 4Q 2012, with perhaps better growth to be seen in subsequent quarters.
1993 1995 2000 2005 2010 2012
% C
hang
e
U.S. Real GDP Growth10%
8%
6%
4%
2%
0%
-2%
-4%
-6%
-8%
-10%
Quarterly Annualized % Change Yearly Annualized % Change
Source: FactSet; gray bars = recessionary periods; 3/31/93-12/31/12
Employment remains a challenge for the U.S. economy with the unemployment rate stuck at 7.6 percent through March. However, nonfarm payrolls have averaged a 200,000 monthly increase in jobs over the past four months, slightly improving on the average pace of 150,000 jobs for 2012. Weekly jobless claims data also improved during 1Q, averaging 25,000 fewer unemployed than during 4Q. Improvements in employment data are likely to continue, however, it may take until well into 2014, if not longer, to reach the Federal Reserve’s target unemployment rate of 6.5 percent.
2004 2008 20102006 Mar2013
Unem
ploy
men
t Rat
e
U.S. Unemployment Rate
11%
10%
9%
8%
7%
6%
5%
4%
Source: FactSet; 1/31/03-3/29/13; gray bar = recessionary period
U.S. inflation trends remained well below the Federal Reserve’s (Fed) target level of 2 percent for core inflation. The Fed’s preferred inflation measure, core Personal Consumption Expenditures, slowed to a year-over-year rate of just 1.3 percent through 1Q 2013. Relatively high unemployment rates likely mean little in the way of wage growth, while housing is just beginning its recovery. Food and energy prices, however, do tend to be quite volatile. Despite rising
Situation Analysis
strongly at the beginning of 2013, unleaded gas prices calmed over the second half of 1Q 2013, easing initial fears of rising commodity prices. Generally improving global supply conditions have moderated the impact of rising global growth, offering the U.S. consumer some relief.
The Global Economy
Both Europe and Japan ended 2012 by slipping further into recession, caused by austerity and deflation respectively. However, paths diverged over the course of 1Q 2013 as indications of a possible recovery disappeared and the recession deepened, but bold measures by Prime Minister Abe in Japan left the country’s outlook a bit brighter. Politics and the European debt crisis featured strongly during the past quarter as the populace advocated change and relief from austerity, while the debt crisis claimed more victims — the Cyprus banking system and Russian depositors.
In Japan, Prime Minister Abe entered office with a plan to change Central Bank leadership with the expectation to engage in U.S. Federal Reserve-style quantitative easing and exit deflation and return to economic growth. The fall in the value of the yen helped spur the economy and new Central Bank governor Kuroda unveiled a plan for 7.5 trillion yen ($75 billion USD) per month of government bond purchases, doubling the monetary base and bringing inflation to a target of 2 percent. The yen fell further and economic prospects improved with Japan now likely exiting recession.
Europe continued to struggle in the past quarter, first from political turnover and then later from the banking crisis in Cyprus. Italian voters, tired of austerity and new elections, saw Mario Monti’s technocratic government receive less than 10 percent of the vote. Voters seemingly preferred anyone else, including comedian Grillo, whose “anti-everything” party came in third with 25 percent of the vote. With no clear winner, Italian reforms remain in doubt and new elections seem likely as no party has been successful in forming a new government.
Cyprus banks have had significant exposure to Greek debt and everything seemed to come to a head during 1Q. Resolution was required. Capital controls were ultimately put in place to prevent capital flight and the second largest bank “failed” and merged into the largest bank. However, depositors who exceeded $100,000 were subjected to a bail-in of 40-60 percent of their deposit. Despite European Central Bank (ECB) protestations, investors continue to wonder if this is a one-time event due to the methods of Cypriot banks and the dubious origins of depositors’ money, or is this likely to be a blueprint for future banking crises in the eurozone?
Emerging market economies slowed in 2012 despite positive equity market returns. Investor attention remained on growth during 1Q 2013 as expectations rose for faster growth in China to lead emerging market economies higher.
The much anticipated handoff to new leadership finally occurred in China and was marked by anti-corruption campaigns and structural reforms to rebalance the economy and address income gaps. The government also indicated plans for economic growth to average just 7.5 percent, a rate much slower than the double-digit growth previously expected by market participants. A hallmark of the plan is to implement structural reforms to rebalance the economy toward consumption relative to investment, which had been the primary driver for the previous leadership. This transition is likely to be a difficult one and may result in a “bumpier” path of economic growth as the transition is managed.
The Capital Markets
Equities: The Dow Jones Industrial Average (DJIA) and S&P 500 Index ended 1Q 2013 at all-time high levels. The performance of the DJIA was at 11.3 percent, its best quarter in 15 years, and the S&P 500 advanced 10 percent, with all 10 sectors posting positive returns and eight of 10 posting returns ranging from 8.2 percent to 13.8 percent. Interestingly, both defensive- and growth-oriented sectors posted strong year-to-date results. Performance leadership
Situation Analysis
Quarterly Reflections & Outlook: Economy and Capital Markets
Important disclosures provided on page 8.
Page 2

after 1Q was from the defensive-oriented Consumer Staples (13.8 percent), Healthcare (15.2 percent) and Utilities (11.8 percent) sectors; the growth-oriented Consumer Cyclicals (11.8 percent), Financials (10.9 percent) and Industrials (10.1 percent) sectors have also performed well. While somewhat of an anomaly, the simultaneous strong performance of both defensive and growth sectors is not without precedence. According to Strategas Research Partners, Consumer Staples were a leadership group throughout much of the bull market in the 1980s.
Fixed Income: The fixed income markets began the year with a relief rally in credit and selloff in Treasuries due to a partial resolution of the fiscal cliff and a stronger domestic growth outlook.
The U.S. Treasury curve steepened slightly on the long end of the curve, but most parts of the curve remained virtually unchanged by quarter end. However, it felt much different throughout the course of the quarter. Treasury yields continued to rise on the backs of stronger economic data releases until mid-February when additional concerns arose over the potential debt ceiling and budget debates, causing yields to fall once again. Although the 10-year Treasury ended 1Q 2013 at 1.83 percent, it broke through the 2 percent level and even closed as high as 2.06 percent, a level not seen since April 2012. Challenging global economic growth indicators and a re-ignition of European austerity and banking issues have since resulted in U.S. Treasury yields dropping back to their pre-fiscal cliff levels of around 1.7 percent.
Foreign sovereign debt performance continued to be hindered by their respective currency’s depreciation against the U.S. dollar. Sluggish economic data and potential expectations of additional easing in the United Kingdom weighed on the value of the pound. The announcement of a significant bond-buying initiative by the Bank of Japan caused inflation expectations to rise and lowered real rates, having a negative impact on the yen. Diminished support for austerity via newly elected officials in Italy and the unusual tax to depositors in the Cyprus bail-in plan weighed on the euro.
The shining star of the fixed income markets during 1Q was the high yield corporate bond sector. High yield started the year strong with spreads compressing to levels not seen since May 2011. The sector experienced a selloff in late January through mid February as concerns about the U.S. fiscal situation amplified, weighing on the sector. Since mid February, the debt ceiling and budget debates have been delayed to May and September, respectively. With the continued improvement in investor comfort with risk-based assets, the Fed suppressing interest rate volatility and the current environment of extremely low yields, investors continue the hunt for income, driving additional funds into the high yield sector. These factors have resulted in high yield posting positive performance of nearly 3 percent for the year.
Dec 312009
Jun 302010
Dec 312010
Jun 302011
Dec 312011
Jun 302012
Merrill Lynch U.S. High YieldMaster II Index
Dec 312012
High Yield Option-adjusted SpreadsHave Fallen to Multi-year Lows
925
875
825
775
725
675
625
575
525
475
425
Basi
s po
ints
Source: BofA Merrill Lynch, Bloomberg; Data through 3/31/13
Real Estate: Real estate transactions and prices continued to increase and provided a lift to the overall economy. Commercial real estate moved steadily ahead. The U.S. All REIT (Real Estate Investment Trust) Price Index gained 5.7 percent in 1Q 2013. Despite ending the quarter at a multi-year high, REITs underperformed other benchmarks such as the S&P 500, the DJIA and the Russell 2000 during the quarter as the equity markets advanced dramatically. Housing remained a bright spot in the economy. The latest S&P/Case-Shiller 20-City Composite Index reported an 9.3 percent increase in prices in the past 12 months. This is a rate of increase last seen in 2006.
Situation Analysis
Quarterly Reflections & Outlook: Economy and Capital Markets
Important disclosures provided on page 8.
Page 3

Commodities: Fears of rising commodity prices in January gave way to softening prices over the remainder of 1Q 2013. What had seemed like a market of significant demand expansion and relatively tight global supplies turned out by the end of the quarter to see only modest demand expansion and significant increases in supply. Energy prices were the only major segment to increase during the quarter while base metals, precious metals and agriculture all slipped. With little in the way of recent news regarding global economic growth or significant changes in the global risk profile, commodity prices finished the quarter in a very quiet manner.
Energy prices were the sole positive segment of the market. January saw rallies in crude oil and gasoline prices, particularly domestically. Disappointments in domestic supply infrastructure and shutdowns of refineries in the northeast region of the United States constrained supplies. This strength was reversed in February as fears rose of weaker growth in China and the U.S. dollar strengthened. In March, the spring cold snap drove natural gas prices up by more than 14 percent, bringing prices to nearly double their year-ago levels. Domestic supplies of energy continue to build and are likely to hold down prices over the near term.
U.S.
Cru
de O
il Fi
eld
Prod
uctio
n (T
hous
and
Barr
els
Per D
ay)
WTI Crude Oil (Price Per Barrel)
2008 2009 2010 2011 2012
Rising Oil Production Pressures Prices
7,500
7,000
6,500
6,000
5,500
5,000
4,500
4,000
3,500
$160
$140
$120
$100
$80
$60
$40
$20
Sources: U.S. Department of Energy, Dow Jones; Data April 2008-March 2013
Base metals struggled in 1Q as modest gains made in January, the result of hopes of faster economic growth in Southeast Asia gave way to new data that indicated growth was modest due to the overhang of excess supply. For 1Q, base metals lost more than 7 percent with losses widespread in the sector.
Copper, the key industrial bellwether, struggled as well losing over 5 percent for 1Q. Speculative positions in copper over the quarter swung from long to short as investors became skeptical about the prospects for growth to absorb excess inventories in the near term.
Precious metals also struggled, losing 5 percent over the quarter as a rising stock market siphoned demand despite a European bank crisis in Cyprus and continued Federal Reserve commitment to quantitative easing. Investors in exchange-traded products exited positions as prices for gold struggled to reach $2,000 per ounce, despite continued global monetary easing policies. During 1Q, investors exited approximately 159 metric tonnes of gold-related exchange-traded products, or approximately 5 percent of the total holdings at the beginning of the year. Investor sentiment is unlikely to reverse unless a global crisis re-emerges.
Agricultural prices fell 3.9 percent in the quarter. January supply fears, especially for corn and soybeans yielded to news of good weather and strong crop yields in Brazil. Relatively high prices still spurred very strong planting estimates from the USDA, which further pressured prices. Fears of weak demand from China, especially as their inflation pressure ebbed, also helped prices ease over the quarter. The U.S. growing season is likely to bring some support to this space if drought conditions continue in key growing regions of the United States.
Outlook:The U.S. Economy
U.S. economic growth seems likely to benefit over the balance of 2013 from putting policy issues in the rearview mirror and the tailwind of improvements in housing prices and activity. GDP is likely to average just 1-2 percent for the first half of 2013 as tax increases and spending cuts dampen economic activity. As businesses unleash repressed capital expenditures and consumer spending normalizes from tax increases in the first half of the year, GDP growth may accelerate to an average level of around 3 percent. Consumer spending may improve over
Situation Analysis
Quarterly Reflections & Outlook: Economy and Capital Markets
Important disclosures provided on page 8.
Page 4
the year as payrolls likely continue to improve at an average rate of around 200,000 jobs per month over the rest of the year, slightly faster than 2012’s average rate of 150,000 jobs per month. However, that still means we will have yet to eclipse the peak in total nonfarm payrolls jobs, set in 2008, and the unemployment rate is unlikely to fall below 7 percent during 2013. With consumer confidence measures below historical average levels and relatively tight credit markets, the higher rate of unemployment may leave consumer confidence weak.
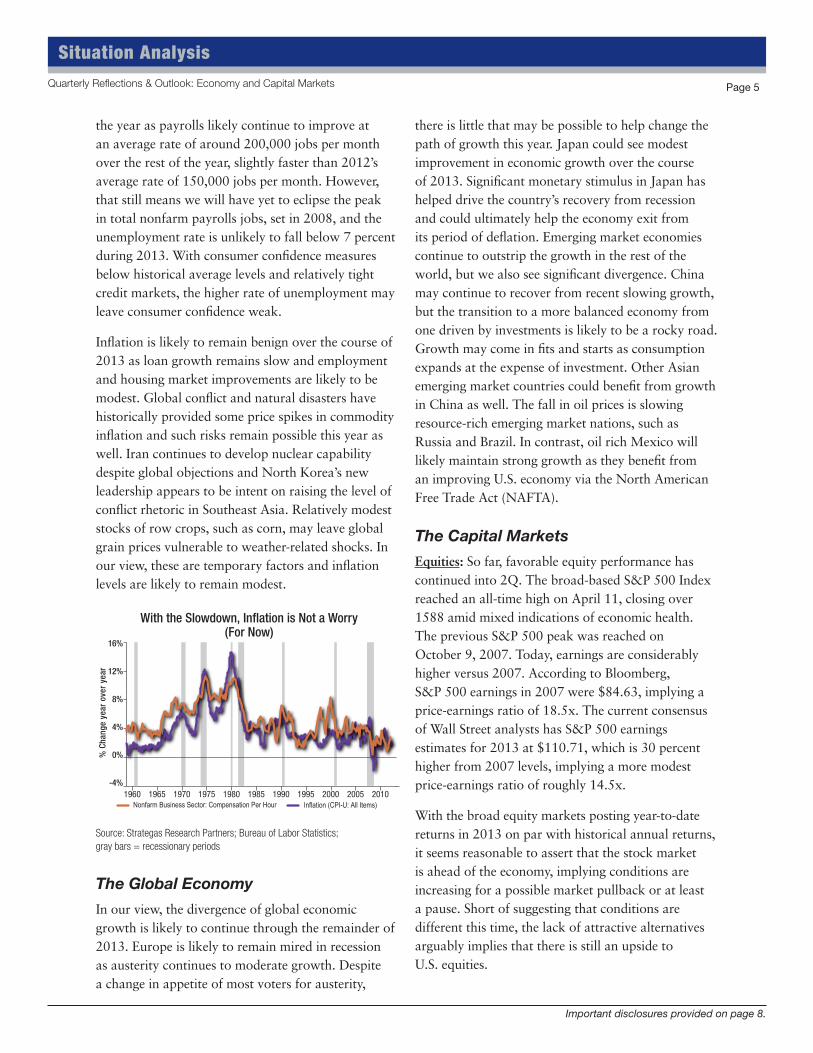
Inflation is likely to remain benign over the course of 2013 as loan growth remains slow and employment and housing market improvements are likely to be modest. Global conflict and natural disasters have historically provided some price spikes in commodity inflation and such risks remain possible this year as well. Iran continues to develop nuclear capability despite global objections and North Korea’s new leadership appears to be intent on raising the level of conflict rhetoric in Southeast Asia. Relatively modest stocks of row crops, such as corn, may leave global grain prices vulnerable to weather-related shocks. In our view, these are temporary factors and inflation levels are likely to remain modest.
With the Slowdown, Inflation is Not a Worry (For Now)
1960 1965 1970 1975 1980 1985 1990 1995 2000 2005 2010
16%
12%
8%
4%
0%
-4%
Nonfarm Business Sector: Compensation Per Hour Inflation (CPI-U: All Items)
% C
hang
e ye
ar o
ver
year
Source: Strategas Research Partners; Bureau of Labor Statistics; gray bars = recessionary periods
The Global Economy
In our view, the divergence of global economic growth is likely to continue through the remainder of 2013. Europe is likely to remain mired in recession as austerity continues to moderate growth. Despite a change in appetite of most voters for austerity,
there is little that may be possible to help change the path of growth this year. Japan could see modest improvement in economic growth over the course of 2013. Significant monetary stimulus in Japan has helped drive the country’s recovery from recession and could ultimately help the economy exit from its period of deflation. Emerging market economies continue to outstrip the growth in the rest of the world, but we also see significant divergence. China may continue to recover from recent slowing growth, but the transition to a more balanced economy from one driven by investments is likely to be a rocky road. Growth may come in fits and starts as consumption expands at the expense of investment. Other Asian emerging market countries could benefit from growth in China as well. The fall in oil prices is slowing resource-rich emerging market nations, such as Russia and Brazil. In contrast, oil rich Mexico will likely maintain strong growth as they benefit from an improving U.S. economy via the North American Free Trade Act (NAFTA).
The Capital Markets
Equities: So far, favorable equity performance has continued into 2Q. The broad-based S&P 500 Index reached an all-time high on April 11, closing over 1588 amid mixed indications of economic health. The previous S&P 500 peak was reached on October 9, 2007. Today, earnings are considerably higher versus 2007. According to Bloomberg, S&P 500 earnings in 2007 were $84.63, implying a price-earnings ratio of 18.5x. The current consensus of Wall Street analysts has S&P 500 earnings estimates for 2013 at $110.71, which is 30 percent higher from 2007 levels, implying a more modest price-earnings ratio of roughly 14.5x.
With the broad equity markets posting year-to-date returns in 2013 on par with historical annual returns, it seems reasonable to assert that the stock market is ahead of the economy, implying conditions are increasing for a possible market pullback or at least a pause. Short of suggesting that conditions are different this time, the lack of attractive alternatives arguably implies that there is still an upside to U.S. equities.
Situation Analysis
Quarterly Reflections & Outlook: Economy and Capital Markets
Important disclosures provided on page 8.
Page 5
We believe:
• Valuationisfair.TheS&Ptradesat14.4x our 2013 earnings estimate of $110, which is well within historical norms. Our 1650 index price target is based on 15x our $110 estimate, roughly 4 percent above current levels. Based on past trends during similar economic conditions, there is room for some price-earnings multiple expansion.
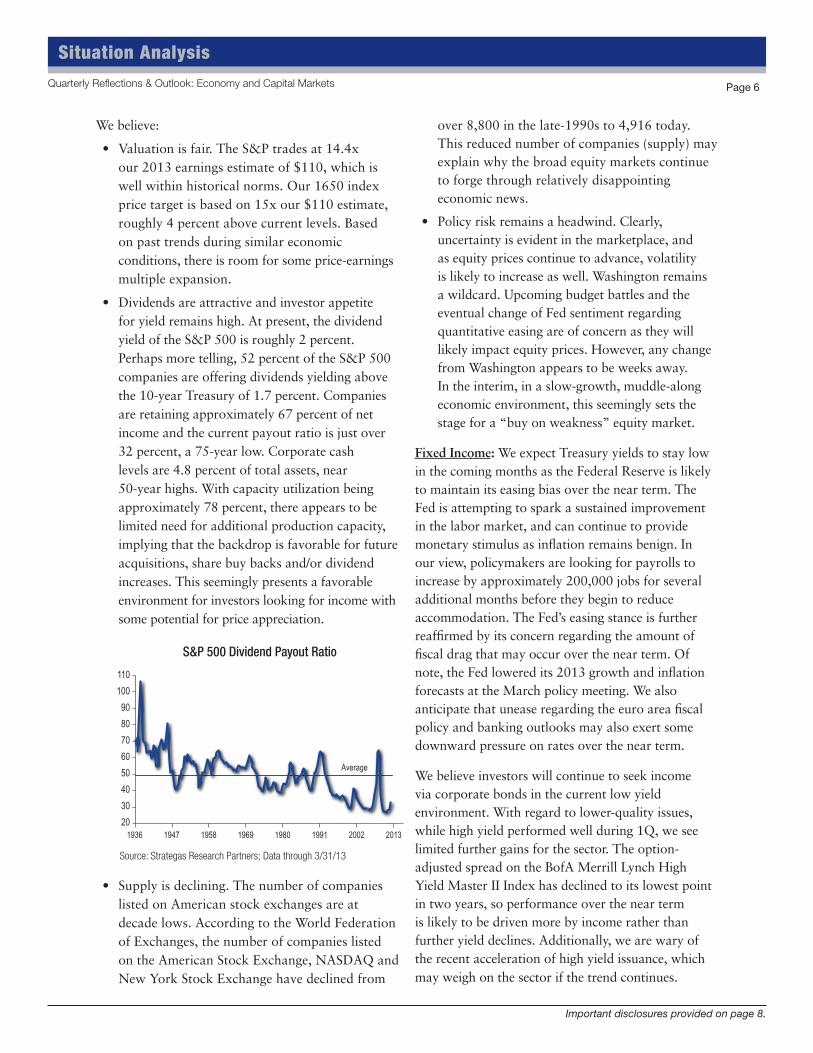
• Dividendsareattractiveandinvestorappetitefor yield remains high. At present, the dividend yield of the S&P 500 is roughly 2 percent. Perhaps more telling, 52 percent of the S&P 500 companies are offering dividends yielding above the 10-year Treasury of 1.7 percent. Companies are retaining approximately 67 percent of net income and the current payout ratio is just over 32 percent, a 75-year low. Corporate cash levels are 4.8 percent of total assets, near 50-year highs. With capacity utilization being approximately 78 percent, there appears to be limited need for additional production capacity, implying that the backdrop is favorable for future acquisitions, share buy backs and/or dividend increases. This seemingly presents a favorable environment for investors looking for income with some potential for price appreciation.
S&P 500 Dividend Payout Ratio
1936 1947 1958 1969 1980 1991 2002
Average
2013
1101009080706050403020
Source: Strategas Research Partners; Data through 3/31/13
• Supplyisdeclining.Thenumberofcompanieslisted on American stock exchanges are at decade lows. According to the World Federation of Exchanges, the number of companies listed on the American Stock Exchange, NASDAQ and New York Stock Exchange have declined from
over 8,800 in the late-1990s to 4,916 today. This reduced number of companies (supply) may explain why the broad equity markets continue to forge through relatively disappointing economic news.
• Policyriskremainsaheadwind.Clearly,uncertainty is evident in the marketplace, and as equity prices continue to advance, volatility is likely to increase as well. Washington remains a wildcard. Upcoming budget battles and the eventual change of Fed sentiment regarding quantitative easing are of concern as they will likely impact equity prices. However, any change from Washington appears to be weeks away. In the interim, in a slow-growth, muddle-along economic environment, this seemingly sets the stage for a “buy on weakness” equity market.
Fixed Income: We expect Treasury yields to stay low in the coming months as the Federal Reserve is likely to maintain its easing bias over the near term. The Fed is attempting to spark a sustained improvement in the labor market, and can continue to provide monetary stimulus as inflation remains benign. In our view, policymakers are looking for payrolls to increase by approximately 200,000 jobs for several additional months before they begin to reduce accommodation. The Fed’s easing stance is further reaffirmed by its concern regarding the amount of fiscal drag that may occur over the near term. Of note, the Fed lowered its 2013 growth and inflation forecasts at the March policy meeting. We also anticipate that unease regarding the euro area fiscal policy and banking outlooks may also exert some downward pressure on rates over the near term.
We believe investors will continue to seek income via corporate bonds in the current low yield environment. With regard to lower-quality issues, while high yield performed well during 1Q, we see limited further gains for the sector. The option-adjusted spread on the BofA Merrill Lynch High Yield Master II Index has declined to its lowest point in two years, so performance over the near term is likely to be driven more by income rather than further yield declines. Additionally, we are wary of the recent acceleration of high yield issuance, which may weigh on the sector if the trend continues.
Situation Analysis
Quarterly Reflections & Outlook: Economy and Capital Markets
Important disclosures provided on page 8.
Page 6
Although we still do not anticipate significant changes to the tax treatment of municipal bonds, we’ll continue to closely monitor this important issue as it develops during the course of the year. A much-anticipated recent House Ways and Means Committee meeting unfortunately provided little new information regarding possible changes to the muni tax exemption. We continue to believe that major changes to the tax status of municipal bonds would probably be part of much broader tax reform, and that appears to be unlikely at the moment. Overall, despite possible legislative headwinds, we anticipate municipals to be supported by muted supply during most of 2013.
Real Estate: Housing transaction volume and prices are poised to keep advancing and will support economic growth. The number of homeowners experiencing negative equity continues to drop as prices increase. Improvement in the employment numbers and favorable mortgage rates will likely support the housing sector.
Confidence among homebuyers is providing a stable foundation of continuance. The level of distressed sales is decreasing, existing home inventory is at historically low levels but is starting to seasonally increase, and median prices are rising — all encouraging signs of continued momentum in the housing recovery. As evidence of the expanding new home market, residential construction jobs increased by 12,500 in March as builders try to create inventory, but this was not without some setbacks. In markets where new home buying is ramping up, there is some shortage of buildable lots. This situation is causing larger homebuilders to aggressively look for land they can develop into lots. We still believe new housing starts will advance into the 900,000 annualized range (600,000 single family; 300,000 apartments). Correlating to housing, Timber Real Estate Investment Trusts (REITs) were the top REIT performer in 1Q (15.5 percent) as was the case throughout 2012. Plywood pricing is reportedly up 45 percent since January 2012 and companies are ramping up production due to the surge in demand.
We believe commercial real estate will continue to move forward as occupancy improves in concert with the job economy and as investors continue to seek the real estate sector for its income production and the demonstrated price increases off the recession lows. While gateway markets have led the commercial real estate recovery thus far, non-major markets do and will receive investor attention because of improving fundamentals. REIT dividend yields are averaging 3.57 percent, which is approximately 190 basis points above the 10-year Treasury yield. In addition to Timber REITs, we expect Healthcare to remain in the forefront both in REITs and in direct holdings
Commodities: Stronger global growth over the course of 2013 is likely to lead to higher commodity prices in the second half of the year. In the first half, moderating prices trends are likely to be the result of significant increases in supplies of key global commodities. Economic growth is improving across much of Southeast Asia and is likely to continue to improve over the rest of the world in the second half of 2013. This improving growth may mop up much of the excess supply in commodity markets providing support for commodities as we move into 3Q 2013.
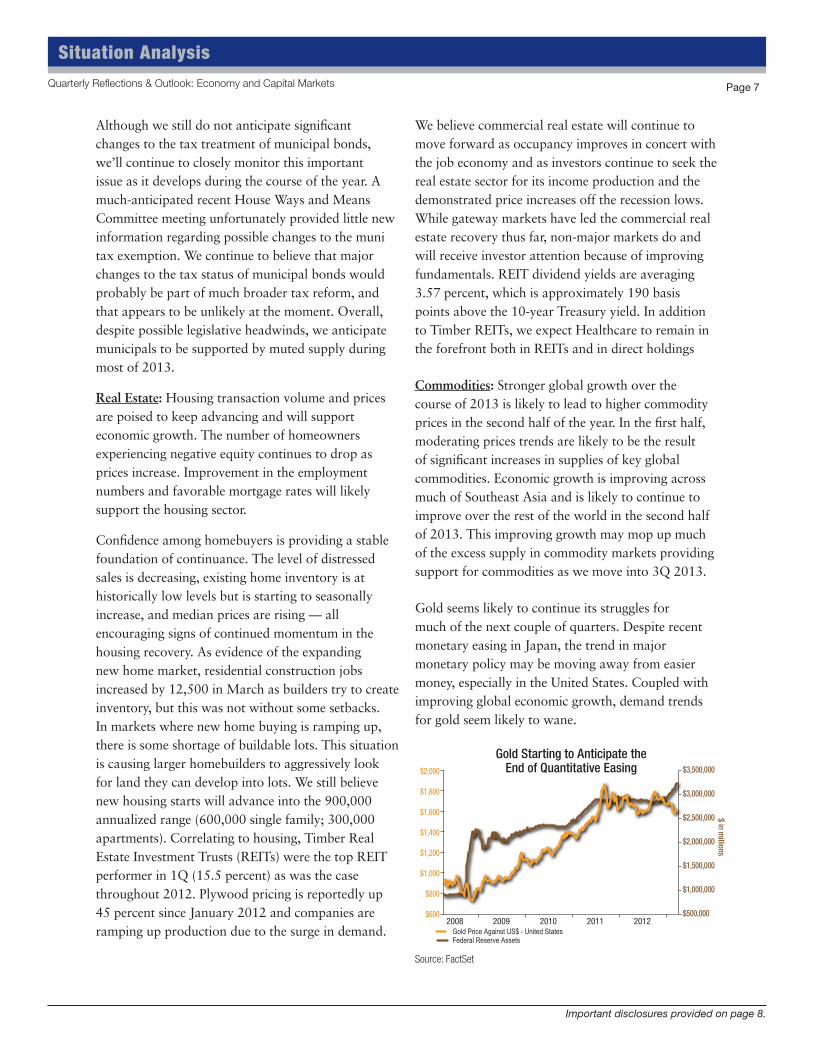
Gold seems likely to continue its struggles for much of the next couple of quarters. Despite recent monetary easing in Japan, the trend in major monetary policy may be moving away from easier money, especially in the United States. Coupled with improving global economic growth, demand trends for gold seem likely to wane.
Gold Starting to Anticipate theEnd of Quantitative Easing
2008 2009 2010 2011 2012
$2,000
$1,800
$1,600
$1,400
$1,200
$1,000
$800
$600
$3,500,000
$3,000,000
$2,500,000
$2,000,000
$1,500,000
$1,000,000
$500,000
$ in millions
Federal Reserve AssetsGold Price Against US$ - United States
Source: FactSet
Situation Analysis
Quarterly Reflections & Outlook: Economy and Capital Markets
Important disclosures provided on page 8.
Page 7

Situation Analysis
Quarterly Reflections & Outlook: Economy and Capital Markets Page 8
privateclientreserve.usbank.com
IMPORTANT DISCLOSURES
This commentary was prepared on April 25, 2013 and the views are subject to change at any time based on market or other conditions. This information represents the opinion of U.S. Bank and is not intended to be a forecast of future events or guarantee of future results. It is not intended to provide specific advice or to be construed as an offering of securities or recommendation to invest. Not for use as a primary basis of investment decisions. Not to be construed to meet the needs of any particular investor. Not a representation or solicitation or an offer to sell/buy any security. Investors should consult with their investment professional for advice concerning their particular situation. The factual information provided has been obtained from sources believed to be reliable, but is not guaranteed as to accuracy or completeness. U.S. Bank is not responsible for and does not guarantee the products, services or performance of third party providers. Any organizations mentioned in this commentary are not affiliates or associated with U.S. Bank in any way.
Past performance is no guarantee of future results. All performance data, while deemed obtained from reliable sources, are not guaranteed for accuracy. Indexes shown are unmanaged and are not available for investment. The S&P 500 Index is an unmanaged, capitalization-weighted index of 500 widely traded stocks that are considered to represent the performance of the stock market in general. The Dow Jones Industrial Average (DJIA) is the price-weighted average of 30 actively traded blue chip stocks. The BofA/Merrill Lynch U.S. High Yield Master II Index tracks the performance of U.S. dollar-denominated below investment grade corporate debt publicly issued in the U.S. domestic market. The FTSE NAREIT All REITs Index is designed to present investors with a comprehensive family of REITs that spans the commercial real estate space across the U.S. economy. The index series provides investors with exposure to all investment and property sectors. The S&P GSCI is a composite index of commodity sector returns that is broadly diversified cross the spectrum of commodities.
Equity securities are subject to stock market fluctuations that occur in response to economic and business developments. International investing involves special risks, including foreign taxation, currency risks, risks associated with possible difference in financial standards and other risks associated with future political and economic developments. Investing in emerging markets may involve greater risks than investing in more developed countries. In addition, concentration of investments in a single region may result in greater volatility. Investing in fixed income securities are subject to various risks, including changes in interest rates, credit quality, market valuations, liquidity, prepayments, early redemption, corporate events, tax ramifications, and other factors. Investment in debt securities typically decrease in value when interest rates rise. The risk is usually greater for longer term debt securities. Investments in lower rated and non rated securities present a greater risk of loss to principal and interest than higher rated securities. Investments in high-yield bonds offer the potential for high current income and attractive total return, but involve certain risks. Changes in economic conditions or other circumstances may adversely affect a bond issuer’s ability to make principal and interest payments. The municipal bond market is volatile and can be significantly affected by adverse tax, legislative or political changes and the financial condition of the issuers of municipal securities. Interest rate increases can cause the price of a bond to decrease. Income on municipal bonds is free from federal taxes, but may be subject to the federal alternative minimum tax (AMT), state and local taxes. There are special risks associated with an investment in commodities, including market price fluctuations, regulatory changes, interest rate changes, credit risk, economic changes, and the impact of adverse political or financial factors. Investments in real estate securities can be subject to fluctuations in the value of the underlying properties, the effect of economic conditions on real estate values, changes in interest rates, and risks related to renting properties (such as rental defaults).
©2013 U.S. Bancorp (4/13)
Contributed by:
• Roosevelt D. Bowman – Senior Fixed Income Analyst• Edgar W. Cowling, Jr., CCIM – Director of Specialty Assets• Robert L. Haworth, CFA – Senior Investment Strategist• Terry D. Sandven – Chief Equity Strategist• Jennifer L. Vail – Head of Fixed Income Research