Presentation to the Senate Committee on Energy, Utilities and Communications Michael R. Peevey,...
62
Presentation to the Senate Committee on Energy, Utilities and Communications Michael R. Peevey, President California Public Utilities Commission August 16, 2011 1
-
Upload
clement-craig -
Category
Documents
-
view
219 -
download
5
Transcript of Presentation to the Senate Committee on Energy, Utilities and Communications Michael R. Peevey,...
Presentation to theSenate Committee on Energy, Utilities and
Communications
Michael R. Peevey, President
California Public Utilities Commission
August 16, 20111

Presentation Overview ABOUT THE CPUC
CUSTOMER CARE AND SUPPLIER DIVERSITY
NATURAL GAS INDUSTRY
San Bruno Tragedy
Natural Gas
THE ELECTRICITY INDUSTRY
Trends in Electric Rates
Support for Low Income Residents
Energy Efficiency and Advanced Metering Programs
Smart Grid and Electric Vehicles Proceedings
California Solar Initiative
Renewables and Distributed Generation
Electric Storage and CHP
THE COMMUNICATIONS INDUSTRY
THE WATER INDUSTRY
CPUC ADMINISTRATIVE INITIATIVES
2

About the CPUC
• Headquartered in San Francisco with offices in Los Angeles and Sacramento.
• 1,000 employees, including judges, engineers, analysts, lawyers, auditors, and support.
• Five Governor-appointed Commissioners serve staggered six-year terms:
Michael R. PeeveyPresident
Catherine J.K.Sandoval
Mike FlorioTimothy Alan Simon Mark J. Ferron
3

CPUC’s Role and ResponsibilitiesKey Role: Ensuring private utility customers have safe,
reliable service at reasonable rates.
Energy Regulate investor-owned electric and gas utilities (such as PG&E, SCE, SDG&E and SCG), which serve over
two-thirds of electricity demand and over three-quarters of natural gas demand in the state.
Communications Administer universal telephone service programs, issue video franchises, enforce customer service
standards for telephone services, and regulate rates for basic phone service and rural carriers.
Consumer Protection and Safety Enforce consumer protection laws and service standards, investigate fraud and illegal activity, and prosecute
violators of the Public Utilities Code, CPUC orders, and utility tariffs. Inspect and audit power plant operation, natural gas and electric utility infrastructure, passenger carriers, household goods movers, freight railroads, and rail transit systems.
Consumer Complaint Resolution Assist consumers in informally resolving billing and service disputes with utilities. Promotes efficient use of
staff resources to resolve complaints informally, not in the more burdensome formal docketed process.
Passenger Transportation License limousines and buses, and enforce statutes and regulations that apply to these carriers’ operations.
Rail Safety Inspect freight railroad tracks, equipment, and facilities; evaluate and approve railroad crossings for safety;
and verify the safety and security plans of rail transit agencies.
Water Regulate investor-owned water and sewer utilities, which serve about 18 percent of the state’s residents.
4
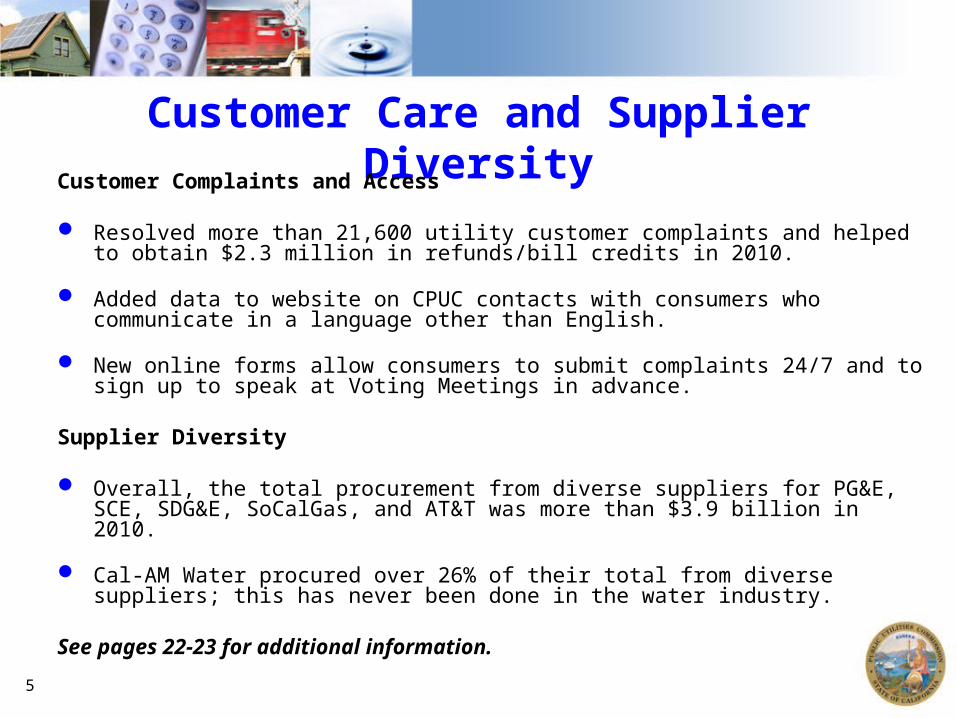
Customer Care and Supplier Diversity
Customer Complaints and Access
Resolved more than 21,600 utility customer complaints and helped to obtain $2.3 million in refunds/bill credits in 2010.
Added data to website on CPUC contacts with consumers who communicate in a language other than English.
New online forms allow consumers to submit complaints 24/7 and to sign up to speak at Voting Meetings in advance.
Supplier Diversity
Overall, the total procurement from diverse suppliers for PG&E, SCE, SDG&E, SoCalGas, and AT&T was more than $3.9 billion in 2010.
Cal-AM Water procured over 26% of their total from diverse suppliers; this has never been done in the water industry.
See pages 22-23 for additional information.
5

Ordered immediate pressure reductions on specified PG&E pipelines. Participation in NTSB’s ongoing “root cause” investigation. Appointment and Report of Independent Review Panel. Enforcement against PG&E, alleging poor record-keeping. Calibrating Maximum Allowable Operating Pressure (MAOP). Rulemaking for new, statewide pipeline safety rules. Educational Symposiums on Hydrostatic Testing and In-Line Inspection Tools. Ordered all natural gas transmission operators to develop for CPUC consideration a
Natural Gas Transmission Pipeline Comprehensive Pressure Testing Implementation Plan.
Added additional 13 safety-related positions: Created new Risk Assessment Unit, augmented pipeline inspector team by nine, and, searching for a new safety expert to lead Consumer Protection and Safety Division.
Next steps: NTSB Final Report; Possible additional CPUC enforcement action against PG&E, depending on what NTSB finds; Continuing consideration of rule changes for all gas pipeline operators in California; Continuing consideration of penalties against PG&E for poor recordkeeping, including proposed $6 million fine for not complying with CPUC directive re: records search.
See pages 25-33 for additional information.
Rupture of PG&E Pipeline in San Bruno
6

Electric Rate Changes Have Tracked Inflation Since 2003
0.00
0.02
0.04
0.06
0.08
0.10
0.12
0.14
0.16
2003 2004 2005 2006 2007 2008 2009 2010
$ kW
h
PurchasedPower
Bonds & Fees
Demand SideManagement
Transmission
Distribution
Utility OwnedGeneration
2003 Inflation-adjusted rate
7

Low Income Programs Provide Bill AssistanceNeed for low income assistance expected to increase:
Increased Reach*: Now treating 300,000+ homes/year with efficiency solutions, cumulatively
reaching 1.2 million homes since 2006.
With the CPUC’s goal of 90%+ penetration, as well as the economic downturn, California Alternate Rates for Energy (CARE) enrollments have risen to 5 million with an estimated statewide penetration of 94%.
Increased Budget**: Energy Savings Assistance Program will provide $320 million in efficiency
services to low income homes in 2011, and employ approximately 110 contractor firms and Community Based Organizations in program delivery.
CARE will provide approximately $877 million in bill discounts in 2011.
The total combined efficiency and bill discount assistance provided to low income households in 2011 will amount to $1.2 billion, provided by all other ratepayers.*Data as of December 2010**2011 Budget as approved in D.08-11-031
See page 37 for additional information.8

Energy Efficiency Programs2010-2012 Programs September 2009 Decision approved $3.1 billion for efficiency programs
over three years, and additional $750 million for low income home retrofits.
Estimated to save ratepayers $4.2 billion net.*
Estimated 15,000 to 18,000 new or retained jobs.**
Numerous innovative initiatives aimed at transforming the market.
* Based on forecasted benefit-cost ratio of 1.36 in utility applications.**Job benefits calculated with a methodology from the Council of Economic Advisers’ May 2009
publication of “Estimates of Job Creation from the American Recovery and Reinvestment Act of 2009”.
See pages 38-39 for additional information.9

Smart Grid and Alt-Fueled Vehicles
Advanced Meters currently in full-scale deployment by PG&E, SCE, SDG&E, and SoCalGas. To date, 12.3 M meters installed out of 23M meters Expected completion by end of 2012 (electric)
Initiated an Advanced Meter opt-out proceeding to investigate opt-out options.
Reviewing utility plans for Smart Grid; will issue a decision mid-2012.
Adopted privacy rules to protect customer’s Advanced Meter usage data.
Determined that alternative-fueled vehicle service providers are not regulated as public utilities.
Affirmed TOU rates and metering arrangements for EVs and supports customer choice and competitive charging equipment market.
See pages 40-41 for additional information.
10

Key Highlights of California Solar Initiative (CSI)
CSI is 53% of the way towards its goals in less than 5 years. CSI installed 33% of goal and has another 23% of
goal pending installation. CSI combined with other state solar programs
accounts for 90,000+ solar projects and 900+ MW installed statewide.
CSI Installed
CSIPending
CSI Program
TotalNumber of
Solar Projects 53,225 11,161 64,386Megawatts
(MW) 584 348 932Incentives (millions) $1,090 M $417 M $1,507 M
Average system costs have declined by 20%+ since 2007 Started at $2.50/watt now $0.35/watt. CSI rebates now cover just 4% of the average system cost.
Solar installations continue to rise despite decline in incentives. CSI now installs an average of 20 MW per month. CSI installed a record of 147 MW in 2011.
CSI Research and Development (RD&D) Program focuses on integrating solar projects into the grid and new solar business models. CSI RD&D program has awarded 18 grants for $34 million in funding. Projects work with 50 organizations and leverage $17 million in matching
funds. Low Income Solar Programs target affordable housing units with solar.
1,400+ pending and installed projects, for 29 MW of new solar on affordable housing.
www.CaliforniaSolarStatistics.ca.gov; August 3, 2011
11

Aggressive Implementation of Renewable Portfolio Standard (RPS)
Large IOUs achieved 17% RPS in 2010 (Increase from 15% in 2009) PG&E - 15.9% (14.4% in 2009) SCE - 19.3% (17.4% in 2009) SDG&E - 11.9% (10.5% in 2009)
CPUC continues to push hard to reach 20% and 33% mandates CPUC has approved 191 contracts for nearly 17,000+ MW of new and existing RPS-eligible
capacity Nearly 6,000 MW are under review, nearly all for new capacity
2,001 MW of new renewable capacity has come online since 2003
IOUs have sufficient projects under contract to meet a 33% RPS, but more work is needed to replace projects that may fail and to ensure that projects are developed in 2020 timeframe
CPUC has begun implementation of 33% by 2020 (SB x2) On May 5, 2011, the CPUC opened R.11-05-005 to continue the implementation and
administration of RPS Program
The CPUC intends to issue proposed decisions in the fourth quarter 2011 setting: 1) new portfolio content categories, 2) new RPS procurement targets, 3) the most urgent new compliance rules, and 4) implementing changes to the renewable feed-in tariff
12
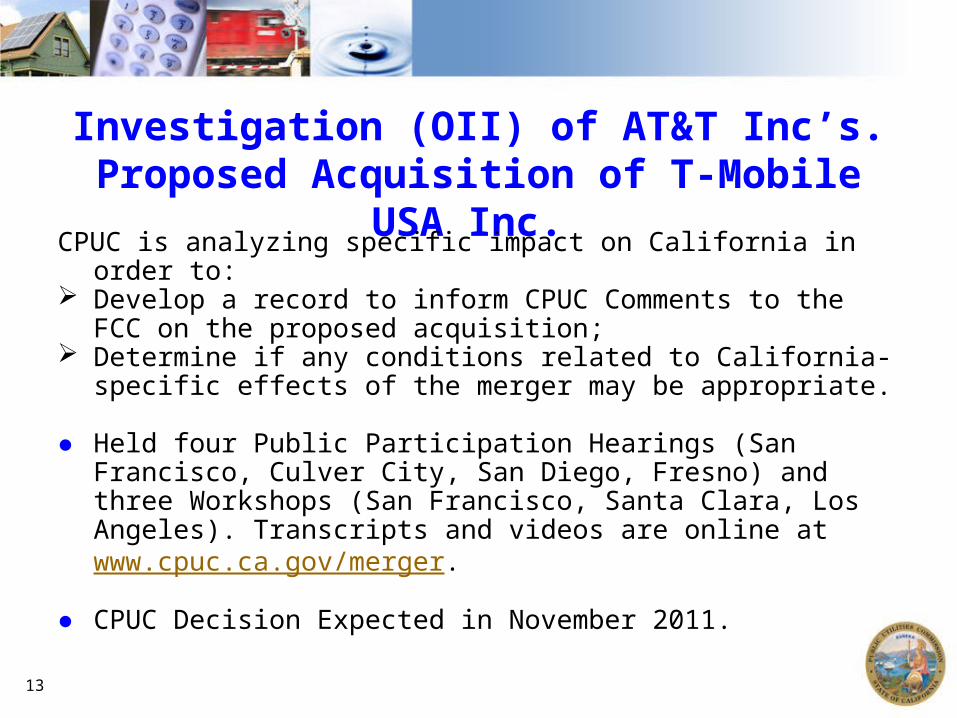
Investigation (OII) of AT&T Inc’s. Proposed Acquisition of T-Mobile USA Inc.
CPUC is analyzing specific impact on California in order to: Develop a record to inform CPUC Comments to the FCC on the
proposed acquisition; Determine if any conditions related to California-specific effects of
the merger may be appropriate.
● Held four Public Participation Hearings (San Francisco, Culver City, San Diego, Fresno) and three Workshops (San Francisco, Santa Clara, Los Angeles). Transcripts and videos are online at www.cpuc.ca.gov/merger.
● CPUC Decision Expected in November 2011.
13

Ensuring Universal Telephone ServiceLifeLine Program
LifeLine provides discounted basic local telephone service to an average of 1.7 million subscribers per month.
In 2011, the CPUC will implement Decision 10-11-033, which allows non-traditional carriers (wireless and VoIP) to participate in the program. In order to accomplish this, the decision: • Caps current LifeLine rate at $6.84 until December 31, 2012, and limits the LifeLine
rate to no more than 50% of a carrier’s basic service rate; • Expands the LifeLine program to include data services for consumers that receive
wireless equipment through the DDTP program. • Delinks LifeLine rates from AT&T’s basic service rates;• Provides a set monthly subsidy to customers;• Establishes an annual process to determine a Lifeline subsidy;
• Fiscal Year 2011/2012 Budget of $375 million is funded by a 1.15% surcharge on intrastate telecommunications services.
See pages 51-52 for additional information.14

Service QualityCPUC standard (G.O. 133-C) is that communications carriers restore customer
telephone service within 24 hours 90% of the time.
The four Large Local Exchange Carriers did not meet the goal in 2010.
Of 12 Small Local Exchange Carriers, nine met or exceeded the 90% in 24 Hour Standard in most cases.
Staff March 2011 report issued on the results of General Order 133-C Service Quality measures and the impact of Winter 2010/11 storms on service outages and recommended that the CPUC consider issuing an Order Instituting Investigation and Rulemaking to: Revisit the existing standards Consider incentive/penalty mechanisms Implement Real-time reporting processes during states of emergency or catastrophic
events
Staff is preparing an OII/OIR for CPUC consideration in September.
See page 53 for additional information.
15

Ubiquitous Broadband Total California Advanced Services Fund award to date is $44.98 million for 33
projects covering 10,186 square miles and benefiting 286,572 households. Senate Bill (SB) 1040 extended CASF indefinitely, expanded it to include three
accounts, and provided funding for the three accounts as follows:
(1) Broadband Infrastructure Grant Account - $100 M
(2) Rural and Regional Urban Consortia Grant Account - $10 M and
(3) Broadband Infrastructure Revolving Loan Account. - $15 M
CPUC received a $7.9 million dollar federal Recovery Act grant in order to collect broadband availability data from all broadband providers in the state and to support the California Broadband Council.
71% of households served by state-issued video franchisees and their affiliates subscribe to wireline broadband. This is up from 66% last year.
23% of the 27.7 million Californians over 17 years old, subscribe to mobile wireless broadband faster than 200 kbps in one direction.
See pages 54-55 for additional information.
16

Advancing Water Regulation CPUC regulates 127 water utilities serving about 18% of California residents;
and 13 sewer utilities. Implementing the 2009 Comprehensive Water Package – 20% reduction in
water use by 2020. Low income programs in place at 10 largest water utilities, serving 95% of
CPUC-regulated water ratepayers.
Water / Energy Nexus Re-defining water conservation as an energy efficiency strategy - Conserve
water, use less energy intensive water, make delivery systems more efficient.
RD&D programs underway now: Operating well pump / motor combination at optimal efficiency levels using specialized software programs; Replacement of mechanical pressure reducing valves with modern electrical regenerative flow control valves.
See pages 58-59 for additional information.
17

CPUC Initiatives SB 960 Compliance
Resolved 320 proceedings consistent with legislative deadlines.
Closed 355 proceedings in 2010 and reduced the average time that formal matters were open by approximately 67 days, or 26%.
Modernizing the CPUC
Continued to streamline processes and procedures to take advantage of new technology while maintaining parties’ due process rights.
In 2010 received 92% of filings electronically and processed them 30% faster (on average) than in 2009.
Expanding e-filing system to allow submission of testimony and exhibits electronically.
Reviewing CPUC processes Implemented a new agenda format to highlight proposed outcome and costs. Launched a subscription service to allow the public to follow proceedings
more easily. Established working groups with internal and external stakeholders to focus
on improving ex parte rules, public access, and practice and procedure.
18
20
Appendix

Customer Care and Protection
The CPUC responds to ratepayer inquiries, resolves customers’ informal complaints regarding their utility billing and services, assists the public participating in CPUC proceedings, and investigates and enforces public safety standards.
21

Customer Care and Supplier Diversity Wins for the Consumers:
Resolved through the Consumer Affairs Branch (CAB) over 21,600 utility customer complaints and helped to obtain $2.3 million in refunds/bill credits in 2010.
Improved CAB response time to consumers by 36% – in 2010 complaints were resolved, on average, in 45 days; compared to 70 days in 2009.
Technological improvements are being made to CAB’s phone system.
Resolution CSID-003 was approved allowing a set of customer complaint data to be published on the website. Feedback is being solicited on the data posting and will guide efforts to post additional data.
Online access provides benefit to consumers:
Electronic online form accessed through CPUC website allows consumers to submit complaints to CAB 24/7.
Electronic online form accessed through CPUC website allows public speakers to sign up to speak at CPUC Voting/Business Meetings in advance.
22

Customer Care and Supplier Diversity (cont.) Established a Small Business Advisory Council to ensure that small businesses
are educated about regulatory policies and have the right tools to make informed decisions.
Supplier Diversity – General Order 156 Results - 2010 Performance
Both Verizon and AT&T wireline have surpassed the 40% mark in procurement from diverse suppliers.
Cal-AM Water procured over 26% of their total from diverse suppliers; this has never been done in the water industry.
Overall, the traditional six companies once again exceeded their prior year procurement from diverse suppliers; this time around by an unprecedented $900 million. For calendar year 2009 the traditional six companies’ total procurement from diverse suppliers was just over $3 billion, while for calendar year 2010 it was just over $3.9 billion. PG&E = $1.1 billion or 32.67% SDG&E = $385 million or 36.68% SoCalGas = $230 million or 37.42% SCE = $1.1 billion or 27.10% AT&T = $948 million or 40.04% Verizon = $123 million or 41.30% 23

24
The Energy Industry
The CPUC regulates investor-owned electric and gas utilities (such as PG&E, SCE, SDG&E and SCG), which serve over two-thirds of electricity demand and over three-quarters of natural gas demand in the state.

Overview of Pipeline Failure
On Sept. 9, 2010, a PG&E pipeline (132) exploded in San Bruno
Line 132 Statistics:
30-inches in diameter
.375” wall thickness
Steel
Operating Pressure: 386 psig at time of rupture (MAOP: 400 psig)
Runs from Milpitas to San Francisco (>50 miles)
28-foot-long ruptured section of pipeline at laboratory facilities at the NTSB Training Center, Ashburn, VA
25

Impact of Pipeline Failure
8 Deaths
65 Injuries
37 Homes destroyed or demolished
48 Homes damaged
View of ruptured section of pipeline with NTSB investigator cleaning a fracture surface
26

Map of Line 132
27

The InvestigationAreas of Inquiry:
PG&E recordkeeping
Setting maximum pressures
Corrosion
Excavation damage
Maintenance Records
Pipeline inspection technology
Internal
External
Automatic valves and remote controlled valves
Rate Regulation for Infrastructure Maintenance, Improvement, and Replacement
CPUC Inspector on-site in San Bruno
28

Regulatory Response
National Transportation Safety Board
U.S. Department of Transportation:
Pipeline and Hazardous Materials Safety Administration (PHMSA)
California Public Utilities Commission
29

Ruptured segment installed in 1956 Metallurgy report indicates longitudinal weld failure
No evidence of corrosion or dig-in damage PG&E records appeared to show pipe was seamless Slight pressure spike (from 375 to 386 psig) just prior to rupture,
due to equipment failure upstream at Milpitas “Urgent Safety Recommendation” that PG&E diligently search for
as-built drawings and other pipeline records Hearing on San Bruno accident conducted March 1-3, 2011; final
NTSB investigation report anticipatedAugust 2011
NTSB Findings and Recommendations to Date
30

The Federal Department of Transportation’s PHMSA is responsible for natural gas pipeline safety regulations codified at 49 C.F.R.
Pipeline Safety Forum hosted by DOT Secretary Ray LaHood, Washington, D.C., April 18, 2011
PHMSA relies on state agencies (such as CPUC) as partners to conduct inspections and enforce federal pipeline safety rules
Pipeline and Hazardous Materials Safety Administration (PHMSA) Response
31
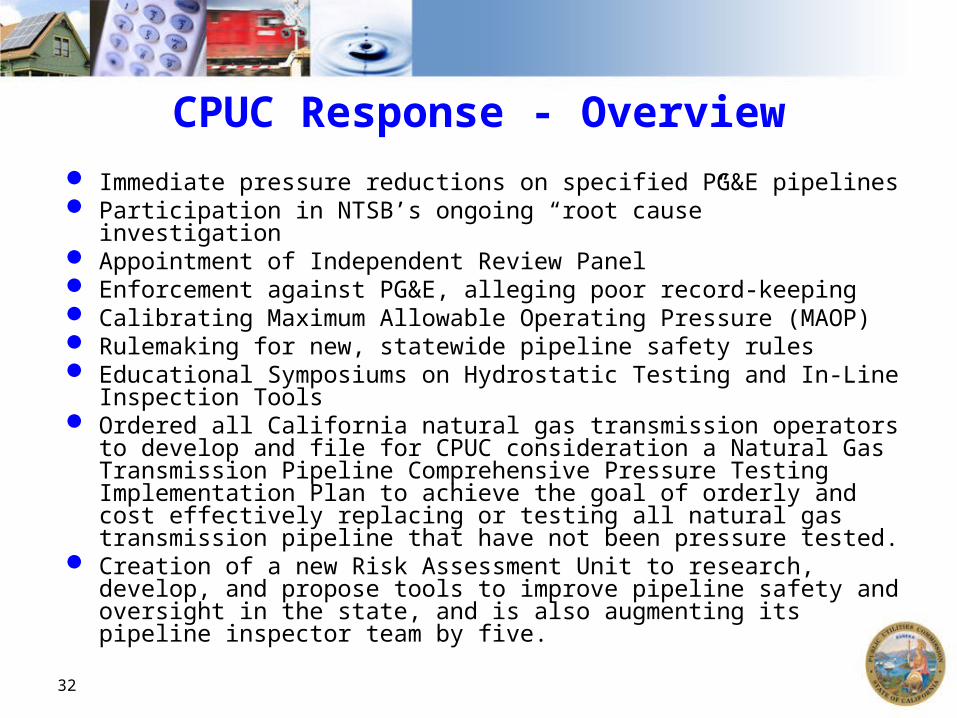
Immediate pressure reductions on specified PG&E pipelines Participation in NTSB’s ongoing “root cause” investigation Appointment of Independent Review Panel Enforcement against PG&E, alleging poor record-keeping Calibrating Maximum Allowable Operating Pressure (MAOP) Rulemaking for new, statewide pipeline safety rules Educational Symposiums on Hydrostatic Testing and In-Line Inspection
Tools Ordered all California natural gas transmission operators to develop and
file for CPUC consideration a Natural Gas Transmission Pipeline Comprehensive Pressure Testing Implementation Plan to achieve the goal of orderly and cost effectively replacing or testing all natural gas transmission pipeline that have not been pressure tested.
Creation of a new Risk Assessment Unit to research, develop, and propose tools to improve pipeline safety and oversight in the state, and is also augmenting its pipeline inspector team by five.
CPUC Response - Overview
32

Next Steps
NTSB Final Report
Possible future additional CPUC enforcement action against PG&E, depending on what NTSB finds
Continuing consideration of rule changes for all gas pipeline operators in California
Continuing consideration of penalties against PG&E for poor recordkeeping
33

Ensuring Natural Gas ProcurementCosts Are Reasonable
Due to moderate natural gas prices (shown on next slide), core bundled gas rates in 2010 remained low relative to previous years.
Neither the CPUC nor the FERC regulates the price of natural gas. The CPUC oversees utility procurement of natural gas supplies by:
adopting gas cost incentive mechanisms, adopting an expedited process under which utilities obtain interstate pipeline
capacity, ensuring that core customers have adequate storage capacity.
In January 2010, the CPUC ordered the utilities to be at risk for some of their gas hedging costs, which should require the utilities’ price risk management to be more efficient.
In late 2008, the CPUC approved long-term interstate transportation contracts for PG&E on the proposed Ruby Pipeline. A major new interstate pipeline delivering Rockies supplies to California, Ruby Pipeline went into operation in July 2011.
34

Gas Daily Monthly Spot Gas Prices
0
2
4
6
8
10
12
14
Jun-
07
Sep
-07
Dec
-07
Mar
-08
Jun-
08
Sep
-08
Dec
-08
Mar
-09
Jun-
09
Sep
-09
Dec
-09
Mar
-10
Jun-
10
Sep
-10
Dec
-10
Mar
-11
Jun-
11
$/M
MB
tu
PG&E Citygate SoCal Gas Border Henry Hub SoCalGas Citygate
35

36
Electric Rate Changes Have Tracked Inflation Since 2003
0.00
0.02
0.04
0.06
0.08
0.10
0.12
0.14
0.16
2003 2004 2005 2006 2007 2008 2009 2010
$ kW
h
PurchasedPower
Bonds & Fees
Demand SideManagement
Transmission
Distribution
Utility OwnedGeneration
2003 Inflation-adjusted rate

Low Income Programs Provide Bill Assistance and Energy Efficiency Improvements for Eligible Customers
Two main programs for low income assistance:1. California Alternate Rates for Energy (CARE)
Provides a 20% discount on electric and natural gas bills to more than 5 million households. 2. Energy Savings Assistance Program (ESAP)
Provides qualified low income households with energy efficient appliances, energy education and weatherization measures at no cost (formerly known as Low Income Energy Efficiency Program).
Need for low income assistance expected to increase:Increased Reach*:
Now treating 300,000+ homes/year with efficiency solutions, cumulatively reaching 1.2 million homes since 2006
With the CPUC’s goal of 90%+ penetration, as well as the economic downturn, CARE enrollments have risen to 5 million with an estimated statewide penetration of 94%
Increased Budget**: ESAP will provide $320 million in efficiency services to low income homes in 2011, and
employ approximately 110 contractor firms and Community Based Organizations in program delivery.
CARE will provide approximately $877 million in bill discounts in 2011. The total combined efficiency and bill discount assistance provided to low income
households in 2011 will amount to $1.2 billion, provided by all other ratepayers.*Data as of December 2010 **2011 Budget as approved in D0811031
37

Energy Efficiency Programs2010-2012 Programs September 2009 Decision approved $3.1 billion for efficiency programs, and
additional $750 million for low income home retrofits.
Energy Efficiency is the least cost, most reliable, and most environmentally sensitive resource to meet growing demand and GHG reduction goals.
Supports energy, greenhouse gas, and criteria pollutant savings equivalent to three new power plants.
Estimated to save ratepayers $4.2 billion net.*
Estimated 15,000 to 18,000 new or retained jobs.**
Numerous innovative initiatives aimed at transforming the market.
* Based on forecasted benefit-cost ratio of 1.36 in utility applications.**Job benefits calculated with a methodology from the Council of Economic Advisers’ May 2009 publication of
“Estimates of Job Creation from the American Recovery and Reinvestment Act of 2009”.
38

Energy Efficiency Budgets 2010-2012
Residential23%
Commercial29%
Industrial13%
Agriculture4%
New Construction4%
Institutional - UC/CSU, DGS, Etc4%
Local Gov't Partnerships6%
HVAC4%
Evaluation, Meas. & Verification
4%
OTHER9%
Residential
Commercial
Industrial
Agriculture
New Construction
Institutional - UC/CSU, DGS, Etc
Local Gov't Partnerships
HVAC
Evaluation, Meas. & Verification
OTHER
39
Investor-Owned Utility 2010-12 Energy Efficiency Budget by Program Areas

Advanced Meters Leading the Way to Smart Grid and Demand Reduction Opportunities
Advanced Meters currently in full-scale deployment by PG&E, SCE, SDG&E, and SoCalGas.
To date, 12.3 M meters installed out of 23M meters Expected completion by end of 2012 (electric) Represents a $5.6 billion investment Enables significant operational savings to utilities and
new consumer benefits by providing hourly usage data, automatic data collection, and timely detection of grid reliability issues
CPUC conducted independent investigation of accuracy of Advanced Meters in 2010 and found that PG&E’s advanced meters are accurate
CPUC initiated an advanced meter opt-out proceeding to investigate opt-out options Workshop is scheduled in September 2010 to gather information on potential
costs & implementation issues. All IOUs will participate in workshop and provide data / analysis with respect to
their AMI systems. CPUC required PG&E, SCE, SDG&E to file 10-year smart grid deployment plans in
late June 2011 to comply with Commission’s Smart Grid policy decisions and SB 17. Commission will review utility plans for Smart Grid and issue a decision in mid-
2012 on utility smart grid plans. CPUC adopted privacy rules to protect customer’s Advanced Meter usage data
40

Alternative-Fueled Vehicle Rulemaking Status
October 2009: SB 626 (Kehoe) enacted. July 2010: CPUC Decision that 3rd party EV
service providers not regulated as public utilities. July 2011: CPUC Decision:
Affirms TOU rates and metering arrangements Orders EV notification assessment report Upgrade costs treated as shared until 2013 Orders load profile and cost research Initiates lower-cost customer-owned submeter
protocol process Supports customer choice and competitive
charging equipment market41

Key Highlights of California Solar Initiative (CSI)
CSI is 53% of the way towards its goals in less than 5 years. CSI installed 33% of goal and has another 23% of
goal pending installation. CSI combined with other state solar programs
accounts for 90,000+ solar projects and 900+ MW installed statewide.
CSI Installed
CSIPending
CSI Program
TotalNumber of
Solar Projects 53,225 11,161 64,386Megawatts
(MW) 584 348 932Incentives (millions) $1,090 M $417 M $1,507 M
Average system costs have declined by 20%+ since 2007 Started at $2.50/watt now $0.35/watt. CSI rebates now cover just 4% of the average system cost.
Solar installations continue to rise despite decline in incentives. CSI now installs an average of 20 MW per month. CSI installed a record of 147 MW in 2011.
CSI Research and Development (RD&D) Program focuses on integrating solar projects into the grid and new solar business models. CSI RD&D program has awarded 18 grants for $34 million in funding. Projects work with 50 organizations and leverage $17 million in matching
funds. Low Income Solar Programs target affordable housing units with solar.
1,400+ pending and installed projects, for 29 MW of new solar on affordable housing.
Source: www.CaliforniaSolarStatistics.ca.gov; August 3, 2011
42

Aggressive Implementation of Renewable Portfolio Standard (RPS)
Large IOUs achieved 17% RPS in 2010 (Increase from 15% in 2009) PG&E - 15.9% (14.4% in 2009) SCE - 19.3% (17.4% in 2009) SDG&E - 11.9% (10.5% in 2009)
CPUC continues to push hard to reach 20% and 33% mandates CPUC has approved 191 contracts for nearly 17,000+ MW of new and existing RPS-eligible
capacity Nearly 6,000 MW are under review, nearly all for new capacity
2,001 MW of new renewable capacity has come online since 2003
IOUs have sufficient projects under contract to meet a 33% RPS, but more work is needed to replace projects that may fail and to ensure that projects are developed in 2020 timeframe
CPUC has begun implementation of 33% by 2020 (SB x2) On May 5, 2011, the CPUC opened R.11-05-005 to continue the implementation and
administration of RPS Program
The Commission intends to issue proposed decisions in the fourth quarter 2011 setting: 1) new portfolio content categories, 2) new RPS procurement targets, 3) the most urgent new compliance rules, and 4) implementing changes to the renewable feed-in tariff
43

Increased focus on wholesale distributed generation (DG) Diversifying RPS procurement with smaller RPS projects could potentially
avoid the need for new transmission to meet RPS targets. Potential benefits of the sector include:
Quick project development timelines
Avoidance of new transmission
Declining technology prices (i.e., solar PV)
Insurance for riskier, large-scale renewable projects
CPUC adopted the Renewable Auction Mechanism (RAM) (December, 2010) RAM solicitations open to all technologies, 0 - 20 MW in size
Project viability screens, standard contract, and pay as bid
First auction will occur in 4th Quarter 2011
CPUC implementing changes to Renewable FIT statute (SB 32 and SB 2 (1x))
ALJ intends to issue a proposed decision by the end of the year
Distribution interconnection reform Interconnection process and timing is a challenge to quick system-side DG development
CPUC staff re-launched the Rule 21 Working Group in April 2011 and has scheduled a second workshop for August 2011 in order to update and reform the current Rule 21 tariff
44

Combined Heat and Power (CHP)
CHP is a large cornerstone of the CA electric grid (6,000+ MW) and is a preferred resource. GHG Benefits, economic development, locational benefits to the grid and
reliability. December 2010: CPUC adopted a major all party settlement agreement creating
a new CHP program through 2020, resolving major pending litigation and provides orderly transition into new competitive procurement paradigm. In June 2011 FERC granted utility request to eliminate the must take obligation for
QF facilities 20 MW and greater, setting the stage for the settlement to go into effect.
December 2010: CPUC adopts decision implementing CHP Feed-in Tariff (AB 1613, Blakeslee).
July and October 2010: CPUC effectively argued at FERC to pave the pathway for Feed-in Tariffs for preferred resources (small new highly efficient CHP in this instance). In the wake of FERC determinations, CPUC resolved utility applications for
rehearing of AB1613 decision – modified advice letters are currently pending before the Commission.
Overall, the CPUC has created an environment conducive to the deployment of efficient CHP; we anticipate major activity over the next few years.
45

Coordination of Planning Processes to Facilitate Achievement of RPS Goals
Transmission planning within California and throughout the West: Working closely with CAISO and stakeholders to facilitate necessary “network”
expansions of the grid to support clean energy goals, through implementation of a new category of “policy-driven” transmission projects within ISO tariff.
Coordinating resource and transmission planning: Pursuant to a May 2010 MOU, CPUC and ISO are coordinating resource and
transmission planning to strengthen the state’s planning and permitting processes. CPUC and ISO processes use CEC IEPR forecasts and information developed by the
Renewable Energy Transmission Initiative to promote consistency between processes at the CPUC, CAISO, CEC and IOUs.
CPUC provided 33% by 2020 RPS scenarios for the ISO’s use in its 2011-2012 transmission planning process. ISO vetted these scenarios with ISO stakeholders.
Working with ISO to ensure consideration of long-term procurement priorities, costs, and high-level siting considerations early in the transmission planning process, to smooth permitting at the CPUC.
46

Resource Adequacy and Energy Procurement Programs Ensure Reliable Electric Service at Reasonable Cost
Ensuring resource adequacy The CPUC’s Resource Adequacy program ensures that sufficient generation is under
contract to meet short term needs (monthly and annually). The CPUC’s Long Term Procurement Program ensures sufficient new resources are
constructed to meet long term needs (10 years out). 962 MW of new natural gas fueled generation came into operation in 2010 as a
result of utility procurement activities. CPUC approved applications for the construction of 1,743 MW of new natural gas
fueled generation in 2010. Analyses of Energy Efficiency programs, Demand Response programs, Renewable
energy projects, and cost effective combined-heat and power projects are on-going to ensure that the use of fossil generation is minimized.
CPUC is working closely with California agencies to eliminate once-through-cooling systems in electric power plants and meet air restrictions in the L.A. Basin while ensuring that electric reliability is not threatened.
Implementing energy procurement policy to ensure reliable service at a reasonable cost
Increased focus on integrating preferred renewable resourcesat lowest cost.
47

48
Electric Energy Storage
July 2010: CPUC releases Staff White Paper on barriers and opportunities for energy storage.
September 2010: AB 2415 (Skinner) chaptered Asks CPUC to determine appropriate targets to procure viable and
cost-effective energy storage. Procurement targets, if any, to be achieved by end of 2015 and
2020. December 2010: Issued Order Instituting Rulemaking
Legislation asks for proceeding to commence by March 2013; CPUC is ahead of schedule.
Will address overall policy goals of energy storage and establish cost-effectiveness methodology.
Held workshops on March 9, 2011 and June 28, 2011.
48

The Communications Industry
The CPUC manages universal telephone service programs, issues video franchises, monitors customer service and public safety standards for telephone services, regulates rates for basic phone service and rural carriers, licenses telephone corporations, and responds to federal telecommunications initiatives.
49

Investigation (OII) of AT&T Inc’s. Proposed Acquisition of T-Mobile USA Inc.
CPUC is analyzing specific impact on California in order to:
● Develop a record to inform CPUC Comments to the FCC on the proposed acquisition;
● Determine if any conditions related to California-specific effects of the merger may be appropriate;
CPUC Decision Expected in November 2011
50
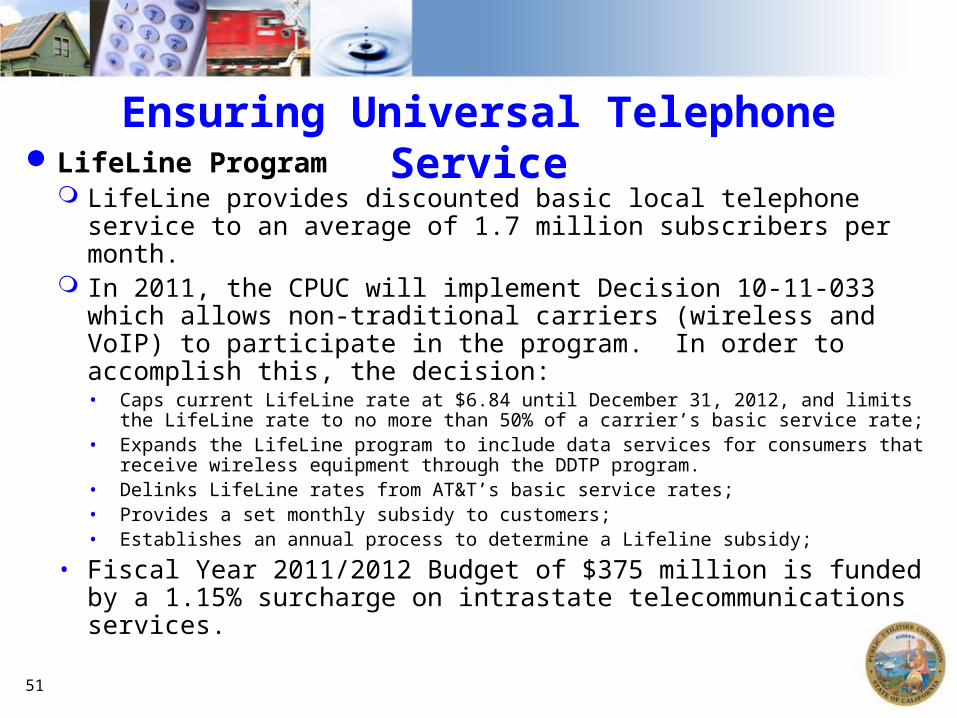
Ensuring Universal Telephone ServiceLifeLine Program
LifeLine provides discounted basic local telephone service to an average of 1.7 million subscribers per month.
In 2011, the CPUC will implement Decision 10-11-033 which allows non-traditional carriers (wireless and VoIP) to participate in the program. In order to accomplish this, the decision: • Caps current LifeLine rate at $6.84 until December 31, 2012, and limits the LifeLine
rate to no more than 50% of a carrier’s basic service rate; • Expands the LifeLine program to include data services for consumers that receive
wireless equipment through the DDTP program. • Delinks LifeLine rates from AT&T’s basic service rates;• Provides a set monthly subsidy to customers;• Establishes an annual process to determine a Lifeline subsidy;
• Fiscal Year 2011/2012 Budget of $375 million is funded by a 1.15% surcharge on intrastate telecommunications services.
51

California Teleconnect Fund (CTF) Program:
The CTF provides a 50% discount on eligible telecommunications and internet access services to schools, libraries, government health care providers, non profit community-based organizations (CBOs), and California Community Colleges.
At the end of June 2011, the CTF program had approximately 5,900 participants, of which over 3,100 are CBOs.
To assist the CTF program in bridging the digital divide, a contractor was selected to conduct outreach to CBOs and government health care providers.
Commencing Fall 2011, the CTF will further leverage its resources by requiring federal discounts be applied to rural health care provider’s eligible services prior to applying the CTF discount.
Deaf and Disabled Telecommunications Program (DDTP) DDTP provides relay service and assistive telecommunications equipment for
persons who are deaf and disabled through the California Relay Service and California Telephone Access Program, respectively.
In 2012, CPUC expects to continue to move forward to include wireless equipment as a permanent part of DDTP.
Ensuring Universal Telephone Service (continued)
52

Service QualityCPUC standard (G.O. 133-C) is that communications carriers restore
customer telephone service within 24 hours 90% of the time. The four Large Local Exchange Carriers did not meet the goal in 2010.
Verizon, Sure West and Citizens of California restoral percentage ranged from a low of 60% to a high of 96%.
AT&T’s results ranged from a low of 32% to high of 70% Average duration for outages for AT&T is 36 hours.
Of 12 Small Local Exchange Carriers, nine met or exceeded the 90% in 24 Hour Standard in most cases. Pinnacles, Ponderosa, and Volcano fell short of the goal.
Staff report issued in March 2011 on the results of reported General Order 133-C Service Quality measures and the impact of Winter 2010/11 storms on service outages and recommended that the CPUC consider issuing an Order Instituting Investigation and Rulemaking to: Revisit the existing standards Consider incentive/penalty mechanisms Implement Real-time reporting processes during states of emergency or catastrophic
events Staff is preparing an OII/OIR for CPUC consideration in September.
53

California Advanced Service Fund (CASF) The total CASF award to date is $44.98 million for 33 projects covering 10,186
square miles and benefiting 286,572 households Unserved areas : $ 5.08 million for 16 projects covering 3,254square miles
and benefiting 31,159 households Underserved areas : $39.90 million for 17 projects covering 6,932 square
miles and benefiting 255,413 households Funding for 17 previously approved projects have been rescinded because
applicants: opted out of the project or are unable to secure funding either through loans, private investments or through the Recovery Act
14 projects have been completed Other projects are either under construction or undergoing pre-construction activities Senate Bill (SB) 1040 extended CASF indefinitely, expanded it to include three
accounts, and provided funding for the three accounts as follows:
(1) Broadband Infrastructure Grant Account - $100 M
(2) Rural and Regional Urban Consortia Grant Account - $10 M and
(3) Broadband Infrastructure Revolving Loan Account. - $15 M
54

Mapping Broadband Deployment
CPUC received a $7.9 million dollar federal Recovery Act grant in order to collect broadband availability data from all broadband providers in the state and to support the California Broadband Council
Data collection and mapping efforts support both state and federal programs Spring 2011 CPUC submission of data to the NTIA
CASF, DIVCA, Rural Telecommunications Infrastructure (RTI)
Broadband Deployment is increasing 71% of households served by state-issued video franchisees and their affiliates
subscribe to wireline broadband. This is up from 66% last year. 23% of the 27.7 million Californians over 17 years old, subscribe to mobile
wireless broadband faster than 200 kbps in one direction.
55

DIVCA Implementation of State Issued Video Franchises
Under the Digital Infrastructure and Video Competition Act of 2006 (DIVCA), video competition has increased quickly
The CPUC has issued 144 Video Franchises and amendments to 41 companies
AT&T and Verizon have exceeded their three year and two year build out obligations to offer video services to more than 35% and 25% of the households in their service areas. Combined, both companies now offer video to more than 5.3 million households in California.
As of December 2010, 70% of all video customers in the state are served by state video franchise holders. This is up from 62% in Dec. 2009.
56

The Water Industry
The CPUC is responsible for ensuring that investor-owned water utilities deliver clean, safe, and reliable water service at reasonable rates.
57

Advancing Water Regulation CPUC regulates 127 water utilities serving about 18% of
California residents; and 13 sewer utilities.
Water Supply and Conservation Water Action Plan 2010 Update Adopted
• Water Conservation is the best, lowest cost of supply.
• Implementing the 2009 Comprehensive Water Package – 20% reduction in water use by 2020 - now.
• Coordinating our efforts with other state agencies.
Aggressive water conservation policies in place for our larger water utilities• Decoupled Sales and Revenues.
• Implemented Tiered Rates.
• Increased water conservation budgets
Recycled Water rulemaking opened
58

Advancing Water Regulation (continued) Low-Income Ratepayer Assistance
Programs in place at our ten largest water utilities, serving 95% of our water ratepayers.
Rules issued to increase up-take rate for these programs.• Sharing of information among water and energy utilities.
Water / Energy Nexus Re-defining water conservation as an energy efficiency strategy
• Conserve water, use less energy intensive water, make delivery systems more efficient.
RD&D programs underway now• Operating well pump / motor combination at optimal efficiency
levels using specialized software programs.• Replacement of mechanical pressure reducing valves with
modern electrical regenerative flow control valves.
59
60
CPUC Administrative Initiatives
CPUC Initiatives SB 960 Compliance
Resolved 320 proceedings consistent with legislative deadlines.
Closed 355 proceedings in 2010 and reduced the average time that formal matters were open by approximately 67 days, or 26%.
Modernizing the CPUC
Continued to streamline processes and procedures to take advantage of new technology while maintaining parties’ due process rights.
In 2010 received 92% of filings electronically and processed them 30% faster (on average) than in 2009.
Expanding e-filing system to allow submission of testimony and exhibits electronically.
Reviewing CPUC processes Implemented a new agenda format to highlight proposed outcome and costs. Launched a subscription service to allow the public to follow proceedings
more easily. Established working groups with internal and external stakeholders to focus
on improving ex parte rules, public access, and practice and procedure.
61