Presentation to American Australian Association
26
Presentation to American Australian Association New York 10 June 2002 John McFarlane, Chief Executive Officer Australia and New Zealand Banking Group Limited
Transcript of Presentation to American Australian Association

Presentation to American Australian Association
New York10 June 2002
John McFarlane, Chief Executive OfficerAustralia and New Zealand Banking Group Limited

Page 2
AgendaAgenda
1. The Australian economy – from boom/bust to a moreresilient foundation.
2. The emergence of financial services as a cornerstoneof the economy
3. Culture and intangible factors increasingly drivingvalue creation

Page 3
0.0
1.0
2.0
3.0
4.0
5.0
6.0
1950s 1960s 1970s 1980s 1990s
Australia Rest of the OECD
% per annum
Australia’s apparently superior growth rate in the Australia’s apparently superior growth rate in the 1950s and 1960s was largely due to immigration1950s and 1960s was largely due to immigration
Real GDP growth
Source: GGDC Total Economy Database; Economics@ANZ.
Population growth
0.0
0.5
1.0
1.5
2.0
2.5
1950s 1960s 1970s 1980s 1990s
Australia Rest of the OECD
% per annum

Page 4
Australia ‘opted out’ of postAustralia ‘opted out’ of post--war war globalizationglobalization--led growth, until the midled growth, until the mid--1980s1980s
Exports as a share of GDP
Sources: Angus Maddison, Monitoring the World Economy 1820-1992 (OECD); IMF, World EconomicOutlook database; ABS.
0
5
10
15
20
25
1870 1913 1929 1950 1973 1985 2000
Australia World
% of GDP

Page 5
0.0
0.5
1.0
1.5
2.0
2.5
3.0
3.5
4.0
4.5
1950s 1960s 1970s 1980s 1990s
Australia US OECD average
% per annum
Only in the past 10 years has Australian per capita Only in the past 10 years has Australian per capita GDP grown faster than for the US and OECD as a GDP grown faster than for the US and OECD as a wholewhole
Per capita GDP growth
Source: GGDC Total Economy Database; Economics@ANZ.

Page 6
Australian productivity growth exceeded the OECD Australian productivity growth exceeded the OECD (and US) average in the 1990s(and US) average in the 1990s
Sources: Productivity Commission; GGDC Total Economy Database 2002.
Labour productivity growth
01122334455
1960-1973 1973-1990 1990-2001
Australia USA OECD
Average annual rate of growth, %

Page 7
The terms on which Australia trades with the world The terms on which Australia trades with the world have been improving since the midhave been improving since the mid--1980s1980s
Ratio of Australian export prices to import prices
Source: ABS.
85
95
105
115
125
135
145
61 66 71 76 81 86 91 96 01
1999-2000 = 100(4-qtr moving average)

Page 8
Australia’s export markets have changed Australia’s export markets have changed significantly over the last forty yearssignificantly over the last forty years
Share of exports -1960
Source: DFAT
Share of exports -2001
United Kingdom
Japan
FranceUnited StatesNew
Zealand
Other Other
New Zealand
United States
Japan
Korea
China

Page 9
0.0
2.0
4.0
6.0
8.0
10.0
12.0
1950s 1960s 1970s 1980s 1990s
Australia OECD
% per annum
Australia’s inflation rate has been lower than the Australia’s inflation rate has been lower than the OECD average for the first time since the 1960sOECD average for the first time since the 1960s
Inflation
Sources: Dresdner Bank; OECD; ABS. OECD excludes Turkey.

Page 10
-2
-1
0
1
2
3
4
5
6
7
91 93 95 97 99 01
% change from year earlier
US
Australia
After years of growing in sync, the US and After years of growing in sync, the US and Australian economies have diverged recently Australian economies have diverged recently
Sources: Datastream
Real GDP growth

Page 11
-2
-1
0
1
2
3
4
5
6
7
96 97 98 99 00 01 02 03
% change from year earlier
GDP
NZ has also weathered the tougher international environment well and is well positioned for continued reasonable growth
NZ real GDP growth
Sources: Statistics NZ; NZ Economics@ANZ
l NZ has also experienced a strong upswing in housing activity in response to last year’s interest rate reductions and a striking turn-around in net immigration (also supporting consumer spending)
l The stronger NZ$ and lower agricultural commodity prices (especially for dairy products) will result in a fall in export incomes this year
l Lower rural incomes, higher interest rates and, eventually, some tapering off in net immigration will lead to softer growth in domestic spending
l Overall growth is expected to slow from 3½% in 2002 to 2¾% in 2003

Page 12
0
1
2
3
4
5
6
7
96 97 98 99 00 01 02 03
% change from year earlier
GDP
GDP excl. housing
Source: ABS Cat. 5206.0, ANZ
The sources of growth in the Australian economy The sources of growth in the Australian economy are likely to change over the next twelve months are likely to change over the next twelve months
Australian economic growth

Page 13
-100
0
100
200
300
400
92 94 96 98 00 02
A weak US dollar and wider interest differentials A weak US dollar and wider interest differentials have supported the Australian dollarhave supported the Australian dollar
Interest rate spread
Source: Datastream; Reserve Bank; Economics@ANZ.
A$ vs US$
40
45
50
55
60
65
70
75
80
85
92 94 96 98 00 02
US centsbasis points
Difference betweenUS and Aus 3minterest rates

Page 14
Financial services play an increasingly Financial services play an increasingly important role in the Australian marketimportant role in the Australian market
BHP
NAB
CRA
NewsCorp
Coles Myer
BTR Nylex
Western Mining
Pacific Dunlop
Westpac
Fosters
22.98
9.92
8.70
8.20
7.02
6.51
5.06
4.88
4.61
4.50
12.3%
5.3%
4.6%
4.4%
3.7%
3.5%
2.7%
2.6%
2.5%
2.4%
NAB
NewsCorp
CBA
BHP
ANZ
Telstra
Westpac
AMP
RIO
Woolworths
56.79
49.33
42.65
38.50
29.73
29.21
28.98
19.08
17.49
13.78
14.20
12.47
10.47
9.55
7.42
7.37
7.13
4.71
4.28
3.45
Market Cap $b
Market Cap $b
% of index
% of index
1992 2002
1992 ANZ - $4.4b & 2.3%
1
2
3
4
5
6
7
8
9
10
1
2
3
4
5
6
7
8
9
10

Page 15
Australian banks are well placed in the Australian banks are well placed in the second tier of global bankssecond tier of global banks
0
5
10
15
20
25
30
35
NAB
Royal Ban
k Can
ada CB
A
Abbe
y Nation
al ANZ
WBC
Mellon
Finan
cial TD
Stand
ard Ch
artere
d CIBC
Bank of
Mon
treal
Market CapitalisationUSD $b

Page 16
Intangible factors are increasingly driving value Intangible factors are increasingly driving value creationcreation
Unique strategySustainable leadership
Growth opportunities
Return on equityCost of capital
Strong brand
Talented peopleVibrant culture
$4.98$7.21
$4.04
$12.68
$0
$5
$10
$15
$20
$25
1998 Today
$9.02
$19.89
Share price
Compound growth rate
33%
Compound growth rate
9%Intangible net assets per shareTangible net assets per share

Page 17
-1000
0
1000
2000
3000
4000
5000
6000
7000
8000
1992 1993 1994 1995 1996 1997 1998 1999 2000 2001 Mar-02* 0
200
400
600
800
1000
1200
Revenue (LHS)Expenses (LHS)Provisions (LHS)Profit (LHS)TSR (RHS)
ANZ Bank - repositioning, then new momentum
* Mar-02 annualised
$mValu
e of $
100 in
vested in
1992
Page 18
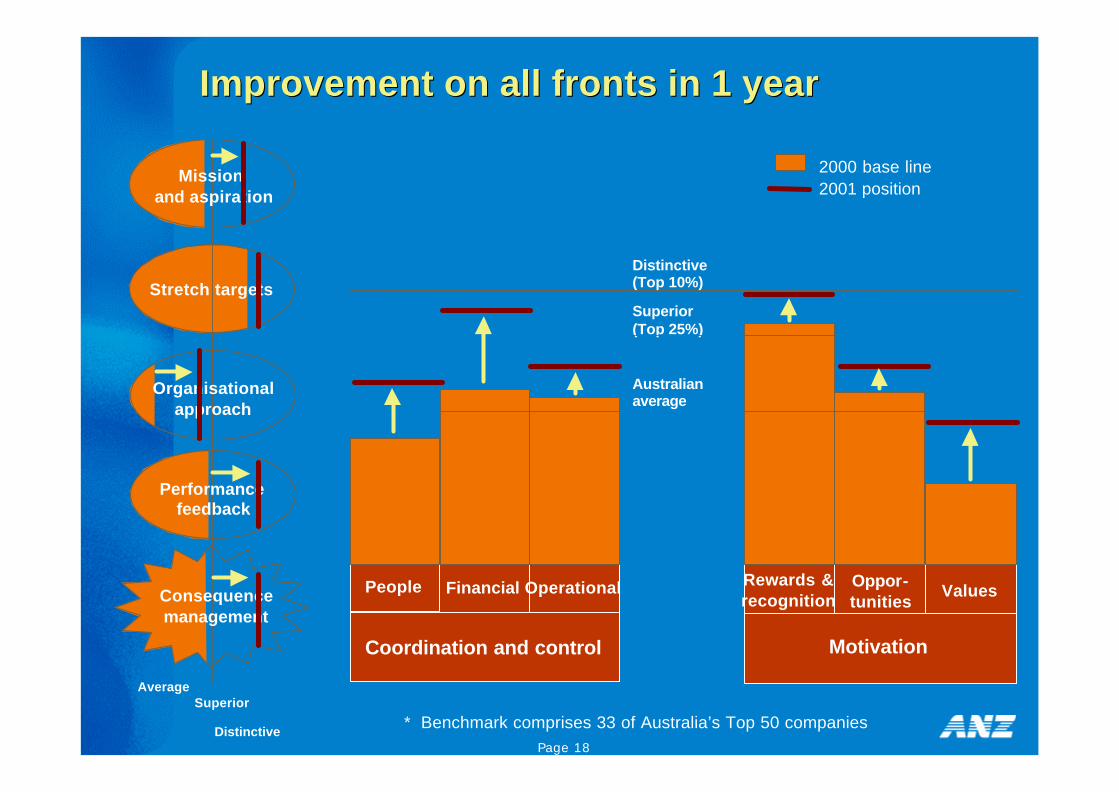
Improvement on all fronts in 1 yearImprovement on all fronts in 1 year
AverageSuperior
Distinctive* Benchmark comprises 33 of Australia’s Top 50 companies
Coordination and control
Financial OperationalPeople
Distinctive (Top 10%)
Superior (Top 25%)
Australian average
Motivation
Rewards &recognition
Oppor-tunities
Values
2000 base line2001 position
Stretch targets
Consequencemanagement
Missionand aspiration
Organisationalapproach
Performance feedback

Page 19
Our culture is changing dramatically Our culture is changing dramatically --improvement in ANZ Valuesimprovement in ANZ Values
InAccountabilityAchievementCustomer focusContinuous improvement
OutBureaucracyHierarchyControlShort-term focus
Cost reductionShareholder valueResults drivenProfitLow riskGoals orientation
Maintained

Page 20
Our people are engagedOur people are engaged
0
10
20
30
40
50
60
70
80
Overall satisfaction with ANZ Recommend ANZ as a place to work
1999 2000
2001 2002
Staff satisfaction survey

Page 21
AAllll stakeholders key to value creationstakeholders key to value creation
Shareholders
• EPS double-digit
• Cost-Income mid 40’s
• ROE above 20%
• Intangible value
• Distinctive disclosure
Customers
• Restoring customer faith
• Simplified accounts and fees
• Ten charter promises
Community
• Maintaining rural branches
• Seniors and welfare banking
• ANZ Community Fund
Our People
• Performance ethic
• Breakout transformation
• Freedom with accountability
• Stretch incentives

Page 22
Copy of presentation available on
www.anz.com

Page 23
The material in this presentation is general background information about the Bank’s activities current at the date of the presentation. It is information given in summary form and does not purport to be complete. It is not intended to be relied upon as
advice to investors or potential investors and does not take into account the investment objectives, financial situation or needs of any particular investor. These
should be considered, with or without professional advice when deciding if an investment is appropriate.
For further information visit
www.anz.comor contact
Philip GentryHead of Investor Relations
ph: (613) 9273 4185 fax: (613) 9273 4091 e-mail: [email protected]

Page 24
PE Ratio
0
5
10
15
20
25
30
35
1993 1994 1995 1996 1997 1998 1999 2000 2001 Mar-02
Asian crisis and emerging market losses – damaged confidence in ANZ

Page 25
PE Ratio
0
2
4
6
8
10
12
14
16
18
May
-94
May
-95
May
-96
May
-97
May
-98
May
-99
May
-00
May
-01
May
-02
ANZ
Average
PE Ratio
0
5
10
15
20
25
May
-94
May
-95
May
-96
May
-97
May
-98
May
-99
May
-00
May
-01
May
-02
Share PricePE Ratio $ AUD

Page 26
Comparative PE ratios
10
11
12
13
14
15
16
17
AN
Z
Aust
ralia UK
Can
ada
US
Reg
ional
s
0.0
0.5
1.0
1.5
2.0
2.5
3.0
3.5
4.0
4.5
10
11
12
13
14
15
16
17
AN
Z
Aust
ralia UK
Can
ada
US
Reg
ional
s
Current year PE’s Prospective PE’s
Dividend yield
Source – JB Were 3 June 2002