Presentation Studio - Morningstar Log Inmorningstardirect.morningstar.com › clientcomm ›...
81
Presentation Studio Workbook Samples for Multiple Investments
Transcript of Presentation Studio - Morningstar Log Inmorningstardirect.morningstar.com › clientcomm ›...

Presentation Studio Workbook Samples for Multiple Investments
Sample Presentation Studio Workbook
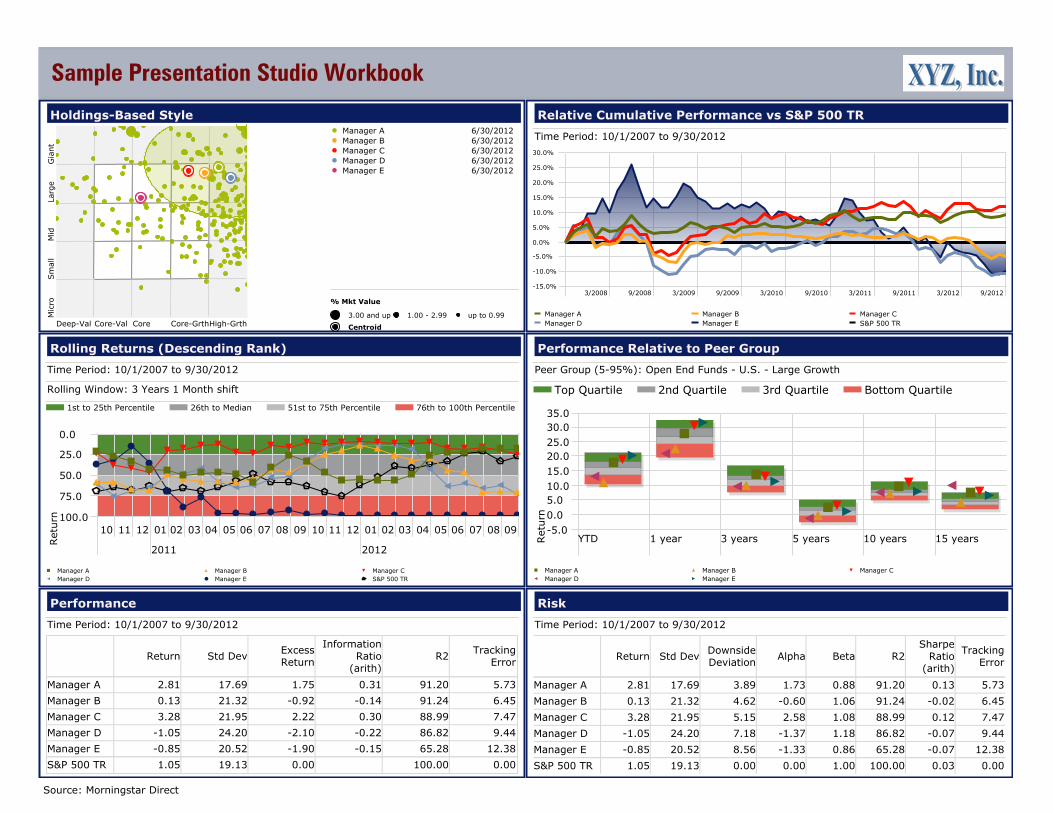
Performance
Time Period: 10/1/2007 to 9/30/2012
Return Std DevExcessReturn
InformationRatio
(arith)R2
TrackingError
Manager A
Manager B
Manager C
Manager D
Manager E
S&P 500 TR
2.81
0.13
3.28
-1.05
-0.85
1.05
17.69
21.32
21.95
24.20
20.52
19.13
1.75
-0.92
2.22
-2.10
-1.90
0.00
0.31
-0.14
0.30
-0.22
-0.15
91.20
91.24
88.99
86.82
65.28
100.00
5.73
6.45
7.47
9.44
12.38
0.00
Rolling Returns (Descending Rank)
Time Period: 10/1/2007 to 9/30/2012
Rolling Window: 3 Years 1 Month shift
1st to 25th Percentile 26th to Median 51st to 75th Percentile 76th to 100th Percentile
Ret
urn
10 11 12
2011
01 02 03 04 05 06 07 08 09 10 11 12
2012
01 02 03 04 05 06 07 08 09100.0
75.0
50.0
25.0
0.0
Manager A Manager B Manager CManager D Manager E S&P 500 TR
Risk
Time Period: 10/1/2007 to 9/30/2012
Return Std DevDownsideDeviation
Alpha Beta R2Sharpe
Ratio(arith)
TrackingError
Manager A
Manager B
Manager C
Manager D
Manager E
S&P 500 TR
2.81
0.13
3.28
-1.05
-0.85
1.05
17.69
21.32
21.95
24.20
20.52
19.13
3.89
4.62
5.15
7.18
8.56
0.00
1.73
-0.60
2.58
-1.37
-1.33
0.00
0.88
1.06
1.08
1.18
0.86
1.00
91.20
91.24
88.99
86.82
65.28
100.00
0.13
-0.02
0.12
-0.07
-0.07
0.03
5.73
6.45
7.47
9.44
12.38
0.00
Performance Relative to Peer Group
Peer Group (5-95%): Open End Funds - U.S. - Large Growth
Top Quartile 2nd Quartile 3rd Quartile Bottom Quartile
Ret
urn
-5.00.05.010.015.0
YTD 1 year 3 years 5 years 10 years 15 years
20.025.030.035.0
Manager A Manager B Manager CManager D Manager E
Holdings-Based Style
Mic
roSm
all
Mid
Larg
eG
iant
Deep-Val Core-Val Core Core-GrthHigh-Grth
Manager A 6/30/2012Manager B 6/30/2012Manager C 6/30/2012Manager D 6/30/2012Manager E 6/30/2012
% Mkt Value
3.00 and up 1.00 - 2.99 up to 0.99
Centroid
Relative Cumulative Performance vs S&P 500 TR
Time Period: 10/1/2007 to 9/30/2012
3/2008 9/2008 3/2009 9/2009 3/2010 9/2010 3/2011 9/2011 3/2012 9/2012-15.0%
-10.0%
-5.0%
0.0%
5.0%
10.0%
15.0%
20.0%
25.0%
30.0%
Manager A Manager B Manager CManager D Manager E S&P 500 TR
Source: Morningstar Direct
Sample Presentation Studio Workbook
Investment Strategy
xxxxxxxxxxxxxxxxxxxxxxxxxxxxxxxxxxxxxxxxxxxxxxxxxxxxxxxxxxxxxxxxxxxxxxxxxxxxxxxxxxxxxxxxxxxxxxxxxxxxxxxxxxxxxxxxxxxxxxxxxxxxxxxxxxxxxxxxxxxxxxxxxxxxxxxxxxxxxxxxxxxxxxxxxxxxxxxxxxxxxxxxxxxxxxxxxxxxxxxxxxxxxxxxxxxxxxxxxxxxxxxxxxxxxxxxxxxxxxxxxxxxxxxxxxxxxxxxxxxxxxxxxxxxxxxxxxxxxxxxxxxxxxxxxxxxxxxxxxxxxxxxxxxxxxxxxxxxxxxxxxxxxxxxxxxxxxxxxxxxxxxxxxxxxxxxxxxxxxxxxxxxxxxxxxxxxxxxxxxxxxxxxxxxxxxxxxxxxxxxxxxxxxxxxxxxxxxxxxxxxxxxxxxxxxxxxxxxxxxxxxxxxxxx
Custom Text
xxxxxxxxxxxxxxxxxxxxxxxxxxxxxxxxxxxxxxxxxxxxxxxxxxxxxxxxxxxxxxxxxxxxxxxxxxxxxxxxxxxxxxxxxxxxxxxxxxxxxxxxxxxxxxxxxxxxxxxxxxxxxxxxxxxxxxxxxxxxxxxxxxxxxxxxxxxxxxxxxxxxxxxxxxxxxxxxxxxxxxxxxxxxxxxxxxxxxxxxxxxxxxxxxxxxxxxxxxxxxxxxxxxxxxxxxxxxxxxxxxxxxxxxxxxxxxxxxxxxxxxxxxxxxxxxxxxxxxxxxxxxxxxxxxxxxxxxxxxxxxxxxxxxxxxxxxxxxxxxxxxxxxxxxxxxxxxxxxxxxxxxxxxxxxxxxxxxxxxxxxxxxxxxxxxxxxxxxxxxxxxxxxxxxxxxxxxxxxxxxxxxxxxxxxxxxxxxxxxxxxxxxxxxx
Manager Biography
XXXX XXXXXXX since 9/17/1990
xxxxxxxxxxxxxxxxxxxxxxxxxxxxxxxxxxxxxxxxxxxxxxxxxxxxxxxxxxxxxxxxxxxxxxxxxxxxxxxxxxxxxxxxxxxxxxxxxxxxxxxxxxxxxxxxxxxxxxxxxxxxxxxxxxxxxxxxxxxxxxxxxxxxxxxxxxxxxxxxxxxxxxxxxxxxxxxxxxxxxxxxxxxxxxxxxxxxxxxxxxxxxxxxxxxxxxxxxxxxxxxxxxxxxxxxxxxxxxxxxxxxxxxxxxxxxxxxxxxxxxxxxxxxxxxxxxxxxxxxxxxxxxxxxxxxxxxxxxxxxxxxxxxxxxxxxxxxxxxxxxxxxxxxxxxxxxxxxxxxxxxxxxxxxxxxxxxxxxxxxxxxxxxxxxxxxxxxxxxxxxxxxxxxxxxxxxxxxxxxxxxxxxxxxxxxxxx
Morningstar Analyst Report
Analysis by XXXXXXX 5/16/2012
XXX able skipper is back to uncharted waters.
xxxxxxxxxxxxxxxxxxxxxxxxxxxxxxxxxxxxxxxxxxxxxxxxxxxxxxxxxxxxxxxxxxxxxxxxxxxxxxxxxxxxxxxxxxxxxxxxxxxxxxxxxxxxxxxxxxxxxxxxxxxxxxxxxxxxxxxxxxxxxxxxxxxxxxxxxxxxxxxxxxxxxxxxxxxxxxxxxxxxxxxxxxxxxxxxxxxxxxxxxxxxxxxxxxxxxxxxxxxxxxxxxxxxxxxxxxxxxxxxxxxxxxxxxxxxxxxxxxxxxxxxxxxxxxxxxxxxxxxxxxxxxxxxxxxxxxxxxxxxxxxxxxxxxxxxxxxxxxxxxxxxxxxxxxxxxxxxxxxxxxxxxxxxxxxxxxxxxxxxxxxxxxxxxxxxxxx
xxxxxxxxxxxxxxxxxxxxxxxxxxxxxxxxxxxxxxxxxxxxxxxxxxxxxxxxxxxxxxxxxxxxxxxxxxxxxxxxxxxxxxxxxxxxxxxxxxxxxxxxxxxxxxxxxxxxxxxxxxxxxxxxxxxxxxxxxxxxxxxxxxxxxxxxxxxxxxxxxxxxxxxxxxxxxxxxxxxxxxxxxxxxxxxxxxxxxxxxxxxxxxxxxxxxxxxxxxxxxxxxxxxxxxxxxxxxxxxxxxxxxxxxxxxxxxxxxxxxxxxxxxxxxxxxxxxxxxxxxxxxxxxxxxxxxxxxxxxxxxxxxxxxxxxxxxxxxxxxxx
xxxxxxxxxxxxxxxxxxxxxxxxxxxxxxxxxxxxxxxxxxxxxxxxxxxxxxxxxxxxxxxxxxxxxxxxxxxxxxxxxxxxxxxxxxxxxxxxxxxxxxxxxxxxxxxxxxxxxxxxxxxxxxxxxxxxxxxxxxxxxxxxxxxxxxxxxxxxxxxxxxxxxxxxxxxxxxxxxxxxxxxxxxxxxxxxxxxxxxxxxxxxxxxxxxxxxxxxx
xxxxxxxxxxxxxxxxxxxxxxxxxxxxxxxxxxxxxxxxxxxxxxxxxxxxxxxxxxxxxxxxxxxxxxxxxxxxxxxxxxxxxxxxxxxxxxxxxxxxxxxxxxxxxxxxxxxxxxxxxxxxxxxxxxxxxxxxxxxxxxxxxxxxxxxxxxxxxxxxxxxxxxxxxxxxxxxxxxxxxxxxxxxxxxxxxxxxxxxxxxxxxxxxxxxxxxxxxxxxxxxxxxxxxxxxxxxxxxxxxxxxxxxxxxxxxxxxxxxxxxxxxxxxxxxxxxxxxxxxxxxxxxxxxxxxxxxxxxxxxxxxxxxxxxxxxxxxxxxxxxxxxxxxxxxxxxxxxxxxxxxxxxxxxxxxxxxxxxxxxxxxxxxxxxxxxxxxxxxxxxxxxxxxxxxxxxxxxxxxxxxxxxxxxxxxxxxxxxxxxxxxxxxxxxxxxxxxxxxxxx
xxxxxxxxxxxxxxxxxxxxxxxxxxxxxxxxxxxxxxxxxxxxxxxxxxxxxxxxxxxxxxxxxxxxxxxxxxxxxxxxxxxxxxxxxxxxxxxxxxxxxxxxxxxxxxxxxxxxxxxxxxxxxxxxxxxxxxxxxxxxxxxxxxxxxxxxxxxxxxxxxxxxxxxxxxxxxxxxxxxxxxxxxxxxxxxxxxxxxxxxxxxxxxxxxxxxxxxx
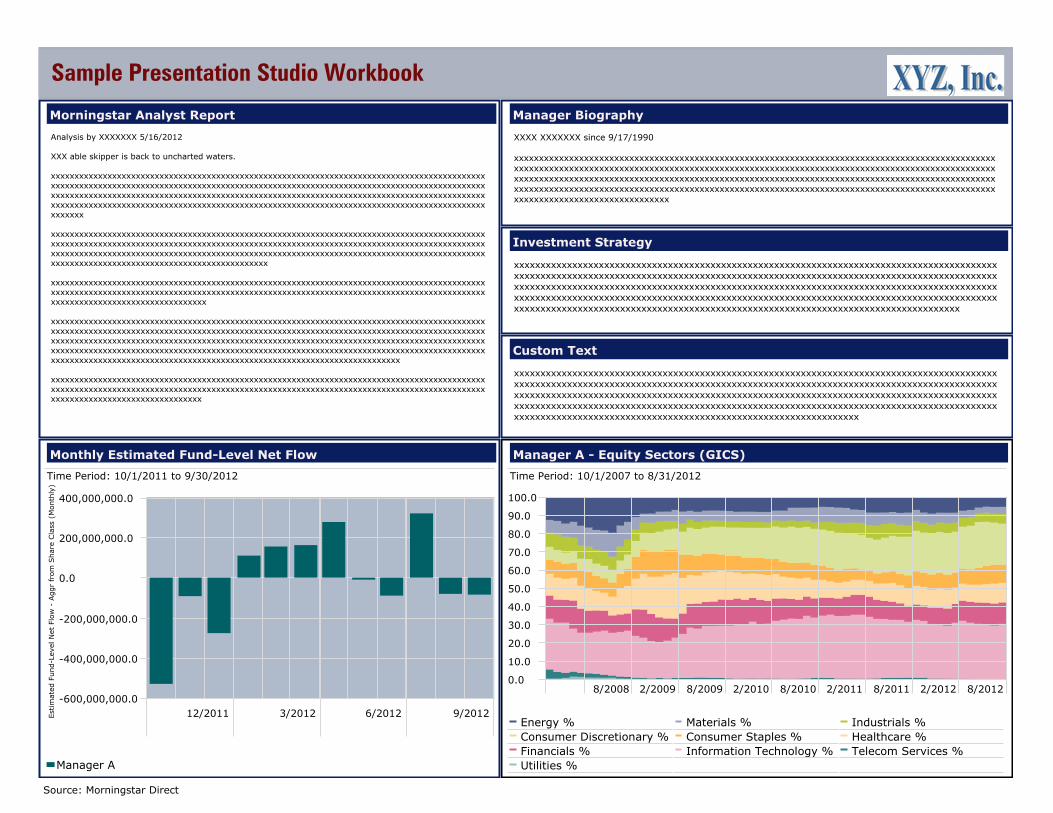
Manager A - Equity Sectors (GICS)
Time Period: 10/1/2007 to 8/31/2012
0.0
10.0
20.0
30.0
40.0
50.0
60.0
70.0
80.0
90.0
100.0
8/2008 2/2009 8/2009 2/2010 8/2010 2/2011 8/2011 2/2012 8/2012
Energy % Materials % Industrials %Consumer Discretionary % Consumer Staples % Healthcare %Financials % Information Technology % Telecom Services %Utilities %
Monthly Estimated Fund-Level Net Flow
Time Period: 10/1/2011 to 9/30/2012
Est
imat
ed F
und-L
evel
Net
Flo
w -
Aggr
from
Shar
e Cla
ss (
Month
ly)
12/2011 3/2012 6/2012 9/2012-600,000,000.0
-400,000,000.0
-200,000,000.0
0.0
200,000,000.0
400,000,000.0
Manager A
Source: Morningstar Direct

Sample Presentation Studio Workbook
Allocation Effects
Time Period: 7/1/2012 to 9/30/2012
Portfolio: Manager A Benchmark: S&P 500 TR
Underperform Outperform Overw
eig
ht
Un
derw
eig
ht
Rel
ativ
e W
eight
Relative Return
14.00
7.00
0.00
-7.00
-14.00-7.50 -6.00 -4.50 -3.00 -1.50 0.00 1.50 3.00 4.50 6.00 7.50
3 2
1
5
4
3
2
1
Best Weighting Weight +/-Return +/- Effect1 Utilities -3.56 -7.00 0.262 Industrials -5.70 -3.45 0.203 Consumer Cyclical 12.52 1.31 0.154 Real Estate -1.67 -5.43 0.095 Technology 8.55 0.89 0.08
Worst Weighting Weight +/-Return +/- Effect1 Energy -5.80 4.07 -0.232 Communication Services -2.82 2.65 -0.073 Healthcare -2.63 0.00 0.00
Attribution Summary - Scatter Plot
Time Period: 3/1/2012 to 9/30/2012
Benchmark: S&P 500 TR
Sel
ection E
ffec
t
Allocation Effect
-1.60 -1.20 -0.80 -0.40 0.00 0.40
-14.00
-11.00
-8.00
-5.00
-2.00
1.00
4.00
Manager A Manager B Manager CManager D Manager E
Relative Weights
Time Period: 7/1/2012 to 9/30/2012
Portfolio: Manager A Benchmark: S&P 500 TR
Consumer Discretionary
Information Technology
Materials
Consumer Staples
Health Care
Financials
Telecommunication Services
Utilities
Industrials
Energy
-7.5 -5.0 -2.5 0.0 2.5 5.0 7.5 10.0 12.5
Attribution/Contribution
Time Period: 7/1/2012 to 9/30/2012
Portfolio: Manager A Benchmark: S&P 500 TR
PortfolioWeights
BenchmarkWeights
PortfolioRescaledWeights
BenchmarkRescaledWeights
PortfolioReturn
BenchmarkReturn
PortfolioContribution
BenchmarkContribution
AllocationEffect
SelectionEffect
ActiveReturn
Basic Materials
Communication Services
Consumer Cyclical
Consumer Defensive
Energy
Financial Services
Healthcare
Industrials
Real Estate
Technology
Utilities
Attribution Total
Cash
Bond
Other
Missing Performance
Total
3.10 2.73 3.35 2.74 17.74 6.92 0.60 0.19 0.01 0.36 0.37
1.66 4.60 1.79 4.61 8.32 8.99 0.15 0.41 -0.07 -0.01 -0.08
20.38 9.52 22.06 9.54 5.08 7.66 1.12 0.73 0.15 -0.57 -0.42
10.61 11.88 11.48 11.90 1.87 3.69 0.21 0.44 0.01 -0.22 -0.21
4.85 11.02 5.24 11.04 10.54 10.42 0.54 1.13 -0.23 0.01 -0.23
12.94 13.07 14.00 13.09 5.09 7.97 0.72 1.05 0.01 -0.40 -0.39
8.42 11.71 9.11 11.73 4.80 6.35 0.46 0.75 0.00 -0.13 -0.13
5.22 11.32 5.64 11.34 2.89 2.90 0.16 0.33 0.20 0.00 0.20
0.28 1.98 0.31 1.98 18.92 0.92 0.06 0.02 0.09 0.06 0.15
24.97 18.43 27.01 18.47 12.21 7.23 3.23 1.33 0.08 1.32 1.39
0.00 3.56 0.00 3.56 5.00 -0.66 0.00 -0.03 0.26 0.00 0.26
92.42 99.82 100.00 100.00 7.25 6.35 7.25 6.35 0.50 0.40 0.90
6.11 0.00
0.16 0.00
0.06 0.09
1.24 0.09
100.00 100.00 7.25 6.35
Source: Morningstar Direct

US Dollar Manager A S&P 500 TR
Manager Performance
Time Period: 6/1/2007 to 5/31/2012
11/2007 5/2008 11/2008 5/2009 11/2009 5/2010 11/2010 5/2011 11/2011 5/201240.0
50.0
60.0
70.0
80.0
90.0
100.0
110.0
120.0
130.0
140.0
Manager A Manager B Manager C
Manager D Manager E S&P 500 TR
US OE Large Growth
Calendar Year Returns
Re
turn
2011 2010 2009 2008 200760.0
50.0
40.0
30.0
20.0
10.0
0.0
10.0
20.0
30.0
40.0
50.0
60.0
Manager A Manager B Manager C
Manager D Manager E S&P 500 TR
US OE Large Growth
Manager vs Universe
Peer Group (595%): Open End Funds U.S. Large Growth
Re
turn
1 year 2 years 3 years 4 years 5 years12.5
10.0
7.5
5.0
2.5
0.0
2.5
5.0
7.5
10.0
12.5
15.0
17.520.0
Manager A Manager B Manager C
Manager D Manager E S&P 500 TR
US OE Large Growth
RiskReward
Time Period: 6/1/2007 to 5/31/2012
Re
turn
Std Dev
0.0 4.0 8.0 12.0 16.0 20.0 24.0 28.0
5.0
3.0
1.0
1.0
3.0
5.0
7.0
Manager A Manager B Manager C
Manager D Manager E S&P 500 TR
US OE Large Growth
Upside vs. Downside
Time Period: 6/1/2007 to 5/31/2012
Up
Ca
ptu
re R
a�
o
Down Capture Ra�o
0.0 20.0 40.0 60.0 80.0 100.0 120.0 140.0
0.0
30.0
60.0
90.0
120.0
150.0
Manager A Fidelity Contrafund Alger Large Cap Growth I2
Alger Capital Apprecia�on P�l I2 Calamos Growth A S&P 500 TR
US OE Large Growth
HoldingsBased Style
Mic
roS
ma
llM
idLa
rge
Gia
nt
DeepVal CoreVal Core CoreGrth HighGrth
Manager A 12/31/2011
Manager B 12/31/2011
Manager C 12/31/2011
Manager D 12/31/2011
Manager E 12/31/2011
S&P 500 TR 12/31/2011
US OE Large Growth 12/31/2011
% Mkt Value
3.00 and up 1.00 2.99 up to 0.99
Centroid
Source: Morningstar Direct
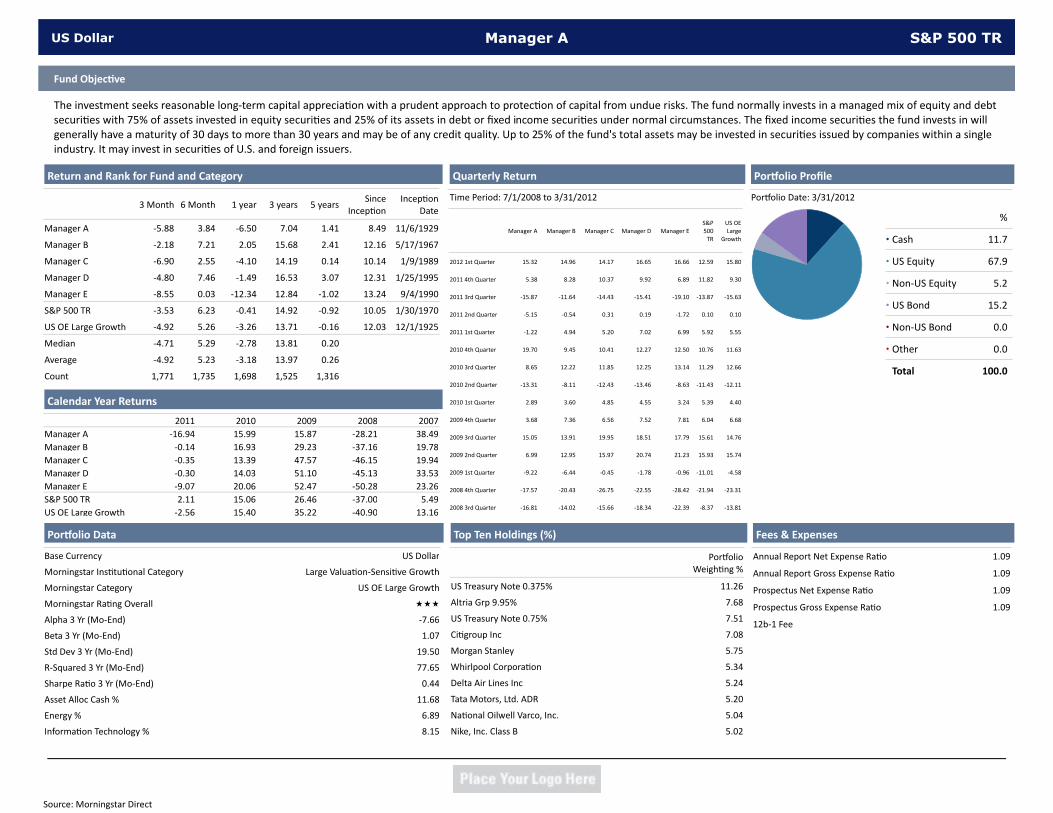
US Dollar Manager A S&P 500 TR
Fund Objec�ve
The investment seeks reasonable longterm capital apprecia�on with a prudent approach to protec�on of capital from undue risks. The fund normally invests in a managed mix of equity and debt
securi�es with 75% of assets invested in equity securi�es and 25% of its assets in debt or fixed income securi�es under normal circumstances. The fixed income securi�es the fund invests in will
generally have a maturity of 30 days to more than 30 years and may be of any credit quality. Up to 25% of the fund's total assets may be invested in securi�es issued by companies within a single
industry. It may invest in securi�es of U.S. and foreign issuers.
Por�olio Profile
Por�olio Date: 3/31/2012
%
Cash 11.7
US Equity 67.9
NonUS Equity 5.2
US Bond 15.2
NonUS Bond 0.0
Other 0.0
Total 100.0
Calendar Year Returns
2011 2010 2009 2008 2007
Manager A
Manager B
Manager C
Manager D
Manager E
S&P 500 TR
US OE Large Growth
16.94
0.14
0.35
0.30
9.07
2.11
15.99
16.93
13.39
14.03
20.06
15.06
15.87
29.23
47.57
51.10
52.47
26.46
28.21
37.16
46.15
45.13
50.28
37.00
38.49
19.78
19.94
33.53
23.26
5.49
2.56 15.40 35.22 40.90 13.16
Return and Rank for Fund and Category
3 Month 6 Month 1 year 3 years 5 yearsSince
Incep�on
Incep�on
Date
Manager A
Manager B
Manager C
Manager D
Manager E
S&P 500 TR
US OE Large Growth
Median
Average
Count
11/6/1929
5/17/1967
1/9/1989
1/25/1995
9/4/1990
1/30/1970
12/1/1925
4.71
4.92
1,771
5.29
5.23
1,735
2.78
3.18
1,698
13.81
13.97
1,525
0.20
0.26
1,316
5.88
2.18
6.90
4.80
8.55
3.53
3.84
7.21
2.55
7.46
0.03
6.23
6.50
2.05
4.10
1.49
12.34
0.41
7.04
15.68
14.19
16.53
12.84
14.92
1.41
2.41
0.14
3.07
1.02
0.92
8.49
12.16
10.14
12.31
13.24
10.05
4.92 5.26 3.26 13.71 0.16 12.03
Quarterly Return
Time Period: 7/1/2008 to 3/31/2012
Manager A Manager B Manager C Manager D Manager E
S&P
500
TR
US OE
Large
Growth
2012 1st Quarter
2011 4th Quarter
2011 3rd Quarter
2011 2nd Quarter
2011 1st Quarter
2010 4th Quarter
2010 3rd Quarter
2010 2nd Quarter
2010 1st Quarter
2009 4th Quarter
2009 3rd Quarter
2009 2nd Quarter
2009 1st Quarter
2008 4th Quarter
2008 3rd Quarter 16.81
17.57
9.22
6.99
15.05
3.68
2.89
13.31
8.65
19.70
1.22
5.15
15.87
5.38
15.32
14.02
20.43
6.44
12.95
13.91
7.36
3.60
8.11
12.22
9.45
4.94
0.54
11.64
8.28
14.96
15.66
26.75
0.45
15.97
19.95
6.56
4.85
12.43
11.85
10.41
5.20
0.31
14.43
10.37
14.17
18.34
22.55
1.78
20.74
18.51
7.52
4.55
13.46
12.25
12.27
7.02
0.19
15.41
9.92
16.65
22.39
28.42
0.96
21.23
17.79
7.81
3.24
8.63
13.14
12.50
6.99
1.72
19.10
6.89
16.66
8.37
21.94
11.01
15.93
15.61
6.04
5.39
11.43
11.29
10.76
5.92
0.10
13.87
11.82
12.59
13.81
23.31
4.58
15.74
14.76
6.68
4.40
12.11
12.66
11.63
5.55
0.10
15.63
9.30
15.80
Top Ten Holdings (%)
Por�olio
Weigh�ng %
US Treasury Note 0.375%
Altria Grp 9.95%
US Treasury Note 0.75%
Ci�group Inc
Morgan Stanley
Whirlpool Corpora�on
Delta Air Lines Inc
Tata Motors, Ltd. ADR
Na�onal Oilwell Varco, Inc.
Nike, Inc. Class B
11.26
7.68
7.51
7.08
5.75
5.34
5.24
5.20
5.04
5.02
Fees & Expenses
Annual Report Net Expense Ra�o
Annual Report Gross Expense Ra�o
Prospectus Net Expense Ra�o
Prospectus Gross Expense Ra�o
12b1 Fee
1.09
1.09
1.09
1.09
Por�olio Data
Base Currency
Morningstar Ins�tu�onal Category
Morningstar Category
Morningstar Ra�ng Overall
Alpha 3 Yr (MoEnd)
Beta 3 Yr (MoEnd)
Std Dev 3 Yr (MoEnd)
RSquared 3 Yr (MoEnd)
Sharpe Ra�o 3 Yr (MoEnd)
Asset Alloc Cash %
Energy %
Informa�on Technology %
US Dollar
Large Valua�onSensi�ve Growth
US OE Large Growth
ÙÙÙ
7.66
1.07
19.50
77.65
0.44
11.68
6.89
8.15
Source: Morningstar Direct

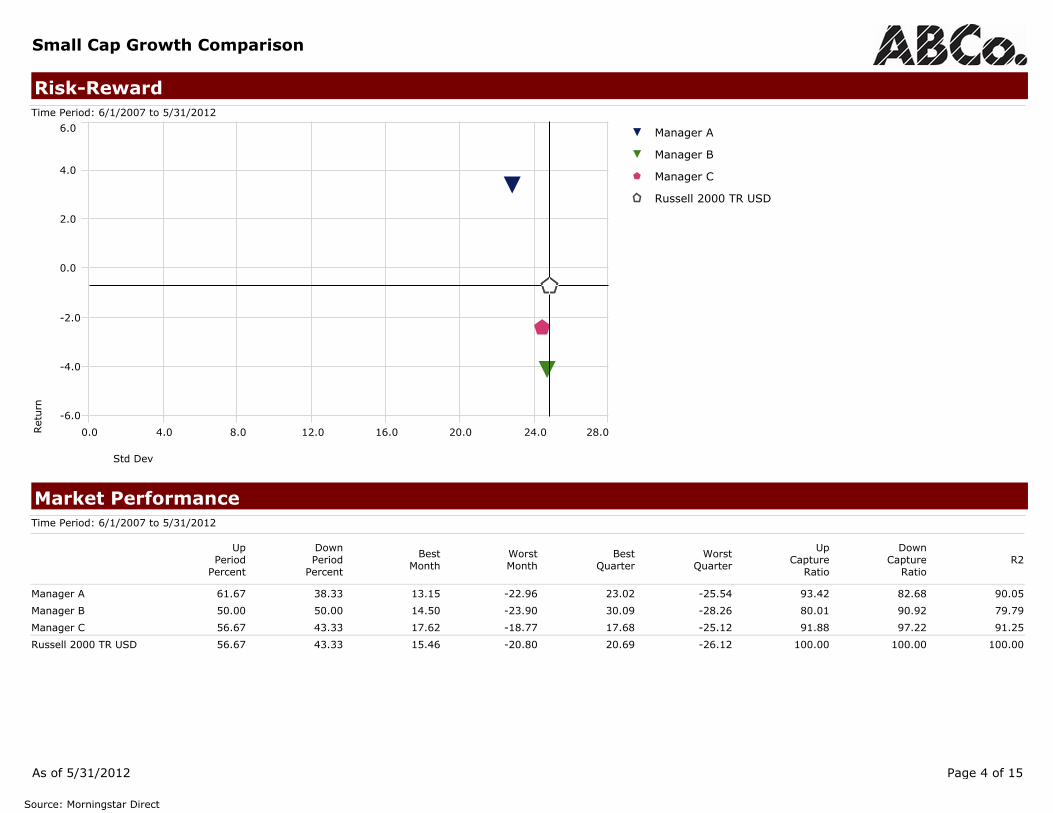
Small Cap Growth Comparison
Investment GrowthTime Period: 6/1/2007 to 5/31/2012
11/2007 5/2008 11/2008 5/2009 11/2009 5/2010 11/2010 5/2011 11/2011 5/201237.0
46.0
55.0
64.0
73.0
82.0
91.0
100.0
109.0
118.0
127.0
136.0
Manager A Manager B Manager C
Russell 2000 TR USD
PerformanceTime Period: 6/1/2007 to 5/31/2012
Return Std DevExcessReturn
InformationRatio
(arith)R2
TrackingError
Manager A
Manager B
Manager C
Russell 2000 TR USD
3.39
-4.11
-2.42
-0.73
22.84
24.72
24.46
24.82
4.12
-3.38
-1.70
0.00
0.52
-0.29
-0.23
90.05
79.79
91.25
100.00
7.88
11.48
7.40
0.00
As of 5/31/2012 Page 1 of 15
Source: Morningstar Direct

Small Cap Growth Comparison
Risk-RewardTime Period: 6/1/2007 to 5/31/2012
Ret
urn
Std Dev
0.0 4.0 8.0 12.0 16.0 20.0 24.0 28.0
-6.0
-4.0
-2.0
0.0
2.0
4.0
6.0 Manager A
Manager B
Manager C
Russell 2000 TR USD
RiskTime Period: 6/1/2007 to 5/31/2012
Return Std DevDownsideDeviation
Alpha Beta R2Sharpe
Ratio(arith)
TrackingError
Manager A
Manager B
Manager C
Russell 2000 TR USD
3.39
-4.11
-2.42
-0.73
22.84
24.72
24.46
24.82
5.07
8.41
5.95
0.00
3.82
-3.27
-1.73
0.00
0.87
0.89
0.94
1.00
90.05
79.79
91.25
100.00
0.11
-0.20
-0.14
-0.06
7.88
11.48
7.40
0.00
As of 5/31/2012 Page 2 of 15
Source: Morningstar Direct

Small Cap Growth Comparison
Rolling ReturnsTime Period: 6/1/2007 to 5/31/2012
Rolling Window: 3 Years 1 Month shift
Ret
urn
06 07 08 09 10 11 12
2011
01 02 03 04 05 06 07 08 09 10 11 12
2012
01 02 03 04 05-20.0
-10.0
0.0
10.0
20.0
30.0
40.0
Manager A Manager B Manager CRussell 2000 TR USD
Rolling ReturnsTime Period: 6/1/2007 to 5/31/2012
Rolling Window: 3 Years 1 Month shift
Ret
urn
06 07 08 09 10 11 12
2011
01 02 03 04 05 06 07 08 09 10 11 12
2012
01 02 03 04 05-20.0
-10.0
0.0
10.0
20.0
30.0
40.0
Manager A Manager B Manager CRussell 2000 TR USD
Rolling ReturnsTime Period: 6/1/2007 to 5/31/2012
Rolling Window: 3 Years 1 Month shift
Ret
urn
06 07 08 09 10 11 12
2011
01 02 03 04 05 06 07 08 09 10 11 12
2012
01 02 03 04 05-20.0
-10.0
0.0
10.0
20.0
30.0
40.0
Manager A Manager B Manager CRussell 2000 TR USD
As of 5/31/2012 Page 3 of 15
Source: Morningstar Direct
Small Cap Growth Comparison
Risk-RewardTime Period: 6/1/2007 to 5/31/2012
Ret
urn
Std Dev
0.0 4.0 8.0 12.0 16.0 20.0 24.0 28.0
-6.0
-4.0
-2.0
0.0
2.0
4.0
6.0 Manager A
Manager B
Manager C
Russell 2000 TR USD
Market PerformanceTime Period: 6/1/2007 to 5/31/2012
UpPeriod
Percent
DownPeriod
Percent
BestMonth
WorstMonth
BestQuarter
WorstQuarter
UpCapture
Ratio
DownCapture
RatioR2
Manager A
Manager B
Manager C
Russell 2000 TR USD
61.67
50.00
56.67
56.67
38.33
50.00
43.33
43.33
13.15
14.50
17.62
15.46
-22.96
-23.90
-18.77
-20.80
23.02
30.09
17.68
20.69
-25.54
-28.26
-25.12
-26.12
93.42
80.01
91.88
100.00
82.68
90.92
97.22
100.00
90.05
79.79
91.25
100.00
As of 5/31/2012 Page 4 of 15
Source: Morningstar Direct

Small Cap Growth Comparison
Returns
Ret
urn
YTD 1 year 3 years 5 years 10 years 15 years-17.5
-15.0
-12.5
-10.0
-7.5
-5.0
-2.5
0.0
2.5
5.0
7.5
10.0
12.5
15.0
17.5
20.0
22.525.0
Manager A Manager B Manager C
Russell 2000 TR USD
Trailing ReturnsData Point: Return
YTD 1 year 3 years 5 years 10 years 15 years
Manager A
Manager B
Manager C
Russell 2000 TR USD
9.18
-0.12
6.35
3.37
-4.80
-15.89
-7.05
-8.88
21.03
12.13
18.22
16.47
3.39
-4.11
-2.42
-0.73
6.76
5.94 6.09
As of 5/31/2012 Page 5 of 15
Source: Morningstar Direct

Small Cap Growth Comparison
Returns
Ret
urn
YTD 2011 2010 2009 2008 2007-52.5
-45.0
-37.5
-30.0
-22.5
-15.0
-7.5
0.0
7.5
15.0
22.5
30.0
37.5
45.0
52.5
Manager A Manager B Manager C
Russell 2000 TR USD
Calendar Year ReturnsData Point: Return
YTD 2011 2010 2009 2008 2007
Manager A
Manager B
Manager C
Russell 2000 TR USD
9.18
-0.12
6.35
3.37
1.50
-10.48
1.38
-4.18
26.37
26.51
29.06
26.85
36.25
47.08
9.77
27.17
-40.20
-49.66
-41.28
-33.79
14.23
8.40
15.83
-1.57
As of 5/31/2012 Page 6 of 15
Source: Morningstar Direct

Small Cap Growth Comparison
Holdings-Based Style
Mic
roSm
all
Mid
Larg
eG
iant
Deep-Val Core-Val Core Core-GrthHigh-Grth
Manager A 12/31/2011
Manager B 4/30/2012
Manager C 3/31/2012
Russell 2000 TR USD 4/30/2012
Returns-Based StyleTime Period: 6/1/2007 to 5/31/2012
Morningstar Large Value TR USD
Morningstar Large Growth TR USD
Morningstar Small Value TR USD
Morningstar Small Growth TR USD
Manager A
Manager B
Manager C
Russell 2000 TR USD
Rolling Returns-Based StyleTime Period: 6/1/2007 to 5/31/2012
Morningstar Large Value TR USD
Morningstar Large Growth TR USD
Morningstar Small Value TR USD
Morningstar Small Growth TR USD
Manager A
Manager B
Manager C
Russell 2000 TR USD
Holdings-Based Style TrailTime Period: 6/30/2007 to 4/30/2012
Mic
roSm
all
Mid
Larg
eG
iant
Deep-Val Core-Val Core Core-GrthHigh-Grth
Start Date End Date
Manager A 6/30/2007 12/31/2011
Manager B 6/30/2007 4/30/2012
Manager C 6/30/2007 3/31/2012
Russell 2000 TR USD 6/30/2007 4/30/2012
As of 5/31/2012 Page 7 of 15
Source: Morningstar Direct
Small Cap Growth Comparison
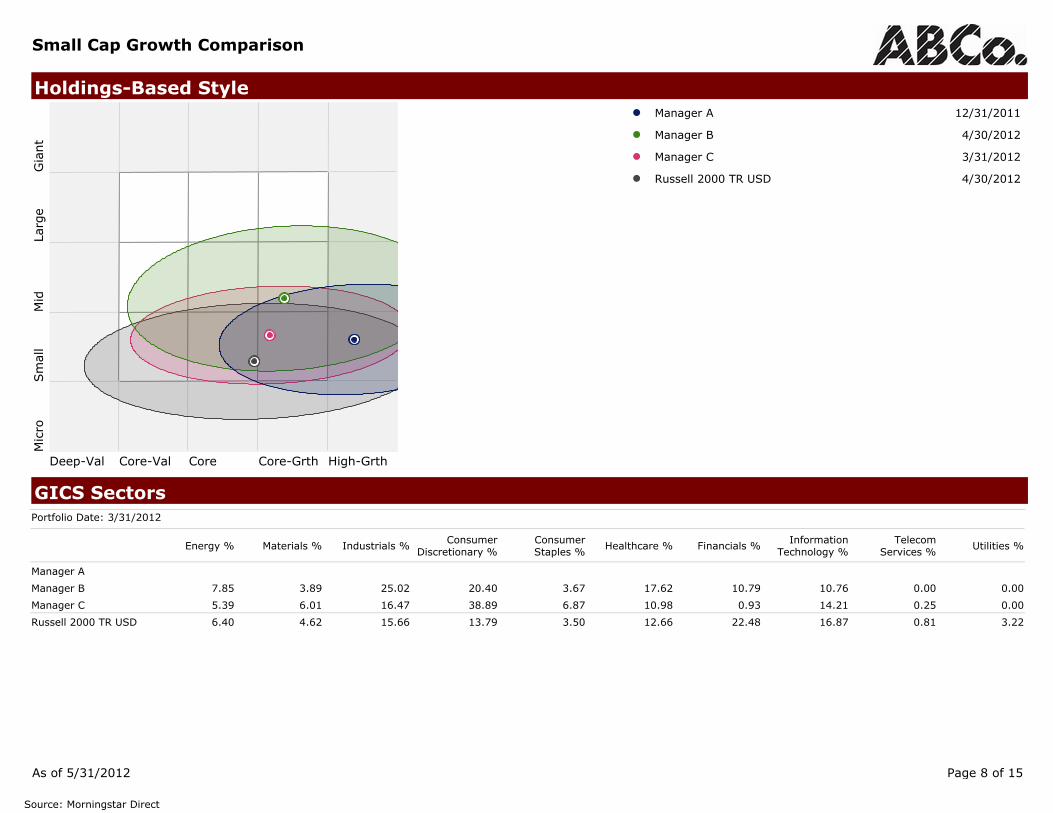
Holdings-Based Style
Mic
roSm
all
Mid
Larg
eG
iant
Deep-Val Core-Val Core Core-Grth High-Grth
Manager A 12/31/2011
Manager B 4/30/2012
Manager C 3/31/2012
Russell 2000 TR USD 4/30/2012
GICS SectorsPortfolio Date: 3/31/2012
Energy % Materials % Industrials %Consumer
Discretionary %ConsumerStaples %
Healthcare % Financials %Information
Technology %Telecom
Services %Utilities %
Manager A
Manager B
Manager C
Russell 2000 TR USD
7.85 3.89 25.02 20.40 3.67 17.62 10.79 10.76 0.00 0.00
5.39 6.01 16.47 38.89 6.87 10.98 0.93 14.21 0.25 0.00
6.40 4.62 15.66 13.79 3.50 12.66 22.48 16.87 0.81 3.22
As of 5/31/2012 Page 8 of 15
Source: Morningstar Direct
Small Cap Growth Comparison
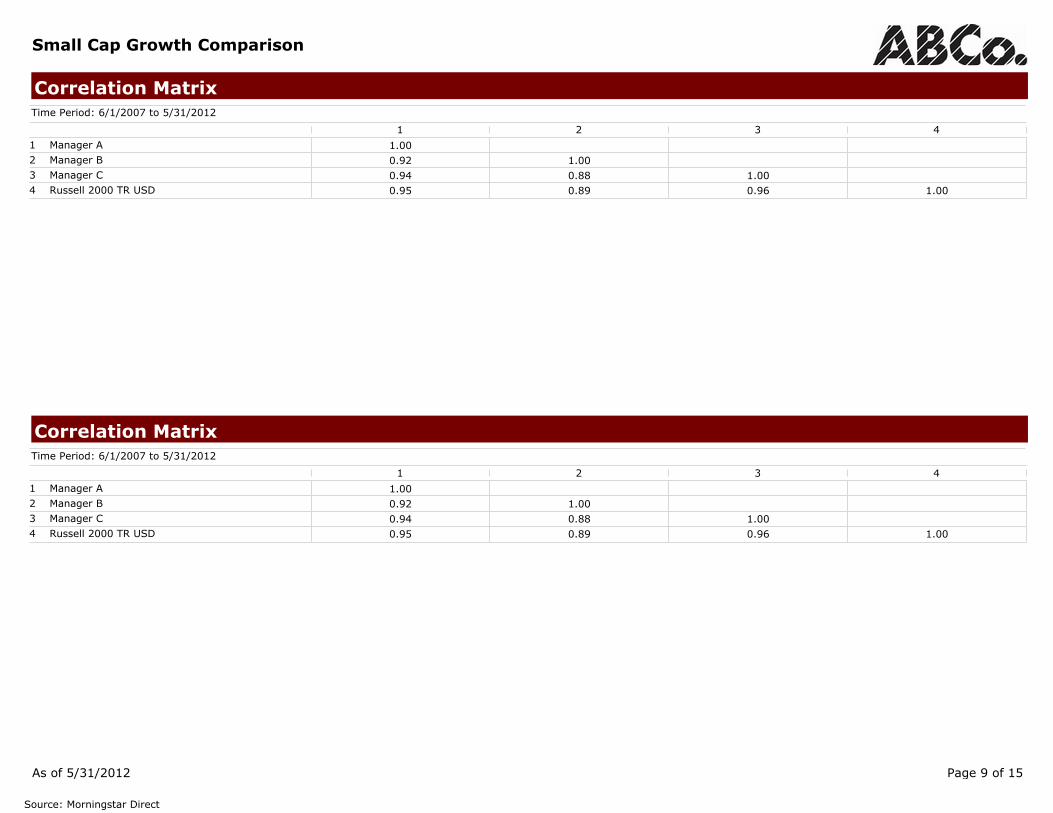
Correlation MatrixTime Period: 6/1/2007 to 5/31/2012
1 2 3 4
1.00
0.92 1.00
0.94 0.88 1.00
0.95 0.89 0.96 1.00
1 Manager A
2 Manager B
3 Manager C
4 Russell 2000 TR USD
Correlation MatrixTime Period: 6/1/2007 to 5/31/2012
1 2 3 4
1.00
0.92 1.00
0.94 0.88 1.00
0.95 0.89 0.96 1.00
1 Manager A
2 Manager B
3 Manager C
4 Russell 2000 TR USD
As of 5/31/2012 Page 9 of 15
Source: Morningstar Direct

Small Cap Growth Comparison
Std Dev
Std
Dev
1 year 3 years 5 years 10 years0.0
5.0
10.0
15.0
20.0
25.0
30.0
35.040.0
22.019.1
22.822.419.7
24.7
20.4
29.3
24.0 24.524.621.8
24.821.1
Manager A Manager B Manager CRussell 2000 TR USD
Alpha
Alp
ha
1 year 3 years 5 years 10 years-12.5
-10.0
-7.5
-5.0
-2.5
0.0
2.5
5.0
7.510.0
3.0
6.3
3.8
-9.3
-1.1-3.3
1.5
4.3
0.8
-1.7
Manager A Manager B Manager CRussell 2000 TR USD
Beta
Bet
a
1 year 3 years 5 years 10 years0.0
0.2
0.4
0.6
0.8
1.0
1.2
1.41.6
0.9 0.8 0.90.9 0.80.9 0.9
1.21.1
0.91.0 1.0 1.0 1.0
Manager A Manager B Manager CRussell 2000 TR USD
As of 5/31/2012 Page 10 of 15
Source: Morningstar Direct

Small Cap Growth Comparison
Risk-RewardTime Period: 6/1/2007 to 5/31/2012
Ret
urn
Std Dev
0.0 4.0 8.0 12.0 16.0 20.0 24.0 28.0
-6.0
-4.0
-2.0
0.0
2.0
4.0
6.0 Manager A
Manager B
Manager C
Russell 2000 TR USD
DrawdownTime Period: 6/1/2007 to 5/31/2012
MaxDrawdown
MaxDrawdown #
ofPeriods
MaxDrawdown
PeakDate
MaxDrawdown
ValleyDate
Omega
Manager A
Manager B
Manager C
Russell 2000 TR USD
-52.32
-59.87
-55.54
-52.89
16.00
16.00
16.00
21.00
11/1/2007
11/1/2007
11/1/2007
6/1/2007
2/28/2009
2/28/2009
2/28/2009
2/28/2009
1.08
0.85
0.90
0.95
As of 5/31/2012 Page 11 of 15
Source: Morningstar Direct

Small Cap Growth Comparison
Allocation EffectTime Period: 3/1/2012 to 5/31/2012
Benchmark: Russell 2000 TR USD
Manager A
Manager B
Manager C
-2.0 -1.5 -1.0 -0.5 0.0
Allocation EffectTime Period: 3/1/2012 to 5/31/2012
Benchmark: Russell 2000 TR USD
Manager A
Manager B
Manager C
-2.0 -1.5 -1.0 -0.5 0.0
Allocation EffectTime Period: 3/1/2012 to 5/31/2012
Benchmark: Russell 2000 TR USD
Manager A
Manager B
Manager C
-2.0 -1.5 -1.0 -0.5 0.0
Attribution Summary - Scatter PlotTime Period: 3/1/2012 to 5/31/2012
Benchmark: Russell 2000 TR USD
Sel
ection E
ffec
t
Allocation Effect
-2.20 -1.80 -1.40 -1.00 -0.60 -0.20
-7.00
-5.00
-3.00
-1.00
1.00
3.00
5.00
7.00
Manager A Manager B Manager C
Attribution SummaryTime Period: 3/1/2012 to 5/31/2012
Benchmark: Russell 2000 TR USD
AllocationEffect
SelectionEffect
ActiveReturn
Manager A
Manager B
Manager C
-1.78 4.23 2.44
-0.50 -4.59 -5.10
-0.65 -0.58 -1.23
As of 5/31/2012 Page 12 of 15
Source: Morningstar Direct

Small Cap Growth Comparison
Attribution DetailTime Period: 3/1/2012 to 5/31/2012
Benchmark: Russell 2000 TR USD
Allo
cation E
ffec
t
Morningstar Sector
BasicMaterials
CommunicationServices
ConsumerCyclical
ConsumerDefensive
Energy FinancialServices
Healthcare Industrials RealEstate
Technology Utilities-0.90
-0.80
-0.70
-0.60
-0.50
-0.40
-0.30
-0.20
-0.10
0.00
0.10
0.20
0.300.40
Manager A Manager B Manager C
As of 5/31/2012 Page 13 of 15
Source: Morningstar Direct

Small Cap Growth Comparison
Performance Relative to Peer GroupPeer Group (5-95%): Open End Funds - U.S. - Small Growth
Top Quartile 2nd Quartile 3rd Quartile Bottom Quartile
Ret
urn
YTD 1 year 3 years 5 years 10 years 15 years-20.0
-15.0
-10.0
-5.0
0.0
5.0
10.0
15.0
20.0
25.0
Manager A Manager B Manager CRussell 2000 TR USD
Trailing ReturnsData Point: Return
YTD 1 year 3 years 5 years 10 years 15 years
Manager A
Manager B
Manager C
Russell 2000 TR USD
Median
Average
Count
5th Percentile
25th Percentile
50th Percentile
75th Percentile
95th Percentile
3.67
3.79
767
8.04
5.71
3.67
2.19
-0.63
-10.31
-10.11
752
-1.91
-7.46
-10.31
-12.96
-16.24
17.21
16.94
658
21.71
19.73
17.21
15.00
10.41
0.20
0.12
571
3.96
1.75
0.20
-1.41
-3.98
5.66
5.55
369
7.89
6.63
5.66
4.61
2.84
6.54
6.46
173
10.11
7.91
6.54
5.11
2.82
9.18
-0.12
6.35
3.37
-4.80
-15.89
-7.05
-8.88
21.03
12.13
18.22
16.47
3.39
-4.11
-2.42
-0.73
6.76
5.94 6.09
As of 5/31/2012 Page 14 of 15
Source: Morningstar Direct
Small Cap Growth Comparison
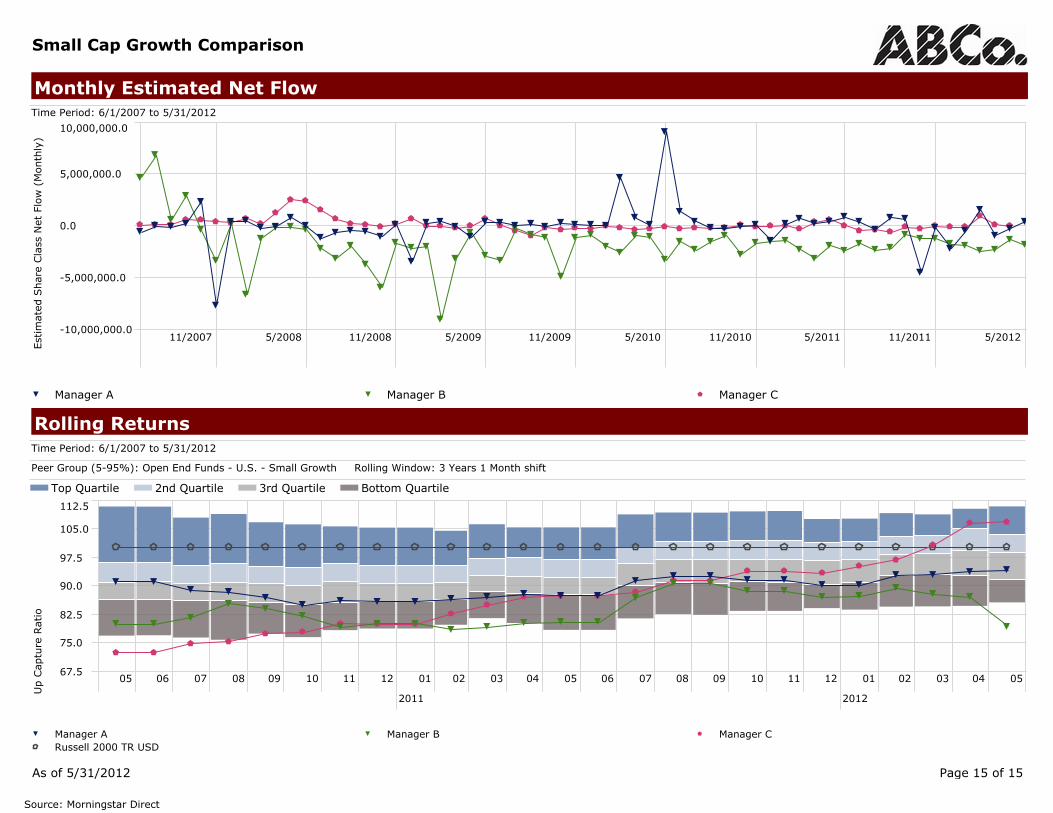
Monthly Estimated Net FlowTime Period: 6/1/2007 to 5/31/2012
Est
imat
ed S
har
e Cla
ss N
et F
low
(M
onth
ly)
11/2007 5/2008 11/2008 5/2009 11/2009 5/2010 11/2010 5/2011 11/2011 5/2012-10,000,000.0
-5,000,000.0
0.0
5,000,000.0
10,000,000.0
Manager A Manager B Manager C
Rolling ReturnsTime Period: 6/1/2007 to 5/31/2012
Peer Group (5-95%): Open End Funds - U.S. - Small Growth Rolling Window: 3 Years 1 Month shift
Top Quartile 2nd Quartile 3rd Quartile Bottom Quartile
Up C
aptu
re R
atio
05 06 07 08 09 10 11 12
2011
01 02 03 04 05 06 07 08 09 10 11 12
2012
01 02 03 04 0567.5
75.0
82.5
90.0
97.5
105.0
112.5
Manager A Manager B Manager CRussell 2000 TR USD
As of 5/31/2012 Page 15 of 15
Source: Morningstar Direct

Manager A China Equity
Cumulative Return Since LaunchTime Period: 8/1/2007 to 5/31/2012
11/2007 5/2008 11/2008 5/2009 11/2009 5/2010 11/2010 5/2011 11/2011 5/2012-80.0%
-60.0%
-40.0%
-20.0%
0.0%
20.0%
40.0%
60.0%
80.0%
100.0%
120.0%
Manager A China Equity Manager B Hong Kong China Manager C China Focus
Manager D China MSCI China Morningstar China Equity AVG
Rolling Returns vs. Peer GroupPeer Group (1-100%): None Rolling Window: 3 Years 1 Month shift
Top Quartile 2nd Quartile 3rd Quartile Bottom Quartile
Ret
urn
07 08 09 10 11 12
2011
01 02 03 04 05 06 07 08 09 10 11 12
2012
01 02 03 04 05-20.0
0.0
20.0
40.0
Manager A China Equity Manager B China Manager C China FocusManager D China MSCI China Morningstar China Equity AVG
Performance in Up Months
Up
Cap
ture
Ret
urn
Since Launch0.00
1.00
2.00
3.00
4.00
5.00
6.00
7.00
8.00
9.00 8.21
6.71 6.57
7.57 7.39
6.75
Manager A China Equity Manager B Hong Kong China Manager C China Focus
Manager D China MSCI China Morningstar China Equity AVG
Performance in Down Months
Dow
n C
aptu
re R
etur
n
Since Launch-9.00
-8.00
-7.00
-6.00
-5.00
-4.00
-3.00
-2.00
-1.00
0.001.00
-6.77
-7.81
-6.96
-8.37 -8.21-7.58
Manager A China Equity Manager B Hong Kong China Manager C China Focus
Manager D China MSCI China Morningstar China Equity AVG
Source: Morningstar Direct Page 1 of 8 As of 5/31/2012

Manager A China Equity
Executive Summary
xxxxxxxxxxxxxxxxxxxxxxxxxxxxxxxxxxxxxxxxxxxxxxxxxxxxxxxxxxxxxxxxxxxxxxxxxxxxxxxxxxxxxxxxxxxxxxxxxxxxxxxxxxxxxxxxxxxxxxxxxxxxxxxxxxxxxxxxxxxxxxxxxxxxxxxxxxxxxxxxxxxxxxxxxxxxxxxxxxxxxxxxxxxxxxxxxxxxxxxxxxxxxxxxxxxxxxxxxxxxxxxxxxxxxxxxxxxxxxxxxxxxxxxxxxxxxxxxxxxxxxxxxxxxxxxxxxxxxxxxxxxxxxxxxxxxxxxxxxxxxxxxxxxxxxxxxxxxxxxxxxxxxxxxxxxxxxxxxxxxxxxxxxxxxxxxxxxxxxxxxxxxxxxxxxxxxxxxxxxxxxxxxxxxxxxxxxxxxxxxxxxxxxxxxxxxxxxxxxxxxxxxxxxxxxxxxxxxxxxxxxxxxxxxxxxxxxxxxxxxxxxxxxxxxxxxxxxxxxxxxxxxxxxxxxxxxxxxxxxxxxxxxxxxxxxxxxxxxxxxxxxxxxxxxxxxxxxxxxxxxxxxxxxxxxxxxxxxxxxxxxxxxxxxxxxxxxxxxxxxxxxxxxxxxxxxxxxxxxxxxxxxxxxxxxxxxxxxxxxxxxxxxxxxxxxxxxxxxxxxxxxxxxxxxxxxxxxxxxxxxxxxxxxxxxxxxxxxxxxxxxxxxxxxxxxxxxxxxxxxxxxxxxxxxxxxxxxxxxxxxxxxxxxxxxxxxxxxxxxxxxxxxxxxxxxxxxxxxxxxxx
xxxxxxxxxxxxxxxxxxxxxxxxxxxxxxxxxxxxxxxxxxxxxxxxxxxxxxxxxxxxxxxxxxxxxxxxxxxxxxxxxxxxxxxxxxxxxxxxxxxxxxxxxxxxxxxxxxxxxxxxxxxxxxxxxxxxxxxxxxxxxxxxxxxxxxxxxxxxxxxxxxxxxxxxxxxxxxxxxxxxxxxxxxxxxxxxxxxxxxxxxxxxxxxxxxxxxxxxxxxxxxxxxxxxxxxxxxxxxxxxxxxxxxxxxxxxxxxxxxxxxxxxxxxxxxxxxxxxxxxxxxxxxxxxxxxxxxxxxxxxxxxxxxxxxxxxxxxxxxxxxxxxxxxxxxxxxxxxxxxxxxxxxxxxxxxxxxxxxxxxxxxxxxxxxxxxxxxxxxxxxxxxxxxxxxxxxxxxxxxxxxxxxxxxxxxxxxxxxxxxxxxxxxxxxxxxxxxxxxxxxxxxxxxxxxxxxxxxxxxxxxxxxxxxxxxxxxxxxxxxx
xxxxxxxxxxxxxxxxxxxxxxxxxxxxxxxxxxxxxxxxxxxxxxxxxxxxxxxxxxxxxxxxxxxxxxxxxxxxxxxxxxxxxxxxxxxxxxxxxxxxxxxxxxxxxxxxxxxxxxxxxxxxxxxxxxxxxxxxxxxxxxxxxxxxxxxxxxxxxxxxxxxxxxxxxxxxxxxxxxxxxxxxxxxxxxxxxxxxxxxxxxxxxxxxxxxxxxxxxxxxxxxxxxxxxxxxxxxxxxxxxxxxxxxxxxxxxxxxxxxxxxxxxxxxxxxxxxxxxxxxxxxxxxxxxxxxxxxxxxxxxxxxxxxxxxxxxxxxxxxxxxxxxxxxxxxxxxxxxxxxxxxxxxxxxxxxxxxxxxxxxxxxxxxxxxxxxxxxxxx
xxxxxxxxxxxxxxxxxxxxxxxxxxxxxxxxxxxxxxxxxxxxxxxxxxxxxxxxxxxxxxxxxxxxxxxxxxxxxxxxxxxxxxxxxxxxxxxxxxxxxxxxxxxxxxxxxxxxxxxxxxxxxxxxxxxxxxxxxxxxxxxxxxxxxxxxxxxxxxxxxxxxxxxxxxxxxxxxxxxxxxxxxxxxxxxxxxxxxxxxx
xxxxxxxxxxxxxxxxxxxxxxxxxxxxxxxxxxxxxxxxxxxxxxxxxxxxxxxxxxxxxxxxxxxxxxxxxxxxxxxxxxxxxxxxxxxxxxxxxxxxxxxxxxxxxxxxxxxxxxxxxxxxxxxxxxxxxxxxxxxxxxxxxxxxxxxxxxxxxxxx
Team Review Snapshot
Current Status Approved FundLead Analyst Bob SmithXYZ Classification Equity - China EquityXYZ Classification Benchmark MSCI China
Manager Meeting Note
Effective Date: 30/10/2011
xxxxxxxxxxxxxxxxxxxxxxxxxxxxxxxxxxxxxxxxxxxxxxxxxxxxxxxxxxxxxxxxxxxxxxxxxxxxxxxxxxxxxxxxxxxxxxxxxxxxxxxxxxxxxxxxxxxxxxxxxxxxxxxxxxxxxxxxxxxxxxxxxxxxxxxxxxxxxxxxxxxxxxxxxxxxxxxxxxxxxxxxxxxxxxxxxxxxxxxxxxxxxxxxxxxxxxxxxxxxxxxxxxxxxxxxxxxxxxxxxxxxxxxxxxxxxxxxxxxxxxxxxxxxxxxxxxxxxxxxxxxxxxxxxxxxxxxxxxxxxxxxxxxxxxxxxxxxxxxxx
xxxxxxxxxxxxxxxxxxxxxxxxxxxxxxxxxxxxxxxxxxxxxxxxxxxxxxxxxxxxxxxxxxxxxxxxxxxxxxxxxxxxxxxxxxxxxxxxxxxxxxxxxxxxxxxxxxxxxxxxxxxxxxxxxxxxxxxxxxxxxxxxxxxxxxxxxxxxxxxxxxxxxxxxxxxxxxxxxxxxxxxxxxxxxxxxxxxxxxxxxxxxxxxxxxxxxxxxxxxxxxxxxxxxxxxxxxxxxxxxxxxxxxxxxxxxxxxxxxxxxxxxxxxxxxxxxxxxxxxxxxxxxxxxxxxxxxxxxxxxxxx
xxxxxxxxxxxxxxxxxxxxxxxxxxxxxxxxxxxxxxxxxxxxxxxxxxxxxxxxxxxxxxxxxxxxxxxxxxxxxxxxxxxxxxxxxxxxxxxxxxxxxxxxxxxxxxxxxxxxxxxxxxxxxxxxxxxxxxxxxxxxxxxxxxxxxxxxxxxxxxxxxxxxxxxxxxxxxxxxxxxxxxxxxxxxxxxxxxxxxxxxxxxxxxxxxxxxxxxxxxxxxxxxxxxxxxxxxxxxxxxxxxxxxxxxxxxxxxxxxxxxxxxxxxxxxxxxxxxxxxxxxxxxxxxxxxxxxxxxxxxxxxxxxxxxxxxxxxxxxxxxxxxxxxxxxxxxxxxxxxxxxxxxxxxxxxxxxxxxxxxxxxxxxxxxxxxxxxxxxxxxxxxxxxxxxxxxxxxxxxxxxxxxxxxxxxxxxxxxxxxxxxxxxxxxxxxxxxxxxxxxxxxxxxxxxxxxxxxxxxxxxxxxxxxxxxxxxxxxxxxxxxxxxxxxxxxxxxxxxxxxxxxxxxxxxxxxxxxxxxxxxxxxxxxxxxxxxxxxxxxxxxxxxxxxxxxxxxxxxxxxxxxxxxxxxxxxxxxxxxxxxxxxxxxxxxxxxxxxxxxxxxxxxxxxxxxxxxxxxxxxxxxxxxxxxxxxxxxxxxxxxxxxxxxxxxxxxxxxxxxxxxxxxxxxxxxxxxxxxxxx
xxxxxxxxxxxxxxxxxxxxxxxxxxxxxxxxxxxxxxxxxxxxxxxxxxxxxxxxxxxxxxxxxxxxxxxxxxxxxxxxxxxxxxxxxxxxxxxxxxxxxxxxxxxxxxxxxxxxxxxxxxxxxxxxxxxxxxxxxxxxxxxxxxxxxxxxxxxxxxxxxxxxxxxxxxxxxxxxxxxxxxxxxxxxxxxxxxxxxxxxxxxxxxxxxxxxxxxxxxxxxxxxxxxxxxxxxxxxxxxxxxxxxxxxxx
�������
xxxxxxxxxxxxxxxxxxxxxxxxxxxxxxxxxxxxxxxxxxxxxxxxxxxxxxxxxxxxxxxxxxxxxxxxxxxxxxxxxxxxxxxxxxxxxxxxxxxxxxxxxxxxxxxxxxxxxxxxxxxxxxxxxxxxxxxxxxxxxxxxxxxxxxxxxxxxxxxxxxxxxxxxxxxxxxxxxxx
xxxxxxxxxxxxxxxxxxxxxxxxxxxxxxxxxxxxxxxxxxxxxxxxxxxxxxxxxxxxxxxxxxxxxxxxxxxxxxxxxxxxxxxxxxxxxxxxxxxxxxxxxxxxxxxxxxxxxxxxxxxxxxxxxxxxxxxxxxxxxxxxxxxxxxxxxxxxxxxxxxxxxxxxxxxxx
Source: Morningstar Direct Page 2 of 8 As of 5/31/2012

Manager A China Equity
Performance Relative to Peer Group QuartilesPeer Group (1-100%): None
Ret
urn
Last Quarter YTD 1 year 2 years 3 years 5 years Since Launch-30.00
-20.00
-10.00
0.00
10.00
20.00
Manager A China Equity Manager B Hong Kong China Manager C China FocusManager D China MSCI China Morningstar China Equity AVG
Calendar Year Returns (%)
Ret
urn
YTD 2011 2010 2009-80.00
-40.00
0.00
40.00
80.00
120.00
160.00
0.88
-22.60
15.00
111.06
0.91
-19.45
2.06
64.22
1.39
-20.19
5.61
67.13
1.28
-25.17
4.59
65.08
0.88
-20.33
2.32
58.80
1.73
-22.31
5.34
69.64
Manager A China Equity Manager B Hong Kong China Manager C China FocusManager D China MSCI China Morningstar China Equity AVG
Time Period: 8/1/2007 to 5/31/2012
Return Std DevSharpe
RatioDownsideDeviation
SortinoRatio
ExcessReturn
AlphaMax
DrawdownTracking
ErrorInformation
Ratio
Manager A China Equity
Manager B Hong Kong China
Manager C China Focus
Manager D China
MSCI China
Morningstar China Equity AVG -4.97 31.54 -64.74
8.76
-6.58
-2.26
-5.19
-5.19
33.58
31.99
30.65
34.79
33.98
0.39
-0.07
0.05
0.00
-0.01
5.53
4.69
5.24
4.22
0.00
0.63
-0.10
0.08
0.00
-0.01
13.95
-1.39
2.93
0.00
0.00
13.40
-2.08
1.95
0.31
0.00
-54.96
-65.67
-61.75
-64.68
-65.58
11.58
5.84
7.09
5.61
0.00
1.20
-0.24
0.41
0.00
-0.02 4.54 -0.03 0.22 -0.50 5.83 0.04
Source: Morningstar Direct Page 3 of 8 As of 5/31/2012

Manager A China Equity
Risk-Reward Since LaunchTime Period: 8/1/2007 to 5/31/2012
Ret
urn
Std Dev0.00 10.00 20.00 30.00 40.00
-9.00
-6.00
-3.00
0.00
3.00
6.00
9.00
12.00
Manager A China Equity Manager B Hong Kong China Manager C China FocusManager D China MSCI China Morningstar China Equity AVG
Risk-Reward 3 YearsTime Period: 6/1/2009 to 5/31/2012
Ret
urn
Std Dev0.00 10.00 20.00 30.00 40.00
-2.00
1.00
4.00
7.00
10.00
13.00
16.00
Manager A China Equity Manager B Hong Kong China Manager C China FocusManager D China MSCI China Morningstar China Equity AVG
Risk-Reward 1 YearTime Period: 6/1/2011 to 5/31/2012
Ret
urn
Std Dev0.00 10.00 20.00 30.00 40.00 50.00
-40.00
-30.00
-20.00
-10.00
0.00
Manager A China Equity Manager B Hong Kong China Manager C China FocusManager D China MSCI China Morningstar China Equity AVG
Up-Down Capture Ratio 1 YearTime Period: 6/1/2011 to 5/31/2012
Up
Cap
ture
Rat
io
Down Capture Ratio0.00 20.00 40.00 60.00 80.00 100.00 120.00 140.00
0.00
20.00
40.00
60.00
80.00
100.00
120.00
Manager A China Equity Manager B Hong Kong China Manager C China FocusManager D China MSCI China Morningstar China Equity AVG
Up-Down Capture Ratio 3 YearsTime Period: 6/1/2009 to 5/31/2012
Up
Cap
ture
Rat
io
Down Capture Ratio0.00 20.00 40.00 60.00 80.00 100.00 120.00 140.00
0.00
30.00
60.00
90.00
120.00
150.00
180.00
Manager A China Equity Manager B Hong Kong China Manager C China FocusManager D China MSCI China Morningstar China Equity AVG
Up-Down Capture Ratio Since LaunchTime Period: 8/1/2007 to 5/31/2012
Up
Cap
ture
Rat
io
Down Capture Ratio0.00 20.00 40.00 60.00 80.00 100.00 120.00
0.00
20.00
40.00
60.00
80.00
100.00
120.00
140.00
Manager A China Equity Manager B Hong Kong China Manager C China FocusManager D China MSCI China Morningstar China Equity AVG
Excess Return vs Tracking Error 3 YearsTime Period: 6/1/2009 to 5/31/2012
Exc
ess
Ret
urn
Tracking Error-2.00 0.00 2.00 4.00 6.00 8.00 10.00 12.00
-2.00
1.00
4.00
7.00
10.00
13.00
16.00
Manager A China Equity Manager B Hong Kong China Manager C China FocusManager D China MSCI China Morningstar China Equity AVG
Excess Return vs Tracking Error S.L.Time Period: 8/1/2007 to 5/31/2012
Exc
ess
Ret
urn
Tracking Error-2.00 1.00 4.00 7.00 10.00 13.00 16.00
-4.00
0.00
4.00
8.00
12.00
16.00
20.00
Manager A China Equity Manager B Hong Kong China Manager C China FocusManager D China MSCI China Morningstar China Equity AVG
Excess Return vs Tracking Error 1 YearTime Period: 6/1/2011 to 5/31/2012
Exc
ess
Ret
urn
Tracking Error-2.00 1.00 4.00 7.00 10.00 13.00
-7.00
-5.00
-3.00
-1.00
1.00
3.00
Manager A China Equity Manager B Hong Kong China Manager C China FocusManager D China MSCI China Morningstar China Equity AVG
Source: Morningstar Direct Page 4 of 8 As of 5/31/2012

Manager A China Equity
Sharpe Ratio
Sha
rpe
Rat
io
1 year 3 years Since Launch-0.80
-0.70
-0.60
-0.50
-0.40
-0.30
-0.20
-0.10
0.00
0.10
0.20
0.30
0.40
0.500.60
Manager A China Equity Manager B Hong Kong China Manager C China FocusManager D China MSCI China Morningstar China Equity AVG
Max Drawdown (%)
Max
Dra
wdo
wn
1 year 3 years Since Launch-67.50
-60.00
-52.50
-45.00
-37.50
-30.00
-22.50
-15.00
-7.50
0.00
Manager A China Equity Manager B Hong Kong China Manager C China FocusManager D China MSCI China Morningstar China Equity AVG
Up Months (%)
Up
Per
iod
Per
cent
1 year 3 years Since Launch0.00
5.00
10.00
15.00
20.00
25.00
30.00
35.00
40.00
45.00
50.00
55.00
Manager A China Equity Manager B Hong Kong China Manager C China FocusManager D China MSCI China Morningstar China Equity AVG
Down Months (%)
Dow
n P
erio
d P
erce
nt
1 year 3 years Since Launch0.00
5.00
10.00
15.00
20.00
25.00
30.00
35.00
40.00
45.00
50.00
55.00
60.00
65.0070.00
Manager A China Equity Manager B Hong Kong China Manager C China FocusManager D China MSCI China Morningstar China Equity AVG
Source: Morningstar Direct Page 5 of 8 As of 5/31/2012

Manager A China Equity
Excess Return
Exc
ess
Ret
urn
1 year 3 years Since Launch-6.00
-4.00
-2.00
0.00
2.00
4.00
6.00
8.00
10.00
12.00
14.00
Manager A China Equity Manager B Hong Kong China Manager C China FocusManager D China MSCI China Morningstar China Equity AVG
Alpha
Alp
ha (
non-
exce
ss r
etu
rn)
1 year 3 years Since Launch-6.00
-4.00
-2.00
0.00
2.00
4.00
6.00
8.00
10.00
12.00
14.00
Manager A China Equity Manager B Hong Kong China Manager C China FocusManager D China MSCI China Morningstar China Equity AVG
Tracking Error
Tra
ckin
g E
rror
1 year 3 years Since Launch0.00
1.00
2.00
3.00
4.00
5.00
6.00
7.00
8.00
9.00
10.00
11.0012.00
Manager A China Equity Manager B Hong Kong China Manager C China FocusManager D China MSCI China Morningstar China Equity AVG
Information Ratio
Info
rmat
ion
Rat
io (
arith
)
1 year 3 years Since Launch-0.60
-0.40
-0.20
0.00
0.20
0.40
0.60
0.80
1.00
1.20
1.40
Manager A China Equity Manager B Hong Kong China Manager C China FocusManager D China MSCI World NR USD Morningstar China Equity AVG
Source: Morningstar Direct Page 6 of 8 As of 5/31/2012

Manager A China Equity
Number of HoldingsPeer Group (1-100%): None
# of Holdings (Long)25.0
50.0
75.0
100.0
125.0
150.0
175.0
Portfolio Turnover (%)Peer Group (1-100%): None
Turnover Ratio %-60.0
-40.0
-20.0
0.0
20.0
40.0
60.0
80.0
100.0
120.0
140.0
160.0
180.0
Fund Size ($m)Peer Group (1-100%): None
Fund Size0.0M
250.0M
500.0M
750.0M
1,000.0M
1,250.0M
1,500.0M
1,750.0M
2,000.0M
2,250.0M
2,500.0M
2,750.0M
3,000.0M
3,250.0M
3,500.0M3,750.0M
Relative to Peer GroupPeer Group: None
Expense Ratio100.0
75.0
50.0
25.0
0.0
Manager Tenure of FundPeer Group (1-100%): None
Manager Tenure (Longest)0.0
1.0
2.0
3.0
4.0
5.0
6.0
7.0
8.0
9.0
10.0
11.0
12.0
13.0
14.015.0
Equity StyleTime Period: 8/1/2007 to 5/31/2012
0.0
10.0
20.0
30.0
40.0
50.0
60.0
70.0
80.0
90.0
100.0
5/2008 11/2008 5/2009 11/2009 5/2010 11/2010 5/2011 11/2011 5/2012
Large Value % Large Core % Large Growth %Mid Value % Mid Core % Mid Growth %Small Value % Small Core % Small Growth %
Equity SectorsTime Period: 8/1/2007 to 5/31/2012
0.0
10.0
20.0
30.0
40.0
50.0
60.0
70.0
80.0
90.0
100.0
5/2008 11/2008 5/2009 11/2009 5/2010 11/2010 5/2011 11/2011 5/2012
Energy % Materials % Industrials %
Consumer Discretionary % Consumer Staples % Healthcare %
Financials % Information Technology % Telecom Services %
Utilities %
Equity RegionsTime Period: 8/1/2007 to 5/31/2012
0.0
10.0
20.0
30.0
40.0
50.0
60.0
70.0
80.0
90.0
100.0
5/2008 11/2008 5/2009 11/2009 5/2010 11/2010 5/2011 11/2011 5/2012
North America % Latin America % United Kingdom %Europe Dev % Europe Emrg % Africa/Middle East %Australasia % Japan % Asia Dev %Asia Emrg %
Source: Morningstar Direct Page 7 of 8 As of 5/31/2012

Manager A China Equity
% Up Months: Number of months in which return was above zero, divided by the total number of months.
% Down Months: Number of months in which return was below zero, divided by the total number of months.
Perf in Up Months: Annualized return of the fund in months when the return of the benchmark was positive.
Perf in Down Months: Annualized return of the fund in months when the return of the benchmark was negative.
Up Capture Ratio: Measures manager's performance in up markets. An up market is defined as those months in which the benchark's return is greater than zero. In essence, it tells you what percentage of the up market was captured by the manager. For example, if the ratio is 110%, the manager has captured 110% of the up market and therefore overperformed the market on the upside.
Down Capture Ratio: Measures manager's performance in down markets. A down market is defined as those months in which the benchark's return is less than zero. In essence, it tells you what percentage of the down market was captured by the manager. For example, if the ratio is 110%, the manager has captured 110% of the down market and therefore underperformed the market on the downside.
Excess Return: Return in excess of the benchmark.
Std Dev: A statistical measurement of dispersion about an average, which, for a mutual fund, depicts how widely the returns varied over a certain period of time. Investors use the standard deviation of historical performance to try to predict the range of returns that are most likely for a given fund. When a fund has a high standard deviation, the predicted range of performance is wide, implying greater volatility. If a fund's returns follow a normal distribution, then approximately 68 percent of the time they will fall within one standard deviation of the average return for the fund, and 95 percent of the time within two standard deviations. Morningstar computes standard deviation using the trailing monthly total returns for the appropriate time period. All standard deviations greater than one year are annualized.
Sharpe Ratio: The fund's annualized return in excess of the cash rate, divided by the standard deviation of those excess returns.
Downside Deviation: Annualized deviation below the benchmark.
Sortino Ratio: The fund's annualized return in excess of the cash rate, divided by the downside deviation. Since upside variability is not necessarily a bad thing, Sortino ratio is sometimes a morepreferable measure than Sharpe ratio.
Max Drawdown: The maximum peak-to-trough decline during the given time period.
Information Ratio: Information ratio is the same calculation as Sharpe ratio, only the return is in excess of the given benchmark, rather than the cash rate.
Tracking Error: The standard deviation of the returns in excess of the benchmark. If low, the fund tracks the benchmark closely. If high, there is greater deviation from the benchmark.
Alpha: A measure of the difference between a portfolio’s actual returns and its expected performance, given its level of risk as measured by beta. A positive Alpha figure indicates the portfolio has performed better than its beta would predict. In contrast, a negative Alpha indicates the portfolio has underperformed, given the expectations established by beta. Alpha is calculated by taking the average monthly return of the investment and subtracting beta times the average monthly return of the benchmark.
Note Regarding Quartiles: Quartile bars (e.g. in the Rolling Returns vs. Peer Group chart on page 1) each contain the same number of funds. The size of the bar represents the range of returns for teh funds in that quartile.
Note on Up-Down Capture Ratio charts: For Up-Down Capture Ratio, the upper-left quadrant is best. This quadrant signifies that the investment outperformed the benchmark on the upside and the downside.
Source: Morningstar Direct Page 8 of 8 As of 5/31/2012
As of 5/31/2012
Fund Comparison Report
Produced by:XYZ, Inc.
Produced for:ABC Investments
Source: Morningstar Direct

Performance
Cumulative Performance
Time Period: 6/1/2007 to 5/31/2012
11/2007 5/2008 11/2008 5/2009 11/2009 5/2010 11/2010 5/2011 11/2011 5/201260.0
70.0
80.0
90.0
100.0
110.0
120.0
130.0
140.0
150.0160.0
Manager A Manager B Manager CManager D Manager E Manager FManager G Manager H Credit Suisse HY USD
Annualized Returns
Ret
urn
1 month 3 months YTD 1 year 3 years 5 years 10 years-2.5
0.0
2.5
5.0
7.5
10.0
12.5
15.017.5
Manager A Manager B Manager CManager D Manager E Manager FManager G Manager H Credit Suisse HY USD
Annual Performance
Ret
urn
2006 2007 2008 2009 2010 YTD-40.0
-20.0
0.0
20.0
40.0
60.0
80.0
Manager A Manager B Manager CManager D Manager E Manager FManager G Manager H Credit Suisse HY USD
12-month Rolling Performance
Time Period: 6/1/2007 to 5/31/2012
Rolling Window: 1 Year 1 Month shift
Ret
urn 06 09 12
2009
03 06 09 12
2010
03 06 09 12
2011
03 06 09 12
2012
03-50.0
0.0
50.0
100.0
Manager A Manager B Manager CManager D Manager E Manager FManager G Manager H Credit Suisse HY USD
2007 2008 2009 2010 2011 YTD
Manager A
Manager B
Manager C
Manager D
Manager E
Manager F
Manager G
Manager H
Credit Suisse HY USD
2.09
0.97
-0.12
0.76
3.87
3.47
0.32
2.65
-26.38
-27.59
-32.14
-25.34
-36.12
-25.88
-21.74
-31.45
-26.17
42.25
46.42
51.58
50.02
62.78
37.59
40.05
51.48
54.22
12.26
15.88
12.32
12.77
15.57
14.63
14.44
14.18
14.42
3.79
2.66
3.90
1.09
0.43
3.59
1.98
1.63
5.47
4.02
4.91
3.86
5.18
4.90
4.30
4.47
5.68
4.71
YTD 1 year 3 years 5 years 10 years 1 month 3 months
Manager A
Manager B
Manager C
Manager D
Manager E
Manager F
Manager G
Manager H
Credit Suisse HY USD
4.02
4.91
3.86
5.18
4.90
4.30
4.47
5.68
4.71
2.67
2.22
3.01
0.86
-0.91
2.83
1.59
1.47
4.52
13.42
14.83
13.95
14.44
17.45
14.92
13.54
15.37
16.64
4.38
5.04
3.69
5.39
4.41
4.63
5.13
4.28
7.00
6.44
6.30
7.36
6.66
7.00
6.26
9.17
-1.79
-1.43
-1.50
-1.68
-1.79
-1.63
-1.55
-1.41
-1.32
-1.11
-0.72
-0.50
-0.95
-1.20
-0.89
-0.66
-0.25
-0.28
Source: Morningstar Direct

Performance
3-Year Capture Ratio
Time Period: 6/1/2009 to 5/31/2012
Up C
aptu
re R
atio
Down Capture Ratio0.0 30.0 60.0 90.0 120.0 150.0 180.0
0.0
20.0
40.0
60.0
80.0
100.0
120.0140.0
Manager A Manager B Manager CManager D Manager E Manager FManager G Manager H Credit Suisse HY USD
5-Year Capture Ratio
Time Period: 6/1/2007 to 5/31/2012
Up C
aptu
re R
atio
Down Capture Ratio0.0 20.0 40.0 60.0 80.0 100.0 120.0 140.0
0.0
20.0
40.0
60.0
80.0
100.0
120.0
Manager A Manager B Manager CManager D Manager E Manager FManager G Manager H Credit Suisse HY USD
UpCapture
Ratio
DownCapture
Ratio
Manager A
Manager B
Manager C
Manager D
Manager E
Manager F
Manager G
Manager H
Credit Suisse HY USD
91.89
97.93
89.81
99.43
113.25
99.53
91.99
100.24
100.00
123.26
122.85
105.52
135.65
139.29
127.76
121.47
122.88
100.00
UpCapture
Ratio
DownCapture
Ratio
Manager A
Manager B
Manager C
Manager D
Manager E
Manager F
Manager G
Manager H
Credit Suisse HY USD
95.80
95.63
90.40
97.65
102.59
94.84
88.88
100.61
100.00
112.80
107.77
109.91
108.17
122.69
109.57
97.07
120.67
100.00
Drawdown
Time Period: 6/1/2007 to 5/31/2012
BestQuarter
WorstQuarter
MaxDrawdown
Manager AManager BManager CManager DManager EManager FManager GManager HCredit Suisse HY USD
17.2716.0319.7018.3326.4214.0614.7623.1820.23
-18.22-21.30-24.46-19.23-27.87-15.68-14.57-22.37-18.79
-33.25-32.15-36.80-31.10-37.61-31.54-28.28-36.36-31.84
Source: Morningstar Direct

Risk
Standard Deviation
Std
Dev
1 year 3 years 5 years 10 years0.0
2.0
4.0
6.0
8.0
10.0
12.0
14.016.0
Manager A Manager B Manager CManager D Manager E Manager FManager G Manager H Credit Suisse HY USD
Semi-Standard Deviation
Sem
i D
ev
1 year 3 years 5 years 10 years0.0
2.0
4.0
6.0
8.0
10.0
12.014.0
Manager A Manager B Manager CManager D Manager E Manager FManager G Manager H Credit Suisse HY USD
Annualized Standard Deviation
1 year 3 years 5 years 10 years
Manager A
Manager B
Manager C
Manager D
Manager E
Manager F
Manager G
Manager H
Credit Suisse HY USD
10.61
10.68
9.19
11.46
11.76
11.25
9.94
9.62
9.08
8.32
8.47
7.57
9.35
10.63
8.68
8.24
8.50
7.75
13.86
13.11
13.85
13.35
15.75
12.95
11.80
14.34
13.09
10.77
10.18
10.25
12.15
10.23
8.72
9.96
Annualized Semi-Standard Deviation
1 year 3 years 5 years 10 years
Manager A
Manager B
Manager C
Manager D
Manager E
Manager F
Manager G
Manager H
Credit Suisse HY USD
7.23
7.72
6.31
7.90
8.04
7.57
6.97
7.03
6.31
6.15
6.40
5.63
6.77
7.77
6.43
6.09
6.46
5.71
10.99
10.66
11.20
10.52
12.60
10.43
9.25
11.49
10.40
8.56
8.20
8.18
9.63
8.23
6.90
7.92
1 Year Rolling Standard Deviation
Std
Dev
06 09 12
2004
03 06 09 12
2005
03 06 09 12
2006
03 06 09 12
2007
03 06 09 12
2008
03 06 09 12
2009
03 06 09 12
2010
03 06 09 12
2011
03 06 09 12
2012
030.0
10.0
20.0
30.0
40.0
Manager A Manager B Manager CManager D Manager E Manager FManager G Manager H Credit Suisse HY USD
1 Year Rolling Semi-Standard DeviationSem
i D
ev
06 09 12
2004
03 06 09 12
2005
03 06 09 12
2006
03 06 09 12
2007
03 06 09 12
2008
03 06 09 12
2009
03 06 09 12
2010
03 06 09 12
2011
03 06 09 12
2012
030.0
7.5
15.0
22.5
30.0
Manager A Manager B Manager CManager D Manager E Manager FManager G Manager H Credit Suisse HY USD
Source: Morningstar Direct

Risk/Return
Risk-Return Scatterplot - 3 Year
Ret
urn
Std Dev0.0 2.0 4.0 6.0 8.0 10.0 12.0 14.0
0.0
3.0
6.0
9.0
12.0
15.0
18.0
21.0
Manager A Manager B Manager CManager D Manager E Manager FManager G Manager H Credit Suisse HY USD
3 Year
Return Std Dev
Manager A
Manager B
Manager C
Manager D
Manager E
Manager F
Manager G
Manager H
Credit Suisse HY USD
13.42
14.83
13.95
14.44
17.45
14.92
13.54
15.37
16.64
8.32
8.47
7.57
9.35
10.63
8.68
8.24
8.50
7.75
Risk-Return Scatterplot - 5 Year
Ret
urn
Std Dev0.0 3.0 6.0 9.0 12.0 15.0 18.0
0.0
2.0
4.0
6.0
8.0
10.0
Manager A Manager B Manager CManager D Manager E Manager FManager G Manager H Credit Suisse HY USD
5 Year
Return Std Dev
Manager A
Manager B
Manager C
Manager D
Manager E
Manager F
Manager G
Manager H
Credit Suisse HY USD
4.38
5.04
3.69
5.39
4.41
4.63
5.13
4.28
7.00
13.86
13.11
13.85
13.35
15.75
12.95
11.80
14.34
13.09
10 Year
Return Std Dev
Manager A
Manager B
Manager C
Manager D
Manager E
Manager F
Manager G
Manager H
Credit Suisse HY USD
6.44
6.30
7.36
6.66
7.00
6.26
9.17
10.77
10.18
10.25
12.15
10.23
8.72
9.96
Risk-Return Scatterplot - 10 Year
Ret
urn
Std Dev0.0 2.0 4.0 6.0 8.0 10.0 12.0 14.0
0.0
2.0
4.0
6.0
8.0
10.0
12.0
Manager A Manager B Manager CManager D Manager E Manager FManager G Manager H Credit Suisse HY USD
Source: Morningstar Direct
Risk/Return
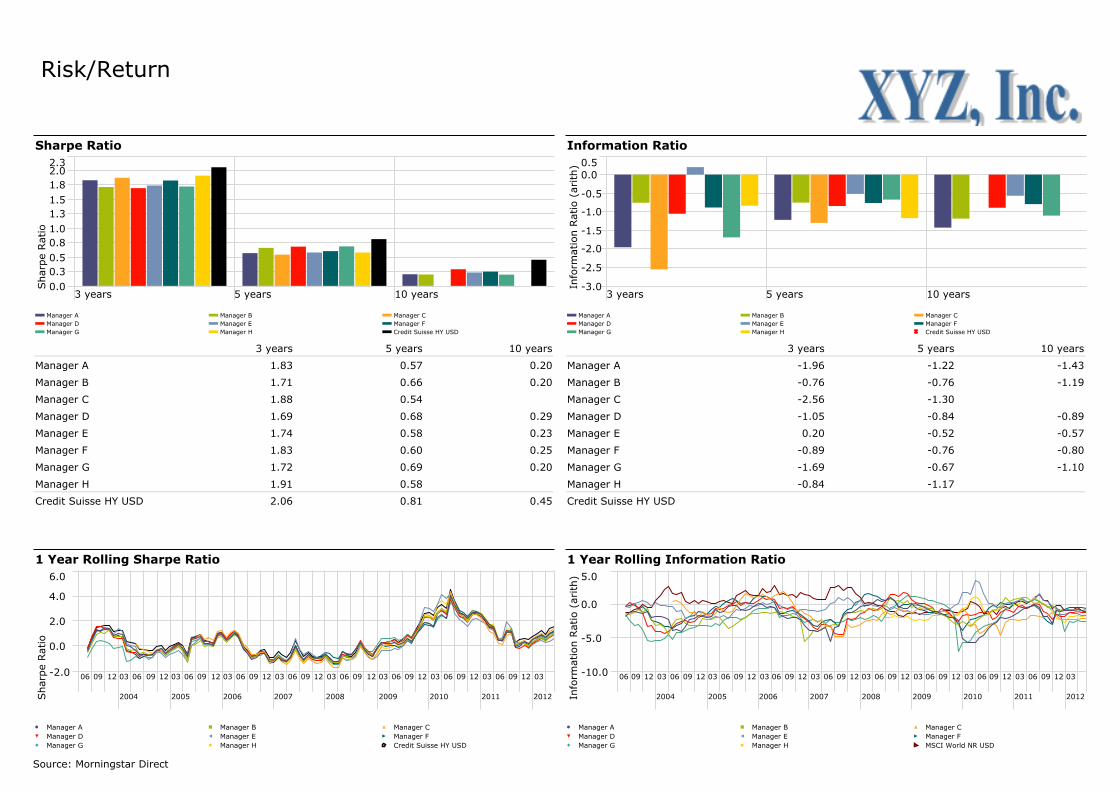
Sharpe Ratio
Shar
pe
Rat
io
3 years 5 years 10 years0.00.30.50.81.01.31.51.82.02.3
Manager A Manager B Manager CManager D Manager E Manager FManager G Manager H Credit Suisse HY USD
Information Ratio
Info
rmat
ion R
atio
(arith
)
3 years 5 years 10 years-3.0
-2.5
-2.0
-1.5
-1.0
-0.5
0.00.5
Manager A Manager B Manager CManager D Manager E Manager FManager G Manager H Credit Suisse HY USD
3 years 5 years 10 years
Manager A
Manager B
Manager C
Manager D
Manager E
Manager F
Manager G
Manager H
Credit Suisse HY USD
1.83
1.71
1.88
1.69
1.74
1.83
1.72
1.91
2.06
0.57
0.66
0.54
0.68
0.58
0.60
0.69
0.58
0.81
0.20
0.20
0.29
0.23
0.25
0.20
0.45
3 years 5 years 10 years
Manager A
Manager B
Manager C
Manager D
Manager E
Manager F
Manager G
Manager H
Credit Suisse HY USD
-1.96
-0.76
-2.56
-1.05
0.20
-0.89
-1.69
-0.84
-1.22
-0.76
-1.30
-0.84
-0.52
-0.76
-0.67
-1.17
-1.43
-1.19
-0.89
-0.57
-0.80
-1.10
1 Year Rolling Sharpe Ratio
Shar
pe
Rat
io
06 09 12
2004
03 06 09 12
2005
03 06 09 12
2006
03 06 09 12
2007
03 06 09 12
2008
03 06 09 12
2009
03 06 09 12
2010
03 06 09 12
2011
03 06 09 12
2012
03-2.0
0.0
2.0
4.0
6.0
Manager A Manager B Manager CManager D Manager E Manager FManager G Manager H Credit Suisse HY USD
1 Year Rolling Information RatioIn
form
atio
n R
atio
(arith
)
06 09 12
2004
03 06 09 12
2005
03 06 09 12
2006
03 06 09 12
2007
03 06 09 12
2008
03 06 09 12
2009
03 06 09 12
2010
03 06 09 12
2011
03 06 09 12
2012
03-10.0
-5.0
0.0
5.0
Manager A Manager B Manager CManager D Manager E Manager FManager G Manager H MSCI World NR USD
Source: Morningstar Direct
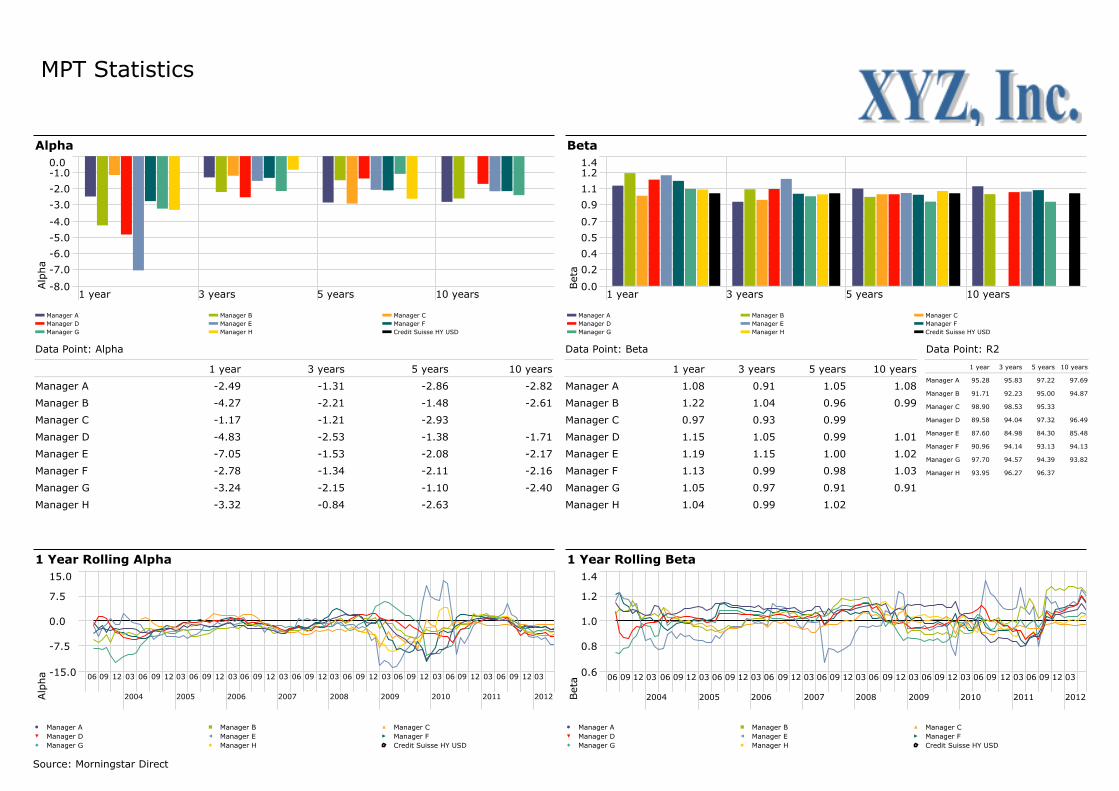
MPT Statistics
Alpha
Alp
ha
1 year 3 years 5 years 10 years-8.0
-7.0
-6.0
-5.0
-4.0
-3.0
-2.0
-1.00.0
Manager A Manager B Manager CManager D Manager E Manager FManager G Manager H Credit Suisse HY USD
Beta
Bet
a
1 year 3 years 5 years 10 years0.0
0.2
0.4
0.5
0.7
0.9
1.1
1.21.4
Manager A Manager B Manager CManager D Manager E Manager FManager G Manager H Credit Suisse HY USD
Data Point: Alpha
1 year 3 years 5 years 10 years
Manager A
Manager B
Manager C
Manager D
Manager E
Manager F
Manager G
Manager H
-2.49
-4.27
-1.17
-4.83
-7.05
-2.78
-3.24
-3.32
-1.31
-2.21
-1.21
-2.53
-1.53
-1.34
-2.15
-0.84
-2.86
-1.48
-2.93
-1.38
-2.08
-2.11
-1.10
-2.63
-2.82
-2.61
-1.71
-2.17
-2.16
-2.40
Data Point: Beta
1 year 3 years 5 years 10 years
Manager A
Manager B
Manager C
Manager D
Manager E
Manager F
Manager G
Manager H
1.08
1.22
0.97
1.15
1.19
1.13
1.05
1.04
0.91
1.04
0.93
1.05
1.15
0.99
0.97
0.99
1.05
0.96
0.99
0.99
1.00
0.98
0.91
1.02
1.08
0.99
1.01
1.02
1.03
0.91
Data Point: R2
1 year 3 years 5 years 10 years
Manager A
Manager B
Manager C
Manager D
Manager E
Manager F
Manager G
Manager H
95.28
91.71
98.90
89.58
87.60
90.96
97.70
93.95
95.83
92.23
98.53
94.04
84.98
94.14
94.57
96.27
97.22
95.00
95.33
97.32
84.30
93.13
94.39
96.37
97.69
94.87
96.49
85.48
94.13
93.82
1 Year Rolling Alpha
Alp
ha 06 09 12
2004
03 06 09 12
2005
03 06 09 12
2006
03 06 09 12
2007
03 06 09 12
2008
03 06 09 12
2009
03 06 09 12
2010
03 06 09 12
2011
03 06 09 12
2012
03-15.0
-7.5
0.0
7.5
15.0
Manager A Manager B Manager CManager D Manager E Manager FManager G Manager H Credit Suisse HY USD
1 Year Rolling BetaBet
a 06 09 12
2004
03 06 09 12
2005
03 06 09 12
2006
03 06 09 12
2007
03 06 09 12
2008
03 06 09 12
2009
03 06 09 12
2010
03 06 09 12
2011
03 06 09 12
2012
030.6
0.8
1.0
1.2
1.4
Manager A Manager B Manager CManager D Manager E Manager FManager G Manager H Credit Suisse HY USD
Source: Morningstar Direct
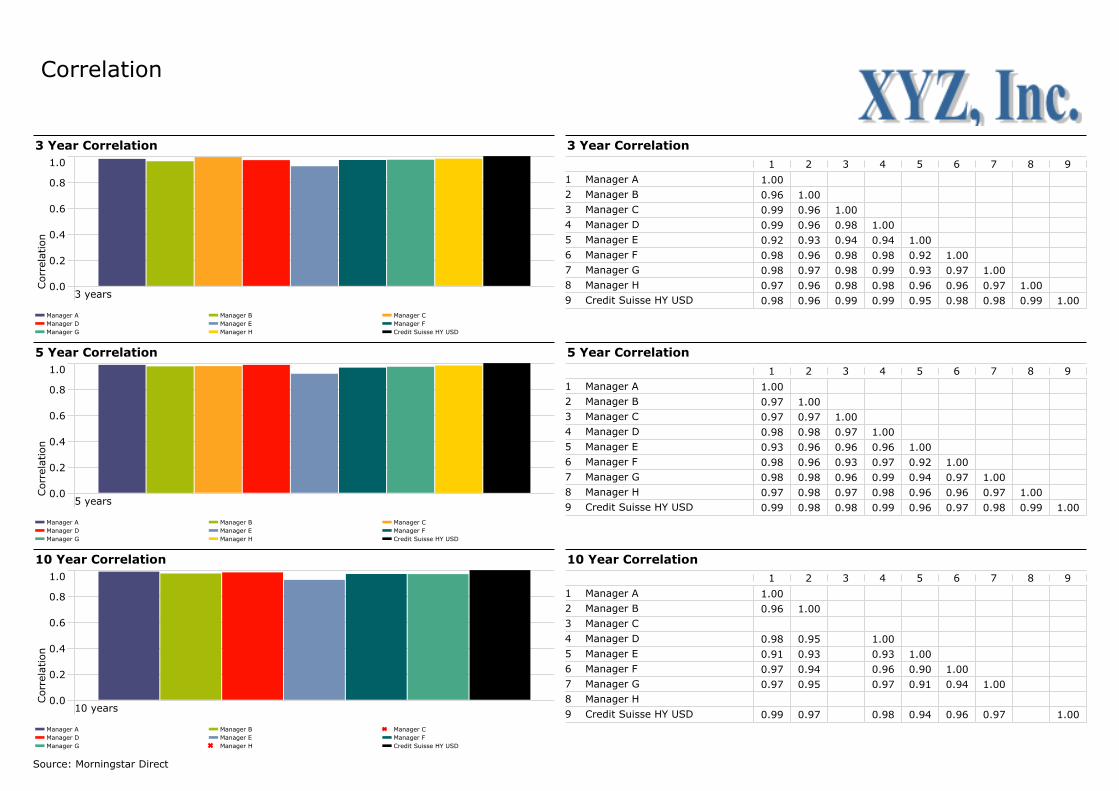
Correlation
3 Year Correlation
Corr
elat
ion
3 years0.0
0.2
0.4
0.6
0.8
1.0
Manager A Manager B Manager CManager D Manager E Manager FManager G Manager H Credit Suisse HY USD
5 Year Correlation
Corr
elat
ion
5 years0.0
0.2
0.4
0.6
0.8
1.0
Manager A Manager B Manager CManager D Manager E Manager FManager G Manager H Credit Suisse HY USD
10 Year Correlation
Corr
elat
ion
10 years0.0
0.2
0.4
0.6
0.8
1.0
Manager A Manager B Manager CManager D Manager E Manager FManager G Manager H Credit Suisse HY USD
3 Year Correlation
1 2 3 4 5 6 7 8 9
1.00
0.96 1.00
0.99 0.96 1.00
0.99 0.96 0.98 1.00
0.92 0.93 0.94 0.94 1.00
0.98 0.96 0.98 0.98 0.92 1.00
0.98 0.97 0.98 0.99 0.93 0.97 1.00
0.97 0.96 0.98 0.98 0.96 0.96 0.97 1.00
0.98 0.96 0.99 0.99 0.95 0.98 0.98 0.99 1.00
1 Manager A
2 Manager B
3 Manager C
4 Manager D
5 Manager E
6 Manager F
7 Manager G
8 Manager H
9 Credit Suisse HY USD
5 Year Correlation
1 2 3 4 5 6 7 8 9
1.00
0.97 1.00
0.97 0.97 1.00
0.98 0.98 0.97 1.00
0.93 0.96 0.96 0.96 1.00
0.98 0.96 0.93 0.97 0.92 1.00
0.98 0.98 0.96 0.99 0.94 0.97 1.00
0.97 0.98 0.97 0.98 0.96 0.96 0.97 1.00
0.99 0.98 0.98 0.99 0.96 0.97 0.98 0.99 1.00
1 Manager A
2 Manager B
3 Manager C
4 Manager D
5 Manager E
6 Manager F
7 Manager G
8 Manager H
9 Credit Suisse HY USD
10 Year Correlation
1 2 3 4 5 6 7 8 9
1.00
0.96 1.00
0.98 0.95 1.00
0.91 0.93 0.93 1.00
0.97 0.94 0.96 0.90 1.00
0.97 0.95 0.97 0.91 0.94 1.00
0.99 0.97 0.98 0.94 0.96 0.97 1.00
1 Manager A
2 Manager B
3 Manager C
4 Manager D
5 Manager E
6 Manager F
7 Manager G
8 Manager H
9 Credit Suisse HY USD
Source: Morningstar Direct
Glossary
Alpha: The intercept value derived from the CAPM regression, or the difference between a Manager's performance and the Manager'sexpected performance given its market sensitivity or Beta. Alpha is used as a measure of value added by a Manager.
Beta: A Manager's sensitivity to market movements and is used to evaluate market related, or systematic risk. Beta is a measure of the linearrelationship, over time, of the Manager's returns and those of the Benchmark. Beta is computed by regressing the Manager's excess returnsover the risk free rate (cash proxy) against the excess returns of the Benchmark over the risk free rate.
Capture Ratio: Calculates the portion of market (Benchmark) performance that was captured by the Manager under certain conditions. Thecapture ratio is equal to the ratio of the average annual return of the manager for a given period to the average benchmark return over the sameperiod.
Correlation: A standardized measure of Covariance. Correlation is scaled to a range between -1 (series move in opposite directions) to +1(series move in the same direction) and is calculated by dividing the Covariance between the series by the respective standard deviations ofeach.
Information Ratio: A risk/return, or efficiency measure; it is a way to estimate the value added by an investment manager percorresponding unit of risk. It is the ratio of Annualized Return over Annualized Standard Deviation.
Maximum Drawdown Period: The worst period of "peak to valley" performance for the series, regardless of whether or not thedrawdown consisted of consecutive months of negative performance, or where the Max Period falls within the range of data.
R-Squared: Measure of the MPT regression measures the percentage variability in the Manager's returns that can be explained by theBenchmark's returns.
Semi-Standard Deviation: A measure of risk using only the variance of returns below a target rate. Stylus calculates Semi-Standarddeviation below a target of zero by default, but can accommodate other targets such as MAR, the Risk Free rate, or the Benchmark.
Sharpe Ratio: A risk/return measure which indicates the Manager's excess return per unit of total risk as measured by Standard Deviation.It is the ratio of the Manager's returns in excess of the risk free rate to the Standard Deviation of the manager's returns in excess of the risk freerate.
Standard Deviation: A measure of the extent to which observations in a series vary from the arithmetic mean of the series. The StandardDeviation of a Manager, Benchmark or Index series measures the volatility, or risk of the asset. The more volatile the investment returns, thehigher the standard deviation will be.
Source: Morningstar Direct
Disclosure
Funds shown are sub-funds of Franklin Templeton Investment Funds (FTIF). "FTIF" is an investment company with variable capital incorporatedin Luxembourg. Sales of shares of FTIF will be made on the basis of its current prospectus only, accompanied by a copy of the latest availableaudited annual report and, if subsequently published, the latest unaudited semi-annual report. This material does not and will not constitute anoffer of shares of FTIF. An investment in FTIF entails risks, which are described in its prospectus. Investors may not get back the full amountinvested and the net asset value of FTIF will fluctuate with market conditions. Exchange rate fluctuations, fund charges, taxes and anyasset-based fee charged by third parties to clients who invest in FTIF through a fee-based account will affect the return to the investor. Pastperformance is no guarantee of future performance. Please ensure your client reads the Prospectus before deciding to invest.
Any research and analysis contained in this guide has been procured by Franklin Templeton Investments for its own purposes and is providedonly incidentally. This research does not constitute or form part of legal, tax or investment advice or an offer for shares or an invitation to applyfor shares of FTIF. Shares of FTIF are not available in all jurisdictions. FTIF shares may not be directly or indirectly offered or sold to U.S.Persons and may not be offered or sold in any jurisdiction where such offering or sale is prohibited. FTIF has been authorized for public sale incertain jurisdictions and private placement exemptions may be available in others. Please contact Franklin Templeton if you are unsure of theavailability of FTIF in your client's jurisdiction. For the definition of U.S. Person, see the current FTIF prospectus.
Performance figures are not based on audited financial statements and assume reinvestment of interest and dividends. When comparing theperformance of FTIF with a benchmark index, it is important to note that the securities in which FTIF invests may be substantially different thanthose represented by the benchmark index. Furthermore, an investment in FTIF represents an investment in a managed investment company inwhich certain charges and expenses, including management fees, are applicable. These charges and expenses are not applicable to indices.
Indices are unmanaged and are not available for direct investment. Certain data and other information shown have been supplied by outsidesources. While we consider that information to be reliable, we give no assurance that such data and information is accurate or complete. A copyof the FTIF prospectus and/or the latest financial reports can be obtained from Franklin Templeton International Services S.A. – Professional ofthe Financial Sector under the supervision of the Commission de Surveillance du Secteur Financier - 26 boulevard Royal L-2449 Luxembourg –Tel: (+352) 46 66 67 212 – Fax: (+352) 46 66 76.
In the U.S., this publication is made available to you for informational purposes only by Templeton/Franklin Investment Services, Inc. 100Fountain Parkway, St. Petersburg, Florida 33716. Tel: (800) 239-3894 (USA Toll-Free), (877) 389-0076 (Canada Toll-Free), and Fax: (727)299-8736. Investments are not FDIC insured; may lose value; and are not bank guaranteed.
Distribution outside the U.S. may be made by Templeton Global Advisors Limited or other sub-distributors, intermediaries, dealers orprofessional investors that have been engaged by Templeton Global Advisors Limited to distribute shares of the Fund in certain jurisdictions.This is not an offer to sell or a solicitation of an offer to purchase securities in any jurisdiction where it would be illegal to do so.
FOR BROKER DEALER USE ONLY – NOT FOR PUBLIC DISTRIBUTION.www.templetonoffshore.com
Source: Morningstar Direct

Presentacion Chile
ABC disclaimer
Source: Morningstar Direct

Analisis Competitivo
Snapshot
MorningstarCategory
MorningstarRatingOverall
InceptionDate
BroadCategory
Group
Manager A
Manager B
Manager C
Manager D
Chile OE Chile Equity ÙÙÙÙ 1/30/1995 Equity
Chile OE Chile Equity ÙÙÙÙ 5/24/2006 Equity
Chile OE Chile Equity ÙÙÙÙ 1/4/2002 Equity
Chile OE Chile Equity ÙÙÙÙ 11/18/1996 Equity
Operations
InceptionDate
Fund SizeManagement
Fee
MaxFrontLoad
AnnualReport
NetExpense
Ratio
BaseCurrency
RedemptionFee
Manager A
Manager B
Manager C
Manager D
5/24/2006
1/30/1995
78,443,997.00
172,016,759.00
1.75
1.89
0.00
0.00
1.00
1.99
Chilean Peso
Chilean Peso
0.00
0.00
11/18/1996 83,747,526.00
1/4/2002
4.17
94,740,892.00
0.00
4.05
4.40
0.00
Chilean Peso
4.35
0.00
Chilean Peso 0.00
Source: Morningstar Direct
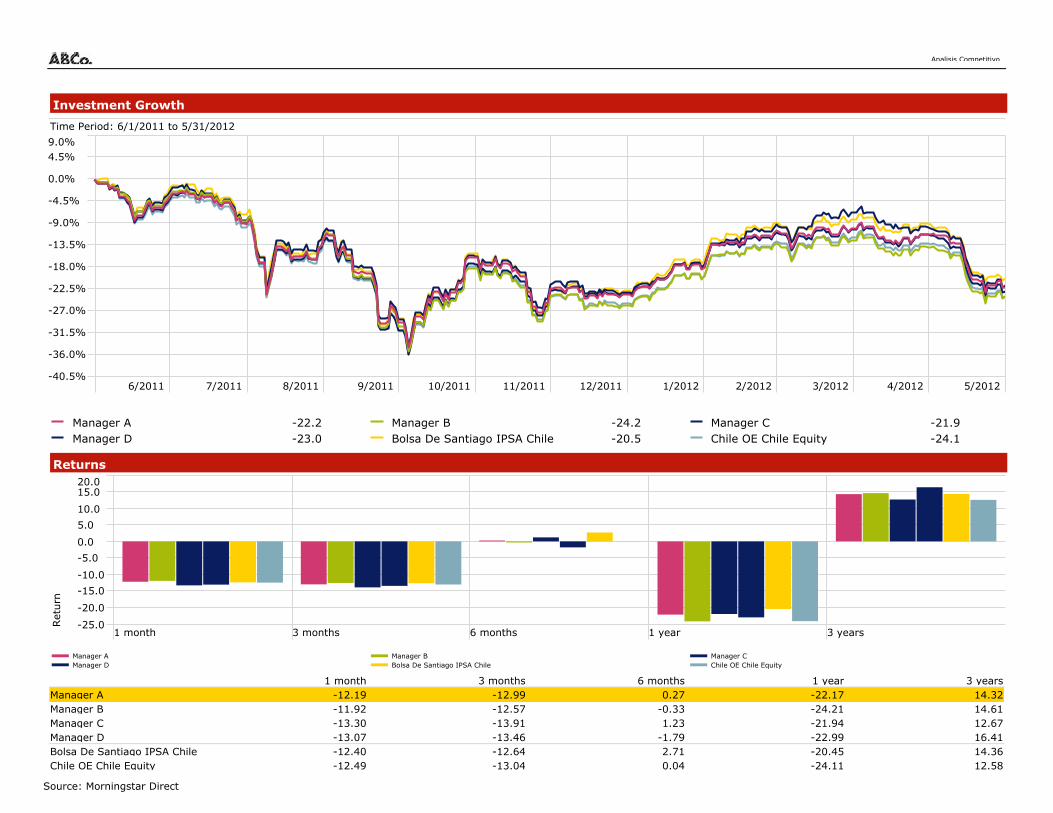
Analisis Competitivo
Investment Growth
Time Period: 6/1/2011 to 5/31/2012
6/2011 7/2011 8/2011 9/2011 10/2011 11/2011 12/2011 1/2012 2/2012 3/2012 4/2012 5/2012-40.5%
-36.0%
-31.5%
-27.0%
-22.5%
-18.0%
-13.5%
-9.0%
-4.5%
0.0%
4.5%9.0%
Manager A -22.2 Manager B -24.2 Manager C -21.9Manager D -23.0 Bolsa De Santiago IPSA Chile -20.5 Chile OE Chile Equity -24.1
Returns
Ret
urn
1 month 3 months 6 months 1 year 3 years-25.0
-20.0
-15.0
-10.0
-5.0
0.0
5.0
10.0
15.020.0
Manager A Manager B Manager CManager D Bolsa De Santiago IPSA Chile Chile OE Chile Equity
1 month 3 months 6 months 1 year 3 yearsManager AManager BManager CManager DBolsa De Santiago IPSA ChileChile OE Chile Equity
-12.19-11.92-13.30-13.07-12.40
-12.99-12.57-13.91-13.46-12.64
0.27-0.331.23
-1.792.71
-22.17-24.21-21.94-22.99-20.45
14.3214.6112.6716.4114.36
-12.49 -13.04 0.04 -24.11 12.58
Source: Morningstar Direct
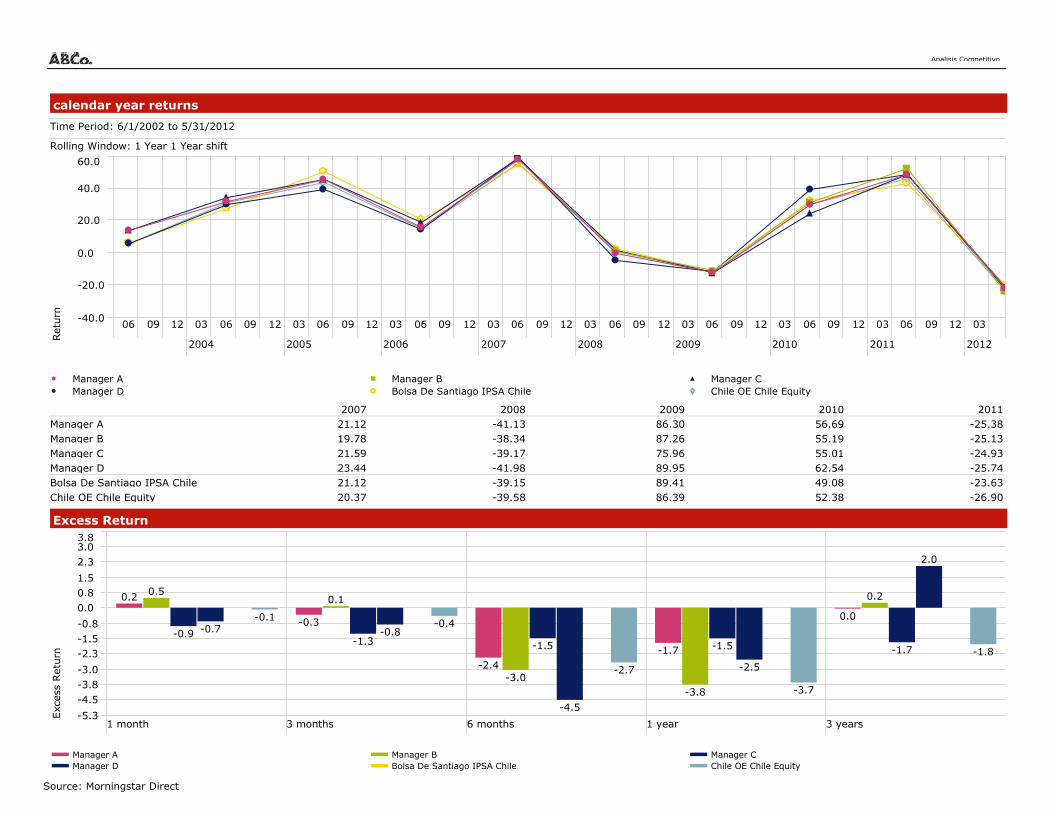
Analisis Competitivo
Excess Return
Exc
ess
Ret
urn
1 month 3 months 6 months 1 year 3 years-5.3
-4.5-3.8-3.0
-2.3-1.5-0.8
0.00.81.5
2.33.03.8
0.2
-0.3
-2.4-1.7
0.0
0.50.1
-3.0-3.8
0.2
-0.9-1.3 -1.5 -1.5 -1.7
-0.7 -0.8
-4.5
-2.5
2.0
-0.1-0.4
-2.7
-3.7
-1.8
Manager A Manager B Manager CManager D Bolsa De Santiago IPSA Chile Chile OE Chile Equity
2007 2008 2009 2010 2011Manager AManager BManager CManager DBolsa De Santiago IPSA ChileChile OE Chile Equity
21.1219.7821.5923.4421.12
-41.13-38.34-39.17-41.98-39.15
86.3087.2675.9689.9589.41
56.6955.1955.0162.5449.08
-25.38-25.13-24.93-25.74-23.63
20.37 -39.58 86.39 52.38 -26.90
calendar year returns
Time Period: 6/1/2002 to 5/31/2012
Rolling Window: 1 Year 1 Year shift
Ret
urn
06 09 12
2004
03 06 09 12
2005
03 06 09 12
2006
03 06 09 12
2007
03 06 09 12
2008
03 06 09 12
2009
03 06 09 12
2010
03 06 09 12
2011
03 06 09 12
2012
03-40.0
-20.0
0.0
20.0
40.0
60.0
Manager A Manager B Manager CManager D Bolsa De Santiago IPSA Chile Chile OE Chile Equity
Source: Morningstar Direct

Analisis Competitivo
Risk
Time Period: 6/1/2009 to 5/31/2012
Return Std DevDownsideDeviation
Alpha Beta R2Sharpe
Ratio(arith)
TrackingError
Manager AManager BManager CManager DBolsa De Santiago IPSA ChileChile OE Chile Equity
14.3214.6112.6716.4114.36
25.0224.7125.5625.1525.06
1.972.473.263.010.00
0.090.54
-1.472.100.00
0.990.981.010.981.00
98.63
12.58 24.93
98.0597.3095.96
100.00
0.570.590.490.650.57
2.933.504.205.080.00
2.62 -1.38 0.99 98.26 0.50 3.31
Risk-Reward
Time Period: 6/1/2009 to 5/31/2012
Ret
urn
Std Dev
0.0 10.0 20.0 30.0 40.0
0.0
4.0
8.0
12.0
16.0
20.0
24.0
Manager A Manager B Manager C
Manager D Bolsa De Santiago IPSA Chile Chile OE Chile Equity
Drawdown
Time Period: 6/1/2009 to 5/31/2012
8/2009 11/2009 2/2010 5/2010 8/2010 11/2010 2/2011 5/2011 8/2011 11/2011 2/2012 5/2012-35.0
-30.0
-25.0
-20.0
-15.0
-10.0
-5.0
0.0
Manager A Manager B Manager CManager D Bolsa De Santiago IPSA Chile Chile OE Chile Equity
Market Performance
Time Period: 6/1/2009 to 5/31/2012
UpPeriod
Percent
DownPeriod
Percent
BestMonth
WorstMonth
BestQuarter
WorstQuarter
UpCapture
Ratio
DownCapture
RatioR2
Manager A
Manager B
Manager C
Manager D
Bolsa De Santiago IPSA Chile
Chile OE Chile Equity 61.11 38.89 18.92 -20.48 34.58 -27.71
63.89
63.89
61.11
66.67
58.33
36.11
36.11
38.89
33.33
41.67
19.06
17.06
19.84
18.39
18.90
-19.76
-20.57
-21.07
-20.10
-19.65
36.27
37.18
36.29
37.21
33.77
-26.85
-27.87
-28.19
-26.97
-27.42
99.82
99.12
98.91
101.43
100.00
99.89
97.94
104.05
95.38
100.00
98.63
98.05
97.30
95.96
100.00
96.96 101.55 98.26
Source: Morningstar Direct

Analisis Competitivo
Correlation Matrix
Time Period: 6/1/2009 to 5/31/2012
1 2 3 4 5 6
1.00
1.00 1.00
0.99 0.99 1.00
0.99 0.98 0.98 1.00
0.99 0.99 0.99 0.98 1.00
1.00 0.99 0.99 0.99 0.99 1.00
1 Manager A
2 Manager B
3 Manager C
4 Manager D
5 Bolsa De Santiago IPSA Chile
6 Chile OE Chile Equity
Manager B - Asset Allocation
Portfolio Date: 5/31/2012
%
Stock 98.7
Bond 0.0
Cash 1.3
Other 0.0
Total 100.0
Manager A - Asset Allocation
Portfolio Date: 5/31/2012
%
Stock 95.9
Bond 2.0
Cash 2.1
Other 0.0
Total 100.0
Manager C - Asset Allocation
Portfolio Date: 5/31/2012
%
Stock 100.0
Bond 0.0
Cash 0.0
Other 0.0
Total 100.0
Manager D - Asset Allocation
Portfolio Date: 5/31/2012
%
Stock 100.0
Bond 0.0
Cash 0.0
Other 0.0
Total 100.0
Source: Morningstar Direct
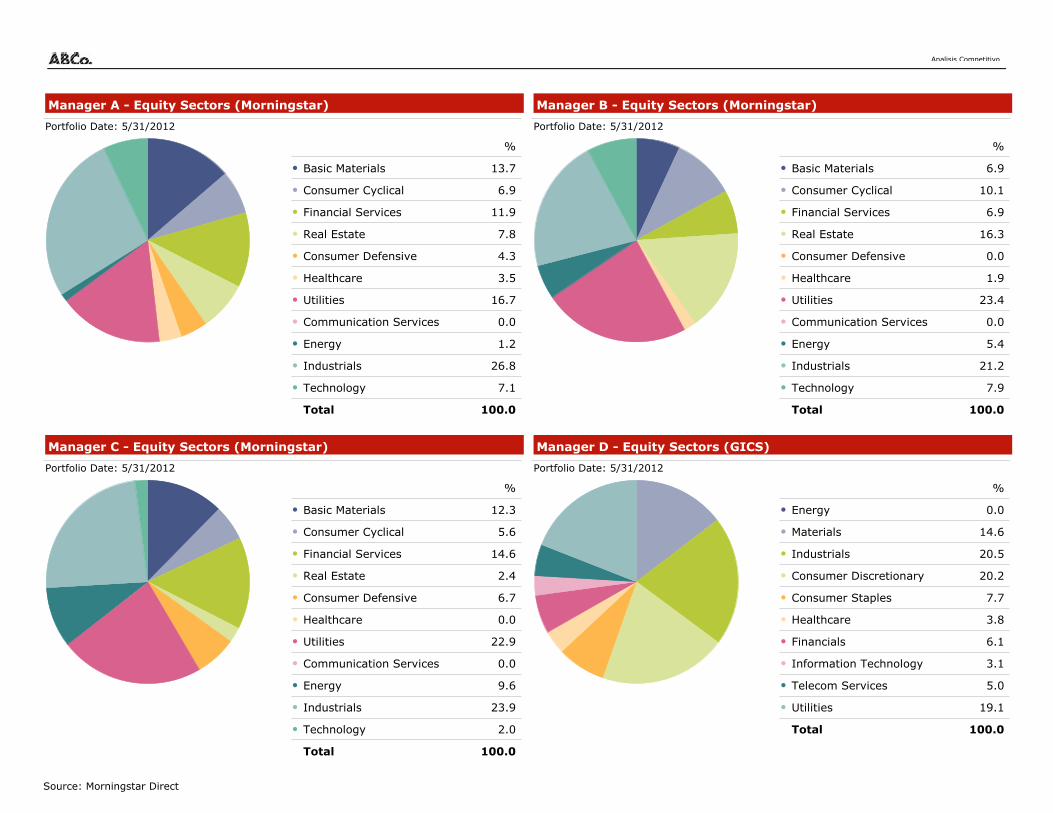
Analisis Competitivo
Manager A - Equity Sectors (Morningstar)
Portfolio Date: 5/31/2012
%
Basic Materials 13.7
Consumer Cyclical 6.9
Financial Services 11.9
Real Estate 7.8
Consumer Defensive 4.3
Healthcare 3.5
Utilities 16.7
Communication Services 0.0
Energy 1.2
Industrials 26.8
Technology 7.1
Total 100.0
Manager B - Equity Sectors (Morningstar)
Portfolio Date: 5/31/2012
%
Basic Materials 6.9
Consumer Cyclical 10.1
Financial Services 6.9
Real Estate 16.3
Consumer Defensive 0.0
Healthcare 1.9
Utilities 23.4
Communication Services 0.0
Energy 5.4
Industrials 21.2
Technology 7.9
Total 100.0
Manager C - Equity Sectors (Morningstar)
Portfolio Date: 5/31/2012
%
Basic Materials 12.3
Consumer Cyclical 5.6
Financial Services 14.6
Real Estate 2.4
Consumer Defensive 6.7
Healthcare 0.0
Utilities 22.9
Communication Services 0.0
Energy 9.6
Industrials 23.9
Technology 2.0
Total 100.0
Manager D - Equity Sectors (GICS)
Portfolio Date: 5/31/2012
%
Energy 0.0
Materials 14.6
Industrials 20.5
Consumer Discretionary 20.2
Consumer Staples 7.7
Healthcare 3.8
Financials 6.1
Information Technology 3.1
Telecom Services 5.0
Utilities 19.1
Total 100.0
Source: Morningstar Direct
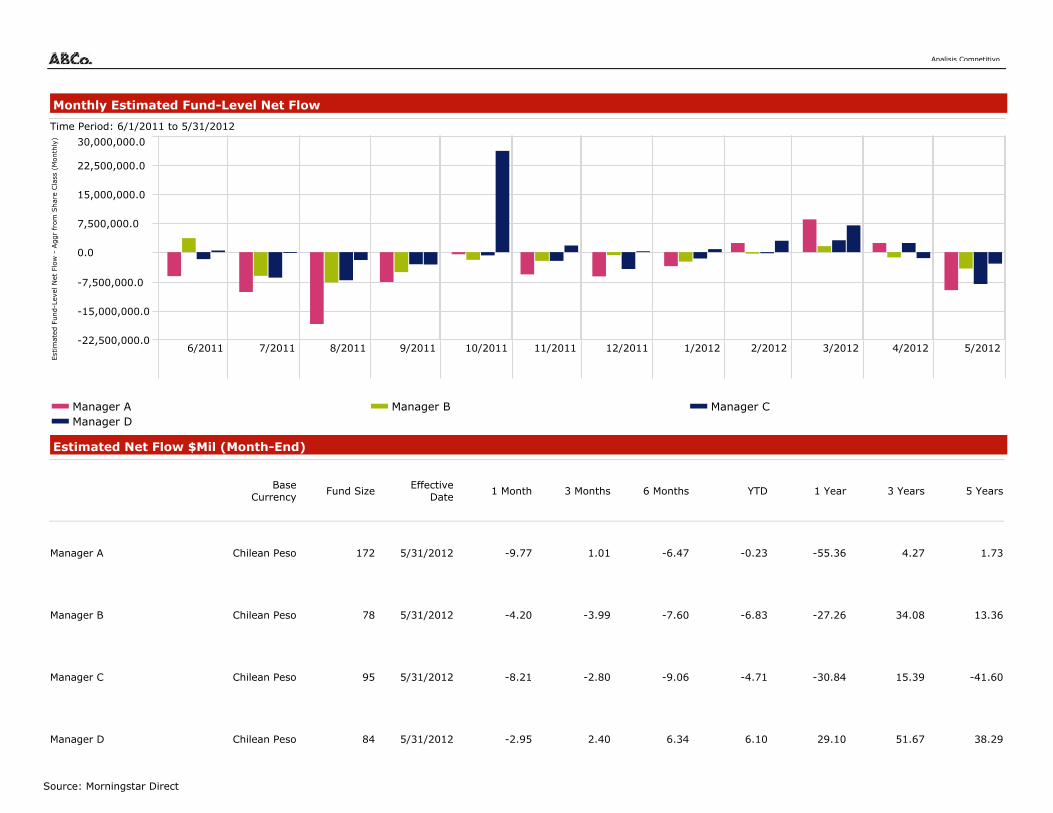
Analisis Competitivo
Monthly Estimated Fund-Level Net Flow
Time Period: 6/1/2011 to 5/31/2012
Est
imat
ed F
und-L
evel
Net
Flo
w -
Aggr
from
Shar
e Cla
ss (
Month
ly)
6/2011 7/2011 8/2011 9/2011 10/2011 11/2011 12/2011 1/2012 2/2012 3/2012 4/2012 5/2012-22,500,000.0
-15,000,000.0
-7,500,000.0
0.0
7,500,000.0
15,000,000.0
22,500,000.0
30,000,000.0
Manager A Manager B Manager CManager D
Estimated Net Flow $Mil (Month-End)
BaseCurrency
Fund SizeEffective
Date1 Month 3 Months 6 Months YTD 1 Year 3 Years 5 Years
Manager A
Manager B
Manager C
Manager D
Chilean Peso 172 5/31/2012 -9.77 1.01 -6.47 -0.23 -55.36 4.27 1.73
Chilean Peso 84 5/31/2012 -2.95 2.40 6.34 6.10 29.10 51.67 38.29
Chilean Peso 78 5/31/2012 -4.20 -3.99 -7.60 -6.83 -27.26 34.08 13.36
Chilean Peso 95 5/31/2012 -8.21 -2.80 -9.06 -4.71 -30.84 15.39 -41.60
Source: Morningstar Direct

For sophisticated investors only
XYZ International Selection Funds*
*XYZ International Selection Funds will be referred to as XYZ Throughout the presentation.
Source: Morningstar Direct
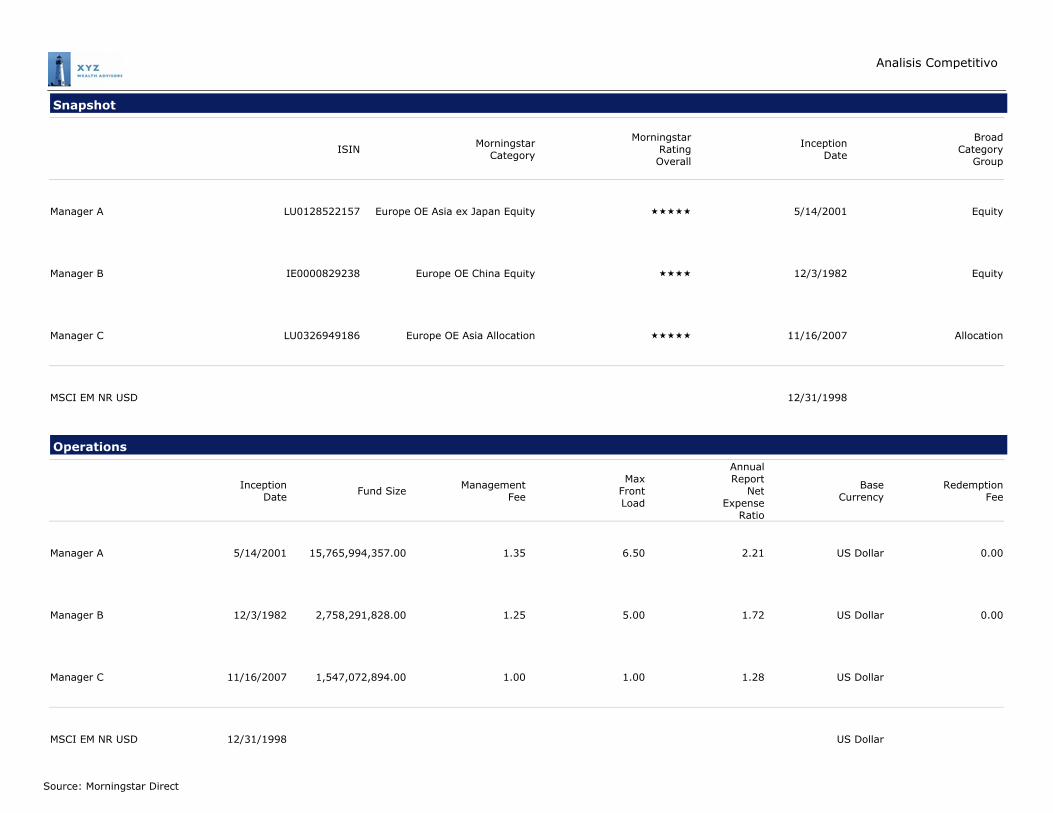
Analisis Competitivo
Snapshot
ISINMorningstar
Category
MorningstarRatingOverall
InceptionDate
BroadCategory
Group
Manager A
Manager B
Manager C
MSCI EM NR USD
LU0128522157 Europe OE Asia ex Japan Equity ÙÙÙÙÙ 5/14/2001 Equity
IE0000829238 Europe OE China Equity ÙÙÙÙ 12/3/1982 Equity
LU0326949186 Europe OE Asia Allocation ÙÙÙÙÙ 11/16/2007 Allocation
12/31/1998
Operations
InceptionDate
Fund SizeManagement
Fee
MaxFrontLoad
AnnualReport
NetExpense
Ratio
BaseCurrency
RedemptionFee
Manager A
Manager B
Manager C
MSCI EM NR USD
5/14/2001 15,765,994,357.00 1.35 6.50 2.21 US Dollar 0.00
11/16/2007 1,547,072,894.00 1.00 1.00 1.28 US Dollar
12/3/1982 2,758,291,828.00 1.25 5.00 1.72 US Dollar 0.00
12/31/1998 US Dollar
Source: Morningstar Direct

Analisis Competitivo
Investment Growth
Time Period: 11/16/2007 to 5/31/2012
5/2008 11/2008 5/2009 11/2009 5/2010 11/2010 5/2011 11/2011 5/2012-80.0%
-64.0%
-48.0%
-32.0%
-16.0%
0.0%
16.0%
32.0%
48.0%
64.0%
80.0%
Manager A -10.4 Manager B -41.7 Manager C 61.7MSCI EM NR USD -20.3
Returns
Ret
urn
1 month 3 months 6 months 1 year 3 years-25.0
-20.0
-15.0
-10.0
-5.0
0.0
5.0
10.0
15.020.0
Manager A Manager B Manager CMSCI EM NR USD
1 month 3 months 6 months 1 year 3 years
Manager A
Manager B
Manager C
MSCI EM NR USD
-10.57
-9.15
-6.94
-11.21
-13.63
-12.85
-4.39
-15.20
-3.66
-0.26
5.14
-1.14
-17.29
-23.84
-3.86
-20.32
15.54
0.91
18.27
7.91
Source: Morningstar Direct
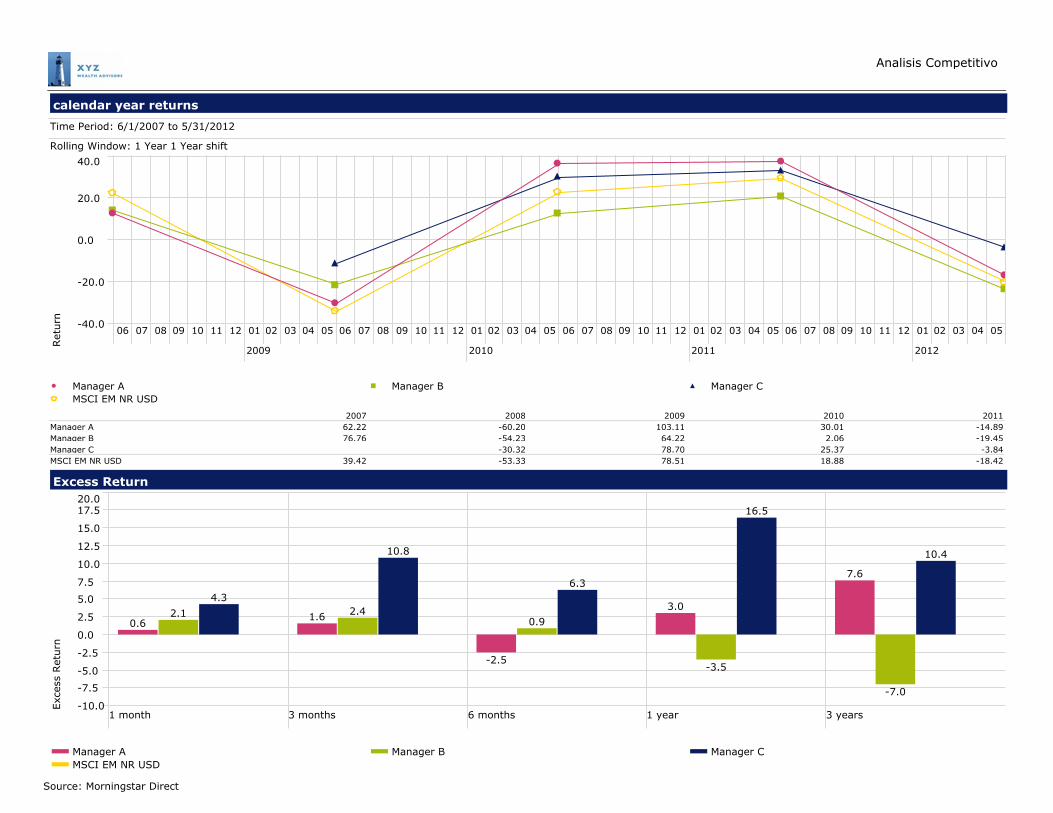
Analisis Competitivo
Excess Return
Exc
ess
Ret
urn
1 month 3 months 6 months 1 year 3 years-10.0
-7.5
-5.0
-2.5
0.0
2.5
5.0
7.5
10.0
12.5
15.0
17.520.0
0.61.6
-2.5
3.0
7.6
2.1 2.40.9
-3.5
-7.0
4.3
10.8
6.3
16.5
10.4
Manager A Manager B Manager CMSCI EM NR USD
2007 2008 2009 2010 2011Manager AManager BManager CMSCI EM NR USD
62.2276.76
39.42
-60.20-54.23-30.32-53.33
103.1164.2278.7078.51
30.012.06
25.3718.88
-14.89-19.45-3.84
-18.42
calendar year returns
Time Period: 6/1/2007 to 5/31/2012
Rolling Window: 1 Year 1 Year shift
Ret
urn
06 07 08 09 10 11 12
2009
01 02 03 04 05 06 07 08 09 10 11 12
2010
01 02 03 04 05 06 07 08 09 10 11 12
2011
01 02 03 04 05 06 07 08 09 10 11 12
2012
01 02 03 04 05-40.0
-20.0
0.0
20.0
40.0
Manager A Manager B Manager CMSCI EM NR USD
Source: Morningstar Direct

Analisis Competitivo
Risk
Time Period: 6/1/2009 to 5/31/2012
Return Std DevDownsideDeviation
Alpha Beta R2Sharpe
Ratio(arith)
TrackingError
Manager A
Manager B
Manager C
MSCI EM NR USD
15.54
0.91
18.27
7.91
23.32
22.91
16.14
22.95
3.02
9.43
5.53
0.00
7.19
-5.45
11.37
0.00
0.98
0.88
0.66
1.00
92.62
76.89
89.27
100.00
0.66
0.04
1.13
0.34
6.35
11.38
9.34
0.00
Risk-Reward
Time Period: 6/1/2009 to 5/31/2012
Ret
urn
Std Dev
0.0 4.0 8.0 12.0 16.0 20.0 24.0 28.0
-1.0
3.0
7.0
11.0
15.0
19.0
23.0
Manager A Manager B Manager C
MSCI EM NR USD
Drawdown
Time Period: 6/1/2009 to 5/31/2012
8/2009 11/2009 2/2010 5/2010 8/2010 11/2010 2/2011 5/2011 8/2011 11/2011 2/2012 5/2012-30.0
-25.0
-20.0
-15.0
-10.0
-5.0
0.0
Manager A Manager B Manager CMSCI EM NR USD
Market Performance
Time Period: 6/1/2009 to 5/31/2012
UpPeriod
Percent
DownPeriod
Percent
BestMonth
WorstMonth
BestQuarter
WorstQuarter
UpCapture
Ratio
DownCapture
RatioR2
Manager A
Manager B
Manager C
MSCI EM NR USD
58.33
50.00
69.44
47.22
41.67
50.00
30.56
52.78
14.25
13.89
9.86
13.25
-14.89
-16.87
-12.30
-14.58
22.85
12.42
17.24
20.91
-20.67
-24.26
-13.54
-22.56
101.83
80.90
78.15
100.00
77.07
101.15
38.73
100.00
92.62
76.89
89.27
100.00
Source: Morningstar Direct

Analisis Competitivo
Correlation Matrix
Time Period: 6/1/2009 to 5/31/2012
1 2 3 4
1.00
0.88 1.00
0.94 0.87 1.00
0.96 0.88 0.94 1.00
1 Manager A
2 Manager B
3 Manager C
4 MSCI EM NR USD
Manager B - Asset Allocation
Portfolio Date: 5/31/2012
%
Stock 93.1
Bond 0.7
Cash 0.0
Other 6.2
Total 100.0
Manager A - Asset Allocation
Portfolio Date: 3/31/2012
%
Stock 94.7
Bond 0.0
Cash 5.3
Other 0.0
Total 100.0
Manager C - Asset Allocation
Portfolio Date: 5/31/2012
%
Stock 85.2
Bond 0.0
Cash 13.8
Other 1.0
Total 100.0
Manager D - Asset Allocation
Portfolio Date: 5/31/2012
%
Stock 97.6
Bond 0.0
Cash 0.0
Other 2.4
Total 100.0
Source: Morningstar Direct
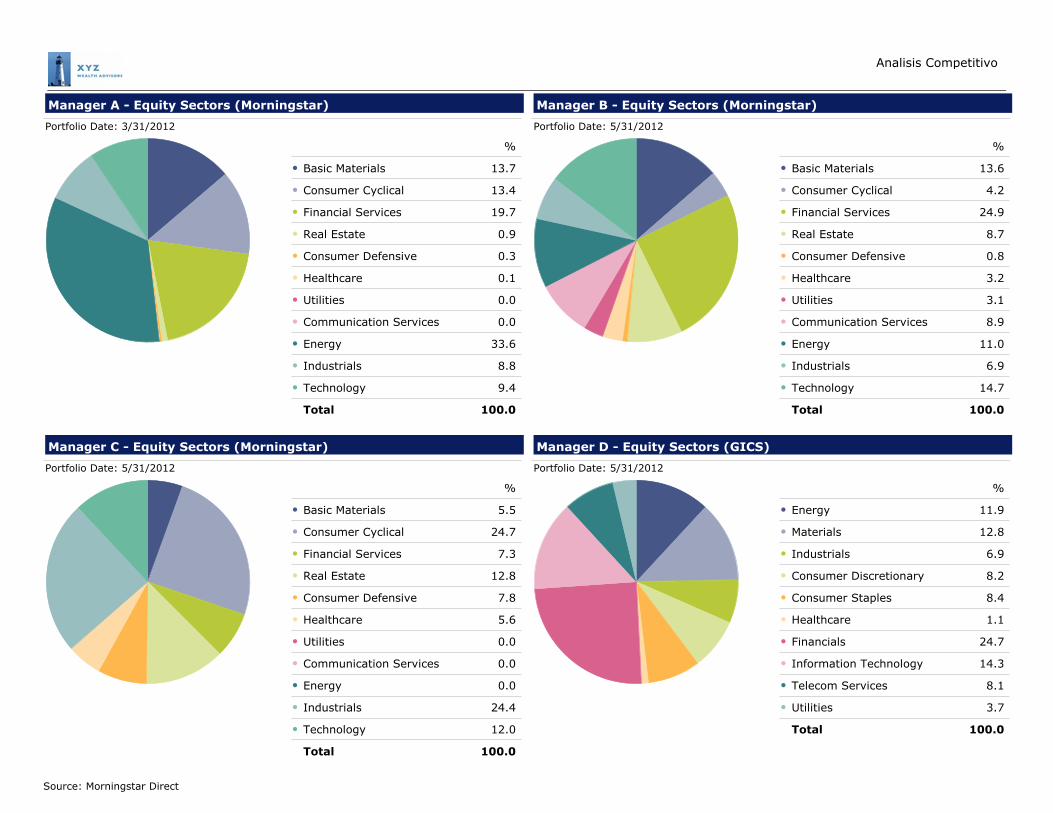
Analisis Competitivo
Manager A - Equity Sectors (Morningstar)
Portfolio Date: 3/31/2012
%
Basic Materials 13.7
Consumer Cyclical 13.4
Financial Services 19.7
Real Estate 0.9
Consumer Defensive 0.3
Healthcare 0.1
Utilities 0.0
Communication Services 0.0
Energy 33.6
Industrials 8.8
Technology 9.4
Total 100.0
Manager B - Equity Sectors (Morningstar)
Portfolio Date: 5/31/2012
%
Basic Materials 13.6
Consumer Cyclical 4.2
Financial Services 24.9
Real Estate 8.7
Consumer Defensive 0.8
Healthcare 3.2
Utilities 3.1
Communication Services 8.9
Energy 11.0
Industrials 6.9
Technology 14.7
Total 100.0
Manager C - Equity Sectors (Morningstar)
Portfolio Date: 5/31/2012
%
Basic Materials 5.5
Consumer Cyclical 24.7
Financial Services 7.3
Real Estate 12.8
Consumer Defensive 7.8
Healthcare 5.6
Utilities 0.0
Communication Services 0.0
Energy 0.0
Industrials 24.4
Technology 12.0
Total 100.0
Manager D - Equity Sectors (GICS)
Portfolio Date: 5/31/2012
%
Energy 11.9
Materials 12.8
Industrials 6.9
Consumer Discretionary 8.2
Consumer Staples 8.4
Healthcare 1.1
Financials 24.7
Information Technology 14.3
Telecom Services 8.1
Utilities 3.7
Total 100.0
Source: Morningstar Direct

Analisis Competitivo
Manager A - Equity Country Exposure
Portfolio Date: 3/31/2012
%
China 29.3
Hong Kong 4.1
India 17.0
Indonesia 12.7
Pakistan 4.4
Singapore 0.7
South Korea 7.6
Taiwan 0.9
Thailand 23.3
Total 100.0
Manager B - Equity Country Exposure
Portfolio Date: 5/31/2012
%
China 93.2
Hong Kong 0.7
Netherlands 3.3
Switzerland 0.0
Taiwan 0.0
Other Countries 2.7
Total 100.0
Manager C - Equity Country Exposure
Portfolio Date: 5/31/2012
%
Australia 8.9
Canada 1.1
China 4.5
France 0.5
Hong Kong 33.1
Indonesia 5.1
Malaysia 5.1
Philippines 3.2
Singapore 11.9
South Korea 4.1
Taiwan 6.0
Thailand 9.4
United Kingdom 1.0
United States 1.7
Other Countries 4.3
Total 100.0
Source: Morningstar Direct
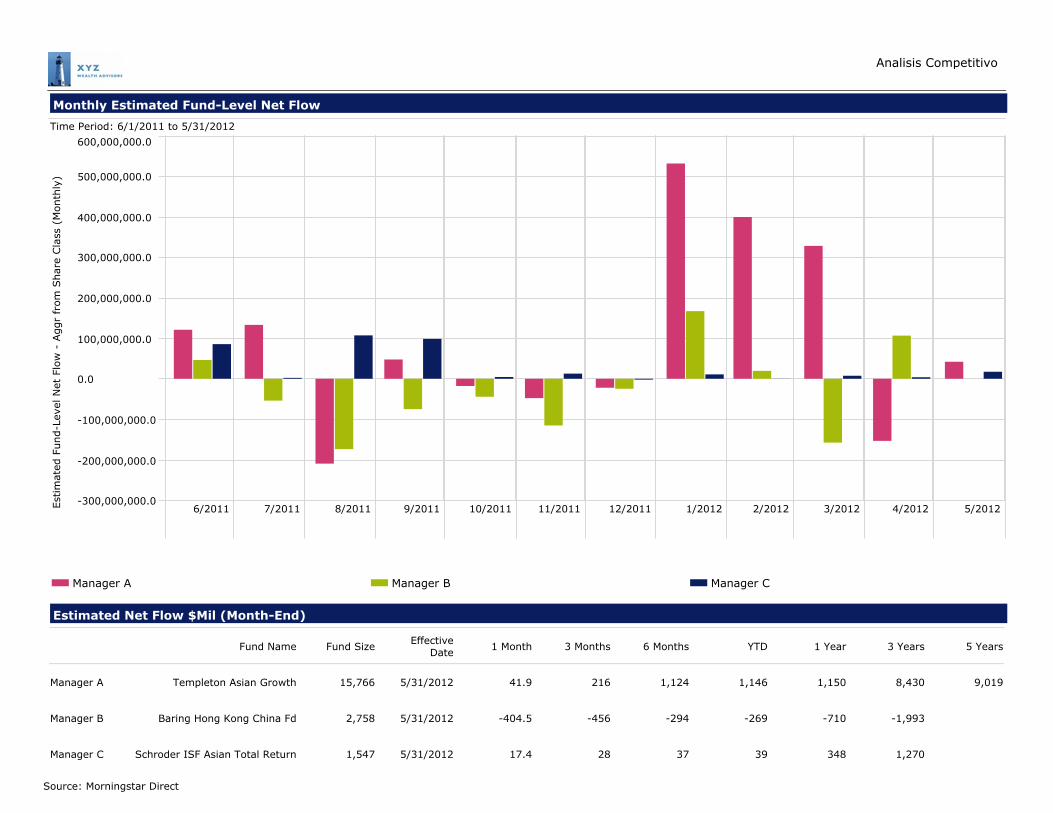
Analisis Competitivo
Monthly Estimated Fund-Level Net Flow
Time Period: 6/1/2011 to 5/31/2012
Est
imat
ed F
und-L
evel
Net
Flo
w -
Aggr
from
Shar
e Cla
ss (
Month
ly)
6/2011 7/2011 8/2011 9/2011 10/2011 11/2011 12/2011 1/2012 2/2012 3/2012 4/2012 5/2012-300,000,000.0
-200,000,000.0
-100,000,000.0
0.0
100,000,000.0
200,000,000.0
300,000,000.0
400,000,000.0
500,000,000.0
600,000,000.0
Manager A Manager B Manager C
Estimated Net Flow $Mil (Month-End)
Fund Name Fund SizeEffective
Date1 Month 3 Months 6 Months YTD 1 Year 3 Years 5 Years
Manager A
Manager B
Manager C
Templeton Asian Growth 15,766 5/31/2012 41.9 216 1,124 1,146 1,150 8,430 9,019
Baring Hong Kong China Fd 2,758
Schroder ISF Asian Total Return
5/31/2012
1,547
-404.5
5/31/2012
-456
17.4 28
-294
37
-269
39
-710
348
-1,993
1,270
Source: Morningstar Direct
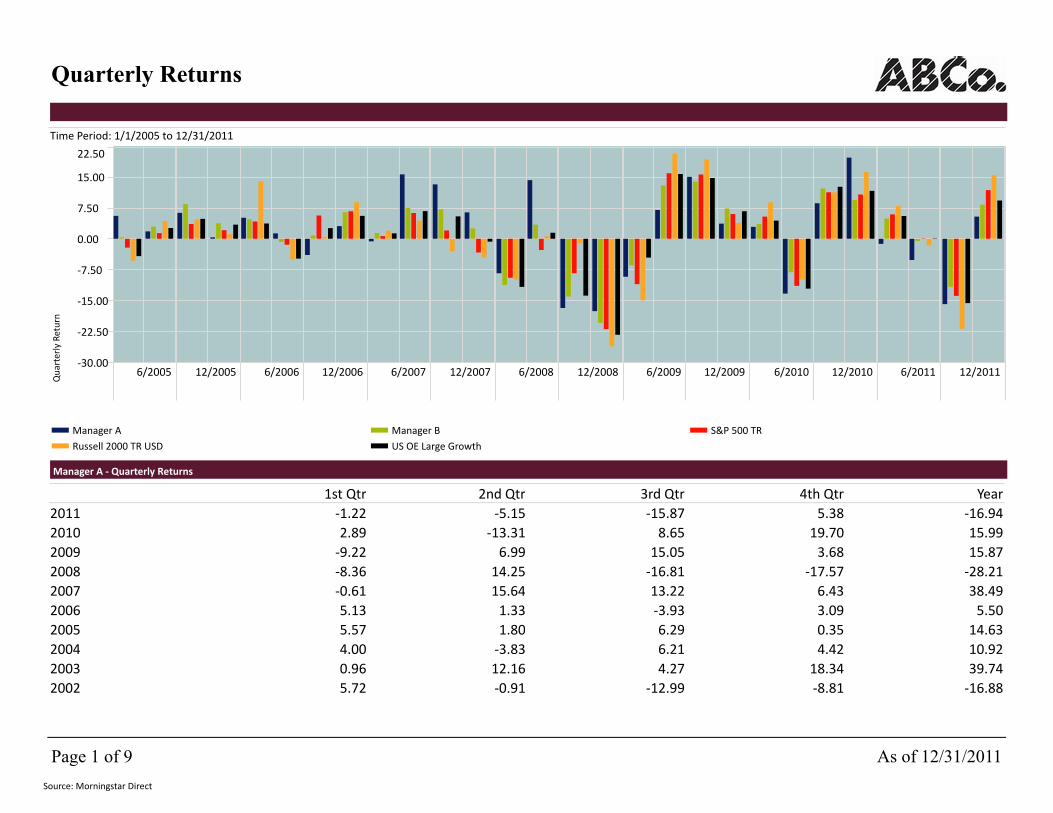
Quarterly Returns
Time Period: 1/1/2005 to 12/31/2011
Qu
art
erl
y R
etu
rn
6/2005 12/2005 6/2006 12/2006 6/2007 12/2007 6/2008 12/2008 6/2009 12/2009 6/2010 12/2010 6/2011 12/201130.00
22.50
15.00
7.50
0.00
7.50
15.00
22.50
Manager A Manager B S&P 500 TR
Russell 2000 TR USD US OE Large Growth
Manager A Quarterly Returns
1st Qtr 2nd Qtr 3rd Qtr 4th Qtr Year
2011
2010
2009
2008
2007
2006
2005
2004
2003
2002
16.94
15.99
15.87
28.21
38.49
5.50
14.63
10.92
39.74
16.88
1.22
2.89
9.22
8.36
0.61
5.13
5.57
4.00
0.96
5.72
5.15
13.31
6.99
14.25
15.64
1.33
1.80
3.83
12.16
0.91
15.87
8.65
15.05
16.81
13.22
3.93
6.29
6.21
4.27
12.99
5.38
19.70
3.68
17.57
6.43
3.09
0.35
4.42
18.34
8.81
Page 1 of 9 As of 12/31/2011
Source: Morningstar Direct
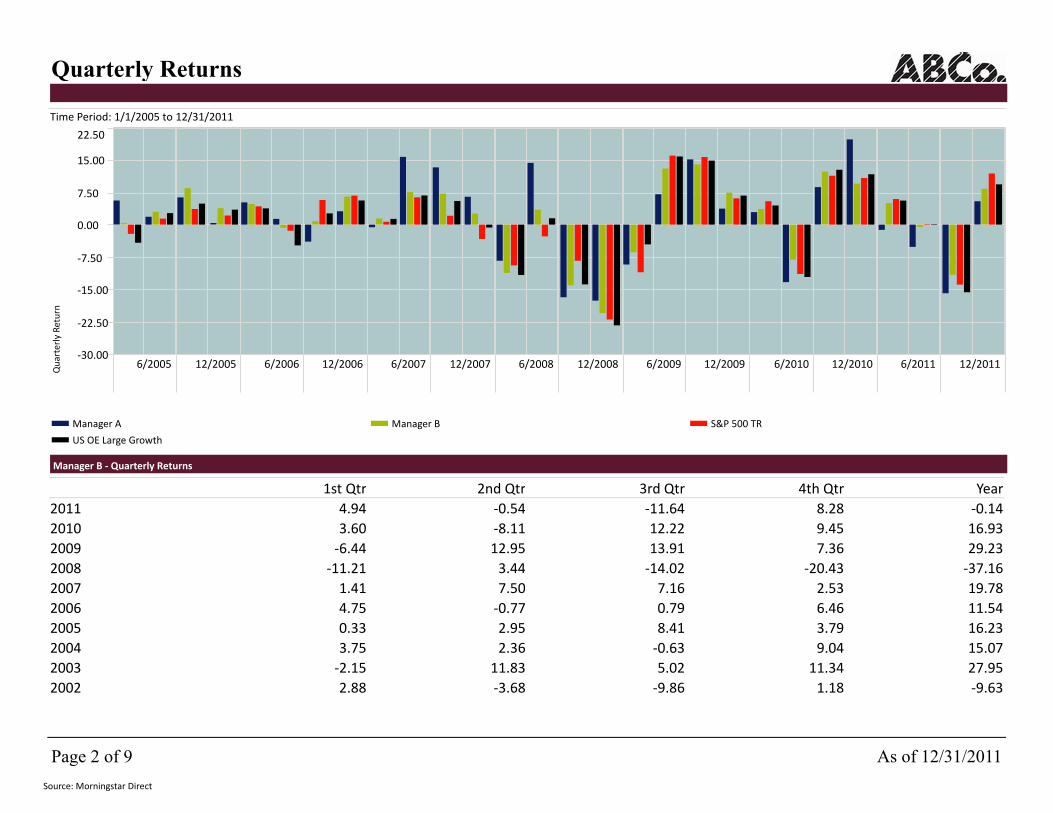
Quarterly Returns
Time Period: 1/1/2005 to 12/31/2011
Qu
art
erl
y R
etu
rn
6/2005 12/2005 6/2006 12/2006 6/2007 12/2007 6/2008 12/2008 6/2009 12/2009 6/2010 12/2010 6/2011 12/201130.00
22.50
15.00
7.50
0.00
7.50
15.00
22.50
Manager A Manager B S&P 500 TR
US OE Large Growth
Manager B Quarterly Returns
1st Qtr 2nd Qtr 3rd Qtr 4th Qtr Year
2011
2010
2009
2008
2007
2006
2005
2004
2003
2002
0.14
16.93
29.23
37.16
19.78
11.54
16.23
15.07
27.95
9.63
4.94
3.60
6.44
11.21
1.41
4.75
0.33
3.75
2.15
2.88
0.54
8.11
12.95
3.44
7.50
0.77
2.95
2.36
11.83
3.68
11.64
12.22
13.91
14.02
7.16
0.79
8.41
0.63
5.02
9.86
8.28
9.45
7.36
20.43
2.53
6.46
3.79
9.04
11.34
1.18
Page 2 of 9 As of 12/31/2011
Source: Morningstar Direct
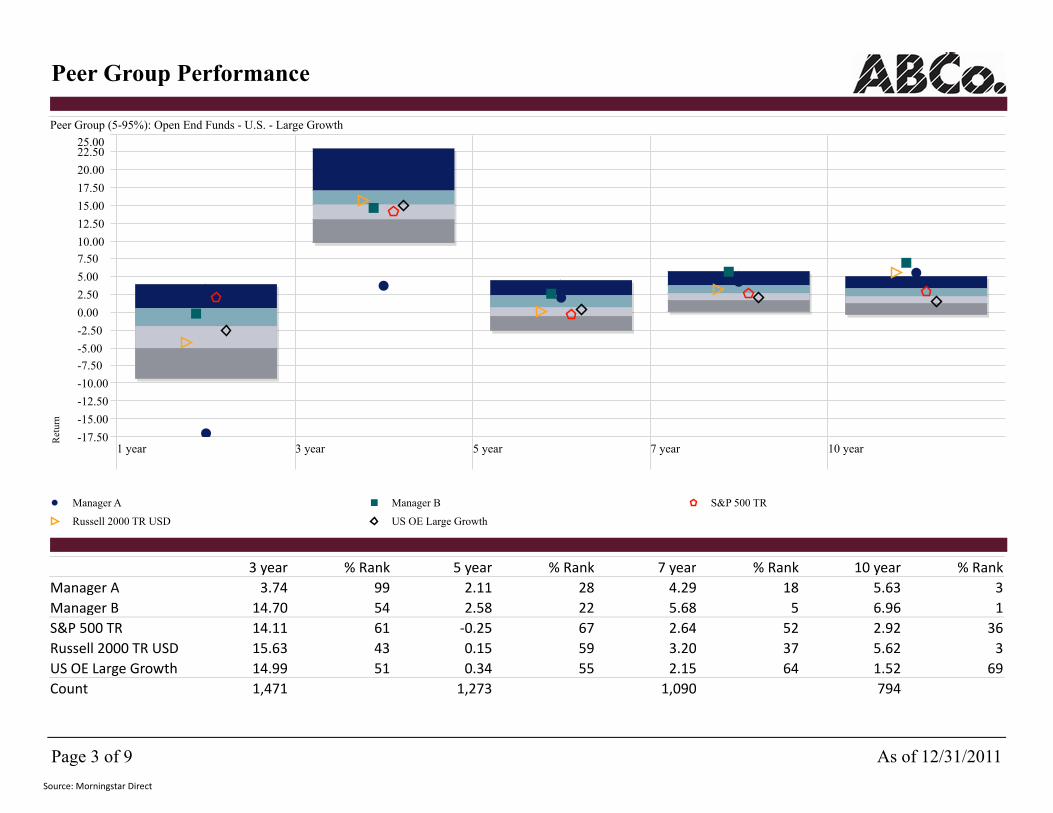
Peer Group Performance
Peer Group (5-95%): Open End Funds - U.S. - Large Growth
Ret
urn
1 year 3 year 5 year 7 year 10 year-17.50
-15.00
-12.50
-10.00
-7.50
-5.00
-2.50
0.00
2.50
5.00
7.50
10.00
12.50
15.00
17.50
20.00
22.5025.00
Manager A Manager B S&P 500 TR
Russell 2000 TR USD US OE Large Growth
3 year % Rank 5 year % Rank 7 year % Rank 10 year % Rank
Manager A
Manager B
S&P 500 TR
Russell 2000 TR USD
US OE Large Growth
Count 1,471 1,273 1,090 794
3.74
14.70
14.11
15.63
2.11
2.58
0.25
0.15
4.29
5.68
2.64
3.20
5.63
6.96
2.92
5.62
14.99 0.34 2.15 1.52
99
54
61
43
51
28
22
67
59
55
18
5
52
37
64
3
1
36
3
69
Page 3 of 9 As of 12/31/2011
Source: Morningstar Direct
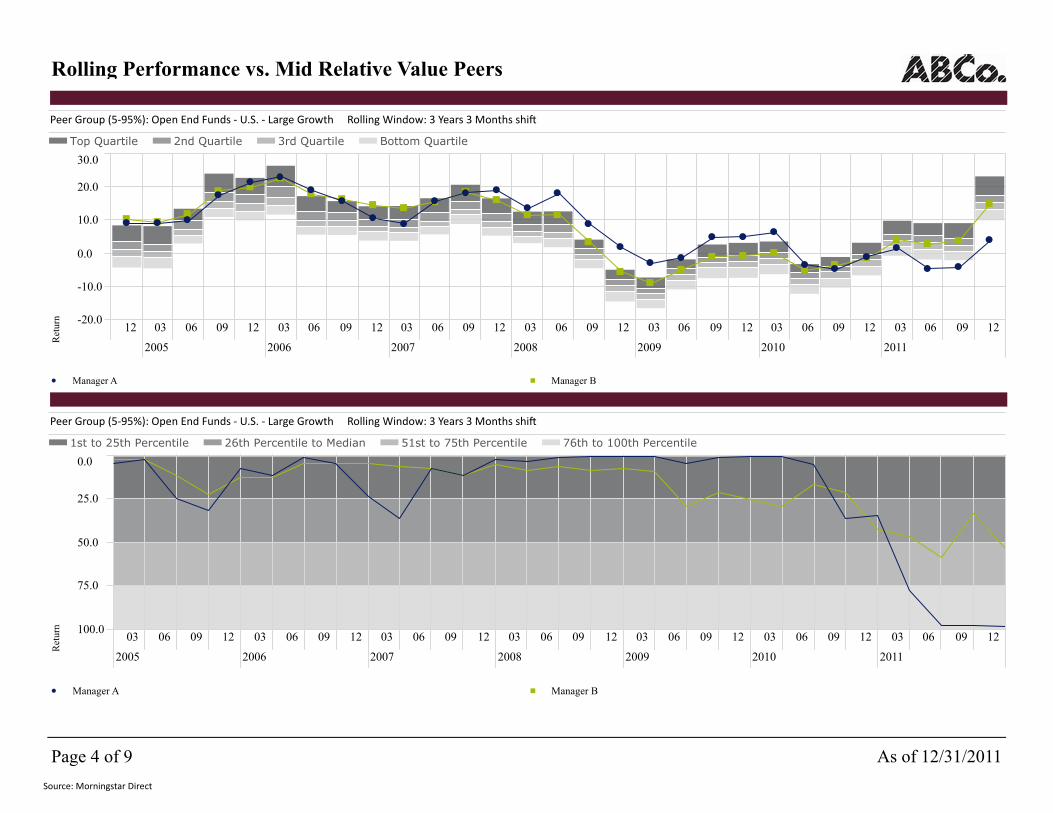
Rolling Performance vs. Mid Relative Value Peers
Peer Group (595%): Open End Funds U.S. Large Growth Rolling Window: 3 Years 3 Months shi�
Top Quartile 2nd Quartile 3rd Quartile Bottom Quartile
Ret
urn
12
2005
03 06 09 12
2006
03 06 09 12
2007
03 06 09 12
2008
03 06 09 12
2009
03 06 09 12
2010
03 06 09 12
2011
03 06 09 12-20.0
-10.0
0.0
10.0
20.0
30.0
Manager A Manager B
Peer Group (595%): Open End Funds U.S. Large Growth Rolling Window: 3 Years 3 Months shi�
1st to 25th Percentile 26th Percentile to Median 51st to 75th Percentile 76th to 100th Percentile
Ret
urn
2005
03 06 09 12
2006
03 06 09 12
2007
03 06 09 12
2008
03 06 09 12
2009
03 06 09 12
2010
03 06 09 12
2011
03 06 09 12100.0
75.0
50.0
25.0
0.0
Manager A Manager B
Page 4 of 9 As of 12/31/2011
Source: Morningstar Direct

3 Year Statistics vs. Mid Relative Value PeersAlpha
Alp
ha
1/1/2009 - 12/31/2011-8.0
-7.0
-6.0
-5.0
-4.0
-3.0
-2.0
-1.0
0.0
1.0
2.0
3.0
4.0
5.0
6.0
7.0
8.09.0
Manager A Manager B
Beta
Bet
a
1/1/2009 - 12/31/20110.8
0.8
0.9
0.9
0.9
0.9
0.9
1.0
1.0
1.0
1.0
1.0
1.1
1.1
1.1
1.1
Manager A Manager B
Information Ratio
Info
rmat
ion
Rat
io (
geo)
1/1/2009 - 12/31/2011-1.0
-0.8
-0.6
-0.4
-0.2
0.0
0.2
0.4
0.6
0.8
1.0
1.2
Manager A Manager B
Sharpe Ratio
Sha
rpe
Rat
io
1/1/2009 - 12/31/20110.2
0.3
0.4
0.5
0.6
0.7
0.8
0.9
1.0
1.1
1.2
Manager A Manager B
Time Period: 4/1/2009 to 3/31/2012
Alpha % Rank Beta % RankInforma�on
Ra�o% Rank
Sharpe
Ra�o% Rank
Manager A
Manager B
S&P 500 TR
Russell 2000 TR USD
US OE Large Growth
9.27
2.14
0.00
2.68
1.01
0.87
1.00
1.30
0.92
0.10
0.30
0.70
1.47
1.38
1.17
1.89 1.07 0.19 1.25
99
10
24
64
53
77
96
79
2
47
90
49
19
55
99
7
15
67
46
Page 5 of 9 As of 12/31/2011
Source: Morningstar Direct

Trailing 3 Year X-Y ChartsUpsideDownside
Up
Ca
ptu
re R
a�
o
Down Capture Ra�o
0.00 4.00 8.00 12.00 16.00 20.00 24.00
0.00
30.00
60.00
90.00
120.00
150.00
180.00
Manager A Manager B S&P 500 TR
Russell 2000 TR USD US OE Large Growth
Avg GainLoss
Ave
rag
e G
ain
Average Loss
6.00 5.00 4.00 3.00 2.00 1.00 0.00
0.00
1.00
2.00
3.00
4.00
5.00
6.00
Manager A Manager B S&P 500 TR
Russell 2000 TR USD US OE Large Growth
Capture Statistics
Up
Capture
Ra�o
Down
Capture
Ra�o
Up MonthsDown
Months
Average
Gain
Average
LossR2
Manager A
Manager B
S&P 500 TR
Russell 2000 TR USD
US OE Large Growth 69 51 3.42 4.16
87.58
95.65
100.00
136.42
73.06
75.78
100.00
126.94
68
74
74
71
52
46
46
49
3.97
3.07
3.07
4.54
3.95
3.35
4.16
5.17
47.05
81.30
100.00
82.04
100.96 107.92 94.15
Page 6 of 9 As of 12/31/2011
Source: Morningstar Direct

Portfolio Style
Portfolio Statistics
P/E Ra�o P/S Ra�o P/B Ra�o
Average
Market
Cap
Debt
to
Capital %
Net
Margin %
Dividend
Yield
Manager A
Manager B
S&P 500 TR
Russell 2000 TR USD
US OE Large Growth
14.98 0.77 1.57 28,526.40 41.73 11.48 1.48
19.30 2.39 3.35 43,421.39 26.87 16.35 1.36
15.48 1.37 2.26 55,677.47 35.97 13.67 2.37
17.42 1.00 1.85 1,085.81 32.02 8.00 2.88
18.47 2.04 3.54 49,658.24 26.72 16.43 1.57
HoldingsBased Style
Mic
roS
ma
llM
idLa
rge
Gia
nt
DeepVal CoreVal Core CoreGrth HighGrth
Manager A 3/31/2012
Manager B 3/31/2012
Time Period: 1/1/2002 to 12/31/2011
Rolling Window: 3 Years 1 Month shi�
Russell Top 200
Value TR USD
Russell Top 200
Growth TR USD
Russell Mid Cap
Value TR USD
Russell Mid Cap
Growth TR USD
Russell 2000
Value TR USD
Russell 2000
Growth TR USD
Manager A
Manager B
S&P 500 TR
Russell 2000 TR USD
US OE Large Growth
Page 7 of 9 As of 12/31/2011
Source: Morningstar Direct

HoldingsManager A Top Holdings
Por�olio Date: 3/31/2012
Por�olio
Weigh�ng %
US Treasury Note 0.375%
Altria Grp 9.95%
US Treasury Note 0.75%
Ci�group Inc
Morgan Stanley
Whirlpool Corpora�on
Delta Air Lines Inc
Tata Motors, Ltd. ADR
Na�onal Oilwell Varco, Inc.
Nike, Inc. Class B
11.26
7.68
7.51
7.08
5.75
5.34
5.24
5.20
5.04
5.02
Manager B Top Holdings
Por�olio Date: 4/30/2012
Por�olio
Weigh�ng %
Apple, Inc.
Google, Inc. Class A
Berkshire Hathaway Inc Class A
McDonald's Corpora�on
CocaCola Co
Wells Fargo & Co
Noble Energy Inc
TJX Companies
Walt Disney Co
Nike, Inc. Class B
9.13
4.36
2.99
2.68
2.57
2.21
2.05
1.83
1.72
1.44
Manager A Equity Sectors (GICS)
Por�olio Date: 3/31/2012
%
Energy % 6.9
Materials % 0.0
Industrials % 19.5
Consumer Discre�onary % 28.8
Consumer Staples % 14.0
Healthcare % 0.0
Financials % 22.6
Informa�on Technology % 8.2
Telecom Services % 0.0
U�li�es % 0.0
Total 100.0
Manager B Equity Sectors (GICS)
Por�olio Date: 4/30/2012
%
Energy % 6.9
Materials % 3.9
Industrials % 4.6
Consumer Discre�onary % 23.9
Consumer Staples % 8.4
Healthcare % 9.5
Financials % 11.4
Informa�on Technology % 31.0
Telecom Services % 0.1
U�li�es % 0.1
Total 100.0
Page 8 of 9 As of 12/31/2011
Source: Morningstar Direct
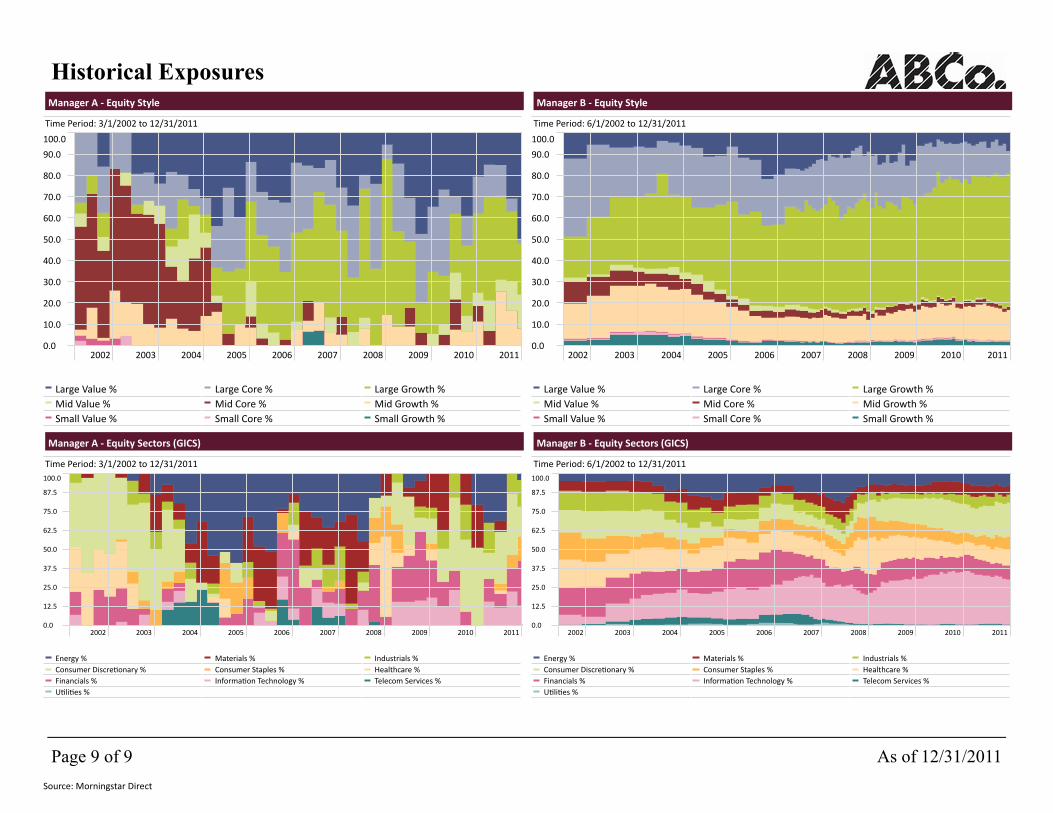
Historical ExposuresManager A Equity Style
Time Period: 3/1/2002 to 12/31/2011
0.0
10.0
20.0
30.0
40.0
50.0
60.0
70.0
80.0
90.0
100.0
2002 2003 2004 2005 2006 2007 2008 2009 2010 2011
Large Value % Large Core % Large Growth %
Mid Value % Mid Core % Mid Growth %
Small Value % Small Core % Small Growth %
Manager B Equity Style
Time Period: 6/1/2002 to 12/31/2011
0.0
10.0
20.0
30.0
40.0
50.0
60.0
70.0
80.0
90.0
100.0
2002 2003 2004 2005 2006 2007 2008 2009 2010 2011
Large Value % Large Core % Large Growth %
Mid Value % Mid Core % Mid Growth %
Small Value % Small Core % Small Growth %
Manager A Equity Sectors (GICS)
Time Period: 3/1/2002 to 12/31/2011
0.0
12.5
25.0
37.5
50.0
62.5
75.0
87.5
100.0
2002 2003 2004 2005 2006 2007 2008 2009 2010 2011
Energy % Materials % Industrials %
Consumer Discre�onary % Consumer Staples % Healthcare %
Financials % Informa�on Technology % Telecom Services %
U�li�es %
Manager B Equity Sectors (GICS)
Time Period: 6/1/2002 to 12/31/2011
0.0
12.5
25.0
37.5
50.0
62.5
75.0
87.5
100.0
2002 2003 2004 2005 2006 2007 2008 2009 2010 2011
Energy % Materials % Industrials %
Consumer Discre�onary % Consumer Staples % Healthcare %
Financials % Informa�on Technology % Telecom Services %
U�li�es %
Page 9 of 9 As of 12/31/2011
Source: Morningstar Direct
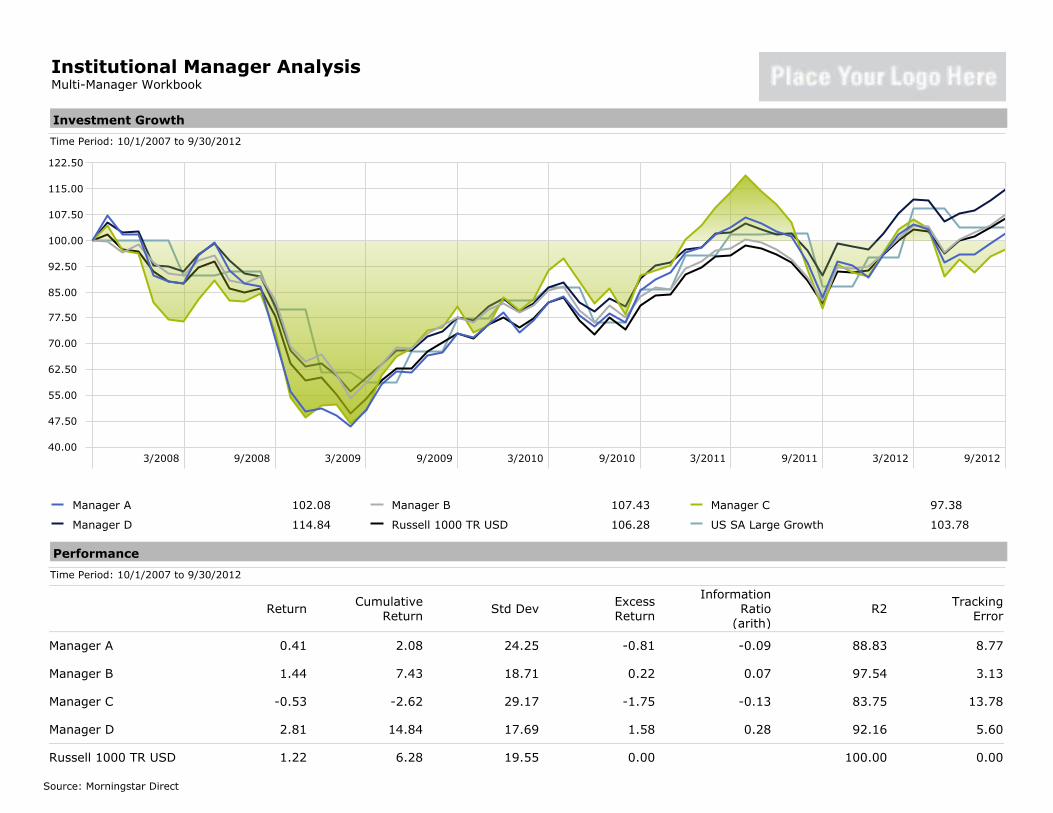
Institutional Manager AnalysisMulti-Manager Workbook
Investment Growth
Time Period: 10/1/2007 to 9/30/2012
3/2008 9/2008 3/2009 9/2009 3/2010 9/2010 3/2011 9/2011 3/2012 9/201240.00
47.50
55.00
62.50
70.00
77.50
85.00
92.50
100.00
107.50
115.00
122.50
Manager A 102.08 Manager B 107.43 Manager C 97.38
Manager D 114.84 Russell 1000 TR USD 106.28 US SA Large Growth 103.78
Performance
Time Period: 10/1/2007 to 9/30/2012
ReturnCumulative
ReturnStd Dev
ExcessReturn
InformationRatio
(arith)R2
TrackingError
Manager A
Manager B
Manager C
Manager D
Russell 1000 TR USD
0.41
1.44
-0.53
2.81
1.22
2.08
7.43
-2.62
14.84
6.28
24.25
18.71
29.17
17.69
19.55
-0.81
0.22
-1.75
1.58
0.00
-0.09
0.07
-0.13
0.28
88.83
97.54
83.75
92.16
100.00
8.77
3.13
13.78
5.60
0.00
Source: Morningstar Direct

Institutional Manager AnalysisMulti-Manager Workbook
Equity Sector Exposure
Software % Hardware % Media % Telecom % Healthcare %Consumer
Services %Business
Services %Financial
Services %ConsumerGoods %
IndustrialMaterials %
Energy % Utilities %
Manager A
Manager B
Manager C
Manager D
Russell 1000 TR USD
US SA Large Growth
18.14 10.46 1.63 9.99 13.18 12.12 1.83 5.02 6.25 13.61 7.77 0.00
3.64 8.02 5.03 7.70 11.98 5.54 17.09 6.86 10.86 10.85 12.44 0.00
4.18 9.44 3.73 6.83 11.46 8.86 3.57 15.86 10.75 11.30 10.49 3.53
1.97 3.53 5.07 4.59 13.31 5.00 6.31 20.04 14.87 16.92 7.19 1.21
4.97 14.46 4.93 8.21 9.22 18.38 4.05 14.01 10.04 6.44 5.28 0.01
6.93 13.97 3.40 8.48 13.57 13.85 4.67 8.09 9.89 9.96 6.69 0.50
Holdings-Based Style
Mic
roSm
all
Mid
Larg
eG
iant
Deep-Val Core-Val Core Core-Grth High-Grth
Returns-Based Style
Time Period: 10/1/2007 to 9/30/2012
Russell 1000 Value TR USD
Russell 1000 Growth TR USD
Russell 2000 Value TR USD
Russell 2000 Growth TR USD
Manager A Manager B Manager C
Manager D US SA Large Growth
Source: Morningstar Direct
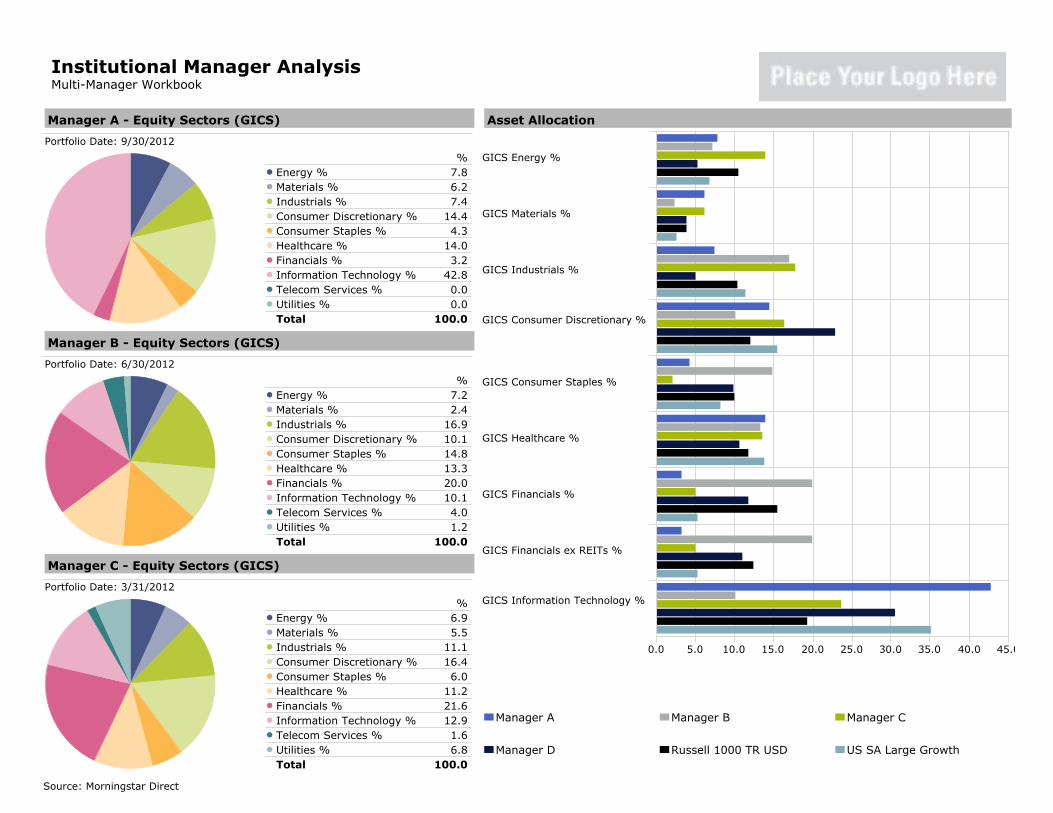
Institutional Manager AnalysisMulti-Manager Workbook
Manager A - Equity Sectors (GICS)
Portfolio Date: 9/30/2012
%Energy % 7.8Materials % 6.2Industrials % 7.4Consumer Discretionary % 14.4Consumer Staples % 4.3Healthcare % 14.0Financials % 3.2Information Technology % 42.8Telecom Services % 0.0Utilities % 0.0Total 100.0
Manager B - Equity Sectors (GICS)
Portfolio Date: 6/30/2012
%Energy % 7.2Materials % 2.4Industrials % 16.9Consumer Discretionary % 10.1Consumer Staples % 14.8Healthcare % 13.3Financials % 20.0Information Technology % 10.1Telecom Services % 4.0Utilities % 1.2Total 100.0
Manager C - Equity Sectors (GICS)
Portfolio Date: 3/31/2012
%Energy % 6.9Materials % 5.5Industrials % 11.1Consumer Discretionary % 16.4Consumer Staples % 6.0Healthcare % 11.2Financials % 21.6Information Technology % 12.9Telecom Services % 1.6Utilities % 6.8Total 100.0
Asset Allocation
0.0 5.0 10.0 15.0 20.0 25.0 30.0 35.0 40.0 45.0
GICS Energy %
GICS Materials %
GICS Industrials %
GICS Consumer Discretionary %
GICS Consumer Staples %
GICS Healthcare %
GICS Financials %
GICS Financials ex REITs %
GICS Information Technology %
Manager A Manager B Manager C
Manager D Russell 1000 TR USD US SA Large Growth
Source: Morningstar Direct

Institutional Manager AnalysisMulti-Manager Workbook
Calendar Year Returns
Ret
urn
YTD 2011 2010 2009 2008 2007
-52.50
-45.00
-37.50
-30.00
-22.50
-15.00
-7.50
0.00
7.50
15.00
22.50
30.00
37.50
45.00
52.50
60.00
Manager A Manager B Manager C
Manager D Russell 1000 TR USD US SA Large Growth
Calendar Year Returns
YTD 2011 2010 2009 2008 2007
Manager A
Manager B
Manager C
Manager D
Russell 1000 TR USD
US SA Large Growth -0.86 16.27 34.14 -37.94 15.07
14.36
16.09
8.63
18.13
16.28
-7.42
0.78
-10.47
-0.14
1.50
21.99
12.49
20.18
16.93
16.10
54.21
21.87
59.84
29.23
28.43
-49.57
-32.10
-45.83
-37.16
-37.60
24.68
8.86
10.16
19.78
5.77
Source: Morningstar Direct

Institutional Manager AnalysisMulti-Manager Workbook
Rolling Standard Deviation
Time Period: 10/1/2007 to 9/30/2012
Rolling Window: 3 Years 1 Month shift
Std
Dev
10 11 12
2011
01 02 03 04 05 06 07 08 09 10 11 12
2012
01 02 03 04 05 06 07 08 0910.00
15.00
20.00
25.00
30.00
35.00
Manager A Manager B Manager CManager D Russell 1000 TR USD US SA Large Growth
Rolling Returns
Time Period: 10/1/2007 to 9/30/2012
Rolling Window: 3 Years 1 Month shift
Ret
urn
10 11 12
2011
01 02 03 04 05 06 07 08 09 10 11 12
2012
01 02 03 04 05 06 07 08 09-7.50
0.00
7.50
15.00
22.50
30.00
37.50
Manager A Manager B Manager CManager D Russell 1000 TR USD US SA Large Growth
Source: Morningstar Direct

Institutional Manager AnalysisMulti-Manager Workbook
Sharpe Ratio
Shar
pe
Rat
io
3 Years 5 Years 10 Years0.00
0.17
0.34
0.51
0.69
0.86
1.03
1.20
Manager A Manager B Manager CManager D Russell 1000 TR USD US SA Large Growth
Sharpe Ratio
3 years 5 years 10 years
Manager A
Manager B
Manager C
Manager D
Russell 1000 TR USD
US SA Large Growth
0.85
0.87
0.53
1.10
1.01
0.13
0.07
0.09
0.21
0.08
0.36
0.39
0.36
0.50
0.32
0.93 0.16 0.37
Standard Deviation
Std
Dev
3 Years 5 Years 10 Years0.00
5.00
10.00
15.00
20.00
25.00
30.00
Manager A Manager B Manager CManager D Russell 1000 TR USD US SA Large Growth
Standard Deviation
3 years 5 years 10 years
Manager A
Manager B
Manager C
Manager D
Russell 1000 TR USD
US SA Large Growth 16.77 19.31 15.69
19.55
15.82
25.89
14.91
16.47
24.43
18.80
29.17
17.83
19.62
20.10
15.16
24.95
14.32
16.06
Beta
Bet
a
3 Years 5 Years 10 Years0.00
0.20
0.40
0.60
0.80
1.00
1.20
1.40
1.60
Manager A Manager B Manager CManager D Russell 1000 TR USD US SA Large Growth
Beta
3 years 5 years 10 years
Manager A
Manager B
Manager C
Manager D
Russell 1000 TR USD
US SA Large Growth
1.12
0.95
1.45
0.88
1.00
1.17
0.95
1.37
0.87
1.00
1.12
0.92
1.37
0.82
1.00
1.01 0.97 0.96
Source: Morningstar Direct
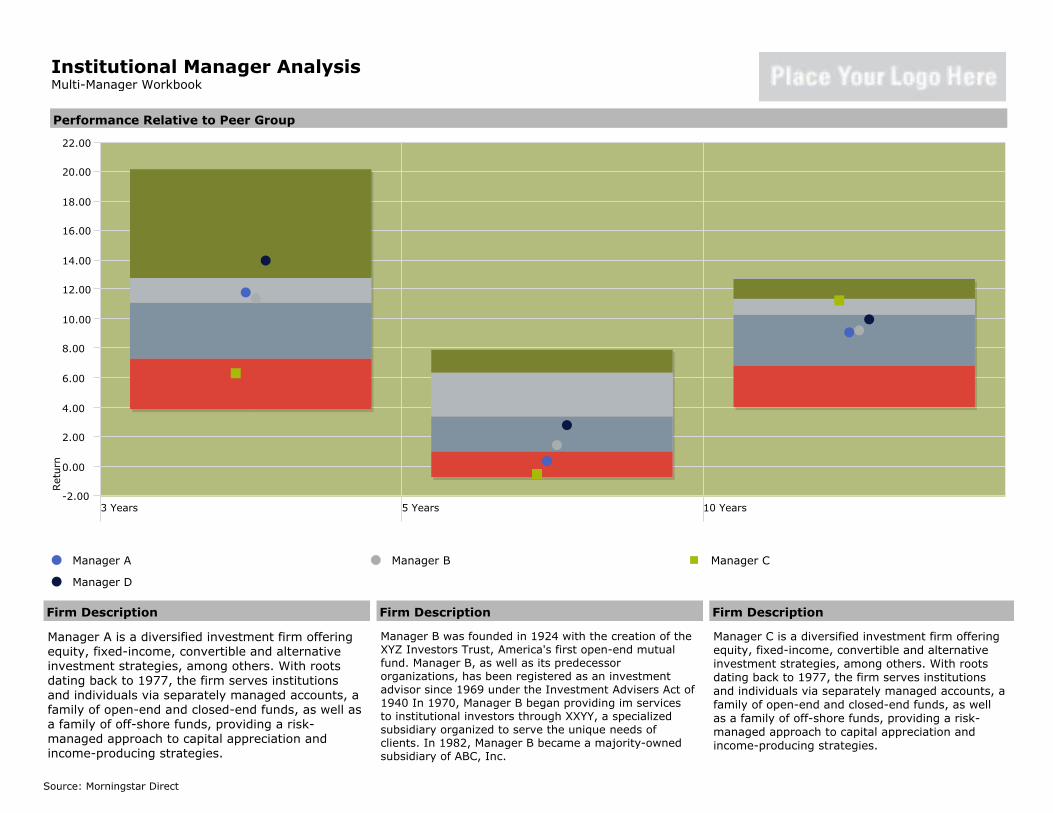
Institutional Manager AnalysisMulti-Manager Workbook
Firm Description
Manager B was founded in 1924 with the creation of the XYZ Investors Trust, America's first open-end mutual fund. Manager B, as well as its predecessor organizations, has been registered as an investment advisor since 1969 under the Investment Advisers Act of 1940 In 1970, Manager B began providing im services to institutional investors through XXYY, a specialized subsidiary organized to serve the unique needs of clients. In 1982, Manager B became a majority-owned subsidiary of ABC, Inc.
Firm Description
Manager A is a diversified investment firm offering equity, fixed-income, convertible and alternative investment strategies, among others. With roots dating back to 1977, the firm serves institutions and individuals via separately managed accounts, a family of open-end and closed-end funds, as well as a family of off-shore funds, providing a risk-managed approach to capital appreciation and income-producing strategies.
Firm Description
Manager C is a diversified investment firm offering equity, fixed-income, convertible and alternative investment strategies, among others. With roots dating back to 1977, the firm serves institutions and individuals via separately managed accounts, a family of open-end and closed-end funds, as well as a family of off-shore funds, providing a risk-managed approach to capital appreciation and income-producing strategies.
Performance Relative to Peer Group
Ret
urn
-2.00
0.00
2.00
4.00
6.00
3 Years 5 Years 10 Years
8.00
10.00
12.00
14.00
16.00
18.00
20.00
22.00
Manager A Manager B Manager C
Manager D
Source: Morningstar Direct
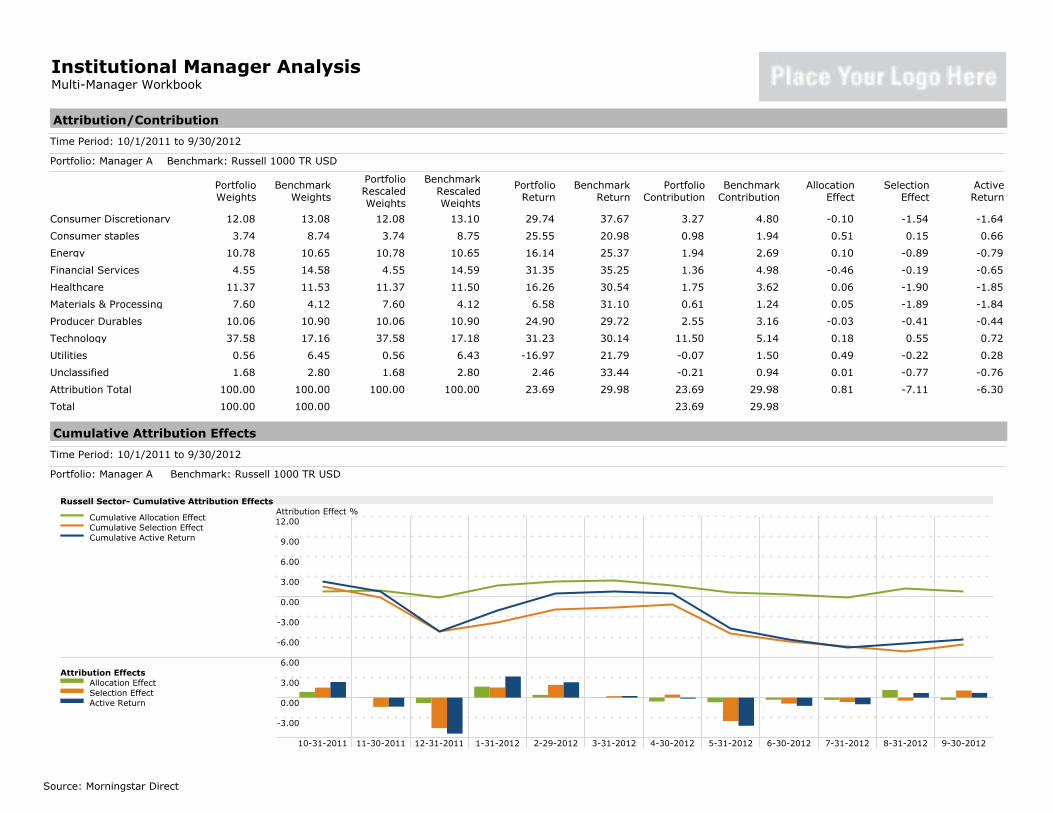
Institutional Manager AnalysisMulti-Manager Workbook
Attribution/Contribution
Time Period: 10/1/2011 to 9/30/2012
Portfolio: Manager A Benchmark: Russell 1000 TR USD
PortfolioWeights
BenchmarkWeights
PortfolioRescaledWeights
BenchmarkRescaledWeights
PortfolioReturn
BenchmarkReturn
PortfolioContribution
BenchmarkContribution
AllocationEffect
SelectionEffect
ActiveReturn
Consumer Discretionary
Consumer staples
Energy
Financial Services
Healthcare
Materials & Processing
Producer Durables
Technology
Utilities
Unclassified
Attribution Total
Total
12.08 13.08 12.08 13.10 29.74 37.67 3.27 4.80 -0.10 -1.54 -1.64
3.74 8.74 3.74 8.75 25.55 20.98 0.98 1.94 0.51 0.15 0.66
10.78 10.65 10.78 10.65 16.14 25.37 1.94 2.69 0.10 -0.89 -0.79
4.55 14.58 4.55 14.59 31.35 35.25 1.36 4.98 -0.46 -0.19 -0.65
11.37 11.53 11.37 11.50 16.26 30.54 1.75 3.62 0.06 -1.90 -1.85
7.60 4.12 7.60 4.12 6.58 31.10 0.61 1.24 0.05 -1.89 -1.84
10.06 10.90 10.06 10.90 24.90 29.72 2.55 3.16 -0.03 -0.41 -0.44
37.58 17.16 37.58 17.18 31.23 30.14 11.50 5.14 0.18 0.55 0.72
0.56 6.45 0.56 6.43 -16.97 21.79 -0.07 1.50 0.49 -0.22 0.28
1.68 2.80 1.68 2.80 2.46 33.44 -0.21 0.94 0.01 -0.77 -0.76
100.00 100.00 100.00 100.00 23.69 29.98 23.69 29.98 0.81 -7.11 -6.30
100.00 100.00 23.69 29.98
Cumulative Attribution Effects
Time Period: 10/1/2011 to 9/30/2012
Portfolio: Manager A Benchmark: Russell 1000 TR USD
Russell Sector- Cumulative Attribution Effects
Cumulative Allocation EffectCumulative Selection EffectCumulative Active Return
Attribution EffectsAllocation EffectSelection EffectActive Return
Attribution Effect %12.00
9.00
6.00
3.00
0.00
-3.00
-6.00
6.00
3.00
0.00
-3.00
10-31-2011 11-30-2011 12-31-2011 1-31-2012 2-29-2012 3-31-2012 4-30-2012 5-31-2012 6-30-2012 7-31-2012 8-31-2012 9-30-2012
Source: Morningstar Direct

Institutional Manager AnalysisMulti-Manager Workbook
Attribution Detail
Time Period: 10/1/2011 to 9/30/2012
Benchmark: Russell 1000 TR USD
Sel
ection E
ffec
t
Russell Sector
ConsumerDiscretionary
Consumerstaples
Energy FinancialServices
Healthcare Materials &Processing
ProducerDurables
Technology Utilities Unclassified-4.50
-4.00
-3.50
-3.00
-2.50
-2.00
-1.50
-1.00
-0.50
0.00
0.50
1.00
1.50
2.00
2.50
3.00
3.50
Manager A Manager B Manager C
Manager D
Source: Morningstar Direct
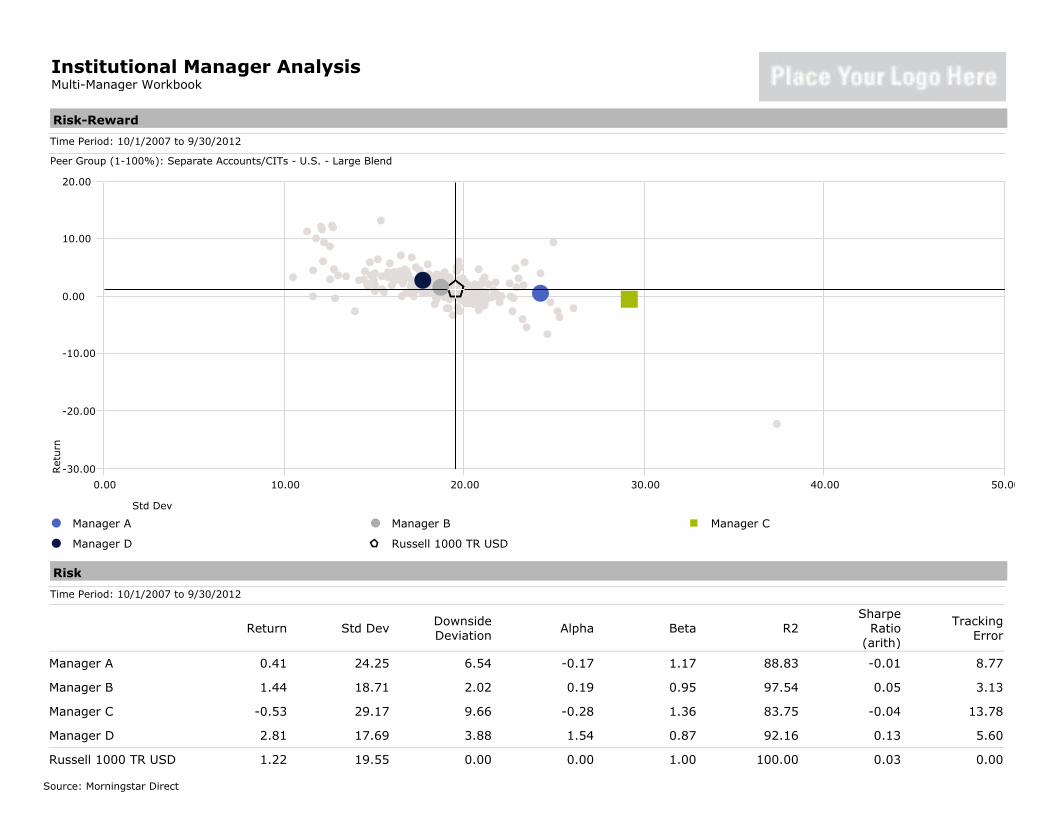
Institutional Manager AnalysisMulti-Manager Workbook
Risk-Reward
Time Period: 10/1/2007 to 9/30/2012
Peer Group (1-100%): Separate Accounts/CITs - U.S. - Large Blend
Ret
urn
Std Dev
0.00 10.00 20.00 30.00 40.00 50.00
-30.00
-20.00
-10.00
0.00
10.00
20.00
Manager A Manager B Manager C
Manager D Russell 1000 TR USD
Risk
Time Period: 10/1/2007 to 9/30/2012
Return Std DevDownsideDeviation
Alpha Beta R2Sharpe
Ratio(arith)
TrackingError
Manager A
Manager B
Manager C
Manager D
Russell 1000 TR USD
0.41
1.44
-0.53
2.81
1.22
24.25
18.71
29.17
17.69
19.55
6.54
2.02
9.66
3.88
0.00
-0.17
0.19
-0.28
1.54
0.00
1.17
0.95
1.36
0.87
1.00
88.83
97.54
83.75
92.16
100.00
-0.01
0.05
-0.04
0.13
0.03
8.77
3.13
13.78
5.60
0.00
Source: Morningstar Direct

Institutional Manager AnalysisMulti-Manager Workbook
Market Performance
Time Period: 10/1/2007 to 9/30/2012
UpPeriod
Percent
DownPeriod
Percent
BestMonth
WorstMonth
BestQuarter
WorstQuarter
UpCapture
Ratio
DownCapture
RatioR2
Manager A
Manager B
Manager C
Manager D
Russell 1000 TR USD
53.33
55.00
56.67
58.33
58.33
46.67
45.00
43.33
41.67
41.67
14.33
11.52
19.80
10.19
11.21
-20.82
-16.29
-25.61
-15.84
-17.46
21.48
16.77
35.06
14.96
16.50
-27.96
-19.02
-28.93
-20.43
-22.48
116.85
93.96
144.81
91.56
100.00
119.66
93.14
150.16
85.76
100.00
88.83
97.54
83.75
92.16
100.00
Upside-Downside Capture
Time Period: 10/1/2007 to 9/30/2012
Up C
aptu
re R
atio
Down Capture Ratio
0.00 30.00 60.00 90.00 120.00 150.00 180.00
-30.00
0.00
30.00
60.00
90.00
120.00
150.00
180.00
Manager A Manager B Manager C
Manager D Russell 1000 TR USD
Drawdown
Time Period: 10/1/2007 to 9/30/2012
3/2008 9/2008 3/2009 9/2009 3/2010 9/2010 3/2011 9/2011 3/2012 9/2012-60.0
-55.0
-50.0
-45.0
-40.0
-35.0
-30.0
-25.0
-20.0
-15.0
-10.0
-5.0
0.0
Manager A Manager B Manager C
Manager D
Source: Morningstar Direct

Monthly Comparative Analysis As of 5/31/2012Qualita�ve Analyst Commentary
This is a good loca�on to enter you custom analysis. These notes can be saved
within the Direct product and referenced in each report or report template.
These notes can be shared across the pla�orm if you should choose.
Once a template is created and approved by compliance, or any other in house
process that may exist, it can be accessed a number of different ways. These
reports or templates can be run using a batch scheduler and distributed. These
can also be accessed through a publishing tool that would allow each individual
rep to access a comparison or report template and run it on an adhoc basis.
All templates or reports will have the ability to combine in house research along
with customized charts, graphs and data tables. The ability to combine your
qualita�ve notes and your in house data with exis�ng Morningstar data will
provide you with a very efficient way of ge�ng quality, �mely informa�on to
your field folks. We can discuss this in greater detail if interested
Investment Growth
Time Period: 6/1/2007 to 5/31/2012
11/2007 5/2008 11/2008 5/2009 11/2009 5/2010 11/2010 5/2011 11/2011 5/201240.0
50.0
60.0
70.0
80.0
90.0
100.0
110.0
120.0
130.0
140.0
Manager A Manager B Manager C
Manager D Manager E S&P 500 TR
Returns
Re
turn
YTD 1 YR 2 YR 3 YR 4 YR 5 YR12.5
10.0
7.5
5.0
2.5
0.0
2.5
5.0
7.5
10.0
12.5
15.0
17.5
Manager A Manager B Manager C
Manager D Manager E S&P 500 TR
Drawdown
Time Period: 6/1/2007 to 5/31/2012
11/2007 5/2008 11/2008 5/2009 11/2009 5/2010 11/2010 5/2011 11/2011 5/201260.0
52.5
45.0
37.5
30.0
22.5
15.0
7.5
0.0
Manager A Manager B Manager C
Manager D Manager E S&P 500 TR
Rolling Performance vs. Peers
Time Period: 6/1/2005 to 5/31/2012
1st to 25th Percen�le 26th Percen�le to Median 51st to 75th Percen�le 76th to 100th Percen�le
Re
turn 06 09 12
2009
03 06 09 12
2010
03 06 09 12
2011
03 06 09 12
2012
03100.0
75.0
50.0
25.0
0.0
Manager A Manager B Manager C
Manager D Manager E S&P 500 TR
Trailing Returns
YTD 1 YR 2 YR 3 YR 5 YR 7 YR
Manager A
Manager B
Manager C
Manager D
Manager E
S&P 500 TR
6.30
8.38
3.33
7.79
3.99
5.16
6.50
2.05
4.10
1.49
12.34
0.41
3.54
13.41
9.49
12.66
7.42
12.00
7.04
15.68
14.19
16.53
12.84
14.92
1.41
2.41
0.14
3.07
1.02
0.92
4.42
6.67
3.98
9.16
2.91
3.52
Calendar Year Returns
YTD 2011 2010 2009 2008 2007
Manager A
Manager B
Manager C
Manager D
Manager E
S&P 500 TR
6.30
8.38
3.33
7.79
3.99
5.16
16.94
0.14
0.35
0.30
9.07
2.11
15.99
16.93
13.39
14.03
20.06
15.06
15.87
29.23
47.57
51.10
52.47
26.46
28.21
37.16
46.15
45.13
50.28
37.00
38.49
19.78
19.94
33.53
23.26
5.49
Source: Morningstar Direct

ReturnsBased Style
Time Period: 6/1/2004 to 5/31/2012
Russell Top 200
Value TR USD
Russell Top 200
Growth TR USD
Russell Mid Cap
Value TR USD
Russell Mid Cap
Growth TR USD
Russell 2000
Value TR USD
Russell 2000
Growth TR USD
Manager A Manager B Manager C
Manager D Manager E S&P 500 TR
HoldingsBased Style
Mic
roS
ma
llM
idLa
rge
Gia
nt
DeepVal CoreVal Core CoreGrth HighGrth
Manager A 3/31/2012 Manager B 4/30/2012 Manager C 2/29/2012
Manager D 2/29/2012 Manager E 3/31/2012 S&P 500 TR 5/31/2012
HoldingsBased Style Trail
Time Period: 6/30/2005 to 5/31/2012
Mic
roS
ma
llM
idLa
rge
Gia
nt
DeepVal CoreVal Core CoreGrth HighGrth
Manager A 6/30/2005 3/31/2012 Manager B 6/30/2005 4/30/2012 Manager C 6/30/2005 2/29/2012
Manager D 6/30/2005 2/29/2012 Manager E 6/30/2005 3/31/2012 S&P 500 TR 6/30/2005 5/31/2012
Equity Sectors
Por�olio Date: 12/31/2011
So�ware Hardware Media Telecom Healthcare Cons Serv Bus Serv Finl ServCons
GoodsIndus Mat Energy U�li�es
Manager A
Manager B
Manager C
Manager D
Manager E
S&P 500 TR
0.00 0.00 0.00 6.15 0.00 9.92 15.17 36.62 25.69 1.97 4.48 0.00
5.24 13.77 3.15 9.21 8.85 17.75 4.33 10.77 11.16 7.22 8.56 0.00
6.46 13.91 2.46 9.57 9.78 11.81 3.97 5.59 11.53 13.55 11.37 0.00
3.11 13.96 3.82 8.92 13.22 13.84 6.03 3.44 10.82 12.57 10.27 0.00
15.42 10.93 0.00 10.30 8.67 10.59 4.36 3.86 7.20 17.63 11.04 0.00
3.88 9.38 3.11 7.00 11.67 8.71 3.39 14.00 11.51 11.28 12.31 3.79
RiskReward
Time Period: 6/1/2007 to 5/31/2012
Re
turn
Std Dev
0.0 4.0 8.0 12.0 16.0 20.0 24.0 28.0
2.0
1.0
0.0
1.0
2.0
3.0
4.0
Manager A Manager B Manager C
Manager D Manager E S&P 500 TR
UpsideDownside Capture
Time Period: 6/1/2007 to 5/31/2012
Up
Ca
ptu
re R
a�
o
Down Capture Ra�o
0.0 20.0 40.0 60.0 80.0 100.0 120.0 140.0
0.0
30.0
60.0
90.0
120.0
150.0
Manager A Manager B Manager C
Manager D Manager E S&P 500 TR
Market Performance
Time Period: 6/1/2007 to 5/31/2012
Up
Period
Percent
Down
Period
Percent
Ba�ng
AverageAlpha Beta
Informa�on
Ra�o
(geo)
Up
Capture
Ra�o
Down
Capture
Ra�o
Manager A
Manager B
Manager C
Manager D
Manager E
S&P 500 TR
51.67
55.00
53.33
56.67
50.00
55.00
48.33
45.00
46.67
43.33
50.00
45.00
50.00
61.67
56.67
61.67
56.67
100.00
2.69
3.07
1.54
4.58
1.07
0.00
0.87
0.89
1.06
1.09
1.18
1.00
0.18
0.58
0.16
0.52
0.01
95.16
97.51
109.29
127.54
122.77
100.00
86.99
85.53
104.66
110.83
121.19
100.00
Monthly Comparative Analysis As of 5/31/2012
Source: Morningstar Direct
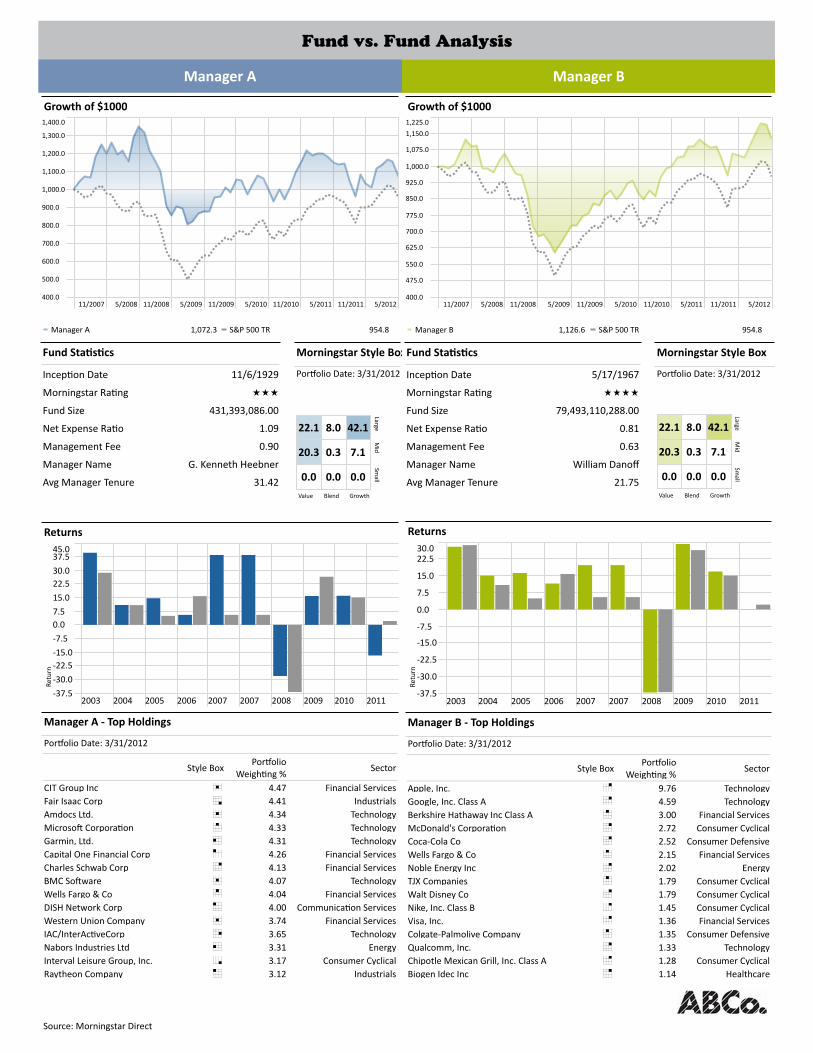
Fund vs. Fund Analysis
Fund Sta�s�cs
Incep�on Date
Morningstar Ra�ng
Fund Size
Net Expense Ra�o
Management Fee
Manager Name
Avg Manager Tenure
11/6/1929
ÙÙÙ
431,393,086.00
1.09
0.90
G. Kenneth Heebner
31.42
Morningstar Style Box
Por�olio Date: 3/31/2012
22.1 8.0 42.1
20.3 0.3 7.1
0.0 0.0 0.0
Larg
eM
idS
ma
ll
Value Blend Growth
Returns
Re
turn
2003 2004 2005 2006 2007 2007 2008 2009 2010 201137.5
30.0
22.5
15.0
7.5
0.0
7.5
15.0
22.5
30.0
37.545.0
Manager A Top Holdings
Por�olio Date: 3/31/2012
Style BoxPor�olio
Weigh�ng %Sector
CIT Group Inc
Fair Isaac Corp
Amdocs Ltd.
Microso� Corpora�on
Garmin, Ltd.
Capital One Financial Corp
Charles Schwab Corp
BMC So�ware
Wells Fargo & Co
DISH Network Corp
Western Union Company
IAC/InterAc�veCorp
Nabors Industries Ltd
Interval Leisure Group, Inc.
Raytheon Company
Ë 4.47 Financial Services
Ï 4.41 Industrials
Ë 4.34 Technology
È 4.33 Technology
Ê 4.31 Technology
Ç 4.26 Financial Services
É 4.13 Financial Services
Ë 4.07 Technology
È 4.04 Financial Services
Ç 4.00 Communica�on Services
Ë 3.74 Financial Services
Ì 3.65 Technology
Ê 3.31 Energy
Ï 3.17 Consumer Cyclical
Ç 3.12 Industrials
Growth of $1000
11/2007 5/2008 11/2008 5/2009 11/2009 5/2010 11/2010 5/2011 11/2011 5/2012400.0
500.0
600.0
700.0
800.0
900.0
1,000.0
1,100.0
1,200.0
1,300.0
1,400.0
Manager A 1,072.3 S&P 500 TR 954.8
Manager A
Growth of $1000
11/2007 5/2008 11/2008 5/2009 11/2009 5/2010 11/2010 5/2011 11/2011 5/2012400.0
475.0
550.0
625.0
700.0
775.0
850.0
925.0
1,000.0
1,075.0
1,150.0
1,225.0
Manager B 1,126.6 S&P 500 TR 954.8
Fund Sta�s�cs
Incep�on Date
Morningstar Ra�ng
Fund Size
Net Expense Ra�o
Management Fee
Manager Name
Avg Manager Tenure
5/17/1967
ÙÙÙÙ
79,493,110,288.00
0.81
0.63
William Danoff
21.75
Morningstar Style Box
Por�olio Date: 3/31/2012
22.1 8.0 42.1
20.3 0.3 7.1
0.0 0.0 0.0
Larg
eM
idS
ma
ll
Value Blend Growth
Returns
Re
turn
2003 2004 2005 2006 2007 2007 2008 2009 2010 201137.5
30.0
22.5
15.0
7.5
0.0
7.5
15.0
22.530.0
Manager B Top Holdings
Por�olio Date: 3/31/2012
Style BoxPor�olio
Weigh�ng %Sector
Apple, Inc.
Google, Inc. Class A
Berkshire Hathaway Inc Class A
McDonald's Corpora�on
CocaCola Co
Wells Fargo & Co
Noble Energy Inc
TJX Companies
Walt Disney Co
Nike, Inc. Class B
Visa, Inc.
ColgatePalmolive Company
Qualcomm, Inc.
Chipotle Mexican Grill, Inc. Class A
Biogen Idec Inc
É 9.76 Technology
É 4.59 Technology
È 3.00 Financial Services
É 2.72 Consumer Cyclical
É 2.52 Consumer Defensive
È 2.15 Financial Services
É 2.02 Energy
È 1.79 Consumer Cyclical
É 1.79 Consumer Cyclical
É 1.45 Consumer Cyclical
É 1.36 Financial Services
È 1.35 Consumer Defensive
É 1.33 Technology
É 1.28 Consumer Cyclical
É 1.14 Healthcare
Manager B
Source: Morningstar Direct
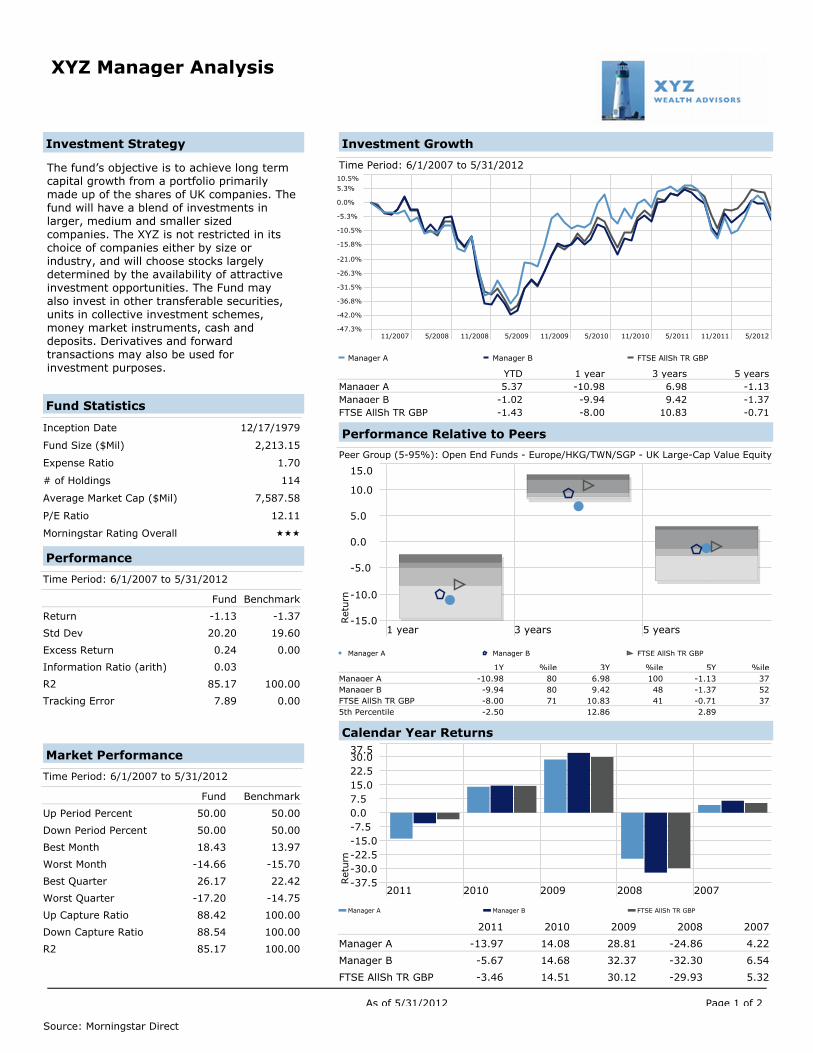
XYZ Manager Analysis
YTD 1 year 3 years 5 yearsManager AManager BFTSE AllSh TR GBP
5.37-1.02-1.43
-10.98-9.94-8.00
6.989.42
10.83
-1.13-1.37-0.71
Calendar Year Returns
Ret
urn
2011 2010 2009 2008 2007-37.5-30.0-22.5-15.0-7.50.07.515.022.530.037.5
Manager A Manager B FTSE AllSh TR GBP
2011 2010 2009 2008 2007
Manager A
Manager B
FTSE AllSh TR GBP
-13.97
-5.67
-3.46
14.08
14.68
14.51
28.81
32.37
30.12
-24.86
-32.30
-29.93
4.22
6.54
5.32
1Y %ile 3Y %ile 5Y %ileManager AManager BFTSE AllSh TR GBP5th Percentile
-10.98-9.94-8.00
6.989.42
10.83
-1.13-1.37-0.71
-2.50 12.86 2.89
808071
1004841
375237
Performance Relative to Peers
Peer Group (5-95%): Open End Funds - Europe/HKG/TWN/SGP - UK Large-Cap Value Equity
Ret
urn
1 year 3 years 5 years-15.0
-10.0
-5.0
0.0
5.0
10.0
15.0
Manager A Manager B FTSE AllSh TR GBP
Investment Growth
Time Period: 6/1/2007 to 5/31/2012
11/2007 5/2008 11/2008 5/2009 11/2009 5/2010 11/2010 5/2011 11/2011 5/2012-47.3%
-42.0%
-36.8%
-31.5%
-26.3%
-21.0%
-15.8%
-10.5%
-5.3%
0.0%
5.3%
10.5%
Manager A Manager B FTSE AllSh TR GBP
Investment Strategy
The fund’s objective is to achieve long term capital growth from a portfolio primarily made up of the shares of UK companies. The fund will have a blend of investments in larger, medium and smaller sized companies. The XYZ is not restricted in its choice of companies either by size or industry, and will choose stocks largely determined by the availability of attractive investment opportunities. The Fund may also invest in other transferable securities, units in collective investment schemes, money market instruments, cash and deposits. Derivatives and forward transactions may also be used for investment purposes.
Fund Statistics
Inception Date
Fund Size ($Mil)
Expense Ratio
# of Holdings
Average Market Cap ($Mil)
P/E Ratio
Morningstar Rating Overall
12/17/1979
2,213.15
1.70
114
7,587.58
12.11
ÙÙÙ
Market Performance
Time Period: 6/1/2007 to 5/31/2012
Fund Benchmark
Up Period Percent
Down Period Percent
Best Month
Worst Month
Best Quarter
Worst Quarter
Up Capture Ratio
Down Capture Ratio
R2
50.00
50.00
18.43
-14.66
26.17
-17.20
88.42
88.54
85.17
50.00
50.00
13.97
-15.70
22.42
-14.75
100.00
100.00
100.00
Performance
Time Period: 6/1/2007 to 5/31/2012
Fund Benchmark
Return
Std Dev
Excess Return
Information Ratio (arith)
R2
Tracking Error
-1.13
20.20
0.24
0.03
85.17
7.89
-1.37
19.60
0.00
100.00
0.00
As of 5/31/2012 Page 1 of 2
Source: Morningstar Direct

XYZ Manager Analysis
3 Year Rolling Returns
Top Quartile 2nd Quartile 3rd Quartile Bottom Quartile
Ret
urn
05 06 07 08 09 10 11 12
2011
01 02 03 04 05 06 07 08 09 10 11 12
2012
01 02 03 04 05-15.0
-7.5
0.0
7.5
15.0
22.5
30.0
Manager A Manager B FTSE AllSh TR GBP
3 Year Rolling Return Quartiles1st to 25th Percentile 26th Percentile to Median 51st to 75th Percentile 76th to 100th Percentile
Ret
urn
Ran
k %
06 07 08 09 10 11 12
2011
01 02 03 04 05 06 07 08 09 10 11 12
2012
01 02 03 04 05100.0
75.0
50.0
25.0
0.0
Manager A Manager B FTSE AllSh TR GBP
Sector Exposure
0.0 5.0 10.0 15.0 20.0 25.0
Basic Materials %
Communication Services %
Consumer Cyclical %
Consumer Defensive %
Healthcare %
Industrials %
Real Estate %
Technology %
Energy %
Financial Services %
Utilities %
Manager A Manager B FTSE AllSh TR GBP
Asset Allocation
0.0 20.0 40.0 60.0 80.0 100.0
Cash %
Equity %
Bond %
Other %
Manager A Manager B FTSE AllSh TR GBP
Manager A - Top Holdings
Portfolio Date: 2/29/2012
Weighting %
GlaxoSmithKline PLC
BP PLC
Lloyds Banking Group PLC
Vodafone Group PLC
Wolseley PLC
Itv PLC
Centrica PLC
British Sky Broadcasting Group PLC
Ladbrokes PLC
Kingfisher PLC
5.71
5.42
5.08
3.39
3.21
3.17
3.09
3.03
3.03
2.93
As of 5/31/2012 Page 2 of 2
Source: Morningstar Direct