
Presentation Studio Additional Samples - Morningstar,...
73
Presentation Studio Additional Samples Asset Flows, Equity Attribution, Stocks, and Total Portfolio Attribution & Competitive Software & 3.12 Enhancements
Transcript of Presentation Studio Additional Samples - Morningstar,...
Presentation Studio Additional Samples Asset Flows, Equity Attribution, Stocks, and Total Portfolio Attribution
& Competitive Software
& 3.12 Enhancements

Asset Flow Analysis
Monthly Es�mated Fund-Level Net Flow
Time Period: 10/1/2009 to 9/30/2012
Es�
ma
ted
Fu
nd
Le
vel N
et
Flo
w
Ag
gr
fro
m S
ha
re C
lass
(M
on
thly
)
3/2010 9/2010 3/2011 9/2011 3/2012 9/2012
150,000,000.0
100,000,000.0
50,000,000.0
0.0
50,000,000.0
100,000,000.0
150,000,000.0
200,000,000.0
250,000,000.0
Manager B
Monthly Es�mated Net Flow
Time Period: 10/1/2009 to 9/30/2012
Es�
ma
ted
Sh
are
Cla
ss N
et
Flo
w (
Mo
nth
ly)
3/2010 9/2010 3/2011 9/2011 3/2012 9/2012
500,000,000.0
400,000,000.0
300,000,000.0
200,000,000.0
100,000,000.0
0.0
100,000,000.0
Manager A
Time Series
Time Period: 10/1/2007 to 9/30/2012
Currency: US Dollar
Es�
ma
ted
Sh
are
Cla
ss N
et
Flo
w (
Mo
nth
ly)
3/2008 9/2008 3/2009 9/2009 3/2010 9/2010 3/2011 9/2011 3/2012 9/2012
500,000,000.0
400,000,000.0
300,000,000.0
200,000,000.0
100,000,000.0
0.0
100,000,000.0
200,000,000.0
Manager A Manager B
Source: Morningstar Direct
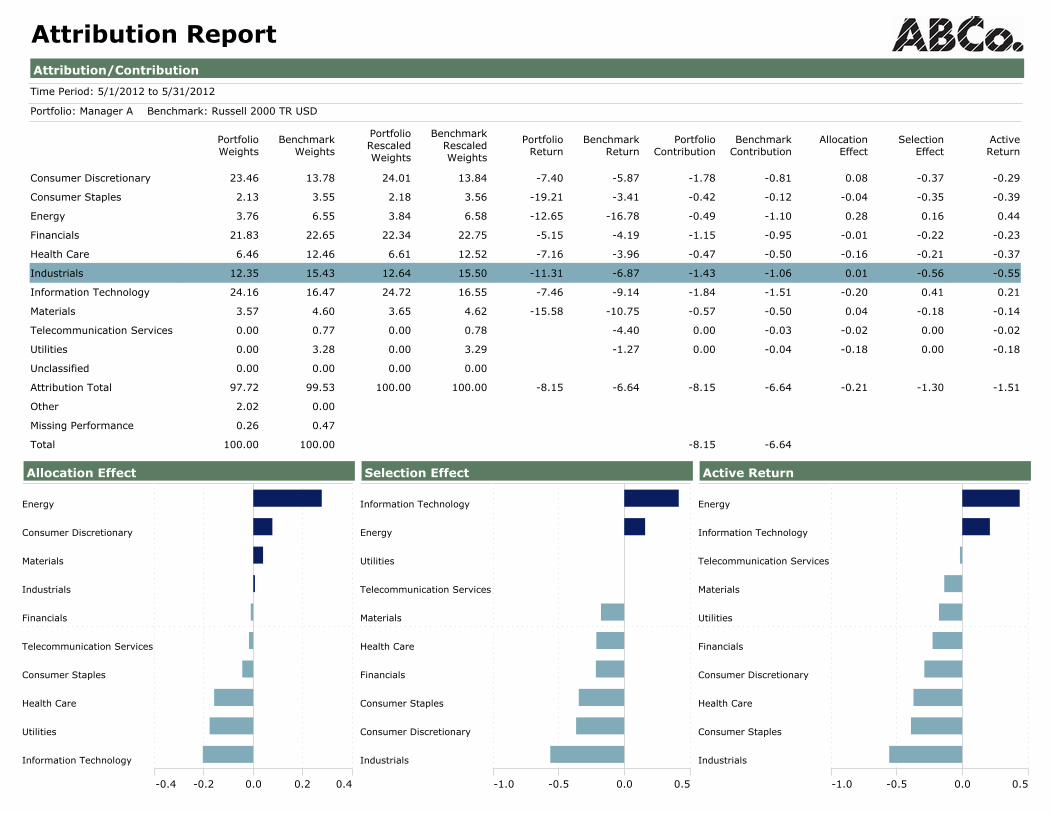
Attribution ReportAttribution/Contribution
Time Period: 5/1/2012 to 5/31/2012
Portfolio: Manager A Benchmark: Russell 2000 TR USD
PortfolioWeights
BenchmarkWeights
PortfolioRescaledWeights
BenchmarkRescaledWeights
PortfolioReturn
BenchmarkReturn
PortfolioContribution
BenchmarkContribution
AllocationEffect
SelectionEffect
ActiveReturn
Consumer Discretionary
Consumer Staples
Energy
Financials
Health Care
Industrials
Information Technology
Materials
Telecommunication Services
Utilities
Unclassified
Attribution Total
Other
Missing Performance
Total
23.46 13.78 24.01 13.84 -7.40 -5.87 -1.78 -0.81 0.08 -0.37 -0.29
2.13 3.55 2.18 3.56 -19.21 -3.41 -0.42 -0.12 -0.04 -0.35 -0.39
3.76 6.55 3.84 6.58 -12.65 -16.78 -0.49 -1.10 0.28 0.16 0.44
21.83 22.65 22.34 22.75 -5.15 -4.19 -1.15 -0.95 -0.01 -0.22 -0.23
6.46 12.46 6.61 12.52 -7.16 -3.96 -0.47 -0.50 -0.16 -0.21 -0.37
12.35 15.43 12.64 15.50 -11.31 -6.87 -1.43 -1.06 0.01 -0.56 -0.55
24.16 16.47 24.72 16.55 -7.46 -9.14 -1.84 -1.51 -0.20 0.41 0.21
3.57 4.60 3.65 4.62 -15.58 -10.75 -0.57 -0.50 0.04 -0.18 -0.14
0.00 0.77 0.00 0.78 -4.40 0.00 -0.03 -0.02 0.00 -0.02
0.00 3.28 0.00 3.29 -1.27 0.00 -0.04 -0.18 0.00 -0.18
0.00 0.00 0.00 0.00
97.72 99.53 100.00 100.00 -8.15 -6.64 -8.15 -6.64 -0.21 -1.30 -1.51
2.02 0.00
0.26 0.47
100.00 100.00 -8.15 -6.64
Allocation Effect
Energy
Consumer Discretionary
Materials
Industrials
Financials
Telecommunication Services
Consumer Staples
Health Care
Utilities
Information Technology
-0.4 -0.2 0.0 0.2 0.4
Selection Effect
Information Technology
Energy
Utilities
Telecommunication Services
Materials
Health Care
Financials
Consumer Staples
Consumer Discretionary
Industrials
-1.0 -0.5 0.0 0.5
Active Return
Energy
Information Technology
Telecommunication Services
Materials
Utilities
Financials
Consumer Discretionary
Health Care
Consumer Staples
Industrials
-1.0 -0.5 0.0 0.5

Attribution ReportTop 10 Holdings
Holdings Weights Return
Ulta Salon Cosmetics & Fragrances, Inc.
EnerSys, Inc.
Sourcefire, Inc.
Aeropostale, Inc.
Tractor Supply
Colony Financial Inc
FEI Company
Symetra Financial Corporation
IAC/InterActiveCorp
SolarWinds, Inc.
2.49 1.35
2.13 -5.64
2.04 8.18
2.01 -16.59
1.91 -6.98
1.70 -1.12
1.60 -8.77
1.56 -6.52
1.51 -6.48
1.45 -2.24
Best Performers
Holdings Weights Return
First California Financial Group, Inc.
Aspen Technology, Inc.
McMoRan Exploration Co.
Sourcefire, Inc.
Cirrus Logic, Inc.
Salix Pharmaceuticals, Ltd.
Ameristar Casinos Inc
Convergys Corporation
MFA Financial, Inc.
Apollo Investment Corp
0.22 24.18
1.29 11.73
0.28 10.57
2.04 8.18
1.36 4.89
1.24 4.88
0.87 4.70
1.43 4.34
0.16 3.25
0.57 2.62
Worst Performers
Holdings Weights Return
Chiquita Brands International
BroadSoft, Inc.
Health Net Inc
Tetra Technologies, Inc.
Terex Corp
Francescas Holdings Corp
Presidential Life Corp.
Emulex Corporation
Titan International, Inc.
bebe stores, Inc.
0.58 -36.24
0.96 -36.21
0.75 -28.05
0.76 -26.64
1.17 -26.55
1.08 -25.17
0.54 -23.92
0.77 -22.58
1.31 -22.46
0.77 -22.20
Leading Contributors
Holdings Return Contribution
Sourcefire, Inc.
Aspen Technology, Inc.
Cirrus Logic, Inc.
Convergys Corporation
Salix Pharmaceuticals, Ltd.
First California Financial Group, Inc.
Ameristar Casinos Inc
Ulta Salon Cosmetics & Fragrances, Inc.
McMoRan Exploration Co.
Collective Brands, Inc.
8.18 0.17
11.73 0.16
4.89 0.07
4.34 0.06
4.88 0.06
24.18 0.05
4.70 0.04
1.35 0.03
10.57 0.03
2.41 0.03
Bottom Contributors
Holdings Return Contribution
BroadSoft, Inc.
Aeropostale, Inc.
Terex Corp
Titan International, Inc.
Commercial Metals Company
Francescas Holdings Corp
Brunswick Corporation
WMS Industries, Inc.
ValueClick, Inc.
Hornbeck Offshore Services, Inc.
-36.21 -0.35
-16.59 -0.34
-26.55 -0.32
-22.46 -0.30
-20.97 -0.29
-25.17 -0.28
-16.70 -0.24
-16.24 -0.23
-17.19 -0.23
-19.79 -0.22
Relative Weights
Consumer Discretionary
Information Technology
Telecommunication Services
Financials
Materials
Consumer Staples
Energy
Industrials
Utilities
Health Care
-15.0 -7.5 0.0 7.5 15.0
9.7
7.7
-0.8
-0.8
-1.0
-1.4
-2.8
-3.1
-3.3
-6.0
Relative Return
Energy
Information Technology
Financials
Consumer Discretionary
Health Care
Industrials
Materials
Consumer Staples
Utilities
Telecommunication Services
-20.0 -10.0 0.0 10.0
4.1
1.7
-1.0
-1.5
-3.2
-4.4
-4.8
-15.8

Attribution ReportAllocation Effects
Underperform Outperform Overw
eig
ht
Un
derw
eig
ht
Rel
ativ
e W
eight
Relative Return
12.00
6.00
0.00
-6.00
-12.00-12.50 -10.00 -7.50 -5.00 -2.50 0.00 2.50 5.00 7.50 10.00 12.50
54
3
2
1
4
3
2
1
Best Weighting Weight +/- Return +/- Effect1 Energy -2.73 -10.14 0.282 Consumer Discretionary 10.17 0.76 0.083 Materials -0.97 -4.11 0.044 Industrials -2.86 -0.23 0.01
Worst Weighting Weight +/- Return +/- Effect1 Information Technology 8.17 -2.50 -0.202 Utilities -3.29 5.37 -0.183 Health Care -5.91 2.68 -0.164 Consumer Staples -1.38 3.22 -0.045 Telecommunication Services -0.78 2.24 -0.02
Selection Effects
Underperform Outperform Overw
eig
ht
Un
derw
eig
ht
Rel
ativ
e W
eight
Relative Return
3.00
1.50
0.00
-1.50
-3.00-30.00 -24.00 -18.00 -12.00 -6.00 0.00 6.00 12.00 18.00 24.00 30.00
5
43
2
1 54
3
2
1
Best Selections GICS Sector Weight +/- Return +/- Effect1 Sourcefire, Inc. Information Technology 1.91 17.31 0.332 Aspen Technology, Inc. Information Technology 1.12 20.87 0.233 Ulta Salon Cosmetics... Consumer Discretion... 2.54 7.22 0.184 Convergys Corporation Information Technology 1.29 13.47 0.175 Cirrus Logic, Inc. Information Technology 1.17 14.03 0.16
Worst Selections GICS Sector Weight +/- Return +/- Effect1 Terex Corp Industrials 1.20 -19.68 -0.242 BroadSoft, Inc. Information Technology 0.86 -27.07 -0.233 Francescas Holdings ... Consumer Discretion... 1.06 -19.29 -0.204 Titan International, Inc. Industrials 1.26 -15.59 -0.205 Aeropostale, Inc. Consumer Discretion... 1.80 -10.72 -0.19

BerwynRelative to R2000V
Relative Weights
Time Period: 1/1/2010 to 3/31/2010
Hardware
Consumer Goods
Software
Energy
Industrial Materials
Media
Health Care
Telecommunications
Consumer Services
Business Services
Utilities
Financial Services
-18.0 -9.0 0.0 9.0 18.0
Contribution
Time Period: 1/1/2010 to 3/31/2010
Consumer Goods
Financial Services
Hardware
Energy
Software
Consumer Services
Health Care
Media
Utilities
Business Services
Telecommunications
Industrial Materials
-5.0 -2.5 0.0 2.5 5.0
Selection Effect
Time Period: 1/1/2010 to 3/31/2010
Consumer Goods
Hardware
Software
Energy
Financial Services
Health Care
Media
Telecommunications
Utilities
Consumer Services
Business Services
Industrial Materials
-3.0 -1.5 0.0 1.5 3.0
Leading ContributorsTime Period: 1/1/2010 to 3/31/2010
Holdings Weight Return Contribution
Wabash National Corporation
American Equity Investment Life Holding Company
Ethan Allen Interiors, Inc.
Hooker Furniture Corporation
Newpark Resources, Inc.
Vasco Data Security International, Inc.
Rudolph Technologies, Inc.
Horace Mann Educators
Stratasys
Fair Isaac, Inc.
1.06 270.90 2.06
3.73 43.15 1.53
1.94 54.28 0.96
2.82 31.00 0.86
3.65 24.11 0.85
3.24 31.37 0.85
2.85 27.98 0.80
3.21 21.16 0.69
1.72 41.71 0.56
2.67 19.02 0.51
Relative Return
Time Period: 1/1/2010 to 3/31/2010
Software
Consumer Goods
Energy
Health Care
Hardware
Media
Financial Services
Utilities
Consumer Services
Business Services
Industrial Materials
Telecommunications
-30.0 -15.0 0.0 15.0 30.0
Weighting Effect
Time Period: 1/1/2010 to 3/31/2010
Utilities
Consumer Goods
Health Care
Business Services
Media
Telecommunications
Software
Industrial Materials
Energy
Consumer Services
Hardware
Financial Services
-0.4 -0.2 0.0 0.2 0.4
Active Return
Time Period: 1/1/2010 to 3/31/2010
Consumer Goods
Hardware
Software
Energy
Health Care
Utilities
Financial Services
Media
Telecommunications
Consumer Services
Business Services
Industrial Materials
-3.0 -1.5 0.0 1.5 3.0
Leading DetractorsTime Period: 1/1/2010 to 3/31/2010
Holdings Weight Return Contribution
Exide Technologies, Inc.
SkyWest, Inc.
Chiquita Brands International
Graham Corporation
Granite Construction Inc.
Gorman-Rupp Company
Ingles Markets, Inc. A
Old National Bancorp
Ennis, Inc.
CIBER, Inc.
3.52 -18.99 -0.71
2.89 -15.60 -0.48
2.82 -12.80 -0.44
3.06 -13.00 -0.44
2.85 -9.84 -0.31
1.14 -7.55 -0.10
1.61 0.44 -0.07
1.85 -3.28 -0.07
3.00 -2.19 -0.06
0.18 8.12 -0.03

BerwynRelative to R2000V
Weighting Effects
Time Period: 1/1/2010 to 3/31/2010
Underperform Outperform Overw
eightU
nderweight
Rela
tive
Wei
ght
Relative Return
-18.00
-9.00
0.00
9.00
18.00
-10.00 -8.00 -6.00 -4.00 -2.00 0.00 2.00 4.00 6.00 8.00 10.00
54
3
2
1
5
43
2
1
Best Weighting Weight +/- Return +/- Effect1 Utilities -3.45 -7.53 0.262 Consumer Goods 8.47 2.83 0.243 Health Care -1.53 -3.58 0.064 Business Services -3.16 -0.73 0.055 Media 1.12 3.18 0.03
Worst Weighting Weight +/- Return +/- Effect1 Financial Services -15.67 2.10 -0.322 Hardware 13.49 -2.37 -0.313 Consumer Services -2.50 5.88 -0.194 Energy 1.73 -4.42 -0.115 Industrial Materials 2.65 -2.09 -0.08
Selection EffectsTime Period: 1/1/2010 to 3/31/2010
Underperform Outperform Overw
eightU
nderweight
Rela
tive
Wei
ght
Relative Return
-4.00
-2.00
0.00
2.00
4.00
-300.00 -240.00 -180.00 -120.00 -60.00 0.00 60.00 120.00 180.00 240.00 300.00
10
9
8
7
654
32
1
10
9
8
76
5
43
2
1
Best Selections Morningstar Sector Weight +/- Return +/- Effect1 Wabash National Corpor... Consumer Goods 1.06 258.11 1.962 American Equity Investm...Financial Services 3.68 31.09 1.093 Vasco Data Security Inte... Software 3.22 26.20 0.694 Newpark Resources, Inc. Energy 3.54 18.58 0.685 Ethan Allen Interiors, Inc. Consumer Goods 1.79 41.49 0.676 Rudolph Technologies, Inc.Hardware 2.75 20.39 0.567 Hooker Furniture Corpora...Consumer Goods 2.76 18.22 0.488 Stratasys Hardware 1.72 34.12 0.479 Horace Mann Educators Financial Services 3.16 9.11 0.29
10 Methode Electronics, Inc...Hardware 2.44 7.11 0.25
Worst Selections Morningstar Sector Weight +/- Return +/- Effect1 Exide Technologies, Inc. Industrial Materials 3.43 -26.85 -0.982 SkyWest, Inc. Business Services 2.77 -24.83 -0.753 Chiquita Brands Internati... Consumer Goods 2.52 -25.59 -0.754 Graham Corporation Industrial Materials 3.05 -20.87 -0.725 Granite Construction Inc. Industrial Materials 2.62 -17.71 -0.526 Ennis, Inc. Consumer Goods 2.83 -14.98 -0.447 Suffolk Bancorp Financial Services 3.41 -7.94 -0.288 Old National Bancorp Financial Services 1.73 -15.33 -0.289 Cohu, Inc. Hardware 2.63 -8.46 -0.23
10 Ingles Markets, Inc. A Consumer Services 1.58 -15.40 -0.23

BerwynRelative to R2000V
Cumulative Attribution Effects
Time Period: 1/1/2010 to 3/31/2010
- Cumulative Attribution Effects
Cumulative Weighting Effect
Cumulative Selection Effect
Cumulative Active Return
Attribution Effects
Weighting Effects
Selection Effects
Active Return
Attribution Effects %
4.00
3.00
2.00
1.00
0.00
-1.00
-2.00
2.00
1.00
0.00
-1.00
01-16-2010 01-23-2010 01-30-2010 02-06-2010 02-13-2010 02-20-2010 02-27-2010 03-06-2010 03-13-2010 03-20-2010 03-27-2010 03-31-2010

BerwynRelative to R2000V
Attribution/Contribution
Time Period: 1/1/2010 to 3/31/2010
PortfolioWeights
BenchmarkWeights
PortfolioRescaledWeights
BenchmarkRescaledWeights
PortfolioReturn
BenchmarkReturn
PortoflioContribution
BenchmarkContribution
WeightingEffect
SelectionEffect
ActiveReturn
Business Services
Consumer Goods
Consumer Services
Energy
Financial Services
Hardware
Health Care
Industrial Materials
Media
Software
Telecommunications
Utilities
Unclassified
Attribution Total
Cash
Equity Missing Performance
Total
4.99 8.67 5.55 8.71 -0.54 9.22 0.04 0.79 0.05 -0.57 -0.53
14.99 8.17 16.67 8.21 24.84 12.79 4.05 1.04 0.24 1.94 2.18
4.98 8.00 5.53 8.03 11.59 15.83 0.46 1.27 -0.19 -0.29 -0.48
5.79 4.69 6.44 4.71 15.03 5.53 0.97 0.26 -0.11 0.65 0.54
16.92 34.35 18.82 34.49 14.67 12.05 2.77 4.10 -0.32 0.49 0.17
16.84 5.21 18.72 5.23 12.56 7.58 2.27 0.40 -0.31 0.98 0.67
2.54 4.33 2.82 4.35 13.20 6.37 0.39 0.28 0.06 0.20 0.25
15.47 14.48 17.19 14.54 -5.88 7.87 -0.83 1.17 -0.08 -2.33 -2.41
1.88 0.97 2.09 0.97 17.57 13.14 0.36 0.12 0.03 0.09 0.13
3.07 1.97 3.42 1.97 26.21 5.17 0.82 0.10 -0.05 0.70 0.65
0.00 2.54 0.00 2.55 9.88 0.00 0.26 0.00 0.00 0.00
2.47 6.17 2.75 6.20 1.03 2.43 0.05 0.15 0.26 -0.04 0.22
0.00 0.03 0.00 0.03 13.29 0.00 0.00 0.00 0.00 0.00
89.94 99.58 100.00 100.00 11.35 9.96 11.35 9.96 -0.42 1.82 1.39
4.64 0.00
5.42 0.42
100.00 100.00 11.35 9.96

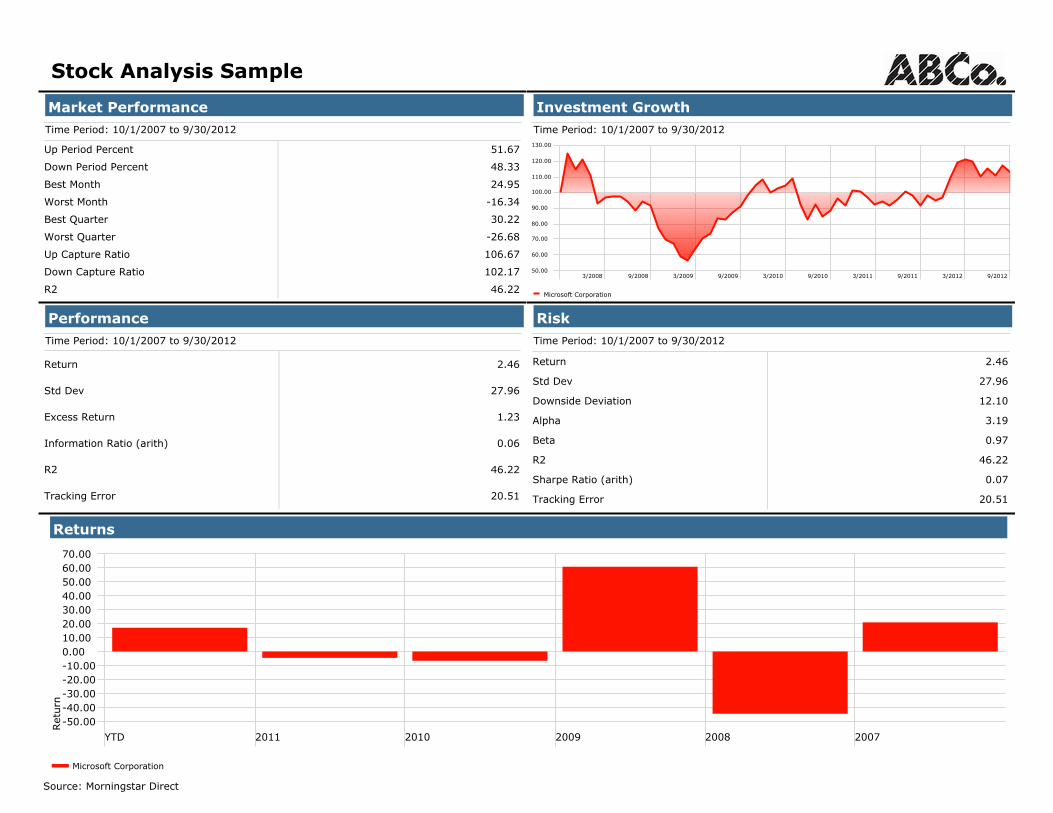
Stock Analysis Sample
Relative to Peer GroupPeer Group (5-95%): Mstar EQ.CR Research
Top Quartile 2nd Quartile 3rd Quartile Bottom Quartile
0.0
5.0
10.0
15.0
20.0
P/E Ratio 5 Yr Avg P/B Ratio 5 Yr Avg P/S Ratio 5 Yr Avg P/C Ratio 3 Yr Avg
25.0
30.0
35.0
40.0
Microsoft Corporation Adobe Systems Inc. IntuitOracle Corporation Sap AG ADR
Returns-Based Style AllocationTime Period: 10/1/2007 to 9/30/2012
-100.0 -50.0 0.0 50.0 100.0 150.0 200.0
Russell 1000 Value TR USD
Russell 1000 Growth TR USD
Russell 2000 Value TR USD
Russell 2000 Growth TR USD
Microsoft Corporation
Adobe Systems Inc.
Intuit
Oracle Corporation
Sap AG ADR
Equity Characteristics
0.0 10.0 20.0 30.0
P/E Ratio 5 Yr Avg
P/B Ratio 5 Yr Avg
P/S Ratio 5 Yr Avg
P/C Ratio 3 Yr Avg
Microsoft Corporation
Adobe Systems Inc.
Intuit
Oracle Corporation
Sap AG ADR
Source: Morningstar Direct

Stock Analysis Sample
Price/BookTime Period: 10/1/2007 to 9/30/2012
P/B -
Dai
ly
2008 2009 2010 2011 20120.00
2.00
4.00
6.00
8.00
10.00
12.00
Microsoft Corporation Adobe Systems Inc. IntuitOracle Corporation Sap AG ADR
Price/EarningsTime Period: 10/1/2007 to 9/30/2012
P/E -
Dai
ly
2008 2009 2010 2011 20127.50
15.00
22.50
30.00
37.50
45.00
52.50
60.00
Microsoft Corporation Adobe Systems Inc. IntuitOracle Corporation Sap AG ADR
Price/Free Cash FlowTime Period: 10/1/2007 to 9/30/2012
P/FC
F -
Dai
ly
2008 2009 2010 2011 20120.00
20.00
40.00
60.00
80.00
100.00
Microsoft Corporation Adobe Systems Inc. IntuitOracle Corporation Sap AG ADR
Price/SalesTime Period: 10/1/2007 to 9/30/2012
P/S -
Dai
ly
2008 2009 2010 2011 20122.00
4.00
6.00
8.00
10.00
Microsoft Corporation Adobe Systems Inc. IntuitOracle Corporation Sap AG ADR
Source: Morningstar Direct
Stock Analysis Sample
Market PerformanceTime Period: 10/1/2007 to 9/30/2012
Up Period Percent
Down Period Percent
Best Month
Worst Month
Best Quarter
Worst Quarter
Up Capture Ratio
Down Capture Ratio
R2
102.17
106.67
51.67
48.33
24.95
-16.34
30.22
-26.68
46.22
Investment GrowthTime Period: 10/1/2007 to 9/30/2012
3/2008 9/2008 3/2009 9/2009 3/2010 9/2010 3/2011 9/2011 3/2012 9/201250.00
60.00
70.00
80.00
90.00
100.00
110.00
120.00
130.00
Microsoft Corporation
PerformanceTime Period: 10/1/2007 to 9/30/2012
Return
Std Dev
Excess Return
Information Ratio (arith)
R2
Tracking Error
2.46
27.96
1.23
0.06
46.22
20.51
RiskTime Period: 10/1/2007 to 9/30/2012
Return
Std Dev
Downside Deviation
Alpha
Beta
R2
Sharpe Ratio (arith)
Tracking Error
2.46
27.96
12.10
3.19
0.97
46.22
0.07
20.51
Returns
Ret
urn
YTD 2011 2010 2009 2008 2007
-50.00-40.00-30.00-20.00-10.000.0010.0020.0030.0040.0050.0060.0070.00
Microsoft Corporation
Source: Morningstar Direct

Stock Analysis Sample
3 Year Window Rolling ReturnsTime Period: 10/1/2007 to 9/30/2012
Rolling Window: 3 Years 1 Month shift
Ret
urn
10 11 12
2011
01 02 03 04 05 06 07 08 09 10 11 12
2012
01 02 03 04 05 06 07 08 09-22.50
-15.00
-7.50
0.00
7.50
15.00
22.50
30.00
37.50
Microsoft Corporation Adobe Systems Inc. Intuit
Oracle Corporation Sap AG ADR
Morningstar Equity StatisticsEquityStyleBox
(Long)
MorningstarRatingOverall
P/ERatio
(TTM)(Long)
EPS TTMEarningsYield %
TTM
Revenue(mil)TTM
Microsoft Corporation
Adobe Systems Inc.
Intuit
Oracle Corporation
Sap AG ADR
É ÙÙÙ 20.70 1.57 4.71 4,402.41
É ÙÙÙÙ 15.60 2.02 6.33 36,928.00
È ÙÙÙÙ 14.88 2.00 6.78 73,723.00
É ÙÙ 23.36 2.60 4.15 4,151.00
É 18.59 2.98 5.36 19,675.98
Source: Morningstar Direct

Stock Analysis Sample
Revenue Growth % 3 YrTime Period: 1/1/2008 to 12/31/2011
Rev
enue
Gro
wth
% 3
Yr
2008 2009 2010 20110.00
5.00
10.00
15.00
20.00
25.00
Microsoft Corporation Adobe Systems Inc. IntuitOracle Corporation Sap AG ADR
Net Income Growth % 3 YrTime Period: 1/1/2008 to 12/31/2011
Net
Inco
me
Gro
wth
% 3
Yr
2008 2009 2010 2011-10.00
-5.00
0.00
5.00
10.00
15.00
20.00
25.00
Source: Morningstar Direct

Stock Analysis Sample
Trailing Returns
Ret
urn
YTD 1 year 3 years 5 years 10 years
-10.00
-5.00
0.00
5.00
10.00
15.00
20.00
25.00
30.00
35.00
40.00
45.00
Microsoft Corporation Adobe Systems Inc. Intuit
Oracle Corporation Sap AG ADR
Trailing ReturnsData Point: Return
YTD 1 year 3 years 5 years 10 years 15 years
Microsoft Corporation
Adobe Systems Inc.
Intuit
Oracle Corporation
Sap AG ADR
5.912.467.4922.8716.93 5.85
13.04-5.77-0.6134.2014.73 11.69
21.405.1114.4643.3537.05 8.89
10.0914.4627.8325.5012.85 17.45
15.218.3815.6310.3823.43 11.80
Source: Morningstar Direct

Stock Analysis Sample
Monthly Market ReturnTime Period: 10/1/2011 to 9/30/2012
Month
ly M
arke
t Ret
urn
12/2011 3/2012 6/2012 9/2012-20.00
-15.00
-10.00
-5.00
0.00
5.00
10.00
15.00
20.00
25.00
Microsoft Corporation Adobe Systems Inc. Intuit
Oracle Corporation Sap AG ADR
Upside-Downside CaptureTime Period: 10/1/2007 to 9/30/2012
Up C
aptu
re R
atio
Down Capture Ratio
0.00 30.00 60.00 90.00 120.00 150.00 180.00 210.00
0.00
30.00
60.00
90.00
120.00
150.00 Microsoft Corporation
Adobe Systems Inc.
Intuit
Oracle Corporation
Sap AG ADR
Market PerformanceTime Period: 10/1/2007 to 9/30/2012
UpPeriod
Percent
DownPeriod
Percent
BestMonth
WorstMonth
BestQuarter
WorstQuarter
UpCapture
Ratio
DownCapture
RatioR2
Microsoft Corporation
Adobe Systems Inc.
Intuit
Oracle Corporation
Sap AG ADR
102.17106.6751.67 48.33 24.95 -16.34 30.22 -26.68 46.22
158.83133.5453.33 46.67 28.08 -32.51 32.30 -46.06 65.87
98.67112.6551.67 48.33 19.24 -33.88 31.86 -32.21 59.36
61.15107.0258.33 41.67 18.47 -20.72 26.00 -24.74 29.61
98.60124.0058.33 41.67 22.91 -18.18 25.38 -16.37 53.77
Source: Morningstar Direct

Stock Analysis Sample
Risk-RewardTime Period: 10/1/2007 to 9/30/2012
Ret
urn
Std Dev
0.00 10.00 20.00 30.00 40.00 50.00
-9.00
-5.00
-1.00
3.00
7.00
11.00
15.00
19.00 Microsoft Corporation
Adobe Systems Inc.
Intuit
Oracle Corporation
Sap AG ADR
RiskTime Period: 10/1/2007 to 9/30/2012
Return Std DevDownsideDeviation
Alpha Beta R2Sharpe
Ratio(arith)
TrackingError
Microsoft Corporation
Adobe Systems Inc.
Intuit
Oracle Corporation
Sap AG ADR
2.46 27.96 46.2212.10 3.19 0.97 0.07 20.51
-5.77 36.92 65.8716.70 -3.63 1.53 -0.17 23.95
5.11 31.27 59.3613.62 6.33 1.23 0.15 20.47
14.46 26.40 29.6115.26 14.59 0.73 0.53 22.78
8.38 29.03 53.7712.50 8.81 1.09 0.27 19.83
Source: Morningstar Direct

Stock Analysis Sample
Sharpe Ratio
Shar
pe
Rat
io
3 years 5 years 10 years 15 years0.00
0.18
0.35
0.53
0.70
0.88
1.05
1.23
1.40
Microsoft Corporation Adobe Systems Inc. IntuitOracle Corporation Sap AG ADR
Standard Deviation
Std
Dev
3 years 5 years 10 years 15 years0.005.0010.0015.0020.0025.0030.0035.0040.0045.0050.00
Microsoft Corporation Adobe Systems Inc. IntuitOracle Corporation Sap AG ADR
Beta
Bet
a
3 years 5 years 10 years 15 years0.000.180.360.540.720.901.081.261.441.621.80
Microsoft Corporation Adobe Systems Inc. IntuitOracle Corporation Sap AG ADR
Source: Morningstar Direct

Historical Price Ratios
Price/BookTime Period: 6/1/2005 to 5/31/2010
P/B -
Dai
ly
2005 2006 2007 2008 2009 20103
3.5
4
4.5
5
5.5
6
6.5
Abbott Laboratories
Price/EarningsTime Period: 6/1/2005 to 5/31/2010
P/E -
Dai
ly
2005 2006 2007 2008 2009 20107.5
15
22.5
30
37.5
45
52.5
60
67.5
Abbott Laboratories
Price/Free Cash Flow
Time Period: 6/1/2005 to 5/31/2010
P/FC
F -
Dai
ly
2005 2006 2007 2008 2009 201010
15
20
25
30
35
Abbott Laboratories
Price/Sales
Time Period: 6/1/2005 to 5/31/2010
P/S -
Dai
ly
2005 2006 2007 2008 2009 20102
2.25
2.5
2.75
3
3.25
3.5
3.75
4
4.25
Abbott Laboratories

Return History
3 Year Window Rolling ReturnsTime Period: 6/1/2005 to 5/31/2010
Ret
urn
2008/08 2008/11 2009/02 2009/05 2009/08 2009/11 2010/02 2010/05-5
0
5
10
15
Abbott Laboratories
Trailing Returns
Ret
urn
YTD 1 year 3 years 5 years 10 years-12
-10
-8
-6
-4
-2
0
2
4
6
8
10
Abbott Laboratories
Price / Fair ValueTime Period: 6/1/2005 to 5/28/2010
Pric
e /
Fair V
alue
2005/11 2006/05 2006/11 2007/05 2007/11 2008/05 2008/11 2009/05 2009/11 2010/050.6
0.7
0.8
0.9
1
1.1
1.2
Abbott Laboratories

Historical Price and Volume
Daily Price
Time Period: 6/1/2005 to 5/28/2010
Dai
ly C
losi
ng P
rice
2005/11 2006/05 2006/11 2007/05 2007/11 2008/05 2008/11 2009/05 2009/11 2010/0537.5
40
42.5
45
47.5
50
52.5
55
57.5
60
62.5
Abbott Laboratories
Daily VolumeTime Period: 6/1/2005 to 5/28/2010
Dai
ly V
olu
me
2005/11 2006/05 2006/11 2007/05 2007/11 2008/05 2008/11 2009/05 2009/11 2010/050
5M
10M
15M
20M
25M
30M

Growth
Revenue Growth % 3 Yr
Time Period: 1/1/2005 to 12/31/2009
Rev
enue
Gro
wth
% 3
Yr
2005 2006 2007 2008 20090
2
4
6
8
10
12
14
Abbott Laboratories
Net Margin %
Time Period: 1/1/2005 to 12/31/2009
Net
Mar
gin
% 1
Yr
2005 2006 2007 2008 20090
2.5
5
7.5
10
12.5
15
17.5
20
Abbott Laboratories
Net Income Growth % 3 YrTime Period: 1/1/2005 to 12/31/2009
Net
Inco
me
Gro
wth
% 3
Yr
2005 2006 2007 2008 2009-15
-7.5
0
7.5
15
22.5
30
37.5
45
52.5
Gross Margin %Time Period: 1/1/2005 to 12/31/2009
Gro
ss M
argin
% 1
Yr
2005 2006 2007 2008 20090
7.5
15
22.5
30
37.5
45
52.5
60

Microsoft Corporation
Microsoft Corporation - Market PerformanceTime Period: 9/1/2007 to 8/31/2012
Inv Bmk1Up Period Percent
Down Period Percent
Best Month
Worst Month
Best Quarter
Worst Quarter
Up Capture Ratio
Down Capture Ratio
R2
53.33
46.67
24.95
-16.34
30.22
-26.68
100.0047.00
-22.48
16.50
-17.46
11.21
41.67
58.33
100.00
100.00
110.14
102.17
Investment GrowthTime Period: 9/1/2007 to 8/31/2012
2/2008 8/2008 2/2009 8/2009 2/2010 8/2010 2/2011 8/2011 2/2012 8/201250.00
60.00
70.00
80.00
90.00
100.00
110.00
120.00
130.00
Microsoft Corporation Russell 1000 TR USD
Microsoft Corporation - PerformanceTime Period: 9/1/2007 to 8/31/2012
Inv Bmk1
Return
Std Dev
Excess Return
Information Ratio (arith)
R2
Tracking Error
3.70
27.91
0.11
2.23 0.00
0.0020.32
19.58
100.0047.00
1.47
Microsoft Corporation - RiskTime Period: 9/1/2007 to 8/31/2012
Inv Bmk1
Return
Std Dev
Downside Deviation
Alpha
Beta
R2
Sharpe Ratio (arith)
Tracking Error
3.70
27.91
0.11
0.0020.32
0.04
1.000.97
0.004.13
0.0011.81
19.58
100.0047.00
1.47
Returns
Ret
urn
YTD 2011 2010 2009 2008 2007
-50.00-40.00-30.00-20.00-10.000.0010.0020.0030.0040.0050.0060.0070.00
Microsoft Corporation Russell 1000 TR USD
Source: Morningstar Direct

Historical Price Ratios
Price/BookTime Period: 9/1/2007 to 8/31/2012
P/B -
Dai
ly
2008 2009 2010 2011 20120.00
2.00
4.00
6.00
8.00
10.00
12.00
Microsoft Corporation Adobe Systems Inc. IntuitOracle Corporation Sap AG ADR
Price/EarningsTime Period: 9/1/2007 to 8/31/2012
P/E -
Dai
ly
2008 2009 2010 2011 20127.50
15.00
22.50
30.00
37.50
45.00
52.50
60.00
Microsoft Corporation Adobe Systems Inc. IntuitOracle Corporation Sap AG ADR
Price/Free Cash FlowTime Period: 9/1/2007 to 8/31/2012
P/FC
F -
Dai
ly
2008 2009 2010 2011 20120.00
20.00
40.00
60.00
80.00
100.00
Microsoft Corporation Adobe Systems Inc. IntuitOracle Corporation Sap AG ADR
Price/SalesTime Period: 9/1/2007 to 8/31/2012
P/S -
Dai
ly
2008 2009 2010 2011 20122.00
4.00
6.00
8.00
10.00
Microsoft Corporation Adobe Systems Inc. IntuitOracle Corporation Sap AG ADR
Source: Morningstar Direct

Competitive Analysis
3 Year Window Rolling ReturnsTime Period: 9/1/2007 to 8/31/2012
Rolling Window: 3 Years 1 Month shift
Ret
urn
09 10 11 12
2011
01 02 03 04 05 06 07 08 09 10 11 12
2012
01 02 03 04 05 06 07 08-20.00
-10.00
0.00
10.00
20.00
30.00
40.00
Microsoft Corporation Adobe Systems Inc. IntuitOracle Corporation Sap AG ADR Russell 1000 TR USD
Morningstar Equity StatisticsEquityStyleBox
(Long)
MorningstarRatingOverall
P/ERatio
(TTM)(Long)
EPS TTMEarningsYield %
TTM
Revenue(mil)TTM
Microsoft Corporation
Adobe Systems Inc.
Intuit
Oracle Corporation
Sap AG ADR
Russell 1000 TR USD
Ç ÙÙÙÙ 14.73 2.00 6.58 73,723.00
É ÙÙÙ 19.84 1.56 4.95 4,335.04
É ÙÙÙÙ 15.41 1.96 6.21 37,121.00
È 14.84
É ÙÙ 24.39 2.38 4.06 4,151.00
É ÙÙ 17.24 2.98 5.67 19,675.98
Source: Morningstar Direct

Growth
Revenue Growth % 3 YrTime Period: 1/1/2008 to 12/31/2011
Rev
enue
Gro
wth
% 3
Yr
2008 2009 2010 20110.00
5.00
10.00
15.00
20.00
25.00
Microsoft Corporation Adobe Systems Inc. IntuitOracle Corporation Sap AG ADR Russell 1000 TR USD
Net Income Growth % 3 YrTime Period: 1/1/2008 to 12/31/2011
Net
Inco
me
Gro
wth
% 3
Yr
2008 2009 2010 2011-10.00
-5.00
0.00
5.00
10.00
15.00
20.00
25.00
Source: Morningstar Direct

Trailing Return History
Trailing Returns
Ret
urn
YTD 1 year 3 years 5 years 10 years
-10.00
-5.00
0.00
5.00
10.00
15.00
20.00
25.00
30.00
Microsoft Corporation Adobe Systems Inc. IntuitOracle Corporation Sap AG ADR Russell 1000 TR USD
Trailing ReturnsData Point: Return
YTD 1 year 3 years 5 years 10 years 15 years
Microsoft Corporation
Adobe Systems Inc.
Intuit
Oracle Corporation
Sap AG ADR
Russell 1000 TR USD
21.10
10.61
12.20
24.18
26.15
19.07
23.89
19.99
13.70
22.54
10.30
-0.16
28.70
14.00
11.43
3.70
-6.06
16.73
9.94
5.09
5.06
11.78
10.25
13.01
14.10
6.11
13.27
19.00
11.51
9.32
17.33 5.146.861.4713.37 13.82
Source: Morningstar Direct

Market Movement
Monthly Market ReturnTime Period: 9/1/2009 to 8/31/2012
Month
ly M
arke
t Ret
urn
2/2010 8/2010 2/2011 8/2011 2/2012 8/2012-22.50
-15.00
-7.50
0.00
7.50
15.00
22.50
30.00
Microsoft Corporation Adobe Systems Inc. IntuitOracle Corporation Sap AG ADR Russell 1000 TR USD
Upside-Downside CaptureTime Period: 9/1/2007 to 8/31/2012
Up C
aptu
re R
atio
Down Capture Ratio
0.00 30.00 60.00 90.00 120.00 150.00 180.00 210.00
0.00
30.00
60.00
90.00
120.00
150.00 Microsoft Corporation
Adobe Systems Inc.
Intuit
Oracle Corporation
Sap AG ADR
Russell 1000 TR USD
Market PerformanceTime Period: 9/1/2007 to 8/31/2012
UpPeriod
Percent
DownPeriod
Percent
BestMonth
WorstMonth
BestQuarter
WorstQuarter
UpCapture
Ratio
DownCapture
RatioR2
Microsoft Corporation
Adobe Systems Inc.
Intuit
Oracle Corporation
Sap AG ADR
Russell 1000 TR USD
53.33
53.33
58.33
60.00
51.67
46.67
46.67
41.67
40.00
48.33
24.95
28.08
18.47
22.91
19.24
-16.34
-32.51
-20.72
-18.18
-33.88
30.22
32.30
26.00
25.38
31.86
-26.68
-46.06
-24.74
-16.37
-32.21
100.00
59.58
54.40
30.17
65.67
47.00
-22.4816.50-17.4611.2141.6758.33 100.00 100.00
111.56 98.67
128.20 98.60
113.30 61.15
131.21 158.83
110.14 102.17
Source: Morningstar Direct

Risk Statistics
Risk-RewardTime Period: 9/1/2007 to 8/31/2012
Ret
urn
Std Dev
0.00 10.00 20.00 30.00 40.00 50.00
-10.00
0.00
10.00
20.00
30.00 Microsoft CorporationAdobe Systems Inc.IntuitOracle CorporationSap AG ADRRussell 1000 TR USD
RiskTime Period: 9/1/2007 to 8/31/2012
Return Std DevDownsideDeviation
Alpha Beta R2Sharpe
Ratio(arith)
TrackingError
Microsoft Corporation
Adobe Systems Inc.
Intuit
Oracle Corporation
Sap AG ADR
Russell 1000 TR USD
3.70
-6.06
16.73
9.94
5.09
27.91
36.89
26.74
29.14
31.26
0.11
-0.18
0.60
0.32
0.14
0.00
20.40
19.78
22.89
23.95
20.32
0.041.00
1.23
1.10
0.75
1.52
0.97
0.00
6.02
9.99
16.42
-4.28
4.13
0.00
13.62
12.42
15.23
16.72
11.81
19.58 100.00
59.58
54.40
30.17
65.67
47.00
1.47
Source: Morningstar Direct

Risk Statistics
Sharpe Ratio
Shar
pe
Rat
io
3 years 5 years 10 years 15 years-0.20
0.00
0.20
0.40
0.60
0.80
1.00
1.20
1.40
Microsoft Corporation Adobe Systems Inc. IntuitOracle Corporation Sap AG ADR Russell 1000 TR USD
Standard Deviation
Std
Dev
3 years 5 years 10 years 15 years0.005.0010.0015.0020.0025.0030.0035.0040.0045.0050.00
Microsoft Corporation Adobe Systems Inc. IntuitOracle Corporation Sap AG ADR Russell 1000 TR USD
Beta
Bet
a
3 years 5 years 10 years 15 years0.000.180.360.540.720.901.081.261.441.621.80
Microsoft Corporation Adobe Systems Inc. IntuitOracle Corporation Sap AG ADR Russell 1000 TR USD
Source: Morningstar Direct

Starbucks CorporationSBUX
Stock PriceTime Period: 9/1/2007 to 8/31/2012
Daily
Clo
sing
Pric
e
2007 2008 2009 2010 2011 20120.0
750.0
1,500.0
2,250.0
3,000.0
3,750.0
4,500.0
5,250.0
6,000.0
Daily
Vol
ume
2007 2008 2009 2010 2011 20120M
19M
38M
57M
76M
Growth of 10,000Time Period: 9/1/2002 to 8/31/2012
2002 2003 2004 2005 2006 2007 2008 2009 2010 2011 20122,500
10,000
17,500
25,000
32,500
40,000
47,500
55,000
62,500
Trailing Returns
Retu
rn
1 day 1 week 1 month 3 month YTD 1 year 3 years 5 years 10 years 15 years-5.0
0.0
5.0
10.0
15.0
20.0
25.0
30.0
35.0
40.0
45.0
16.717.813.4
40.3
34.2
9.0
-4.5
13.4
0.0 1.00.0-0.2
1.4
10.713.5
22.5
14.3
1.3
7.04.7
Company ProfileSector
Industry
Equity Style Box (Long)
Last Close
Price 52 Wk High
Price 52 Wk Low
Market Cap (mil) (Daily)
Avg Daily Volume (1 Mo)
P/E Ratio Forward
P/B Ratio Current
P/S Ratio Current
P/C Ratio Current
Firm Phone
Firm Web Address
Consumer Cyclical
Restaurants
É
49.51
62.00
35.12
37,627.60
7,727,887
22.37
6.99
2.95
23.70
+1 206 447-1575
http://www.starbucks.com
Rating and GradeMorningstar Rating Overall
Economic Moat
Morningstar Stewardship Grade
Growth Grade
Profitability Grade
Financial Health Grade
Morningstar Fair Value per Share
Fair Value Uncertainty
Consider Buying
Consider Selling
Morningstar Credit Rating
ÙÙÙ
Wide
C
C
A
53.00
Medium
37.10
71.55
A-
DividendsLatest Dividend Date
Latest Dividend
Dividend Yield % TTM
Forward Dividend Yield %
Annual Dividend 2011
Annual Dividend 2010
Annual Dividend 2009
Annual Dividend 2008
Annual Dividend 2007
8/6/2012
0.17
1.37
1.37
0.56
0.36
Source: Morningstar Direct

Starbucks CorporationSBUX
Historical Valuation - Price/Fair ValueTime Period: 9/1/2007 to 8/31/2012
Pric
e / F
air V
alue
2/2008 8/2008 2/2009 8/2009 2/2010 8/2010 2/2011 8/2011 2/2012 8/20120.2
0.4
0.6
0.8
1.0
1.2
1.4
1.6
Historical Valuation - Price/BookTime Period: 9/1/2007 to 8/31/2012
P/B
- Dai
ly
2008 2009 2010 2011 20122.0
4.0
6.0
8.0
10.0
Historical Valuation - Price/EarningsTime Period: 9/1/2007 to 8/31/2012
P/E
- Dai
ly
2008 2009 2010 2011 20120.0
20.0
40.0
60.0
80.0
100.0
120.0
140.0
Historical Valuation - Price/Free Cash FlowTime Period: 9/1/2007 to 8/31/2012
P/FC
F - D
aily
2008 2009 2010 2011 20120.0
20.0
40.0
60.0
80.0
100.0
120.0
Historical Valuation - Price/SalesTime Period: 9/1/2007 to 8/31/2012
P/S
- Dai
ly
2008 2009 2010 2011 20120.5
1.0
1.5
2.0
2.5
3.0
3.5
4.0
Source: Morningstar Direct

Starbucks CorporationSBUX
Revenue Growth % 3 YrTime Period: 1/1/2008 to 12/31/2011
Reve
nue
Grow
th %
3 Y
r
2008 2009 2010 20110.0
5.0
10.0
15.0
20.0
17.7
7.9
4.4 4.1
Net Income Growth % 3 YrTime Period: 1/1/2008 to 12/31/2011
Net I
ncom
e Gr
owth
% 3
Yr
2008 2009 2010 2011-20.0
0.0
20.0
40.0
60.0
-13.9-11.5
12.0
58.1
Gross Margin % 1 YrTime Period: 1/1/2008 to 12/31/2011
Gros
s M
argi
n %
1 Y
r
2008 2009 2010 20110.0
10.0
20.0
30.0
40.0
50.0
60.055.3 55.8
58.4 57.7
CFO Growth % 3 YrTime Period: 1/1/2008 to 12/31/2011
CFO
Grow
th %
3 Y
r
2008 2009 2010 20110.0
2.0
4.0
6.0
8.0
10.0
12.010.9
7.1
8.6 8.6
Net Margin % 1 YrTime Period: 1/1/2008 to 12/31/2011
Net M
argi
n %
1 Y
r
2008 2009 2010 20110.0
2.0
4.0
6.0
8.0
10.0
12.0
3.0
4.0
8.8
10.7
FCF Growth % 3 YrTime Period: 1/1/2008 to 12/31/2011
FCF
Grow
th %
3 Y
r
2008 2009 2010 2011-20.0
0.0
20.0
40.0
60.0
80.0
-0.7
37.8
71.4
58.0
Source: Morningstar Direct

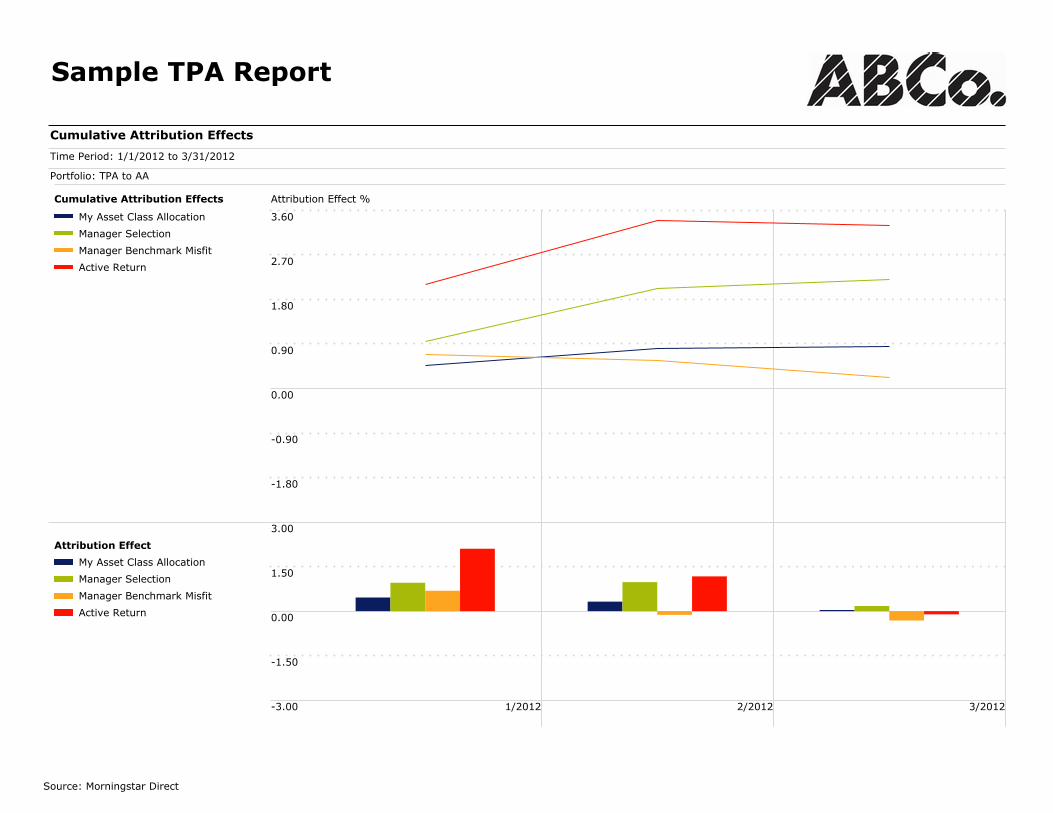
Sample TPA Report
Portfolio Weights
Portfolio Date: 12/31/2011
Portfolio: TPA to AA
%
US Large Cap 20.0
US Small Cap 10.0
Intl Equity 20.0
US Fixed Inc 10.0
US High Yield Fixed Inc 10.0
Intl Fixed Inc 10.0
Real Estate 10.0
Commodities 10.0
Total 100.0
Policy Weights
Portfolio Date: 12/31/2011
Portfolio: TPA to AA
%
US Large Cap 20.0
US Small Cap 10.0
Intl Equity 15.0
US Fixed Inc 15.0
US High Yield Fixed Inc 15.0
Intl Fixed Inc 10.0
Real Estate 5.0
Commodities 10.0
Total 100.0
Source: Morningstar Direct

Sample TPA Report
Contribution
0.0 0.8 1.5 2.3 3.0 3.8
Allocation
0.0 0.1 0.2 0.3 0.4
Manager Selection
-0.2 0.0 0.2 0.4 0.6 0.8
Active Return
-0.5 0.0 0.5 1.0 1.5
Top 5 Asset Class Contributors
GroupingsActual
Weights
PortfolioNet
Return
RelativeNet
Return
PortfolioContribution
ActiveReturn
US Large Cap
Intl Equity
Real Estate
US Small Cap
US High Yield Fixed Inc
20.00 17.53 2.84 3.48 0.54
20.00 15.31 5.79 3.04 1.27
10.00 12.46 -0.43 1.24 0.24
10.00 9.90 -2.54 0.99 -0.25
10.00 9.68 4.35 0.97 0.53
Top 5 Manager Contributors
HoldingsActual
Weights
PortfolioNet
Return
RelativeNet
Return
PortfolioContribution
ActiveReturn
Harbor Capital Appreciation Instl
Lazard Emerging Markets Equity Instl
Harris Assoc. Large Cap Value
Hansberger International Core Equity
DWS RREEF Global Real Estate Secs I
10.00 19.08 4.39 1.89 0.42
10.00 17.32 3.25 1.71 0.78
10.00 15.99 3.09 1.59 0.13
10.00 13.30 2.07 1.33 0.38
10.00 12.46 -0.06 1.24 -0.04
Top 5 Asset Class Detractors
GroupingsActual
Weights
PortfolioNet
Return
RelativeNet
Return
PortfolioContribution
ActiveReturn
Intl Fixed Inc
US Fixed Inc
Commodities
US High Yield Fixed Inc
US Small Cap
10.00 1.96 0.80 0.19 0.08
10.00 2.88 2.58 0.29 0.62
10.00 3.19 2.31 0.31 0.24
10.00 9.68 4.35 0.97 0.53
10.00 9.90 -2.54 0.99 -0.25
Top 5 Manager Detractors
HoldingsActual
Weights
PortfolioNet
Return
RelativeNet
Return
PortfolioContribution
ActiveReturn
T. Rowe Price International Bond Adv
PIMCO Total Return Instl
PIMCO Commodity Real Ret Strat Instl
Loomis Sayles High Income A Load Waived
Diamond Hill Small Cap Equity
10.00 1.96 2.18 0.19 0.08
10.00 2.88 2.16 0.29 0.27
10.00 3.19 2.31 0.31 0.24
10.00 9.68 4.53 0.97 0.44
10.00 9.90 -1.69 0.99 -0.25
Source: Morningstar Direct

Sample TPA Report
Allocation Effects
Time Period: 1/1/2012 to 3/31/2012
Portfolio: TPA to AA
Underperform Outperform
Overw
eig
ht
Un
derw
eig
ht
Rel
ativ
e W
eight
Relative Return
6.00
3.00
0.00
-3.00
-6.00-10.00 -8.00 -6.00 -4.00 -2.00 0.00 2.00 4.00 6.00 8.00 10.00
4 32 1
4
3 2
1
Best Weighting Weight +/- Return +/- Effect
1 US Fixed Inc -5.00 -6.92 0.35
2 Real Estate 5.00 5.67 0.28
3 Intl Equity 5.00 2.30 0.12
4 US High Yield Fixed Inc -5.00 -1.89 0.10
Worst Weighting Weight +/- Return +/- Effect
1 US Large Cap 0.00 7.46 0.00
2 Intl Fixed Inc 0.00 -6.07 0.00
3 US Small Cap 0.00 5.21 0.00
4 Commodities 0.00 -6.34 0.00
Source: Morningstar Direct

Sample TPA Report
Attribution
Time Period: 1/1/2012 to 3/31/2012
Portfolio: TPA to AA
GroupingsActual
WeightsPolicy
Weights
PortfolioGross
Return
PolicyGross
Return
PortfolioNet
Return
PolicyNet
Return
PortfolioContribution
PolicyContribution
AllocationEffect
SelectionEffect
ManagerMisfit
ManagerFee
ActiveReturn
US Large Cap
US Small Cap
Intl Equity
US Fixed Inc
US High Yield Fixed Inc
Intl Fixed Inc
Real Estate
Commodities
Total
20.00 20.00 17.63 14.69 17.53 14.69 3.48 2.89 0.00 0.72 -0.17 0.54
10.00 10.00 9.90 12.44 9.90 12.44 0.99 1.23 0.00 -0.17 -0.08 -0.25
20.00 15.00 15.47 9.52 15.31 9.52 3.04 1.43 0.12 0.51 0.64 1.27
10.00 15.00 3.00 0.30 2.88 0.30 0.29 0.04 0.35 0.23 0.04 0.62
10.00 15.00 10.00 5.34 9.68 5.34 0.97 0.80 0.10 0.46 -0.02 0.53
10.00 10.00 2.26 1.16 1.96 1.16 0.19 0.11 0.00 0.23 -0.14 0.08
10.00 5.00 12.75 12.90 12.46 12.90 1.24 0.64 0.28 -0.01 -0.04 0.24
10.00 10.00 3.38 0.89 3.19 0.89 0.31 0.09 0.00 0.24 0.00 0.24
100.00 100.00 10.69 7.23 10.51 7.23 10.51 7.23 0.85 2.21 0.23 3.29
Source: Morningstar Direct
Sample TPA Report
Cumulative Attribution Effects
Time Period: 1/1/2012 to 3/31/2012
Portfolio: TPA to AA
1/2012 2/2012 3/2012
3.60
2.70
1.80
0.90
0.00
-0.90
-1.80
3.00
1.50
0.00
-1.50
-3.00
Cumulative Attribution Effects Attribution Effect %
My Asset Class Allocation
Manager Selection
Manager Benchmark Misfit
Active Return
Attribution Effect
My Asset Class Allocation
Manager Selection
Manager Benchmark Misfit
Active Return
Source: Morningstar Direct

Sample TPA Report
Portfolio Allocation Stacked Bar
Time Period: 1/1/2012 to 3/31/2012
Portfolio: TPA to AA
0.0
10.0
20.0
30.0
40.0
50.0
60.0
70.0
80.0
90.0
100.0
1/2012 2/2012 3/2012
US Large Cap US Small Cap Intl Equity
US Fixed Inc US High Yield Fixed Inc Intl Fixed Inc
Real Estate Commodities
Source: Morningstar Direct

Sample TPA Report
Attribution
Time Period: 1/1/2012 to 3/31/2012
Portfolio: TPA to AA
HoldingsActual
WeightsPolicy
Weights
PortfolioGross
Return
PolicyGross
Return
PortfolioNet
Return
PolicyNet
Return
PortfolioContribution
SelectionEffect
ManagerMisfit
ManagerFee
ActiveReturn
Harbor Capital Appreciation Instl
Harris Assoc. Large Cap Value
Diamond Hill Small Cap Equity
Lazard Emerging Markets Equity Instl
Hansberger International Core Equity
PIMCO Total Return Instl
Loomis Sayles High Income A Load Waived
T. Rowe Price International Bond Adv
DWS RREEF Global Real Estate Secs I
PIMCO Commodity Real Ret Strat Instl
10.00 19.28 14.69 19.08 14.69 1.89 0.42 0.00 0.42
10.00 15.99 12.90 15.99 12.90 1.59 0.30 -0.17 0.13
10.00 9.90 11.59 9.90 11.59 0.99 -0.17 -0.08 -0.25
10.00 17.65 14.07 17.32 14.07 1.71 0.31 0.47 0.78
10.00 13.30 11.23 13.30 11.23 1.33 0.21 0.17 0.38
10.00 3.00 0.72 2.88 0.72 0.29 0.23 0.04 0.27
10.00 10.00 5.15 9.68 5.15 0.97 0.46 -0.02 0.44
10.00 2.26 -0.22 1.96 -0.22 0.19 0.23 -0.14 0.08
10.00 12.75 12.52 12.46 12.52 1.24 -0.01 -0.04 -0.04
10.00 3.38 0.89 3.19 0.89 0.31 0.24 0.00 0.24
Source: Morningstar Direct

RS Funds XYZ Software: The ABC Insurance & Annuity Co., Inc.
Manager StyleTime Period: 10/1/2007 to 9/30/2012
Rolling Window: 1 Year 1 Month shift
Russell 1000 Value TR USD
Russell 1000 Growth TR USD
Russell 2000 Value TR USD
Russell 2000 Growth TR USD
Manager A
Manager B
Manager C
Russell Midcap Growth
FOR BROKER DEALER AND INSTITUTIONAL USE ONLY. NOT FOR PUBLIC OR CLIENT USE.
Created with XYZ Software. Manager returns supplied by: Morningstar, Inc.

RS Funds XYZ Software: The ABC Insurance & Annuity Co., Inc.
Risk / ReturnTime Period: 10/1/2007 to 9/30/2012
Ret
urn
Standard Deviation
0.0 10.0 20.0 30.0 40.0
-11.0
-7.0
-3.0
1.0
5.0
9.0
13.0
17.0 Manager A
Manager B
Manager C
Russell Midcap Growth
Risk / Return Table
Return(%)
StdDev(%)
DownsideRisk(%)
Betavs.
Market
Alphavs.
Market(%)
R-Squaredvs.
Market(%)
SharpeRatio
TrackingErrorvs.
Market(%)
Observs.
Manager A
Manager B
Manager C
Russell Midcap Growth
5.07
3.90
1.11
2.54
23.16
24.78
26.60
23.18
3.79
4.73
4.31
0.00
0.97
1.02
1.12
1.00
2.56
1.61
-1.13
0.00
93.63
91.52
95.07
100.00
0.19
0.13
0.02
0.08
5.91
7.25
6.52
0.00
60
60
60
60
FOR BROKER DEALER AND INSTITUTIONAL USE ONLY. NOT FOR PUBLIC OR CLIENT USE.
Created with XYZ Software. Manager returns supplied by: Morningstar, Inc.

RS Funds XYZ Software: The ABC Insurance & Annuity Co., Inc.
Calendar Year Return
Ret
urn
2011 2010 2009 2008 2007
-60.0
-40.0
-20.0
0.0
20.0
40.0
60.0
80.0 Manager A
Manager B
Manager C
Russell Midcap Growth
Manager vs Benchmark: Return1 year 3 years 5 years
Manager A
Manager B
Manager C
Russell Midcap Growth
35.94
22.00
22.45
26.69
20.75
14.04
5.88
14.73
5.07
3.90
1.11
2.54
FOR BROKER DEALER AND INSTITUTIONAL USE ONLY. NOT FOR PUBLIC OR CLIENT USE.
Created with XYZ Software. Manager returns supplied by: Morningstar, Inc.
RS Funds XYZ Software: The ABC Insurance & Annuity Co., Inc.
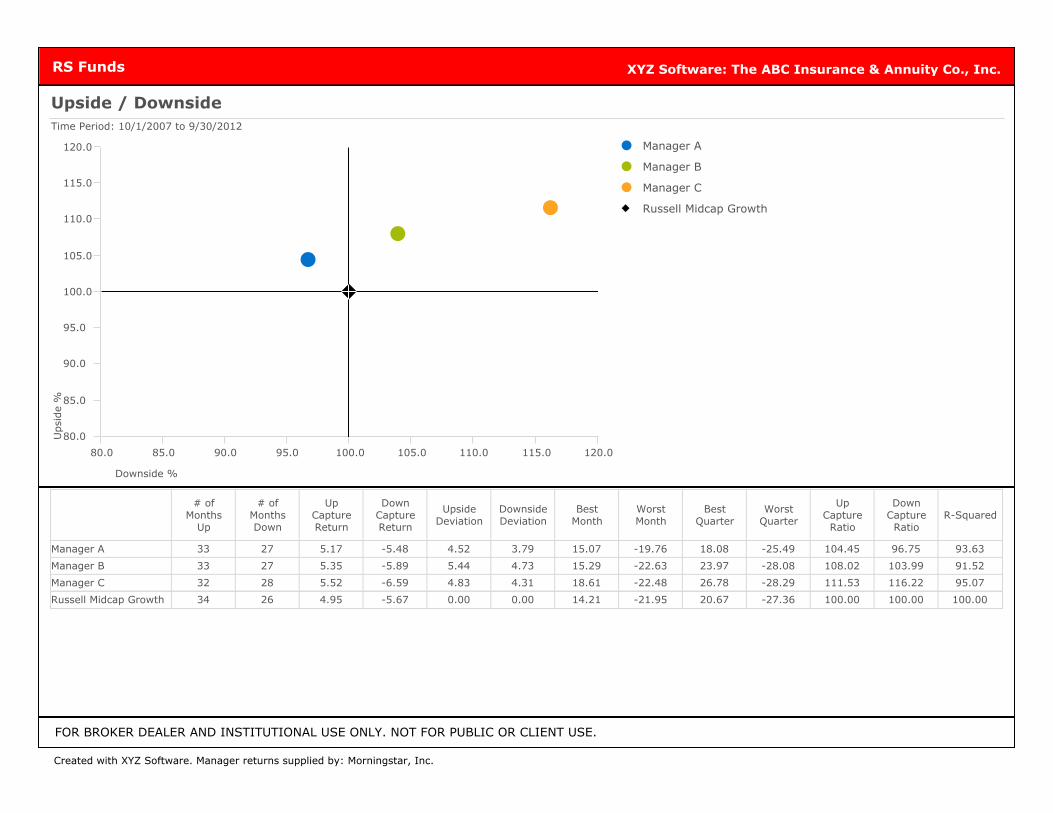
Upside / DownsideTime Period: 10/1/2007 to 9/30/2012
Upsi
de
%
Downside %
80.0 85.0 90.0 95.0 100.0 105.0 110.0 115.0 120.0
80.0
85.0
90.0
95.0
100.0
105.0
110.0
115.0
120.0 Manager A
Manager B
Manager C
Russell Midcap Growth
# ofMonths
Up
# ofMonthsDown
UpCaptureReturn
DownCaptureReturn
UpsideDeviation
DownsideDeviation
BestMonth
WorstMonth
BestQuarter
WorstQuarter
UpCaptureRatio
DownCaptureRatio
R-Squared
Manager A
Manager B
Manager C
Russell Midcap Growth
33
33
32
34
27
27
28
26
5.17
5.35
5.52
4.95
-5.48
-5.89
-6.59
-5.67
4.52
5.44
4.83
0.00
3.79
4.73
4.31
0.00
15.07
15.29
18.61
14.21
-19.76
-22.63
-22.48
-21.95
18.08
23.97
26.78
20.67
-25.49
-28.08
-28.29
-27.36
104.45
108.02
111.53
100.00
96.75
103.99
116.22
100.00
93.63
91.52
95.07
100.00
FOR BROKER DEALER AND INSTITUTIONAL USE ONLY. NOT FOR PUBLIC OR CLIENT USE.
Created with XYZ Software. Manager returns supplied by: Morningstar, Inc.

RS Funds XYZ Software: The ABC Insurance & Annuity Co., Inc.
Return / TimeTime Period: 10/1/2007 to 9/30/2012
Rolling Window: 1 Year 1 Month shift
Ret
urn
12
2009
03 06 09 12
2010
03 06 09 12
2011
03 06 09 12
2012
03 06 09-50.0
-40.0
-30.0
-20.0
-10.0
0.0
10.0
20.0
30.0
40.0
50.0
60.0
70.0
80.0
90.0 Manager A
Manager B
Manager C
Russell Midcap Growth
FOR BROKER DEALER AND INSTITUTIONAL USE ONLY. NOT FOR PUBLIC OR CLIENT USE.
Created with XYZ Software. Manager returns supplied by: Morningstar, Inc.

RS Funds XYZ Software: The ABC Insurance & Annuity Co., Inc.
Alpha vs Market Benchmark / TimeTime Period: 10/1/2007 to 9/30/2012
Rolling Window: 1 Year 1 Month shift
Alp
ha
12
2009
03 06 09 12
2010
03 06 09 12
2011
03 06 09 12
2012
03 06 09-17.5
-15.0
-12.5
-10.0
-7.5
-5.0
-2.5
0.0
2.5
5.0
7.5
10.0
12.5
15.0
17.5
20.0
22.5
25.0 Manager A
Manager B
Manager C
FOR BROKER DEALER AND INSTITUTIONAL USE ONLY. NOT FOR PUBLIC OR CLIENT USE.
Created with XYZ Software. Manager returns supplied by: Morningstar, Inc.

RS Funds XYZ Software: The ABC Insurance & Annuity Co., Inc.
Information Ratio vs. Market Benchmark / TimeTime Period: 10/1/2007 to 9/30/2012
Rolling Window: 1 Year 1 Month shift
Info
rmat
ion R
atio
(arith
)
12
2009
03 06 09 12
2010
03 06 09 12
2011
03 06 09 12
2012
03 06 09-3.5
-3.0
-2.5
-2.0
-1.5
-1.0
-0.5
0.0
0.5
1.0
1.5
2.0
2.5
3.0
3.5
4.0
4.5 Manager A
Manager B
Manager C
FOR BROKER DEALER AND INSTITUTIONAL USE ONLY. NOT FOR PUBLIC OR CLIENT USE.
Created with XYZ Software. Manager returns supplied by: Morningstar, Inc.

RS Funds XYZ Software: The ABC Insurance & Annuity Co., Inc.
Manager vs Morningstar Banchmark: Return RankPeer Group: Open End Funds - U.S. - Mid-Cap Growth
1st to 25th Percentile 26th to Median 51st to 75th Percentile 76th to 100th Percentile
Ret
urn
Ran
k
100.0
75.0
50.0
25.0
0.0
Dec 2007- - - - - - - - - - - Dec 2008 - - - - - - - - - - - Dec 2009 - - - - - - - - - - - Dec 2010 - - - - - - - - - - - Dec 2011
Manager A Manager B Manager C
Russell Midcap Growth
1 year 3 years 5 years
Manager A
Manager B
Manager C
Russell Midcap Growth
Median
Count
35.94
22.00
22.45
26.69
20.75
14.04
5.88
14.73
5.07
3.90
1.11
2.54
24.76
768
12.95
736
1.35
708
FOR BROKER DEALER AND INSTITUTIONAL USE ONLY. NOT FOR PUBLIC OR CLIENT USE.
Created with XYZ Software. Manager returns supplied by: Morningstar, Inc.

RS Funds XYZ Software: The ABC Insurance & Annuity Co., Inc.
DEFINITIONS
Alpha - Alpha is a risk (beta adjusted) measurement. Officially, alpha measures the difference between a portfolio's actual returns and what it might be expected to deliver based on its level of risk. Higher risk generally means higher reward. A positive alpha means the fund has beaten expectations. A negative alpha means that the manager failed to match performance with risk. If two managers had the same return but one had a lower beta, that manager would have a higher alpha. StyleADVISOR uses the standard intercept calculation.
Beta - Beta represents the systematic risk of a portfolio and measures its sensitivity to a benchmark. A portfolio with a beta of one is considered as risky as the benchmark and would therefore provide expected returns equal to those of the market during both up and down periods. A portfolio with a beta of two would move approximately twice as much as the benchmark.
Downside Risk - The downside standard deviation, also referred to as downside risk, differs from the ordinary standard deviation insofar as the sum is restricted to those returns that are less than the mean. The downside standard deviation shows the average size of the deviations from the mean when the return is negative. It is often used as a measure of the downside risk of a manager.
Excess Return - The difference between the returns of two portfolios. Usually excess return is the difference between a manager's return and the return of a benchmark for that manager. In the contextof a beta benchmark, excess return refers to the difference between a manager or market benchmark and Tbills.
Semi - Standard Deviation - The semi-standard deviation is a characterization of the downside risk of a distribution. Essentially it represents the standard deviation of all returns falling below the mean. The semi-variance of the returns below the mean (to the left of the distribution) is calculated. The semi-standard deviation is the square root of the semi-variance. The semi-variance (standard deviation) is always lower than the total variance (standard deviation) of the distribution.
Sharpe Ratio - The Sharpe Ratio, developed by Professor William F. Sharpe, is a measure of reward per unit of risk -- the higher the Sharpe Ratio, the better. It is a portfolio's excess return over the risk-free rate divided by the portfolio's standard deviation. The portfolio's excess return is its geometric mean return minus the geometric mean return of the risk-free instrument (by default, t-bills).
Standard Deviation - A statistical measure of volatility, indicates the 'risk' associated with a return series.
Up and Down Capture - The up and down capture is a measure of how well a manager was able to replicate or improve on phases of positive benchmark returns, and how badly the manager was affected by phases of negative benchmark returns. To calculate the up capture, we first form new series from the manager and benchmark series by dropping all time periods where the benchmark return is zero or negative. The up capture is then the quotient of the annualized return of the resulting manager series, divided by the annualized return of the resulting benchmark series. The down capture is calculated analogously.
FOR BROKER DEALER AND INSTITUTIONAL USE ONLY. NOT FOR PUBLIC OR CLIENT USE.
Created with XYZ Software. Manager returns supplied by: Morningstar, Inc.

Active Alternative Core Strategy
Blend Weights
Portfolio Date: 9/30/2012
%
First Eagle Gold A 19.6
Vanguard Interm-Term Treasury Inv 19.2
Amana Trust Growth 14.1
Vanguard GNMA Inv 10.6
Franklin Templeton Hard Currency A 10.3
Merger 10.0
Gateway A 7.5
ICON Energy S 6.8
Citi Treasury Bill 3 Mon USD 1.9
Total 100.0
Page 1 of 18
Source: Morningstar Direct

Active Alternative Core Strategy
Manager Performance
Time Period: 10/1/2002 to 9/30/2012
2003 2004 2005 2006 2007 2008 2009 2010 2011 2012100.0
120.0
140.0
160.0
180.0
200.0
220.0
240.0
260.0
Active Alternative Core Strategy 60-40 S&P-Barcap Agg US OE Moderate Allocation
Cumulative Excess Return vs Benchmark
2003 2004 2005 2006 2007 2008 2009 2010 2011 2012-10.0%
0.0%
10.0%
20.0%
30.0%
40.0%
50.0%
60.0%
70.0%
80.0%
90.0%
AnnualizedReturn
CumulativeReturn
Std DevAnnualized
ExcessReturn
CumulativeExcessReturn
InformationRatio
SharpeRatio
(arith)
TrackingError
Active Alternative Core Strategy
60-40 S&P-Barcap Agg
US OE Moderate Allocation
9.80 9.80 8.71
6.67 6.67 7.88
3.13 3.13
0.00 0.00
0.45 7.03
0.00
0.92
0.62
6.42 6.42 10.56 -0.25 -0.25 -0.08 0.44 3.26
Page 2 of 18
Source: Morningstar Direct

Active Alternative Core Strategy
Manager vs Benchmark: Return
Ret
urn
YTD 1 year 2 years 3 years 4 years 5 years 10 years Since Inception
0.0
1.0
2.0
3.0
4.0
5.0
6.0
7.0
8.0
9.0
10.0
11.0
12.0
13.0
14.0
15.0
16.0
17.0
18.0
Active Alternative Core Strategy 60-40 S&P-Barcap Agg
YTD 1 year 2 years 3 years 4 years 5 years 10 yearsSince
Inception
Active Alternative Core Strategy
60-40 S&P-Barcap Agg
US OE Moderate Allocation
5.18 7.74 5.27 7.50 8.30 5.96 9.80
6.67
9.79
4.7110.29 17.20 10.00 9.71 7.55 3.39
10.56 17.93 8.20 8.51 6.68 1.56 6.42 7.90
Page 3 of 18
Source: Morningstar Direct

Active Alternative Core Strategy
Calendar Year Returns
Ret
urn
YTD 2010 2009 2008 2007 2006 2005 2004 2003 2002
-20.0
-18.0
-16.0
-14.0
-12.0
-10.0
-8.0
-6.0
-4.0
-2.0
0.0
2.0
4.0
6.0
8.0
10.0
12.0
14.0
16.0
18.0
20.0
Active Alternative Core Strategy 60-40 S&P-Barcap Agg
YTD 2010 2009 2008 2007 2006 2005 2004 2003 2002
Active Alternative Core Strategy
60-40 S&P-Barcap Agg
US OE Moderate Allocation
5.18
10.29
0.64
4.86
14.21
10.81
15.71
15.30
-6.65
-19.41
13.99
6.10
11.40
10.77
11.58
3.81
7.79
7.88
19.09
16.09
10.56 -0.40 11.73 24.04 -28.19 5.92 11.29 5.13 8.81 20.22
Page 4 of 18
Source: Morningstar Direct
Active Alternative Core Strategy
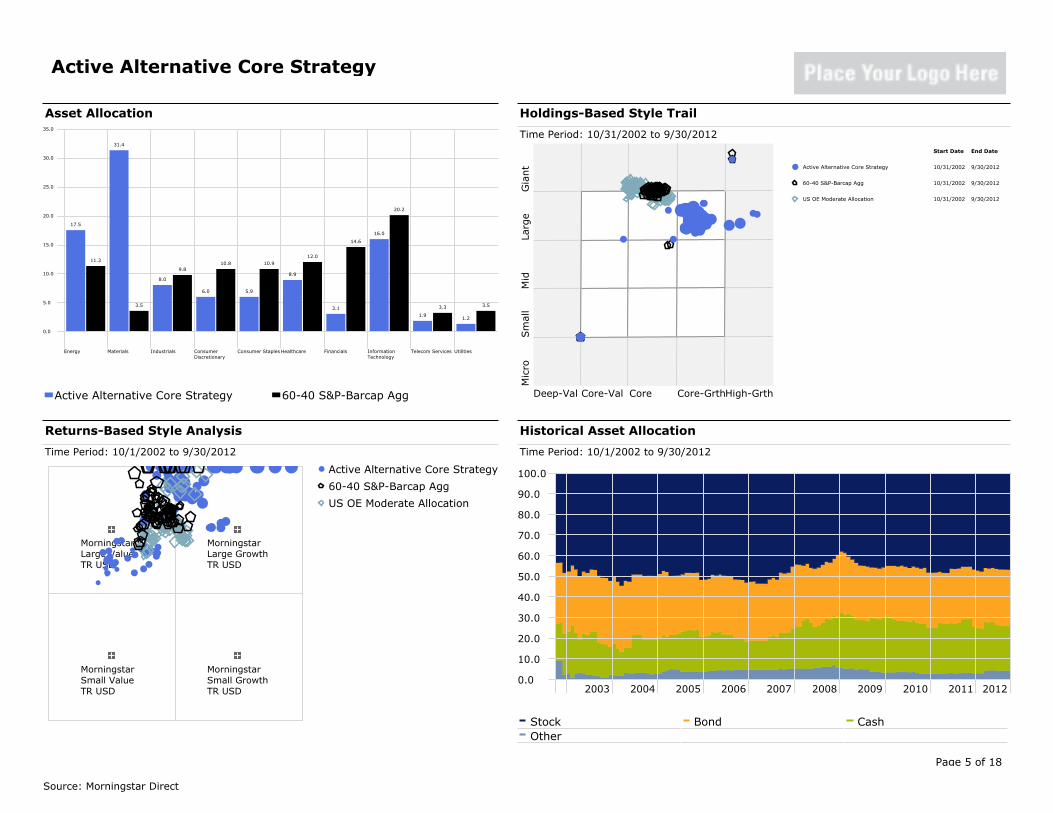
Historical Asset Allocation
Time Period: 10/1/2002 to 9/30/2012
0.0
10.0
20.0
30.0
40.0
50.0
60.0
70.0
80.0
90.0
100.0
2003 2004 2005 2006 2007 2008 2009 2010 2011 2012
Stock Bond CashOther
Holdings-Based Style Trail
Time Period: 10/31/2002 to 9/30/2012
Mic
roSm
all
Mid
Larg
eG
iant
Deep-Val Core-Val Core Core-GrthHigh-Grth
Start Date End Date
Active Alternative Core Strategy 10/31/2002 9/30/2012
60-40 S&P-Barcap Agg 10/31/2002 9/30/2012
US OE Moderate Allocation 10/31/2002 9/30/2012
Returns-Based Style Analysis
Time Period: 10/1/2002 to 9/30/2012
Morningstar Large Value TR USD
Morningstar Large Growth TR USD
Morningstar Small Value TR USD
Morningstar Small Growth TR USD
Active Alternative Core Strategy
60-40 S&P-Barcap Agg
US OE Moderate Allocation
Asset Allocation
17.5
11.3
31.4
3.5
8.0
9.8
6.0
10.8
5.9
10.9
8.9
12.0
3.1
14.6
16.0
20.2
1.9
3.3
1.2
3.5
0.0
5.0
10.0
15.0
20.0
25.0
30.0
35.0
Energy Materials Industrials Consumer Discretionary
Consumer Staples Healthcare Financials Information Technology
Telecom Services Utilities
Active Alternative Core Strategy 60-40 S&P-Barcap Agg
Page 5 of 18
Source: Morningstar Direct

Active Alternative Core Strategy
Risk / Return
Time Period: 10/1/2002 to 9/30/2012
Ret
urn
Std Dev
0.0 3.0 6.0 9.0 12.0 15.0
0.0
2.0
4.0
6.0
8.0
10.0
12.0 Active Alternative Core Strategy
60-40 S&P-Barcap Agg
US OE Moderate Allocation
Return Std DevDownsideDeviation
Alpha Beta R2Sharpe
Ratio(arith)
TrackingError
Observations
Active Alternative Core Strategy
60-40 S&P-Barcap Agg
US OE Moderate Allocation
9.80
6.67
8.71
7.88
4.20
0.00
7.03
0.00
120.00
120.00
4.43
0.00
0.71
1.00
41.76
100.00
0.92
0.62
6.42 10.56 2.45 -1.54 1.31 95.91 0.44 3.26 120.00
Page 6 of 18
Source: Morningstar Direct

Active Alternative Core Strategy
Upside / Downside
Time Period: 10/1/2002 to 9/30/2012
Up C
aptu
re R
atio
Down Capture Ratio
0.0 30.0 60.0 90.0 120.0 150.0 180.0 210.0
0.0
30.0
60.0
90.0
120.0
150.0
180.0 Active Alternative Core Strategy
60-40 S&P-Barcap Agg
US OE Moderate Allocation
Up NumberDown
NumberUpside
DeviationDownsideDeviation
BestMonth
WorstMonth
BestQuarter
WorstQuarter
UpCapture
Ratio
DownCapture
RatioR2
Active Alternative Core Strategy
60-40 S&P-Barcap Agg
US OE Moderate Allocation
81
79
39
41
5.66
0.00
4.20 6.81
0.00 5.31 -10.00
8.11
9.19
-7.34
-9.46
-9.93 90.79
100.00
44.83
100.00
41.76
100.00
79 41 2.13 2.45 7.18 -13.33 122.46 143.76 95.9113.18 -15.09
Page 7 of 18
Source: Morningstar Direct

Active Alternative Core Strategy
Time Period: 10/1/2002 to 9/30/2012
Up NumberDown
NumberUpside
DeviationDownsideDeviation
BestMonth
WorstMonth
BestQuarter
WorstQuarter
UpCapture
Ratio
DownCapture
RatioR2
Active Alternative Core Strategy
60-40 S&P-Barcap Agg
US OE Moderate Allocation
81
79
39
41
5.66
0.00
4.20
0.00
6.81
5.31 -10.00
-9.93 8.11
9.19
-7.34
-9.46
90.79
100.00
44.83
100.00
41.76
100.00
79 41 2.13 2.45 7.18 -13.33 122.46 143.76 95.9113.18 -15.09
Alp
ha
Alpha
0.0
0.3
0.5
0.8
1.0
1.3
1.5
1.8
2.0
2.3
2.5
2.8
3.0
3.3
3.5
3.8
4.0
4.3
4.5
Bet
a
Beta
0.0
0.1
0.1
0.2
0.2
0.3
0.3
0.4
0.4
0.5
0.5
0.6
0.6
0.7
0.7
0.8
0.8
0.9
0.9
1.0
1.0
Exc
ess
Ret
urn
Excess Return
0.0
0.2
0.4
0.6
0.8
1.0
1.2
1.4
1.6
1.8
2.0
2.2
2.4
2.6
2.8
3.0
3.2
Shar
pe
Rat
io
Sharpe Ratio
0.0
0.0
0.1
0.1
0.2
0.2
0.3
0.3
0.4
0.4
0.5
0.5
0.6
0.6
0.7
0.7
0.8
0.8
0.9
0.9
1.0 Active Alternative Core Strategy
60-40 S&P-Barcap Agg
Info
rmat
ion R
atio
(arith
)
Information Ratio
0.0
0.0
0.1
0.1
0.2
0.2
0.3
0.3
0.4
0.4
0.5
Page 8 of 18
Source: Morningstar Direct

Active Alternative Core Strategy
Manager vs Benchmark: Downside Deviation
Dow
nsi
de
Dev
iation
YTD 1 year 2 years 3 years 4 years 5 years 10 years Since Inception
0.00.51.01.52.02.53.03.54.04.55.05.5
Active Alternative Core Strategy 60-40 S&P-Barcap Agg
Manager vs Benchmark: Sharpe Ratio
Shar
pe
Rat
io
YTD 1 year 2 years 3 years 4 years 5 years 10 years Since Inception0.00.30.50.81.01.31.51.82.02.32.5
Active Alternative Core Strategy 60-40 S&P-Barcap Agg
Manager vs Benchmark: Standard Deviation
Std
Dev
YTD 1 year 2 years 3 years 4 years 5 years 10 years Since Inception0.01.02.03.04.05.06.07.08.09.010.011.0
Active Alternative Core Strategy 60-40 S&P-Barcap Agg
Page 9 of 18
Source: Morningstar Direct

Active Alternative Core Strategy
Histogram of Returns
Time Period: 10/1/2002 to 9/30/2012
Per
cent
of
Periods
-10.0 -9.0 -8.0 -7.0 -6.0 -5.0 -4.0 -3.0 -2.0 -1.0 0.0 1.0 2.0 3.0 4.0 5.0 6.0 7.0 8.0 9.00.0
2.0
4.0
6.0
8.0
10.0
12.0
14.0
16.0
18.0
20.0
22.0
Active Alternative Core Strategy 60-40 S&P-Barcap Agg
Skewness KurtosisMax
Drawdown
MaxDrawdown #
ofPeriods
MaxDrawdown
PeakDate
MaxDrawdown
ValleyDate
SortinoRatio
Omega
Active Alternative Core Strategy
60-40 S&P-Barcap Agg
US OE Moderate Allocation
-0.59
-1.12
2.14
3.39
-16.66
-28.17
8.00
16.00
3/1/2008
11/1/2007
10/31/2008
2/28/2009
1.50
0.92
1.98
1.61
-1.03 3.19 -37.94 16.00 11/1/2007 2/28/2009 0.67 1.41
Page 10 of 18
Source: Morningstar Direct

Active Alternative Core Strategy
Excess Return vs Market Benchmark / Time
Time Period: 10/1/2002 to 9/30/2012
Rolling Window: 3 Years 1 Month shift
Exc
ess
Ret
urn
12
2006
03 06 09 12
2007
03 06 09 12
2008
03 06 09 12
2009
03 06 09 12
2010
03 06 09 12
2011
03 06 09 12
2012
03 06 09-5.0
-2.5
0.0
2.5
5.0
7.5
10.0
Active Alternative Core Strategy 60-40 S&P-Barcap Agg
Gain Deviation vs Market Benchmark / Time
Time Period: 10/1/2002 to 9/30/2012
Rolling Window: 3 Years 1 Month shift
Gai
n D
evia
tion
12
2006
03 06 09 12
2007
03 06 09 12
2008
03 06 09 12
2009
03 06 09 12
2010
03 06 09 12
2011
03 06 09 12
2012
03 06 092.0
4.0
6.0
8.0
10.0
Active Alternative Core Strategy 60-40 S&P-Barcap Agg
Page 11 of 18
Source: Morningstar Direct

Active Alternative Core Strategy
Batting Average vs Market Benchmark / Time
Time Period: 10/1/2002 to 9/30/2012
Rolling Window: 3 Years 1 Month shift
Bat
ting A
vera
ge
12
2006
03 06 09 12
2007
03 06 09 12
2008
03 06 09 12
2009
03 06 09 12
2010
03 06 09 12
2011
03 06 09 12
2012
03 06 0940.0
60.0
80.0
100.0
120.0
Active Alternative Core Strategy 60-40 S&P-Barcap Agg
Excess Return and Batting Average vs Market Benchmark
Time Period: 10/1/2002 to 9/30/2012
Exc
ess
Ret
urn
Batting Average
0.0 20.0 40.0 60.0 80.0 100.0 120.0
-1.0
0.0
1.0
2.0
3.0
4.0 Active Alternative Core Strategy
60-40 S&P-Barcap Agg
US OE Moderate Allocation
Page 12 of 18
Source: Morningstar Direct

Active Alternative Core Strategy
Drawdown
Time Period: 10/1/2002 to 9/30/2012
2003 2004 2005 2006 2007 2008 2009 2010 2011 2012-30.0
-28.0
-26.0
-24.0
-22.0
-20.0
-18.0
-16.0
-14.0
-12.0
-10.0
-8.0
-6.0
-4.0
-2.0
0.0
Active Alternative Core Strategy 60-40 S&P-Barcap Agg
MaxDrawdown
MaxDrawdown #
ofPeriods
MaxDrawdown
Recovery #of
Periods
MaxDrawdownRecovery
Date
MaxDrawdown
PeakDate
MaxDrawdown
ValleyDate
MaxGainEnd
Date
Gain/LossRatio
Active Alternative Core Strategy
60-40 S&P-Barcap Agg
-16.66
-28.17
8.00
16.00
11.00
22.00
9/30/2009
12/31/2010
3/1/2008
11/1/2007
10/31/2008
2/28/2009
9/30/2012
9/30/2012
2.30
1.92
Page 13 of 18
Source: Morningstar Direct

Active Alternative Core Strategy
Performance Relative to Peer Group
Peer Group (5-95%): Open End Funds - U.S. - Moderate Allocation
Top Quartile 2nd Quartile 3rd Quartile Bottom Quartile
Ret
urn
-2.0
0.0
2.0
4.0
6.0
YTD 1 year 2 years 3 years 4 years 5 years 10 years
8.0
10.0
12.0
14.0
16.0
18.0
20.0
22.0
24.0
Active Alternative Core Strategy 60-40 S&P-Barcap Agg
YTD 1 year 2 years 3 years 4 years 5 years 10 yearsSince
Inception
Active Alternative Core Strategy
60-40 S&P-Barcap Agg
US OE Moderate Allocation
Count
10.56 17.93 8.20 8.51 6.68 1.56 6.42 7.90
10.29 17.20 10.00 9.71 7.55 3.39 6.67 4.71
5.18 7.74 5.27 7.50 8.30 5.96 9.80 9.79
898 893 826 770 728 669 380 829
Page 14 of 18
Source: Morningstar Direct

Active Alternative Core Strategy
Performance Relative to Peer Group (Descending Rank)
Peer Group: Open End Funds - U.S. - Moderate Allocation
1st to 25th Percentile 26th to Median 51st to 75th Percentile 76th to 100th Percentile
Ret
urn
(D
esce
ndin
g R
ank)
100.0
75.0
50.0
25.0
0.0
YTD 1 year 3 years 5 years 10 years 15 years
Active Alternative Core Strategy 60-40 S&P-Barcap Agg
36-Month Rolling Returns
12/2003 12/2004 12/2005 12/2006 12/2007 12/2008 12/2009 12/2010
Active Alternative Core Strategy
60-40 S&P-Barcap Agg
US OE Moderate Allocation
14.71
4.71
12.73
9.14
10.24
7.45
12.32
6.85
5.84
-1.79
7.18
-0.47
7.25
0.98
9.97
10.24
4.82 11.20 8.38 7.41 -5.41 -1.92 -0.16 11.34
Page 15 of 18
Source: Morningstar Direct

Active Alternative Core Strategy
Alpha Relative to Peer Group
Peer Group (5-95%): Open End Funds - U.S. - Moderate Allocation
Top Quartile 2nd Quartile 3rd Quartile Bottom Quartile
Alp
ha
-12.0-10.0-8.0-6.0-4.0
YTD 1 year 2 years 3 years 4 years 5 years 10 years
-2.00.02.04.06.0
Active Alternative Core Strategy 60-40 S&P-Barcap Agg
Information Ratio Relative to Peer Group
Peer Group (5-95%): Open End Funds - U.S. - Moderate Allocation
Top Quartile 2nd Quartile 3rd Quartile Bottom Quartile
Info
rmat
ion R
atio
(arith
)
YTD 1 year 2 years 3 years 4 years 5 years 10 years-2.0
-1.5
-1.0
-0.5
0.0
0.5
1.0
1.5
Sharpe Ratio Relative to Peer Group
Peer Group (5-95%): Open End Funds - U.S. - Moderate Allocation
Top Quartile 2nd Quartile 3rd Quartile Bottom Quartile
Shar
pe
Rat
io
YTD 1 year 2 years 3 years 4 years 5 years 10 years-0.50.00.51.01.52.02.5
Page 16 of 18
Source: Morningstar Direct

Active Alternative Core Strategy
Correlation Matrix
Time Period: 10/1/2002 to 9/30/2012
1 2 3 4 5 6 7 8 9 10 11
1.00
0.64 1.00
0.50 0.83 1.00
0.72 0.71 0.55 1.00
0.89 0.29 0.16 0.46 1.00
0.30 0.56 0.55 0.34 0.05 1.00
0.72 0.51 0.47 0.56 0.52 0.19 1.00
0.26 -0.13 -0.11 -0.12 0.27 -0.12 0.14 1.00
0.20 -0.25 -0.19 -0.22 0.24 -0.20 0.17 0.88 1.00
0.03 0.00 0.03 0.03 0.02 0.03 0.03 -0.02 0.02 1.00
0.65 0.90 0.89 0.64 0.29 0.58 0.56 0.09 -0.04 -0.05 1.00
1 Active Alternative Core Strategy
2 Amana Trust Growth
3 Gateway A
4 ICON Energy S
5 First Eagle Gold A
6 Merger
7 Franklin Templeton Hard Currency A
8 Vanguard GNMA Inv
9 Vanguard Interm-Term Treasury Inv
10 Citi Treasury Bill 3 Mon USD
11 60-40 S&P-Barcap Agg
Page 17 of 18
Source: Morningstar Direct

Active Alternative Core Strategy
Active Alternative Core Strategy - Monthly Returns
Jan Feb Mar Apr May Jun Jul Aug Sep Oct Nov Dec Year
2012
2011
2010
2009
2008
2007
3.23
-1.12
-2.49
-1.71
0.49
-0.18
0.77
2.76
2.02
-2.40
2.09
0.99
-1.98
0.59
1.61
4.20
-1.55
1.02
-0.53
2.57
2.91
0.56
0.14
1.68
-3.53
-1.16
-2.80
6.81
0.68
0.73
1.77
-1.53
0.27
-2.39
0.60
-0.38
0.83
1.27
1.90
2.79
-1.83
1.26
2.13
0.31
1.09
0.61
-2.23
0.09
2.56
-5.23
4.46
3.89
-3.46
5.83
4.76
1.74
-0.19
-9.93
3.44
0.09
0.64
5.00
3.21
-1.55
-2.31
2.26
-1.94
5.79
0.45
0.64
14.21
15.71
-6.65
13.99
60-40 S&P-Barcap Agg - Monthly Returns
Jan Feb Mar Apr May Jun Jul Aug Sep Oct Nov Dec Year
2012
2011
2010
2009
2008
2007
2.70
1.29
-1.04
-4.33
-2.80
0.87
2.21
1.92
1.70
-4.86
-1.77
-0.52
1.47
0.05
2.92
4.41
-0.09
0.65
0.18
2.17
1.31
4.36
2.61
2.81
-2.76
0.00
-3.66
2.91
0.42
1.77
2.13
-1.02
-1.75
0.40
-4.85
-1.12
1.38
-0.32
3.86
4.35
-0.50
-1.53
1.21
-2.11
-1.52
2.25
1.22
1.39
1.43
-3.16
4.25
2.34
-5.50
2.52
5.31
2.05
-0.65
-10.00
1.31
-0.15
-0.28
3.55
-1.85
-1.79
1.06
2.81
0.16
2.50
-0.29
4.86
10.81
15.30
-19.41
6.10
Page 18 of 18
Source: Morningstar Direct
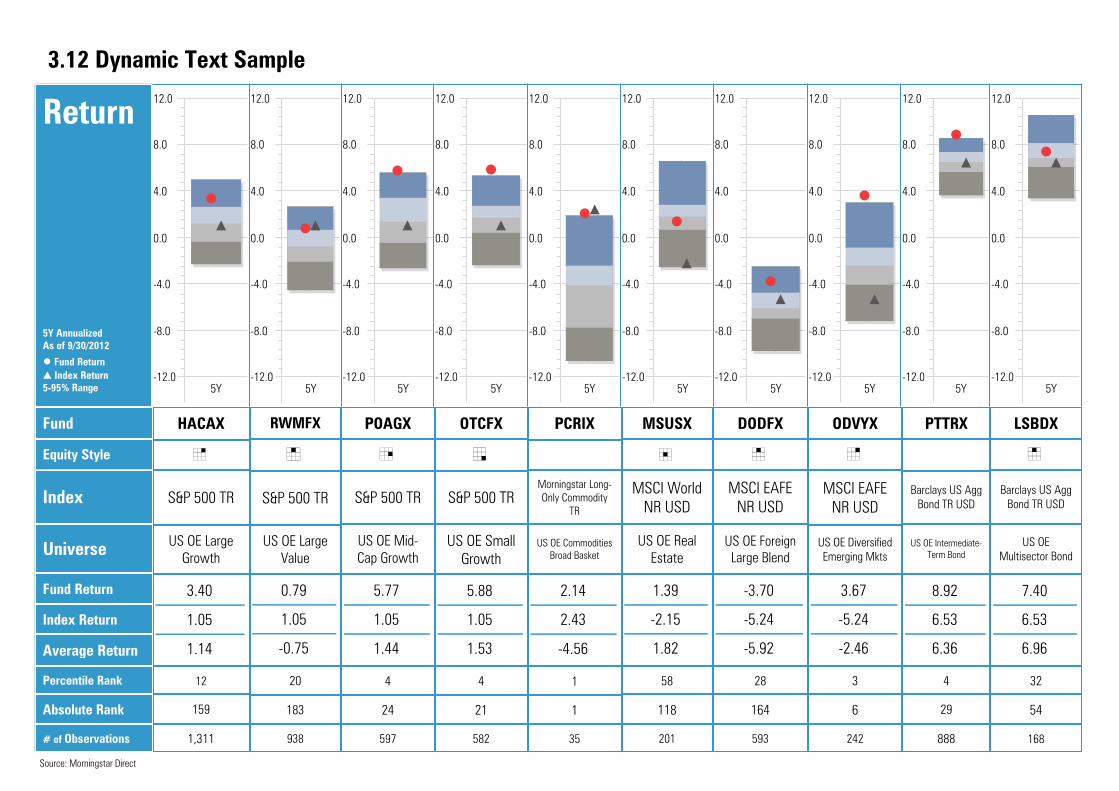
3.12 Dynamic Text Sample
OTCFX
Ï
S&P 500 TR
US OE Small Growth
4
21
582
1.05
5.88
1.53
PCRIX
Morningstar Long-Only Commodity
TR
US OE Commodities Broad Basket
1
1
35
2.43
2.14
-4.56
MSUSX
Ë
MSCI World NR USD
US OE Real Estate
58
118
201
1.39
-2.15
1.82
HACAX
É
S&P 500 TR
1.05
3.40
1.14
US OE Large Growth
159
1,311
12 20
183
938
1.05
0.79
-0.75
RWMFX
È
S&P 500 TR
US OE Large Value
1.05
5.77
1.44
POAGX
Ì
S&P 500 TR
US OE Mid-Cap Growth
4
24
597
4
29
888
PTTRX
US OE Intermediate-Term Bond
Barclays US Agg Bond TR USD
8.92
6.53
6.36
32
54
168
LSBDX
È
US OE Multisector Bond
Barclays US Agg Bond TR USD
7.40
6.53
6.96
DODFX
È
US OE Foreign Large Blend
MSCI EAFE NR USD
28
164
593
-3.70
-5.24
-5.92
ODVYX
É
US OE Diversified Emerging Mkts
MSCI EAFE NR USD
3
6
242
3.67
-5.24
-2.46
Fund
Equity Style
Index
Universe
Fund Return
Index Return
Average Return
Percentile Rank
Absolute Rank
# of Observations
Return
5Y-12.0
-8.0
-4.0
0.0
4.0
8.0
12.0
Return
5Y-12.0
-8.0
-4.0
0.0
4.0
8.0
12.0
Return
5Y AnnualizedAs of 9/30/2012
● Fund Return▲ Index Return5-95% Range
Return
5Y-12.0
-8.0
-4.0
0.0
4.0
8.0
12.0
Return
5Y-12.0
-8.0
-4.0
0.0
4.0
8.0
12.0
Return
5Y-12.0
-8.0
-4.0
0.0
4.0
8.0
12.0
Return
-12.0
-8.0
-4.0
0.0
4.0
8.0
12.0
5Y
Return
5Y-12.0
-8.0
-4.0
0.0
4.0
8.0
12.0
Return
5Y-12.0
-8.0
-4.0
0.0
4.0
8.0
12.0
Return
5Y-12.0
-8.0
-4.0
0.0
4.0
8.0
12.0
Return
5Y-12.0
-8.0
-4.0
0.0
4.0
8.0
12.0
Source: Morningstar Direct

3.12 Multiple Returns for Separate Accounts
Investment GrowthTime Period: 1/1/2007 to 12/31/2011
6/2007 12/2007 6/2008 12/2008 6/2009 12/2009 6/2010 12/2010 6/2011 12/201147.5
55.0
62.5
70.0
77.5
85.0
92.5
100.0
107.5
115.0
122.5
130.0
137.5
145.0
152.5
Insight Large Cap Growth (Gross) Insight Large Cap Growth (Net) Groesbeck Growth (Gross)
Groesbeck Growth (Net) Windward Capital Appreciation SMA (Gross) Windward Capital Appreciation SMA (Net)
Profit Inv Mgt (PIM) Profit Social (Gross) Profit Inv Mgt (PIM) Profit Social (Net) Texas Inst Mid-Large Cap Growth (Gross)
Texas Inst Mid-Large Cap Growth (Net) S&P 500 TR (Gross) US SA Large Growth (Gross)
Source: Morningstar Direct

3.12 Multiple Returns for Separate Accounts
Returns
Ret
urn
YTD 1 Year 3 Years 5 Years 10 Years 15 Years
0.0
2.0
4.0
6.0
8.0
10.0
12.0
14.0
16.0
18.0
20.0
22.0
24.0
Insight Large Cap Growth (Gross) Insight Large Cap Growth (Net) S&P 500 TR
US SA Large Growth
Risk-RewardTime Period: 7/1/2007 to 6/30/2012
Ret
urn
Std Dev
0.0 4.0 8.0 12.0 16.0 20.0 24.0 28.0
-3.0
-1.0
1.0
3.0
5.0
7.0 Insight Large Cap Growth (Gross)
Insight Large Cap Growth (Net)
S&P 500 TR
US SA Large Growth
Rolling ReturnsTime Period: 7/1/2007 to 6/30/2012
Rolling Window: 3 Years 1 Month shift
Top Quartile 2nd Quartile 3rd Quartile Bottom Quartile
Ret
urn
06 07 08 09 10 11 12
2011
01 02 03 04 05 06 07 08 09 10 11 12
2012
01 02 03 04 05 06-20.0
-10.0
0.0
10.0
20.0
30.0
40.0
Insight Large Cap Growth (Gross) Insight Large Cap Growth (Net) S&P 500 TRUS SA Large Growth
Source: Morningstar Direct

3.12 Multiple Returns for Separate Accounts
Trailing ReturnsYTD 1 Year 3 Years 5 Years 10 Years 15 Years
Insight Large Cap Growth (Gross)
Insight Large Cap Growth (Net)
S&P 500 TR
US SA Large Growth 8.99 1.65 15.37 2.03 6.59 6.81
23.70
23.52
9.49
4.57
4.31
5.45
19.85
19.49
16.40
4.68
4.25
0.22
8.22
7.45
5.33
7.60
6.53
4.77
Returns
Ret
urn
YTD 1 Year 3 Years 5 Years 10 Years 15 Years
0.0
2.0
4.0
6.0
8.0
10.0
12.0
14.0
16.0
18.0
20.0
22.0
24.0
Insight Large Cap Growth (Gross) Insight Large Cap Growth (Net) S&P 500 TR
US SA Large Growth
Alpha-RewardTime Period: 7/1/2007 to 6/30/2012
Alp
ha
Tracking Error
-2.0 1.0 4.0 7.0 10.0 13.0 16.0
-3.0
-1.0
1.0
3.0
5.0
7.0 Insight Large Cap Growth (Gross)
Insight Large Cap Growth (Net)
S&P 500 TR
US SA Large Growth
Insight Large Cap Growth - PerformanceTime Period: 7/1/2007 to 6/30/2012
Inv
Gross NetBmk1
Return
Std Dev
Excess Return
Information Ratio (arith)
R2
Tracking Error
4.68
22.07
4.46
0.35
67.16
12.70
4.25
22.07
4.04
0.32
67.21
12.69
0.22
19.21
0.00
100.00
0.00
Source: Morningstar Direct

3.12 Multiple Returns for Separate Accounts
PerformanceTime Period: 7/1/2007 to 6/30/2012
Return Std DevExcessReturn
InformationRatio
(arith)R2
TrackingError
Insight Large Cap Growth
Groesbeck Growth
Windward Capital Appreciation SMA
Profit Inv Mgt (PIM) Profit Social
Texas Inst Mid-Large Cap Growth
S&P 500 TR
US SA Large Growth 2.03 19.31
4.68
3.31
4.35
3.11
7.00
0.22
22.07
18.34
19.85
19.12
19.97
19.21
4.46
3.09
4.13
2.89
6.78
0.00
0.35
0.40
0.46
0.64
0.72
67.16
83.93
79.91
94.52
78.71
100.00
12.70
7.76
9.04
4.53
9.36
0.00
1.81 0.45 95.79 3.98
RiskTime Period: 7/1/2007 to 6/30/2012
Return Std DevDownsideDeviation
Alpha Beta R2Sharpe
Ratio(arith)
TrackingError
Insight Large Cap Growth
Groesbeck Growth
Windward Capital Appreciation SMA
Profit Inv Mgt (PIM) Profit Social
Texas Inst Mid-Large Cap Growth
S&P 500 TR
US SA Large Growth
4.68
3.31
4.35
3.11
7.00
0.22
22.07
18.34
19.85
19.12
19.97
19.21
8.69
3.08
5.54
2.46
5.66
0.00
5.01
3.06
4.26
2.84
6.82
0.00
0.94
0.87
0.92
0.97
0.92
1.00
67.16
83.93
79.91
94.52
78.71
100.00
0.18
0.14
0.18
0.12
0.31
-0.03
12.70
7.76
9.04
4.53
9.36
0.00
2.03 19.31 2.29 1.83 0.98 95.79 0.06 3.98
Market PerformanceTime Period: 7/1/2007 to 6/30/2012
UpPeriod
Percent
DownPeriod
Percent
BestMonth
WorstMonth
BestQuarter
WorstQuarter
UpCapture
Ratio
DownCapture
RatioR2
Insight Large Cap Growth
Groesbeck Growth
Windward Capital Appreciation SMA
Profit Inv Mgt (PIM) Profit Social
Texas Inst Mid-Large Cap Growth
S&P 500 TR
US SA Large Growth
58.33
60.00
53.33
55.00
56.67
56.67
41.67
40.00
46.67
45.00
43.33
43.33
12.48
10.53
13.08
12.40
11.51
10.93
-15.28
-18.24
-15.15
-15.40
-17.04
-16.79
22.44
13.76
19.36
19.11
20.77
15.93
-20.44
-24.15
-22.72
-21.70
-20.10
-21.94
113.32
89.56
102.87
105.25
111.69
100.00
96.68
78.55
87.77
94.52
86.95
100.00
67.16
83.93
79.91
94.52
78.71
100.00
56.67 43.33 11.31 -16.96 15.35 -22.51 103.71 96.95 95.79
Source: Morningstar Direct

3.12 Returns Based Style Analysis
-6.0
56.7
5.9
2.5
30.7
83.3
18.7
11.3
3.1
104.
7
4.4 10
.5
6.2
33.4
-39.
9
8.1
3.3
71.9
59.2
0.1 10
.2
10.7
4.7
1.8 4.4
-40.0
-20.0
0.0
20.0
40.0
60.0
80.0
100.0
120.0
Large Value Large Growth Small Value Small Growth Cash
Large Value Large Growth
Small Value Small Growth
Asset Class: Equity
Style Analysis (5 Years) 5/2012
0.0
10.0
20.0
30.0
40.0
50.0
60.0
70.0
80.0
90.0
100.0
9/2010 12/2010 3/2011 6/2011 9/2011 12/2011 3/2012 6/2012 9/2012
Large Growth
Large Value
Style Exposure
0.0
10.0
20.0
30.0
40.0
50.0
60.0
70.0
80.0
90.0
100.0
9/2010 12/2010 3/2011 6/2011 9/2011 12/2011 3/2012 6/2012 9/2012
Small Value
0.0
10.0
20.0
30.0
40.0
50.0
60.0
70.0
80.0
90.0
100.0
9/2010 12/2010 3/2011 6/2011 9/2011 12/2011 3/2012 6/2012 9/2012
Small Growth
0.0
10.0
20.0
30.0
40.0
50.0
60.0
70.0
80.0
90.0
100.0
9/2010 12/2010 3/2011 6/2011 9/2011 12/2011 3/2012 6/2012 9/2012
Cash
LargeValue
LargeGrowth
SmallValue
SmallGrowth
Cash R2
Harbor Capital Appreciation Instl
American Funds Washington Mutual R5
PRIMECAP Odyssey Aggressive Growth
T. Rowe Price Small-Cap Stock
PIMCO Commodity Real Ret Strat Instl
-6.04 83.28 4.41 8.12 10.22 96.70
56.71 18.73 10.54 3.32 10.70 97.59
5.91 11.29 6.17 71.92 4.71 90.24
2.54 3.09 33.44 59.17 1.77 98.75
30.68 104.65 -39.91 0.15 4.43 47.81
Source: Morningstar Direct