
Presentation of Results for the year ended 31st March 2014
43
Presentation of Results for the year ended 31 st March 2015 4 th June 2015 Follow us on Twitter: @johnson_matthey Scan to download our IR app or visit www.matthey.com/app
Transcript of Presentation of Results for the year ended 31st March 2014

Presentation of Results for the year ended31st March 2015
4th June 2015
Follow us on Twitter: @johnson_matthey
Scan to download our IR app or visit www.matthey.com/app

Cautionary StatementThis presentation contains forward looking statements that are subject to risk factors associated with, amongst other things, the economic and business circumstances occurring from time to time in the countries and sectors in which Johnson Matthey operates. It is believed that the expectations reflected in these statements are reasonable but they may be affected by a wide range of variables which could cause actual results to differ materially from those currently anticipated.

Introduction
Robert MacLeodChief Executive

Key Messages
4
Good progress in2014/15, led by ECT
Underlying EPS up6% and 9% increasein dividend proposed
Focusing on attractive growth markets which fit with our core strengths
Good underlying growth expected in continuing businesses in 2015/16
Long term growthdrivers remain strong
£

Health and Safety is Our Priority
5
LTIIR (lost time injury and illness rate) = number of lost workday cases per 200,000 total hours worked in a rolling year
LTIIR reduced by 25% to 0.49due to renewed groupwidefocus on behavioural safety
Over 50% of accidents caused by manual handling incidents,
slips, trips and falls
Only 5% werechemical related
0
0.2
0.4
0.6
0.8
Apr‐14
May‐14
Jun‐14
Jul‐1
4
Aug‐14
Sep‐14
Oct‐14
Nov
‐14
Dec‐14
Jan‐15
Feb‐15
Mar‐15
LTIIR ‐ 12 month rolling year
LTIIR
H&S programme introduced

Financial Review
Den JonesGroup Finance Director

Underlying Results
7
Note: All figures are before amortisation of acquired intangibles, major impairment and restructuring charges, profit or loss on disposal of businesses, significant tax rate changes and, where relevant, related tax effects
Year to 31st March 2015£m
2014£m % change
% at constant rates (cr)
% at cr & excl. Anglo
Revenue 10,060 11,155 ‐10 ‐8
Sales excluding precious metals 3,125 2,981 +5 +8 +9
Operating profit 477.1 468.9 +2 +5
Interest and share of JV profit (37.0) (41.6)
Profit before tax 440.1 427.3 +3 +7 +15
Tax (74.9) (82.7)
Profit after tax 365.2 344.6 +6
Earnings per share 180.6p 170.6p +6
Dividend per share 68.0p 62.5p +9

Good Business Growth
8
Divisional profit movements are shown at constant rates. For Precious Metal Products movement also excludes loss of income from contracts with Anglo Platinum
2013/14 uPBT
Exchange Anglo ECT PT PMP FC NBRebased2013/14uPBT
2014/15 uPBT
£427m
£16m
£30m
£381m
£41m
£7m£4m
£6m £4m £5m
£440m
350
360
370
380
390
400
410
420
430
440
450
Underlying Profit Before Tax Bridge – 2013/14 to 2014/15(£m)
‐4%
‐7%
+10%+2%
+1%+1%
‐1%
+1%
Other

Reconciliation to Reported Results
9
Year to 31st March 2015£m
2014£m
Underlying profit before tax 440.1 427.3
Amortisation of acquired intangibles (17.3) (20.7)
Profit on sale of Gold and Silver Refining 69.7 ‐
Exchange on liquidation of businesses 3.3 ‐
Profit before tax 495.8 406.6
Earnings per share 211.2p 167.7p
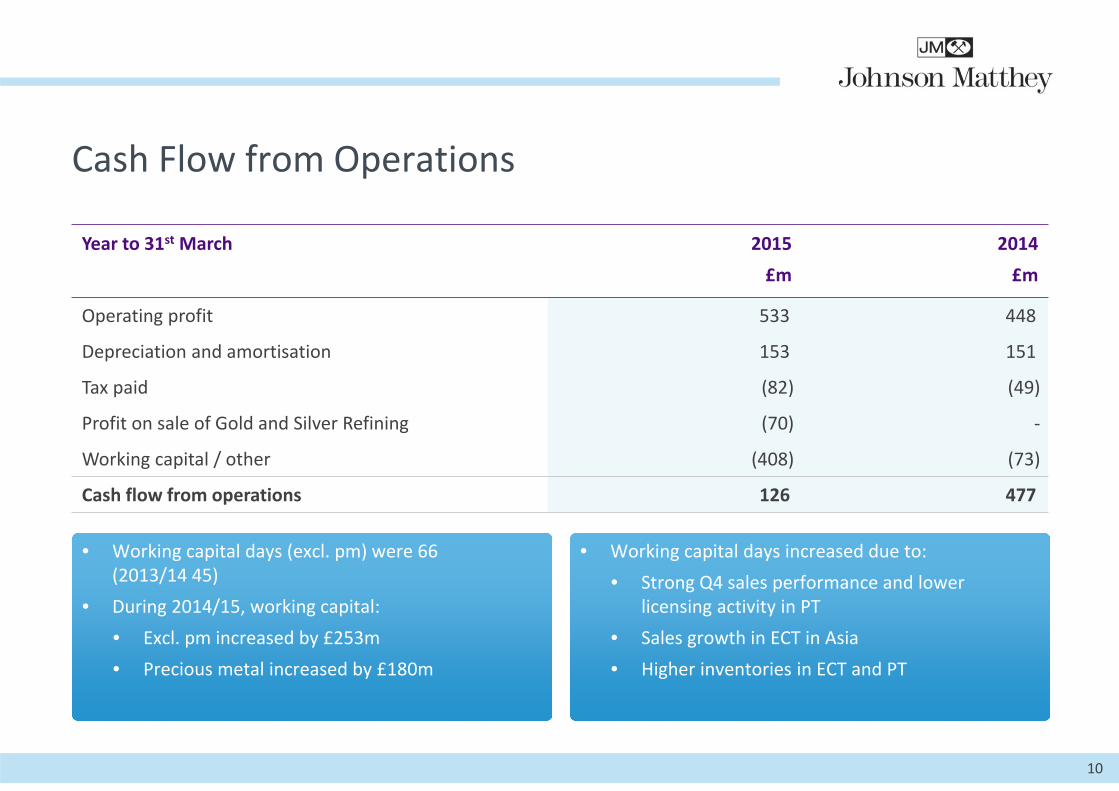
Cash Flow from Operations
10
Year to 31st March 2015£m
2014£m
Operating profit 533 448
Depreciation and amortisation 153 151
Tax paid (82) (49)
Profit on sale of Gold and Silver Refining (70) ‐
Working capital / other (408) (73)
Cash flow from operations 126 477
• Working capital days (excl. pm) were 66 (2013/14 45)
• During 2014/15, working capital:• Excl. pm increased by £253m• Precious metal increased by £180m
• Working capital days increased due to:• Strong Q4 sales performance and lower
licensing activity in PT• Sales growth in ECT in Asia• Higher inventories in ECT and PT
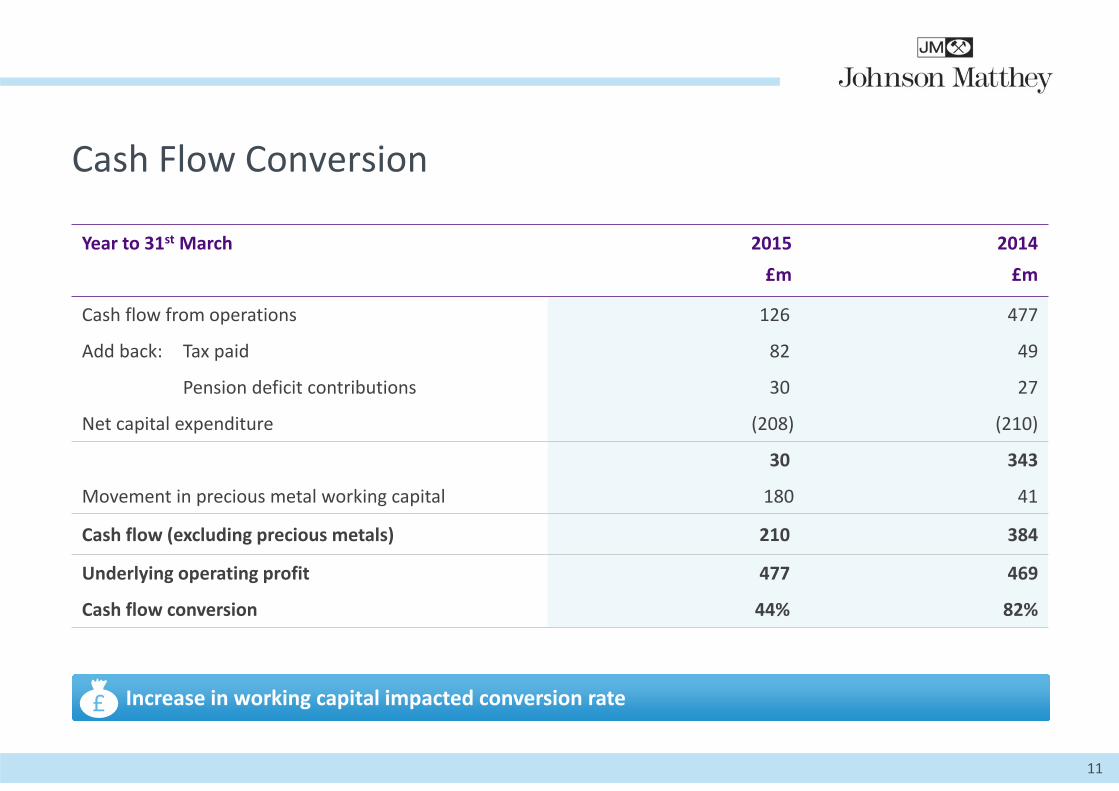
Cash Flow Conversion
11
Year to 31st March 2015£m
2014£m
Cash flow from operations 126 477
Add back: Tax paid 82 49
Pension deficit contributions 30 27
Net capital expenditure (208) (210)
30 343
Movement in precious metal working capital 180 41
Cash flow (excluding precious metals) 210 384
Underlying operating profit 477 469
Cash flow conversion 44% 82%
Increase in working capital impacted conversion rate£

Working Capital and Cash Flow Conversion Dynamics
Working capital days return tohistorical levels• 2013/14 unusually low• Expect range of 50 to 60 days due to:
• Growing business• Increasing business in China –
payment terms longer
Cash flow conversion expected to rise • Cash flow conversion expected to
average around 70% over the nextfew years
• Higher capex to support business growth
12
30%
40%
50%
60%
70%
80%
90%
100%
2010 2011 2012 2013 2014 2015 2016
Days
303540455055606570
2010 2011 2012 2013 2014 2015 2016
57 6054 53
45
66
50‐60
~70%

Continued Investment to Support Business Growth
Capital expenditure £211.8m(2013/14 £218.3m)• Key projects:
• Extension of European ECT facilities tomeet demand from new legislation
• Expansion of PT’s chemical catalyst manufacturing capacity in China and Europe
• Capex:depreciation = 1.6 times• Capex expected to be around £280m for
next two years• Capex:depreciation range 1.6 to 1.8 times• Investment in core business systems
R&D – gross expenditure up 12% at £169.9m
13
1
1.1
1.2
1.3
1.4
1.5
1.6
1.7
1.8
0
50
100
150
200
250
300
2012/13 2013/14 2014/15
Emission Control Technologies Process TechnologiesPrecious Metal Products Fine ChemicalsNew Businesses Corporate
Capex / depn (times)£m

Return on Invested Capital (ROIC)
14
8%
12%
16%
20%
24%
2011 2012 2013 2014 2015
Cost of capital
Target
Decline following change in Anglo contracts
Increase in precious metal balances
Group ROIC 18.8%
Remain committed to 20% target
£
Pt

Balance Sheet Remains Strong
• Net debt increased to £994.4m (2013/14 £729.2m)
• Net debt (including post tax pension deficits) / EBITDA 1.7 times
• Average cost of debt 2.4%• Average tenure 5.7 years
• Number of actions over last few years to reduce deficits
• UK scheme actuarial valuation underway
15
Treasury£ Pension Actuarial Basis
• £15m increase in pension costs in 2015/16 in underlying operating profit
• Mainly non‐cash and predominantly due to significantly lower discount rates
Pension Accounting (IAS 19)
Operating Review
Robert MacLeodChief Executive

Emission Control Technologies – Another Strong Year
17
Year to 31st March
£m 2015 2014 % change
% atconstantrates (cr)
Sales (excluding precious metals) 1,782 1,645 +8 +12
Underlying operating profit 236.9 203.6 +16 +21Return on sales 13.3% 12.4%Return on invested capital (ROIC) 24.1% 21.0%
Another strong year with:• Benefit from tighter legislation in Europe for cars and trucks• Continued growth in Asia, especially China• Strong demand for HDD trucks in the US• Process efficiency improvements and higher plant utilisation
HDD
41% LDV
59%
Sales

Outpacing Global Light Duty Growth
18
£181m £183m £179m
£543m £571m £622m
£214m £255m £257m
£938m£1,009m £1,058m
0
200
400
600
800
1000
1200
2012/13 2013/14 2014/15 2012/13 2013/14 2014/15 2012/13 2013/14 2014/15 2012/13 2013/14 2014/15
North America• North American car
production up 3%• JM volumes grew
broadly in line with market
Europe• JM’s sales well
ahead in a flat market
• Boosted by Euro 6b and a good performance by customers
Global• Sales at constant
rates well ahead of 1% growth in global car production
Johnson Matthey’s Light Duty Catalyst Sales£m
+9%
+1%
+5%
+9% at cr
+5% at cr
+14% at cr
‐1% at cr
Total sales
£1,058m up 5%
‐2%
Asia• Sales growth in China
supported by 7% increase in car production
• Increased demand in South East Asia and India but slower market in Japan

Strong HDD Sales Across all Regions
19
£347m £374m£441m
£148m£212m £225m
£28m £50m £58m
£523m
£636m£724m
0
100
200
300
400
500
600
700
800
2012/13 2013/14 2014/15 2012/13 2013/14 2014/15 2012/13 2013/14 2014/15 2012/13 2013/14 2014/15
Johnson Matthey’s Heavy Duty Diesel Catalyst Sales£m
+18%
+6%
+14%
Total sales
£724m up 14%
+20% at cr
+13% at cr
+25% at cr
+18% at cr
North America• Strong sales slightly
ahead of 16% growth in truck production
• Good demand for ‘Class 8’ trucks
Europe• Strong JM sales
supported by first full year of Euro VI
• Weaker truck market after pre‐buy in 2013
Global• Non‐road applications
around £58m of sales• Sales to stationary
applications around £50m
Asia• Growth driven by
continued roll out of Euro IV in China
• Around 35% fitment in China – now expanding beyond big cities
+17%
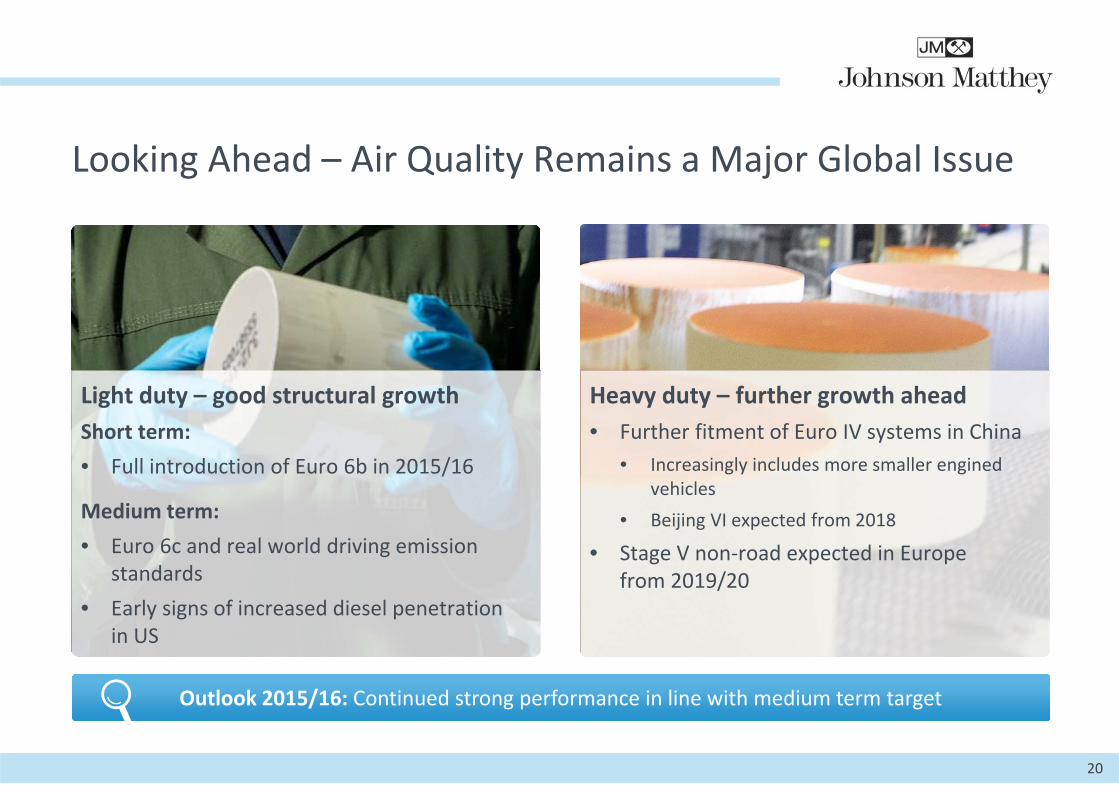
Looking Ahead – Air Quality Remains a Major Global Issue
20
Outlook 2015/16: Continued strong performance in line with medium term target
Light duty – good structural growthShort term:• Full introduction of Euro 6b in 2015/16
Medium term:• Euro 6c and real world driving emission
standards• Early signs of increased diesel penetration
in US
Heavy duty – further growth ahead• Further fitment of Euro IV systems in China
• Increasingly includes more smaller enginedvehicles
• Beijing VI expected from 2018
• Stage V non‐road expected in Europefrom 2019/20
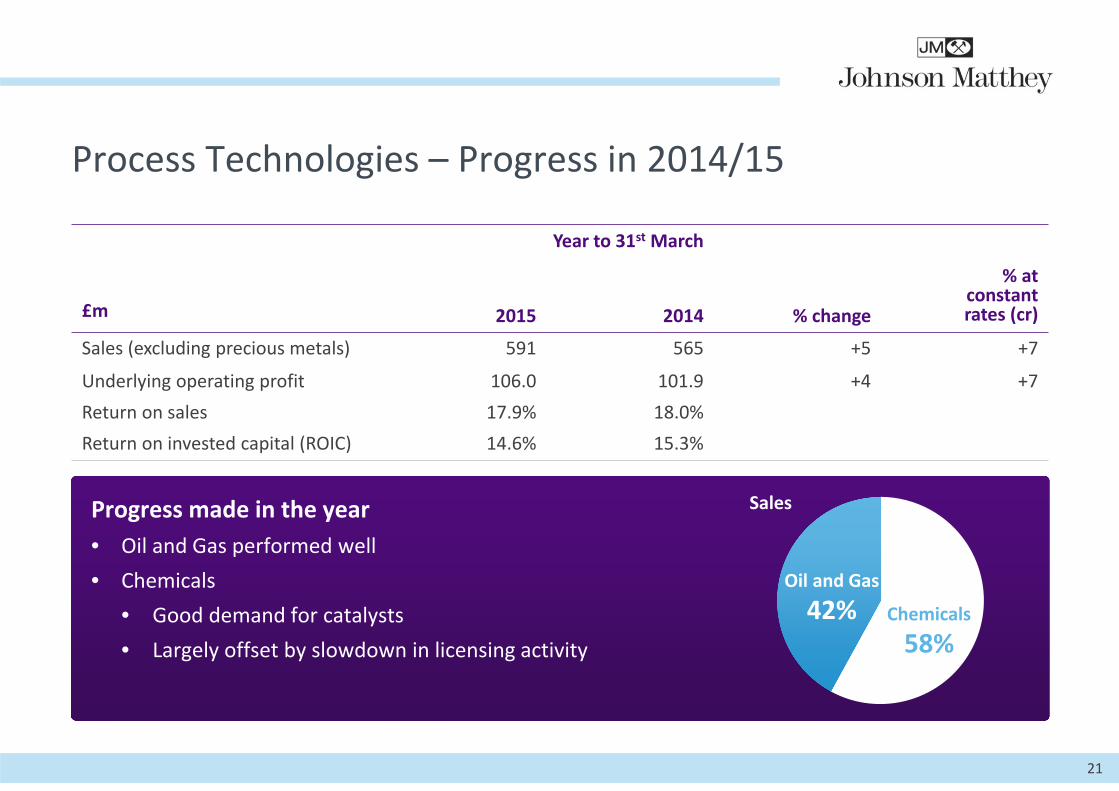
Process Technologies – Progress in 2014/15
21
Year to 31st March
£m 2015 2014 % change
% atconstant rates (cr)
Sales (excluding precious metals) 591 565 +5 +7
Underlying operating profit 106.0 101.9 +4 +7Return on sales 17.9% 18.0%Return on invested capital (ROIC) 14.6% 15.3%
Progress made in the year• Oil and Gas performed well• Chemicals
• Good demand for catalysts• Largely offset by slowdown in licensing activity
Oil and Gas
42% Chemicals
58%
Sales
Syngas54%
Petrochemicals25%
Oleo/biochemicals
21%
Ammonia16%
Methanol17%
Other 6%
Formaldehyde15%
0
5
10
15
2011 2012 2013 2014 2015
PT Chemicals ‐ Good Catalyst Sales but Slower in Licensing
Sales 1% ahead at £342m (4% up at cr)• Higher sales of ammonia catalysts and
formaldehyde technologies• Lower demand in methanol• Licensing sales reduced (£76 million vs
£82m in 2013/14) • 6 new licences secured – some smaller
projects and lower value mix • Slowdown continues after strong run –
mainly hit high value petrochemicals technologies
• New technologies being commercialised
• Progress in new bio‐based technology developments
22
Sales
Technology Licensing – Projects Awarded 2011 – 2015
Syngas
Methanol SNG Oxo alcohols Butanediol Other
Petrochemicals

Hydrogen
27%
Additives
27%Gas
Processing
15%
DiagnosticServices
31% Refineries54%
PT Oil and Gas – Performed Well Across All Sectors
Sales up 10% to £249m (up 11% at cr)• Growth supported by strong drivers in
mid/downstream markets• Strong sales of refinery hydrogen catalysts
boosted by new plant builds• Benefit from shift in mix towards higher
margin performance additives for FCC
• Diagnostic Services had a good year• Good demand for specialist measurement
products and services • Slightly lower demand for reservoir studies
due to lower oil price
23
Sales
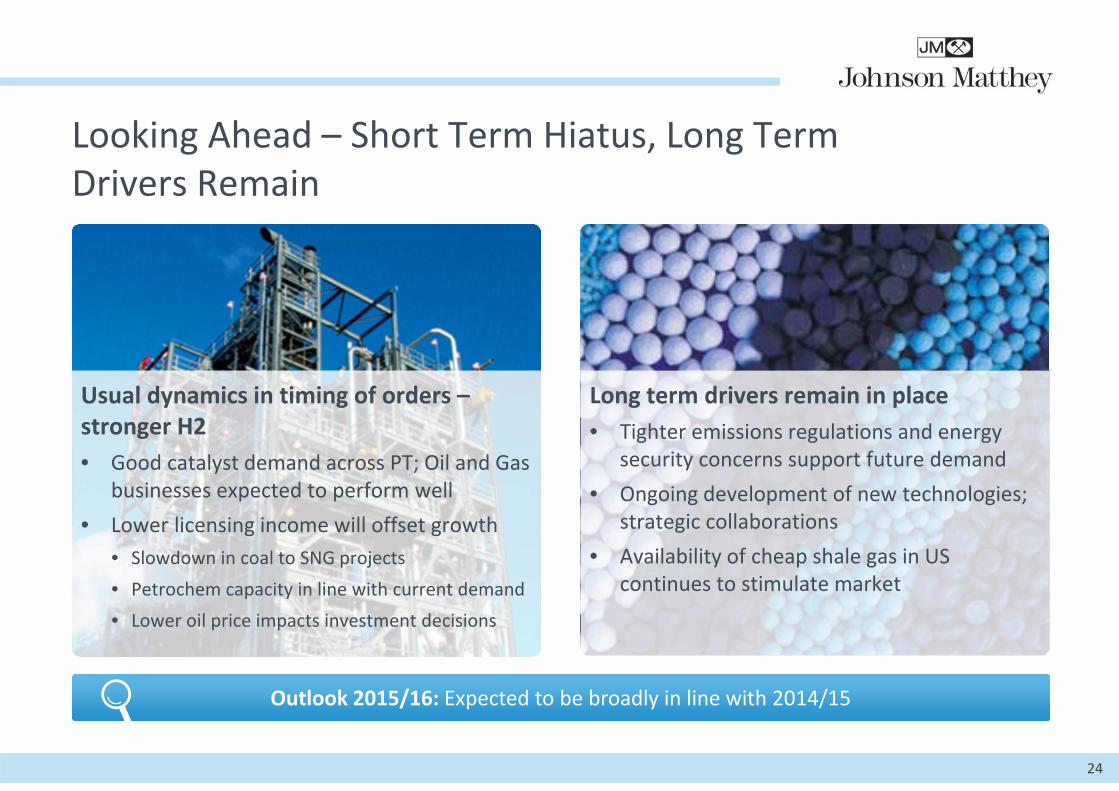
Looking Ahead – Short Term Hiatus, Long TermDrivers Remain
24
Outlook 2015/16: Expected to be broadly in line with 2014/15
Usual dynamics in timing of orders –stronger H2• Good catalyst demand across PT; Oil and Gas
businesses expected to perform well • Lower licensing income will offset growth
• Slowdown in coal to SNG projects• Petrochem capacity in line with current demand• Lower oil price impacts investment decisions
Long term drivers remain in place• Tighter emissions regulations and energy
security concerns support future demand• Ongoing development of new technologies;
strategic collaborations• Availability of cheap shale gas in US
continues to stimulate market

Precious Metal Products – Impacted by Anglo
25
Year to 31st March
£m 2015 2014 % change
% atconstantrates (cr)
Sales (excluding precious metals) 379 430 ‐12 ‐9
Underlying operating profit 101.5 130.9 ‐22 ‐21Return on sales 26.8% 30.5%Return on invested capital (ROIC) 21.6% 36.6%
• Steady performance excluding Anglo• Weakness in some of the Manufacturing
businesses’ markets• Completed sale of Gold and Silver Refining
business for £124m (10% of division’s sales)
Services
32%Manufacturing
68%
AdvancedGlass
Technologies21%
Noble Metals35%
ChemicalProducts12%
Sales

PMP Services – Strategic Supplier for JM Businesses
Sales down 26% at £120m (24% downat cr)• Precious Metals Management
impacted by change in Anglo contracts • Mixed year in Pgm Refining and
Recycling • Volumes slightly higher overall –
increased palladium intakes from Stillwater
• Some fall off in intakes in Q4 due to pgm price drop
• Operating profit and ROIC impacted by higher costs due to less favourable intake mix
26
Platinum and Palladium Prices
500
1,000
1,500
Mar‐14 Sep‐14 Mar‐15
Palladium Platinum
Pgm Refining and RecyclingThroughput by Sector
End of lifeautocatalysts
41%
JM12%
Others18%
Mines12%
Refiners11%
Pharma/chems
6%
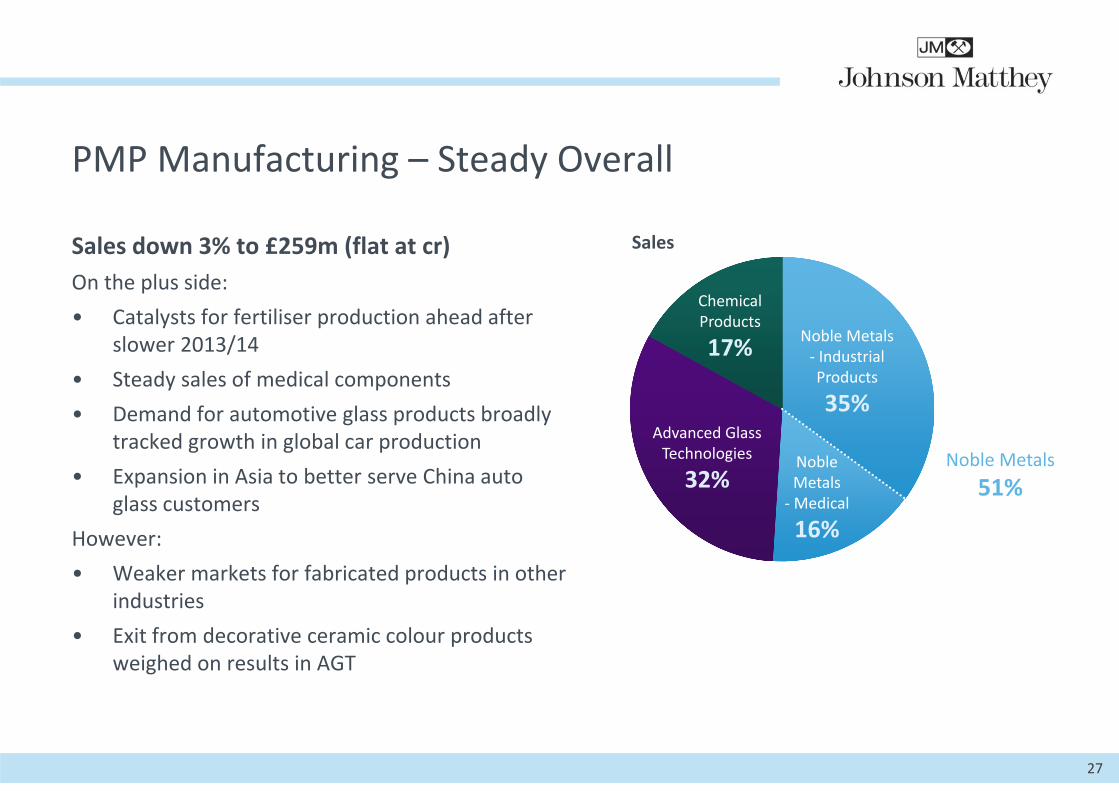
PMP Manufacturing – Steady Overall
Sales down 3% to £259m (flat at cr) On the plus side: • Catalysts for fertiliser production ahead after
slower 2013/14 • Steady sales of medical components • Demand for automotive glass products broadly
tracked growth in global car production• Expansion in Asia to better serve China auto
glass customersHowever: • Weaker markets for fabricated products in other
industries• Exit from decorative ceramic colour products
weighed on results in AGT
27
Sales
Noble Metals‐ Industrial Products
35%
NobleMetals
‐Medical
16%
Advanced GlassTechnologies
32%
ChemicalProducts
17%
Noble Metals51%

Looking Ahead – Short Term Tough but Investing for Growth
28
Outlook 2015/16: Performance expected to be significantly down
Pgm Refining• Lower metal prices currently impacting sales
and volumes• Higher costs expected ‐ shift to more
complex intake product mix• Efficiency improvement projects• Investment in China refinery
Absence of Gold and Silver Refining
Manufacturing businesses• Stable outlook for 2015/16• Focus on accessing higher growth markets
• Increased investment in new product development
• Some time until growth is realised

Fine Chemicals – A Good Year
29
Year to 31st March
£m 2015 2014 % change
% atconstant rates (cr)
Sales (excluding precious metals) 327 322 +1 +3
Underlying operating profit 88.8 84.1 +6 +7
Return on sales 27.2% 26.1%
Return on invested capital (ROIC) 18.4% 18.8%
• Steady sales growth in API Manufacturing• Process efficiency and supply chain
improvements benefited operating profit• Advanced negotiations on sale of Research
Chemicals businessAPI
Manufacturing66%
ResearchChemicals24%
Catalysisand Chiral
Technologies10%
Sales

Expanding API Capabilities, Leveraging Synergies
30
API Manufacturing• Sales up 3% to £216m (also up 3% at cr)• Demand for APIs mixed across our portfolio
with steady sales overall• Growth supported by custom API
development
Catalysis and Chiral Technologies (CCT)• Sales up 4% to £34m (up 7% at cr)• Good demand for catalyst products • Leveraging synergies with API Manufacturing
Research Chemicals• Sales down 3% to £77m (1% down at cr)
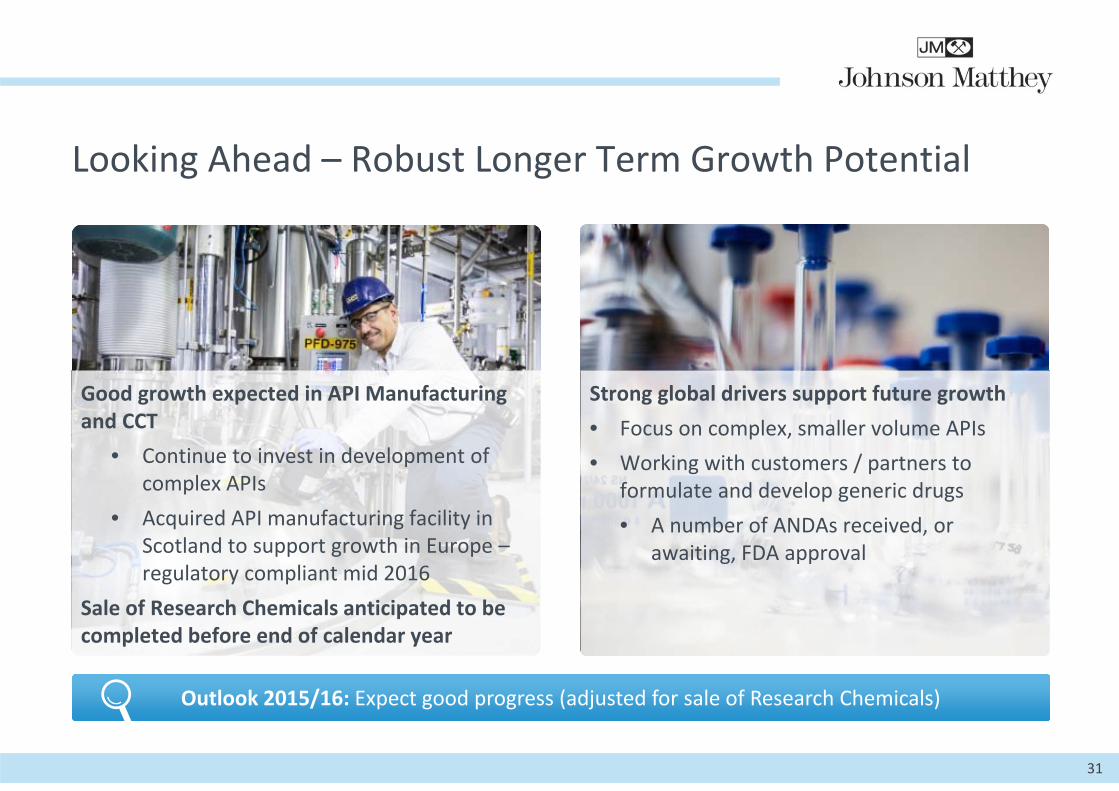
Looking Ahead – Robust Longer Term Growth Potential
31
Outlook 2015/16: Expect good progress (adjusted for sale of Research Chemicals)
Good growth expected in API Manufacturing and CCT
• Continue to invest in development of complex APIs
• Acquired API manufacturing facility in Scotland to support growth in Europe –regulatory compliant mid 2016
Sale of Research Chemicals anticipated to be completed before end of calendar year
Strong global drivers support future growth • Focus on complex, smaller volume APIs• Working with customers / partners to
formulate and develop generic drugs• A number of ANDAs received, or
awaiting, FDA approval

New Businesses – Good Progress in 2014/15
32
Year to 31st March
£m 2015 2014 % change
% atconstant rates (cr)
Sales (excluding precious metals) 91 76 +20 +27
Underlying operating profit / (loss) (22.1) (18.3) ‐21 ‐19
Battery Technologies (sales 23% ahead at £84m)• Good demand from power tools and e‐bikes sectors• Two battery materials acquisitions made small contribution• Acquisitions and investment in R&D led to slight operating loss
Fuel Cells (sales £6m, 2013/14 £7m)• Impacted in 1H by key customer in administration• Ongoing work with automotive OEMs on development programmes
Continued investment in other opportunities
BatteryTechnologies
92%
Fuel Cells7%
Other1%Sales
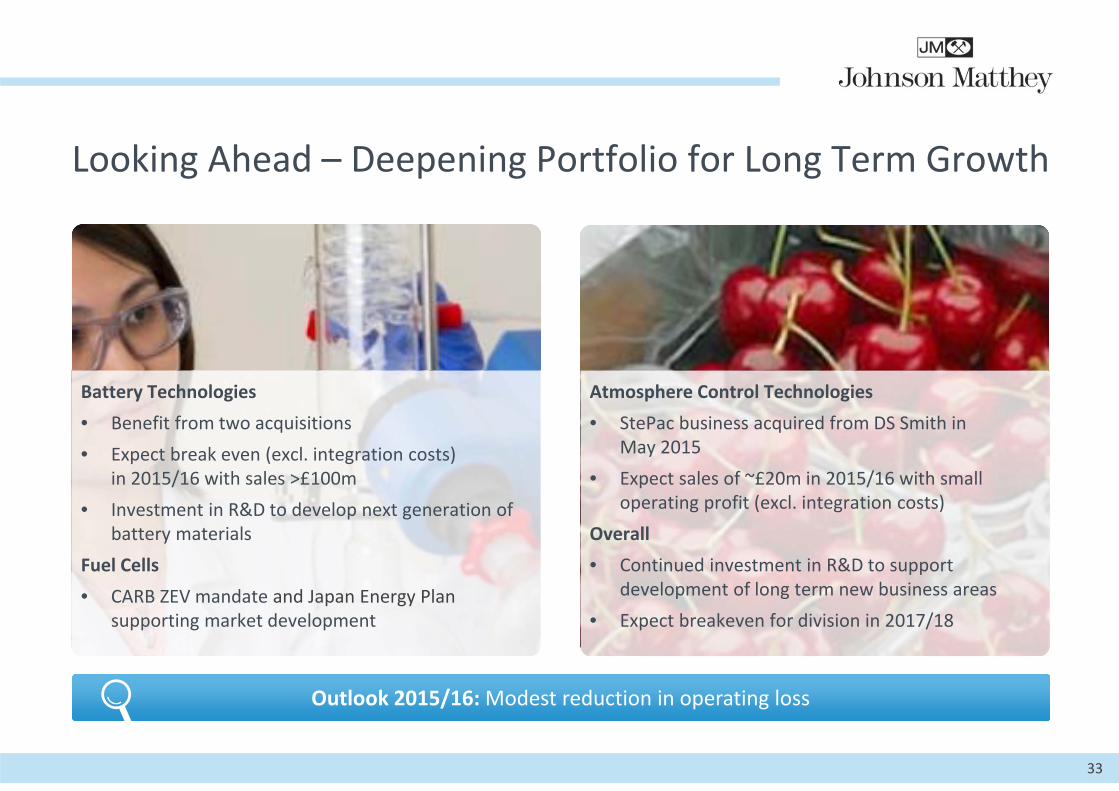
Looking Ahead – Deepening Portfolio for Long Term Growth
33
Outlook 2015/16: Modest reduction in operating loss
Battery Technologies• Benefit from two acquisitions• Expect break even (excl. integration costs)
in 2015/16 with sales >£100m • Investment in R&D to develop next generation of
battery materials Fuel Cells• CARB ZEV mandate and Japan Energy Plan
supporting market development
Atmosphere Control Technologies • StePac business acquired from DS Smith in
May 2015• Expect sales of ~£20m in 2015/16 with small
operating profit (excl. integration costs)Overall• Continued investment in R&D to support
development of long term new business areas• Expect breakeven for division in 2017/18

Outlook 2015/16
34
Good underlying growth incontinuing businesses
Expect 2015/16 to be slightlyahead of 2014/15
Well placed for longterm growth

Key Messages
35
Good progress in2014/15, led by ECT
Underlying EPS up6% and 9% increasein dividend proposed
Focusing on attractive growth markets which fit with our core strengths
Good underlying growth expected in continuing businesses in 2015/16
Long term growthdrivers remain strong
£

Questions and Answers
36
Robert MacLeodChief Executive
Den JonesGroup Finance Director
Larry PentzExecutive Director
John WalkerExecutive Director, Emission Control Technologies
John FowlerDivision Director,Fine Chemicals
Nick GarnerDivision Director,
New Businesses and Corporate Development
Alan MyersDivision Director,
Precious Metal Products
Geoff OttermanDivision Director,
Process Technologies

37

Estimated Light Duty Vehicle Sales and Production
38
Source: LMC Automotive
Year to 31st March 2H 2H
2015millions
2014millions
%change
2014/15millions
2013/14millions
%change
NorthAmerica
Sales 19.6 18.4 +6 9.4 8.8 +7
Production 16.8 16.3 +3 8.4 8.2 +3
EuropeSales 18.0 18.1 ‐ 9.1 9.0 +1
Production 19.9 19.9 ‐ 10.1 10.2 ‐1
AsiaSales 39.6 38.5 +3 21.2 21.1 ‐
Production 44.9 43.6 +3 23.1 23.0 +1
GlobalSales 88.5 86.7 +2 45.3 44.8 +1
Production 86.8 85.6 +1 44.2 44.0 ‐

Global Growth in Vehicle Production Drives ECT
16.2 17.0 17.5 17.9 18.2 19.1 19.5 20.1 20.1 20.5 21.9 23.4
43.1 44.6 46.4 49.1
51.5 58.8
84.7 87.1 89.5
93.6 98.2
109.3
0
20
40
60
80
100
120
2013 2014 2015 2016 2017 2020 2013 2014 2015 2016 2017 2020 2013 2014 2015 2016 2017 2020 2013 2014 2015 2016 2017 2020
CAGR 2.0%(2014 – 2020)
CAGR 2.6%(2014 – 2020)
CAGR 4.7%(2014 – 2020)
CAGR 3.9%(2014 – 2020)
39
Source: LMC Automotive (April 2015)
Light Duty Vehicle Production Outlook – 2013 ‐ 2020 (calendar years)million
North America Europe Asia Global

2010 2011 2012 2013 2014 2015 2016 2017 2018 2019 2020
USA Tier II Tier III
USA (CARB) LEV II LEV III
EU Euro 5 Euro 6b Euro 6c
Russia Euro 3 Euro 4 Euro 5 (proposed)
Japan Japan 2009
China National Euro 4 Euro 5
India ‐ National BS II BS III BS IV
India ‐ Cities BS III BS IV
S Korea (Gasoline) LEV II
S Korea (Diesel) Euro 5 Euro 6
Indonesia Euro 2 Euro 3 or 4 (expected)
Thailand Euro 3 Euro 4 Euro 5 (expected)
Brazil L5 L6 L7 (proposed)
Emission Control Technologies
40
Light Duty Vehicle Legislation

Estimated HDD Truck Sales and Production
41
Source: LMC Automotive
Year to 31st March 2H 2H
2015thousands
2014thousands
%change
2014/15thousands
2013/14thousands
%change
NorthAmerica
Sales 514.0 446.6 +15 256.5 221.7 +16
Production 542.9 467.2 +16 271.0 230.0 +18
EUSales 272.9 298.2 ‐8 143.3 163.6 ‐12
Production 387.3 436.2 ‐11 201.1 229.0 ‐12
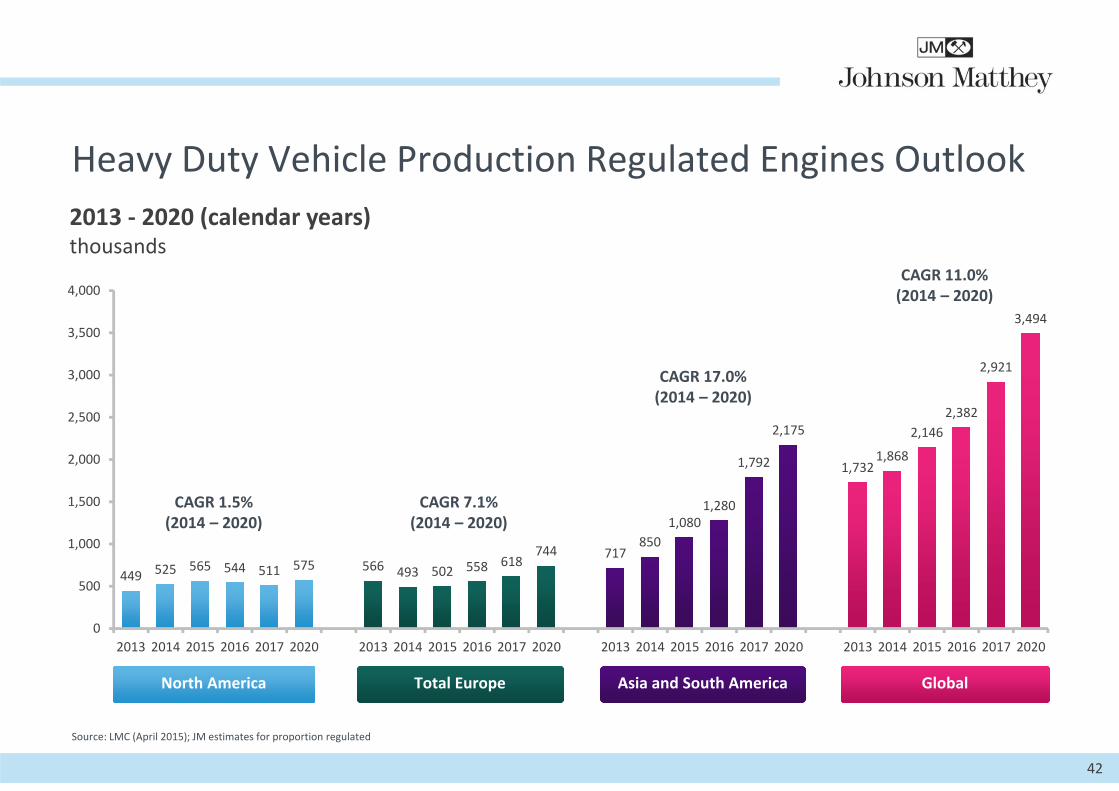
Heavy Duty Vehicle Production Regulated Engines Outlook
42
Source: LMC (April 2015); JM estimates for proportion regulated
449 525 565 544 511 575 566 493 502 558 618744 717
850 1,080
1,280
1,792
2,175
1,732 1,868
2,146 2,382
2,921
3,494
0
500
1,000
1,500
2,000
2,500
3,000
3,500
4,000
2013 2014 2015 2016 2017 2020 2013 2014 2015 2016 2017 2020 2013 2014 2015 2016 2017 2020 2013 2014 2015 2016 2017 2020
CAGR 1.5%(2014 – 2020)
CAGR 7.1%(2014 – 2020)
CAGR 17.0%(2014 – 2020)
CAGR 11.0%(2014 – 2020)
2013 ‐ 2020 (calendar years)thousands
North America Total Europe Asia and South America Global

2010 2011 2012 2013 2014 2015 2016 2017 2018 2019 2020
ON ROAD Europe EU V EU VINorth America EPA10 EPA10 + Greenhouse Gas RegulationJapan JP 09 JP 16South Korea EU V EU VIBrazil EU III EU V EU VI?Russia EU III EU IV EU VIndia (Main Cities) BS IVIndia (Nationwide) BS III BS IV?China (Beijing) EU IV EU V EU VI? (some expected from 2016)
China (Nationwide) EU III EU IV EU V?Thailand EU III EU IV
NON‐ROAD Europe Stage IIIa Stage IIIb Stage IV Stage VNorth America Tier 3 Tier 4 Interim Tier 4 FinalJapan Tier 3 Tier 4 Interim Tier 4 FinalSouth Korea Tier 3 Tier 4 FinalBrazil Stage IIIa
Emission Control Technologies
43
Heavy Duty Diesel Legislation


![Results Presentation for Financial Quarter and year ended 31st March 2016 [Company Update]](https://static.fdocuments.net/doc/165x107/577c7c621a28abe0549a6205/results-presentation-for-financial-quarter-and-year-ended-31st-march-2016-company.jpg)


