Port of Duluth-Superior Cargoes - 83rd Minnesota Legislature
WATER SYSTEM COMPUTER MODELING
(ROCHESTER WATER SYSTEM)
(2007)
Presentation atMinnesota Section AWWA Annual Conference
Duluth, Minnesota
Donn Richardson/Doug RovangRochester Public Utilities
September 20, 2007
Audience Check
• How Many of You are Familiar With Water System Computer Modeling?
• How Many of You have Done Any Water System Extended Period Simulations (EPS) – Modeling, or are having a consultant do EPS modeling for you?
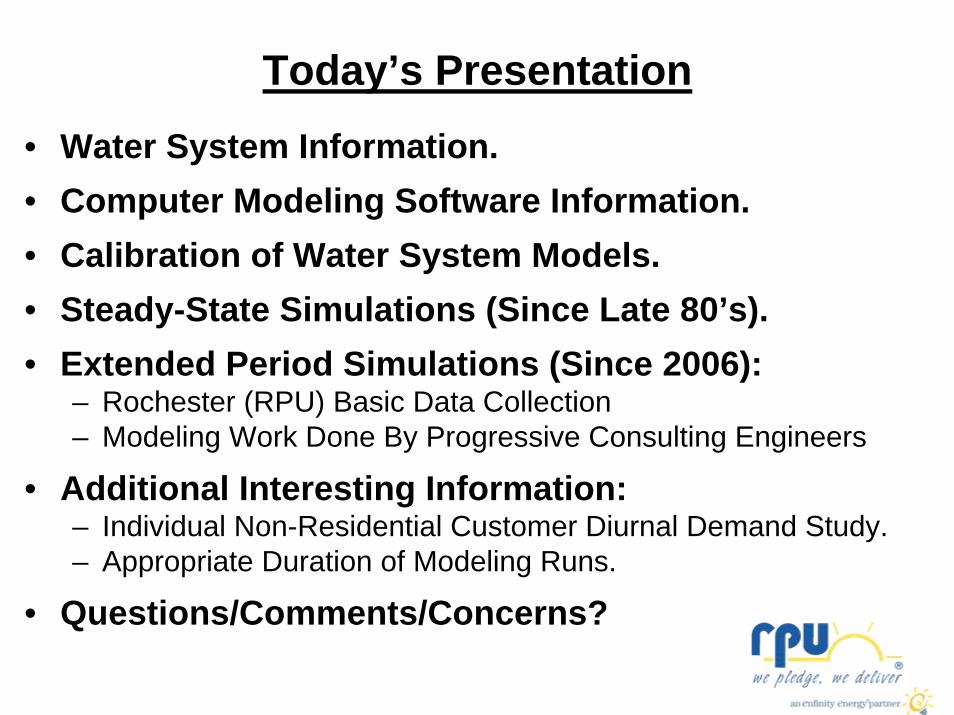
Today’s Presentation• Water System Information.• Computer Modeling Software Information.• Calibration of Water System Models.• Steady-State Simulations (Since Late 80’s).• Extended Period Simulations (Since 2006):
– Rochester (RPU) Basic Data Collection– Modeling Work Done By Progressive Consulting Engineers
• Additional Interesting Information:– Individual Non-Residential Customer Diurnal Demand Study.– Appropriate Duration of Modeling Runs.
• Questions/Comments/Concerns?
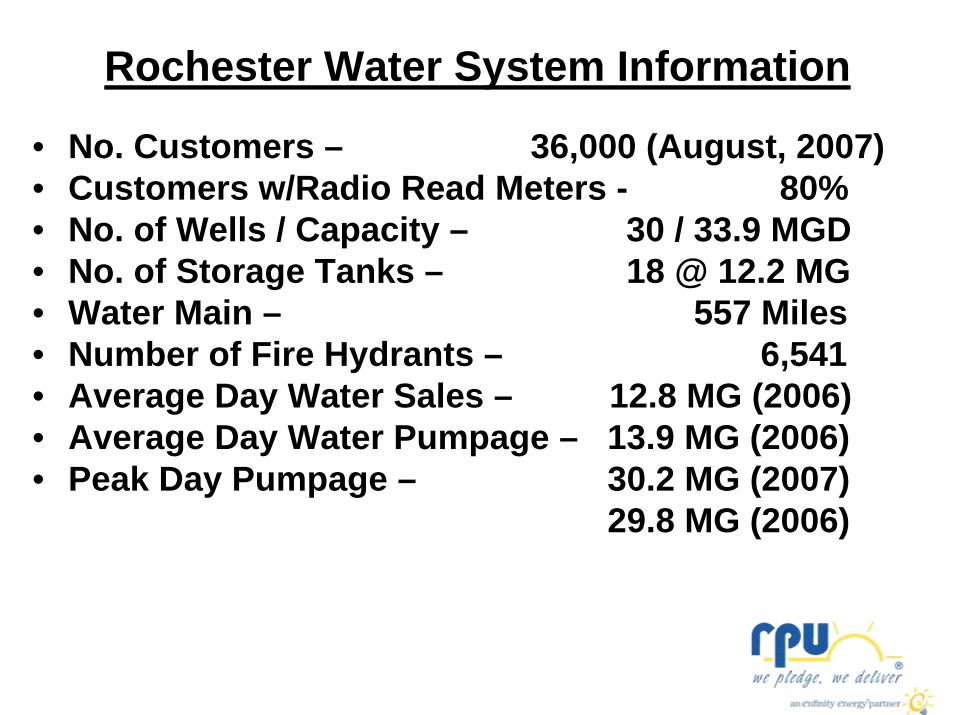
Rochester Water System Information
• No. Customers – 36,000 (August, 2007)• Customers w/Radio Read Meters - 80%• No. of Wells / Capacity – 30 / 33.9 MGD• No. of Storage Tanks – 18 @ 12.2 MG• Water Main – 557 Miles• Number of Fire Hydrants – 6,541• Average Day Water Sales – 12.8 MG (2006)• Average Day Water Pumpage – 13.9 MG (2006)• Peak Day Pumpage – 30.2 MG (2007)
29.8 MG (2006)
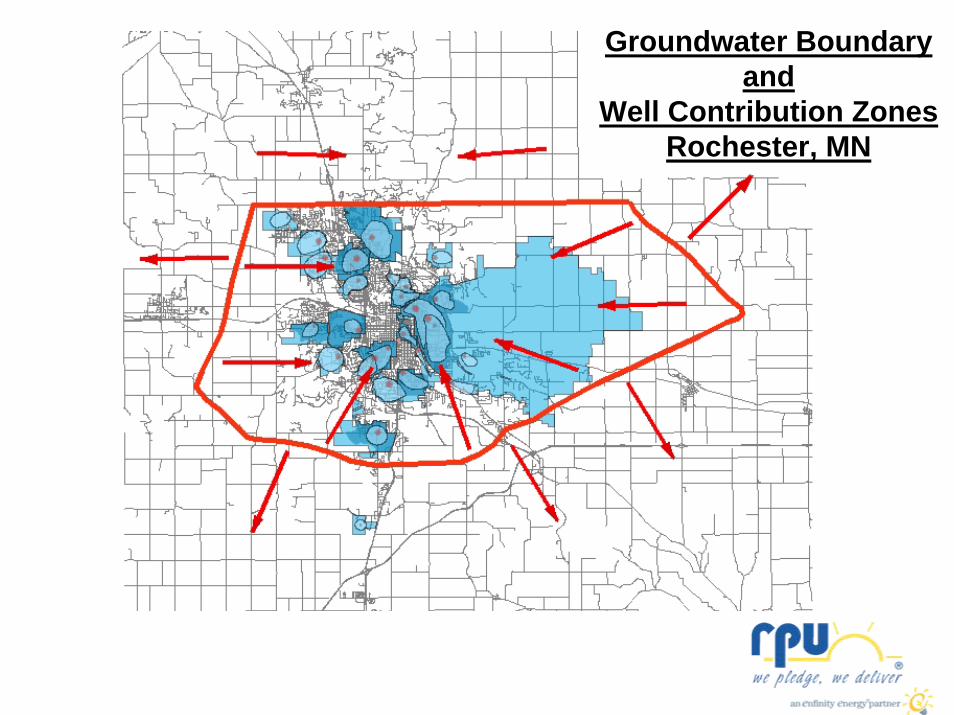
Groundwater Boundaryand
Well Contribution ZonesRochester, MN
`
`
`
`
``
` `
``
`
`
`
` `
`
`
`
``
``
5
5
5
`
`
`
`
``
¤
¤
¤¤
¤
¤
¤
¤
¤
¤
¤
¤
¤
¤
¤
¤
¤
¤
`5
`
¤̀
`
`
5
504
05
38
37
8020
12
73
99
98
97
94
92
91
90
89
88
87
86
85
84
83
8281
95
96
74 75
36
35
23
16
03
02
01
17
32
30
13
28
22
34
2415
27
21
72
33
19
1826
25
11
29
31
70
71
04T
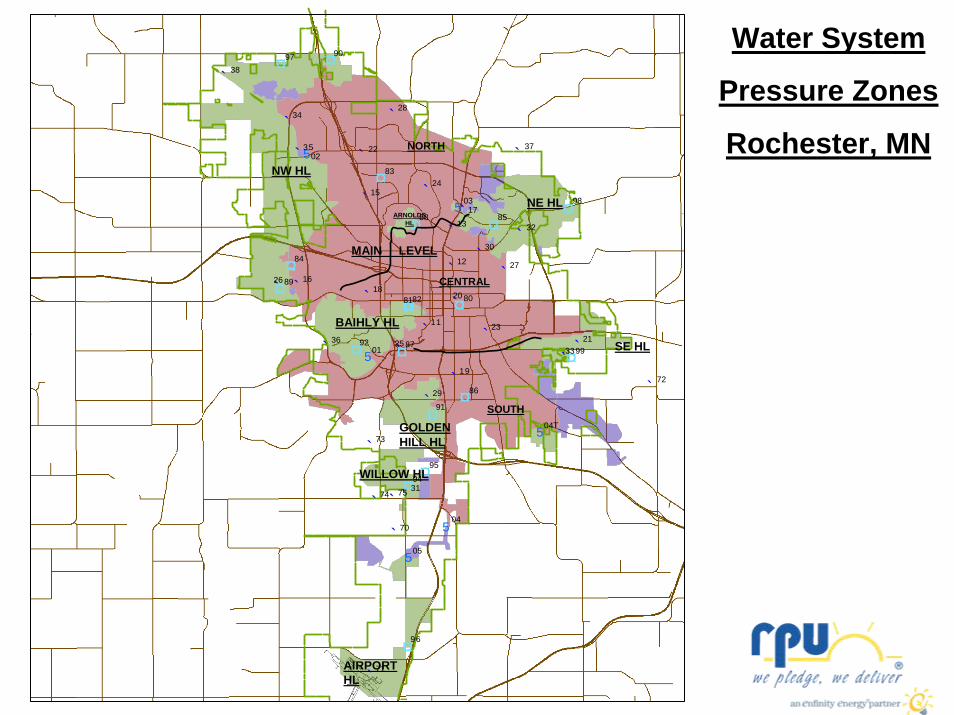
Water System
Pressure Zones
Rochester, MNNORTH
CENTRAL
SOUTH
NW HL
MAIN LEVEL
NE HL
AIRPORT HL
BAIHLY HL
GOLDENHILL HL
SE HL
WILLOW HL
ARNOLDS HL
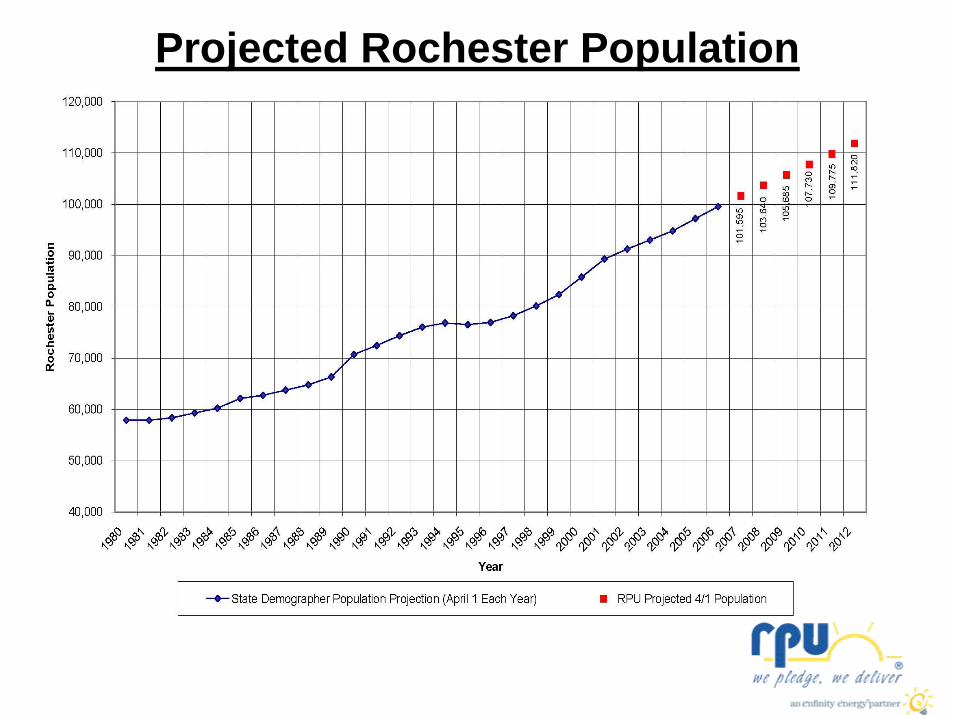
Projected Rochester Population
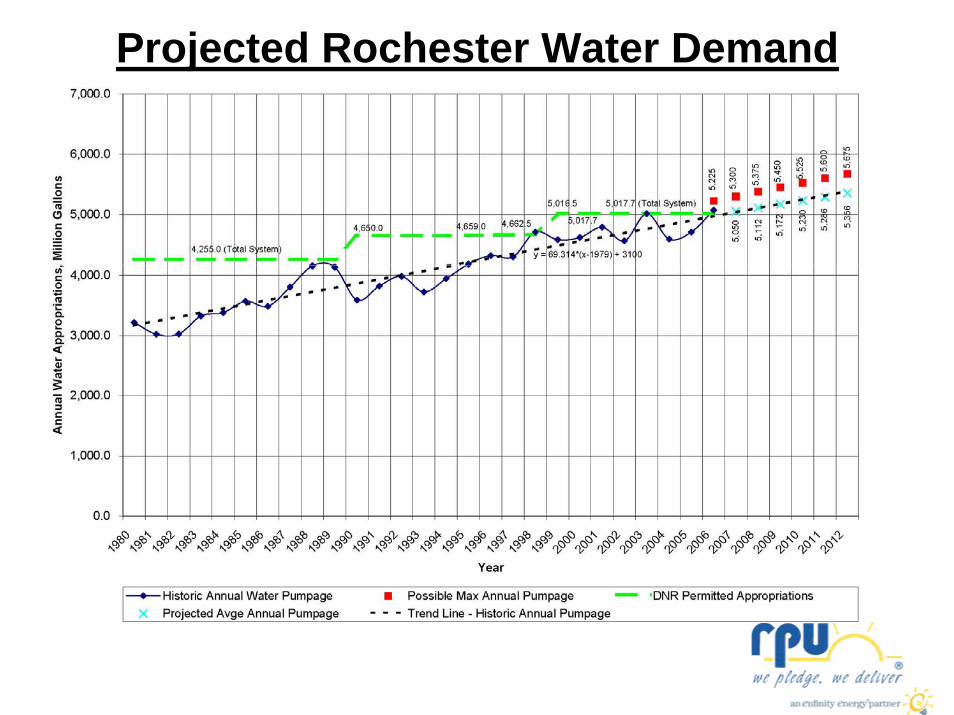
Projected Rochester Water Demand
Rochester’s Water Modeling Software
• Started using “WaterWorks” Water System Modeling Software in Late 80’s (SynexSystems Corp of Vancouver, B.C.):– “WaterWorks” spreadsheet-only program in late 1980’s.– Then, “WaterWorks” plus AutoCad in early 1990.– Upgraded to 2,000 node version in 1994.
• Purchased 5,000 Node “Cybernet” Package (again using AutoCad) from HaestadMethods, Inc. in 1996.– Conversion from “WaterWorks” extended into 1998.
• Upgraded to Haestad “WaterCAD” in 2001.– “WaterCAD” taken over by Bentley Systems in 2006.
Steady-State System Simulation Use(Since Late ’80’s)
• Determining Appropriate Water Main Sizes for New Subdivisions.
• Verifying Water System Fire Flow Capability for Fire Department.
• Estimating Building Fire Flow Capabilities for Fire Sprinkler System Hydraulic Designers. (Rochester Fire Department requires modelingresults rather than field hydrant flow tests.)
Calibration of Water System Models
• Old and New Fire Hydrant Field Test Information has been used to calibrate models.(2005 Hydraulic Model / Field Flow Verification Table
shown on Next Slide).
• Model Pipe C-Values Verified (Quite High):– 12” or larger water mains - 150– 8” water mains - 140– 6” or smaller water mains - 130
(Rochester pumps directly from wells to mains - no softening – water mains maintain high flow capacity.)
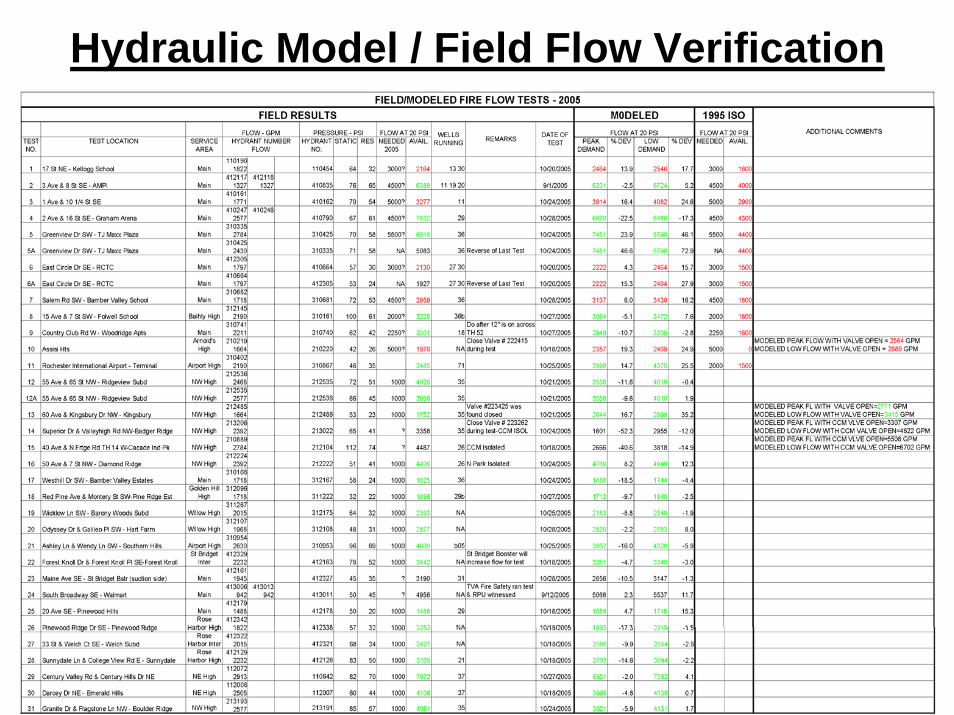
Hydraulic Model / Field Flow Verification
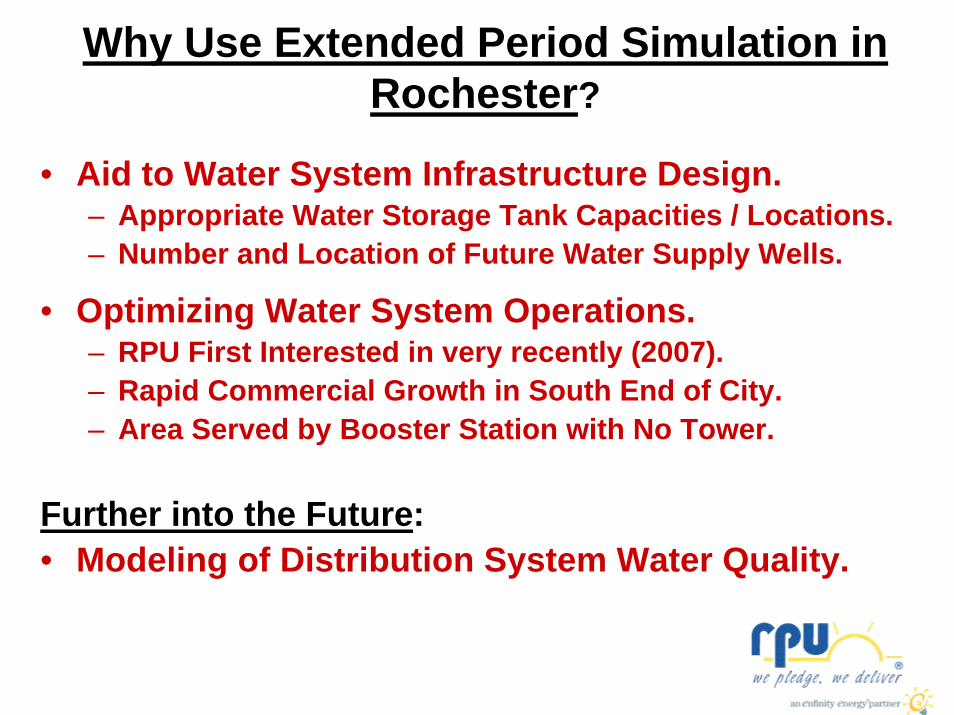
Why Use Extended Period Simulation in Rochester?
• Aid to Water System Infrastructure Design.– Appropriate Water Storage Tank Capacities / Locations.– Number and Location of Future Water Supply Wells.
• Optimizing Water System Operations.– RPU First Interested in very recently (2007).– Rapid Commercial Growth in South End of City.– Area Served by Booster Station with No Tower.
Further into the Future:• Modeling of Distribution System Water Quality.
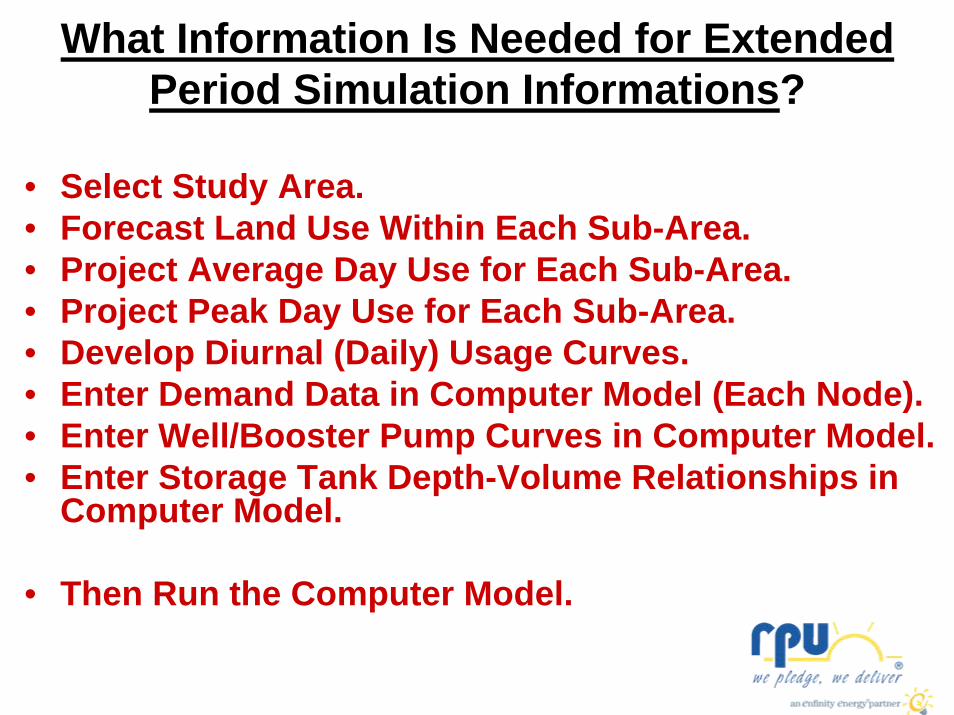
What Information Is Needed for Extended Period Simulation Informations?
• Select Study Area.• Forecast Land Use Within Each Sub-Area.• Project Average Day Use for Each Sub-Area.• Project Peak Day Use for Each Sub-Area.• Develop Diurnal (Daily) Usage Curves.• Enter Demand Data in Computer Model (Each Node).• Enter Well/Booster Pump Curves in Computer Model.• Enter Storage Tank Depth-Volume Relationships in
Computer Model.
• Then Run the Computer Model.
EPS Modeling Process
• Select Study Area.
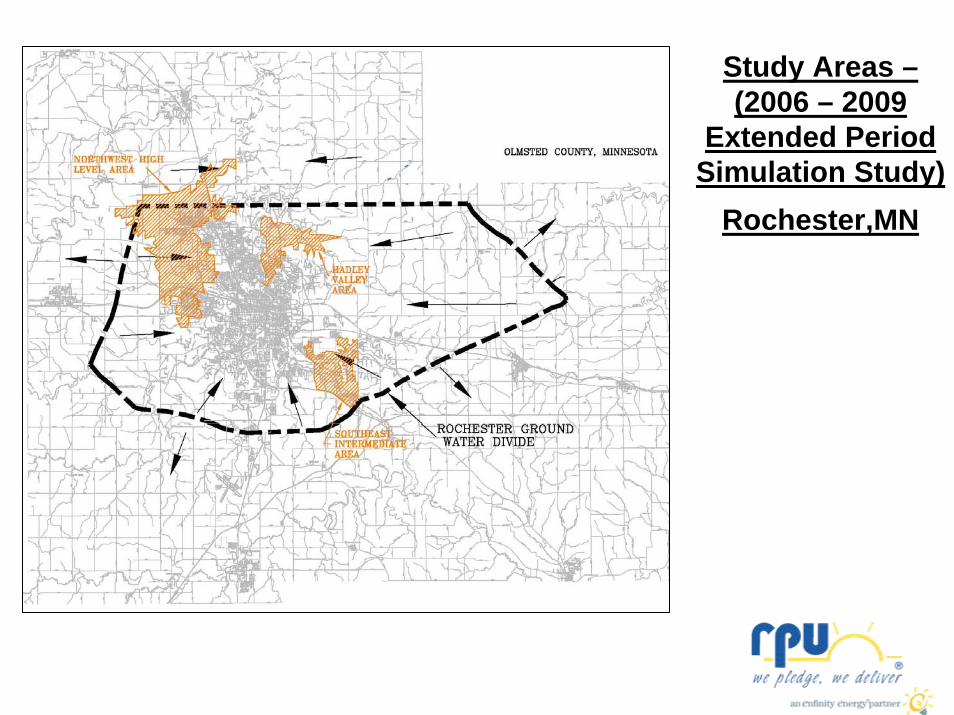
Study Areas –(2006 – 2009
Extended Period Simulation Study)
Rochester,MN
EPS Modeling Process
• Select Study Area.• Forecast Land Use Within Each Sub-Area.• Project Average Day Use For Each Sub-Area.
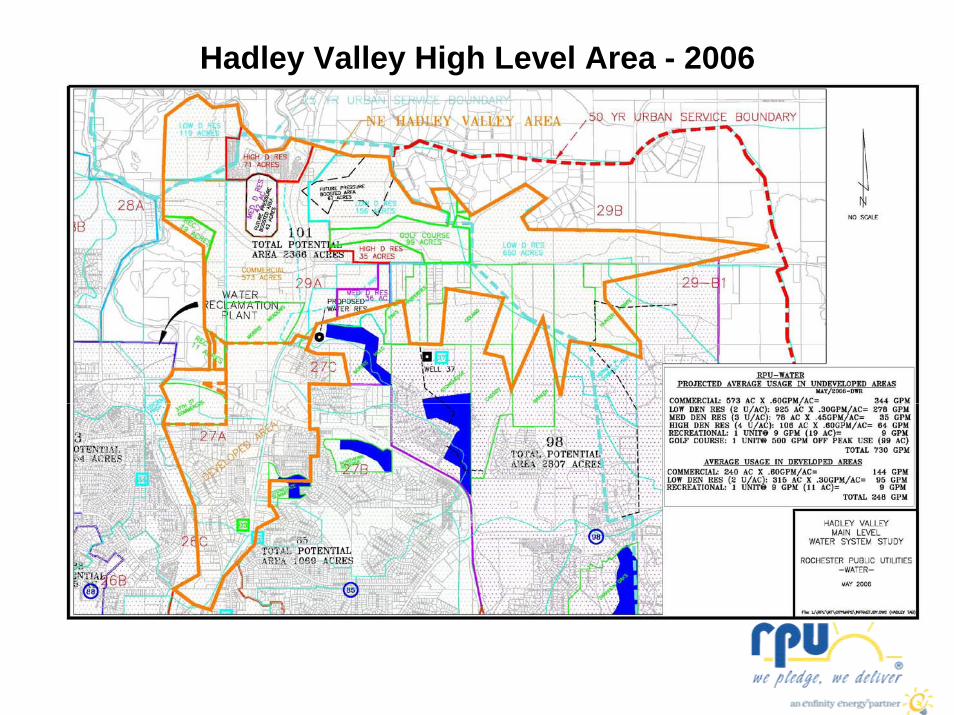
Hadley Valley High Level Area - 2006
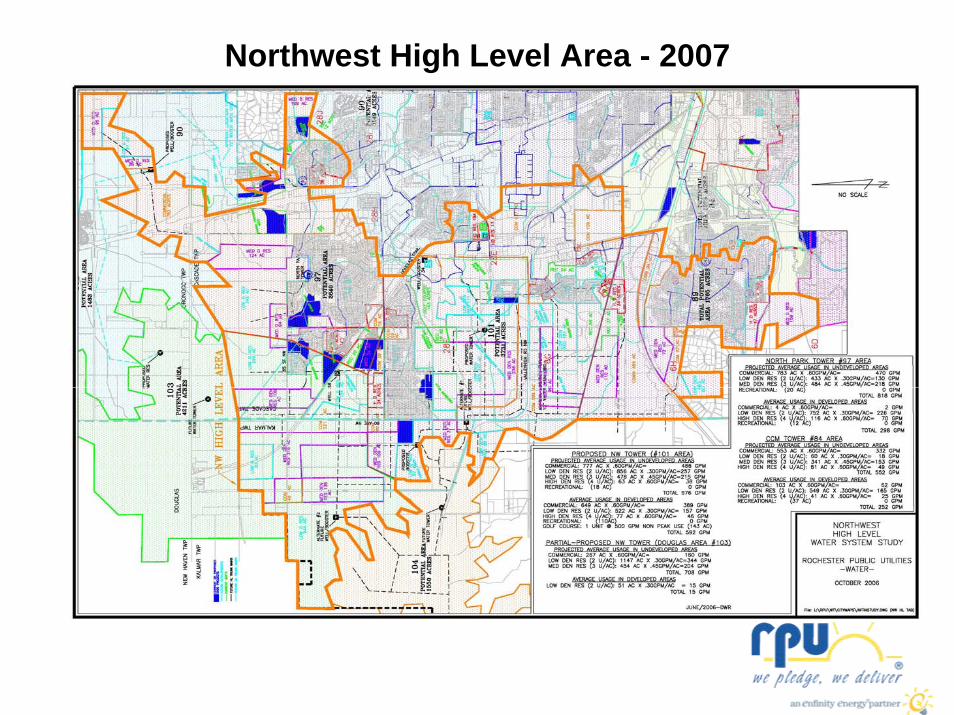
Northwest High Level Area - 2007
EPS Modeling Process
• Select Study Area.• Forecast Land Use Within Each Sub-Area.• Project Average Day Use For Each Sub-Area.• Project Peak Day Use For Each Sub-Area.
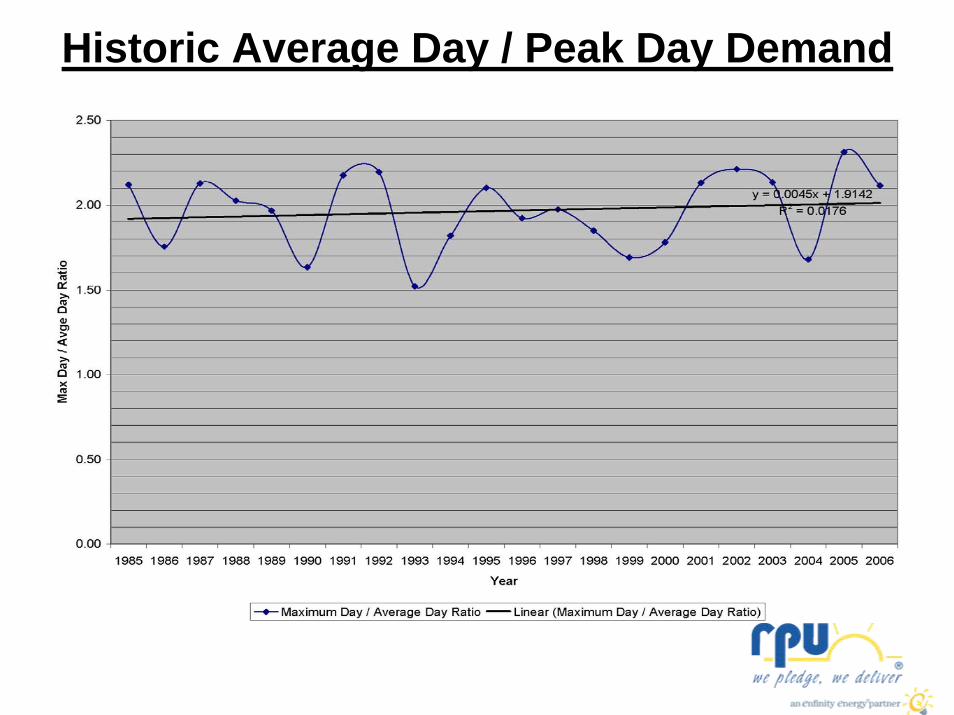
Historic Average Day / Peak Day Demand

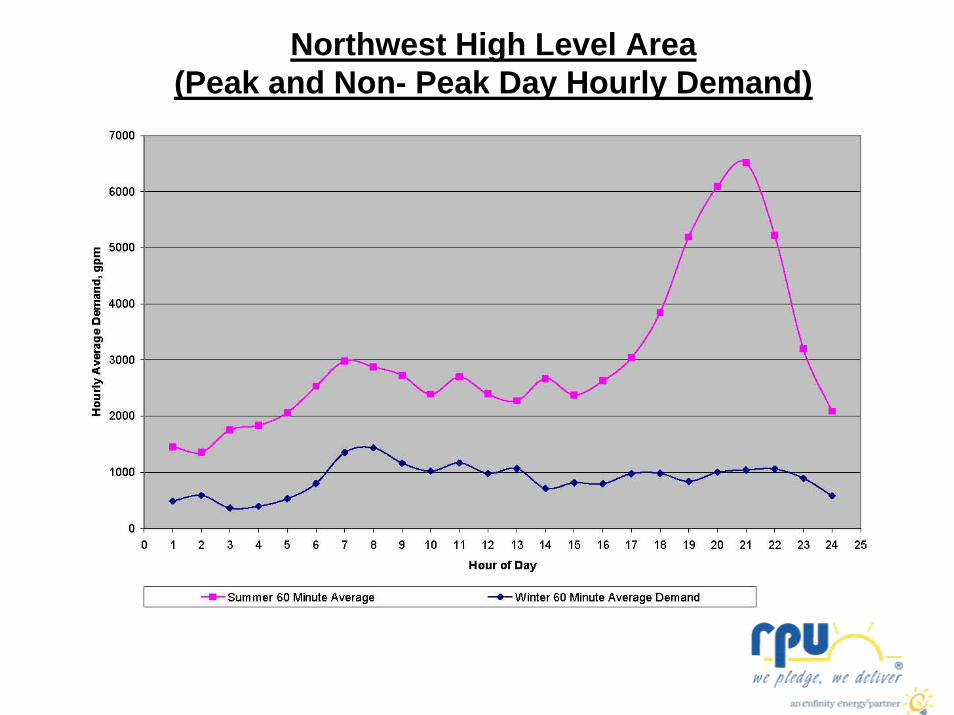
Northwest High Level Area(Peak and Non- Peak Day Hourly Demand)
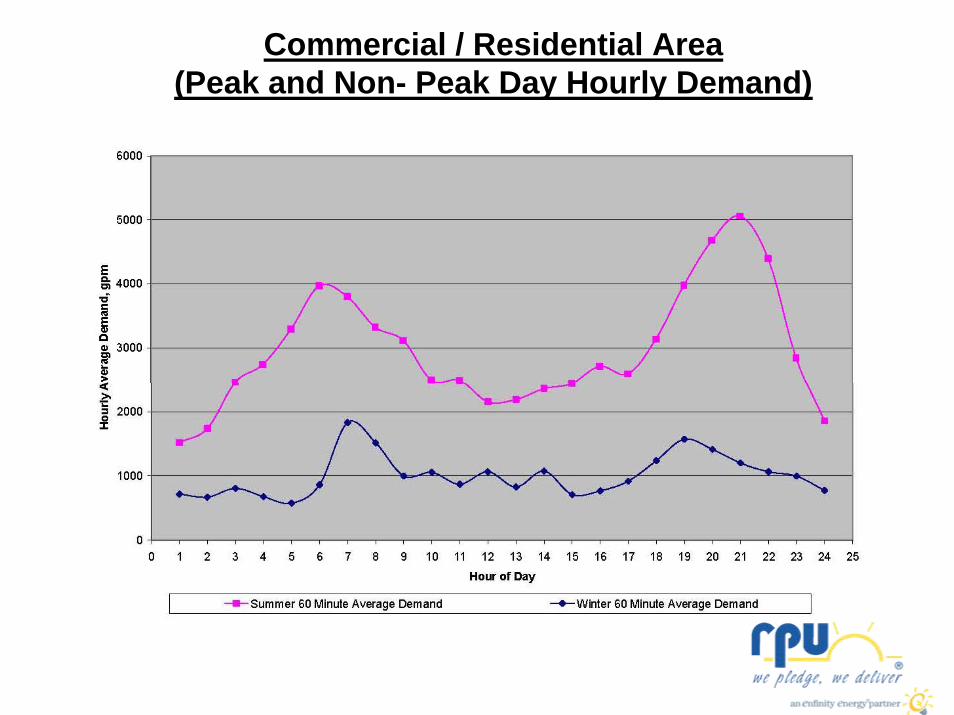
Commercial / Residential Area(Peak and Non- Peak Day Hourly Demand)
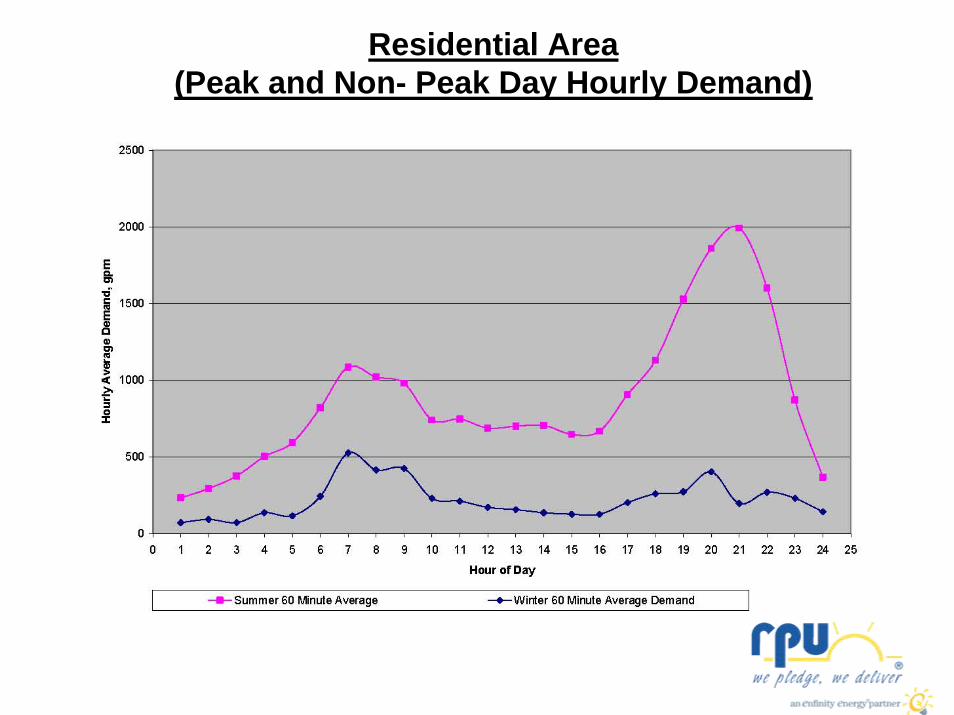
Residential Area(Peak and Non- Peak Day Hourly Demand)
EPS Modeling Process
• Select Study Area.• Forecast Land Use Within Each Sub-Area.• Project Average Day Use For Each Sub-Area.• Project Peak Day Use For Each Sub-Area.• Develop Diurnal (Daily) Usage Curves.
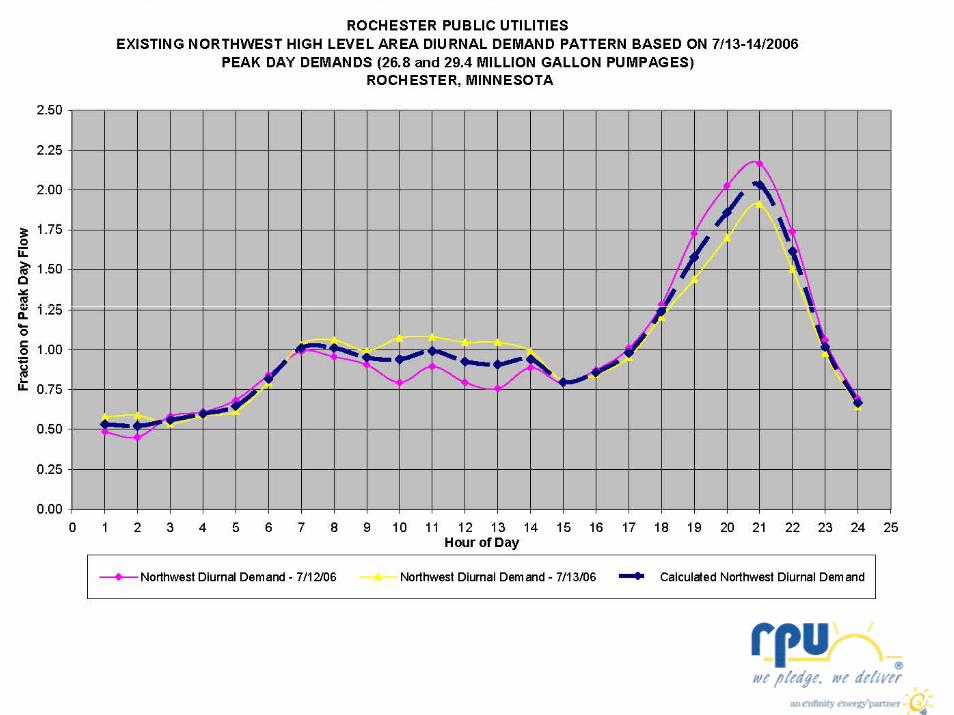
Northwest High Level Area(Peak and Non- Peak Day Hourly Demand)
EPS Modeling Process
• Select Study Area.• Forecast Land Use Within Each Sub-Area.• Project Average Day Use For Each Sub-Area.• Project Peak Day Use For Each Sub-Area.• Develop Diurnal (Daily) Usage Curves.• Enter Demand Data In Computer Model (Each Node).
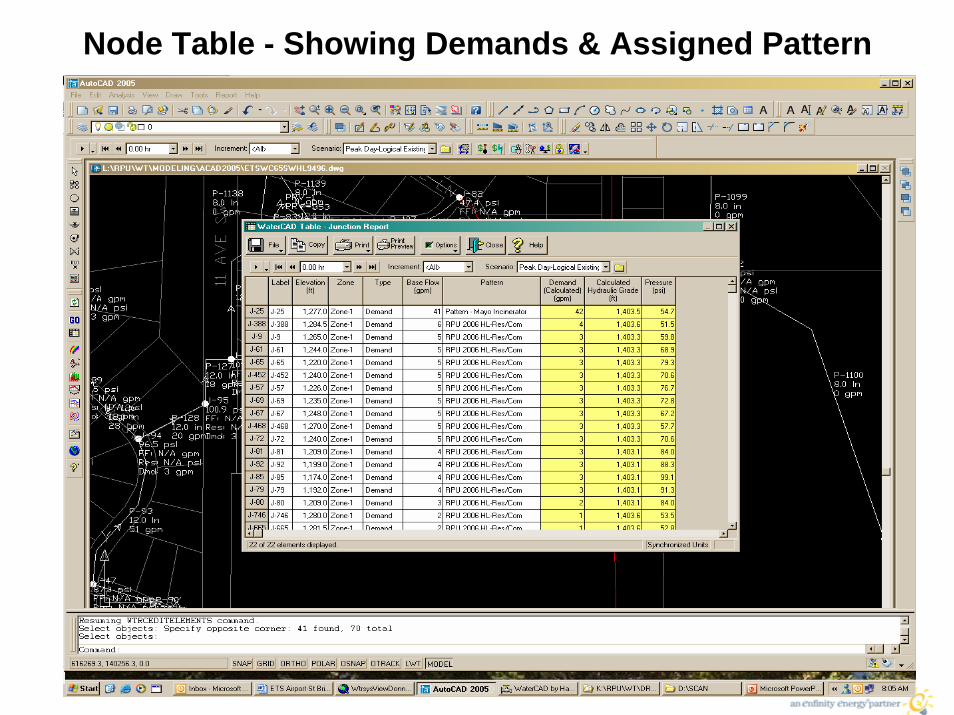
Node Table - Showing Demands & Assigned Pattern
EPS Modeling Process
• Select Study Area.• Forecast Land Use Within Each Sub-Area.• Project Average Day Use For Each Sub-Area.• Project Peak Day Use For Each Sub-Area.• Develop Diurnal (Daily) Usage Curves.• Enter Demand Data In Computer Model (Each Node).• Enter Well/Booster Pump Curves In Computer Model.

Well 35 Pump Head Curve (Adjusted for drawdown)
well-35 (Relative Speed Factor = 1.0000)Pump Head Curve
Discharge(gpm)
(ft)
Head
0.0
50.0
100.0
150.0
200.0
250.0
300.0
350.0
400.0
450.0
500.0
0.0 500.0 1000.0 1500.0 2000.0 2500
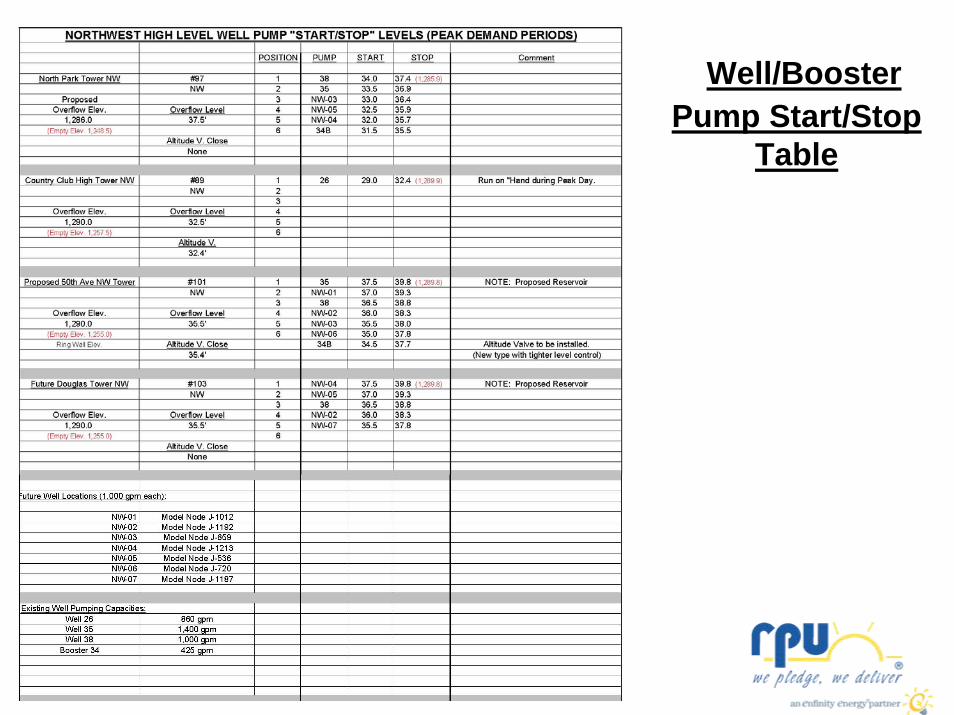
Well/Booster Pump Start/Stop
Table
EPS Modeling Process
• Select Study Area.• Forecast Land Use Within Each Sub-Area.• Project Average Day Use For Each Sub-Area.• Project Peak Day Use For Each Sub-Area.• Develop Diurnal (Daily) Usage Curves.• Enter Usage Data In Computer Model (Each Node).• Enter Well/Booster Pump Curves In Computer Model.• Enter Storage Tank Depth-Volume Relationships In
Computer Model.
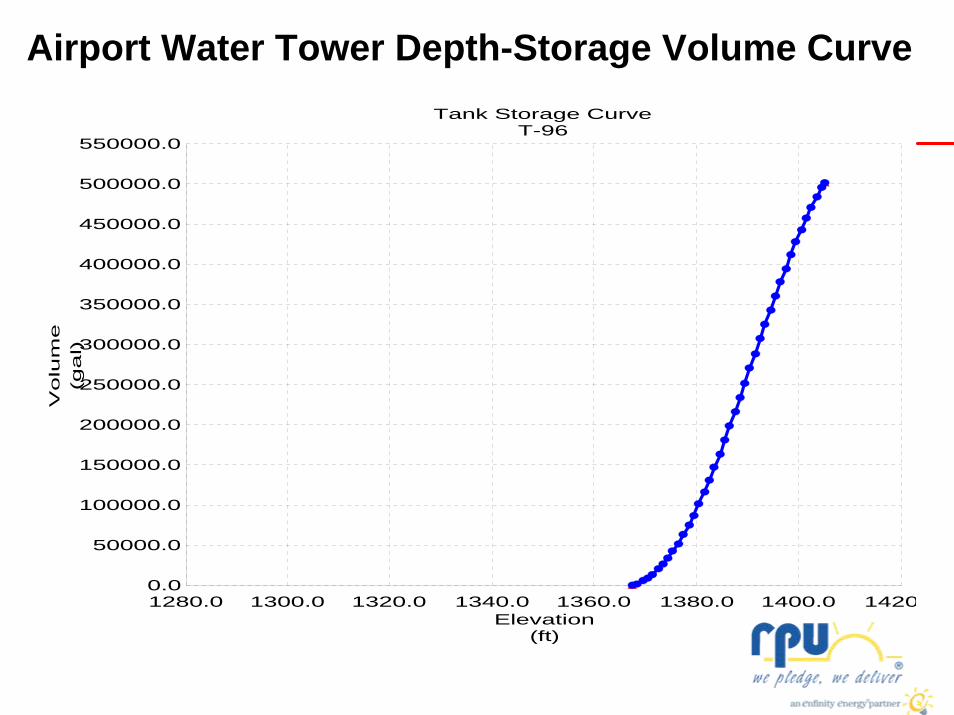
Airport Water Tower Depth-Storage Volume Curve
T-96Tank Storage Curve
Elevation(ft)
(gal)
Vo
lum
e
0.0
50000.0
100000.0
150000.0
200000.0
250000.0
300000.0
350000.0
400000.0
450000.0
500000.0
550000.0
1280.0 1300.0 1320.0 1340.0 1360.0 1380.0 1400.0 1420
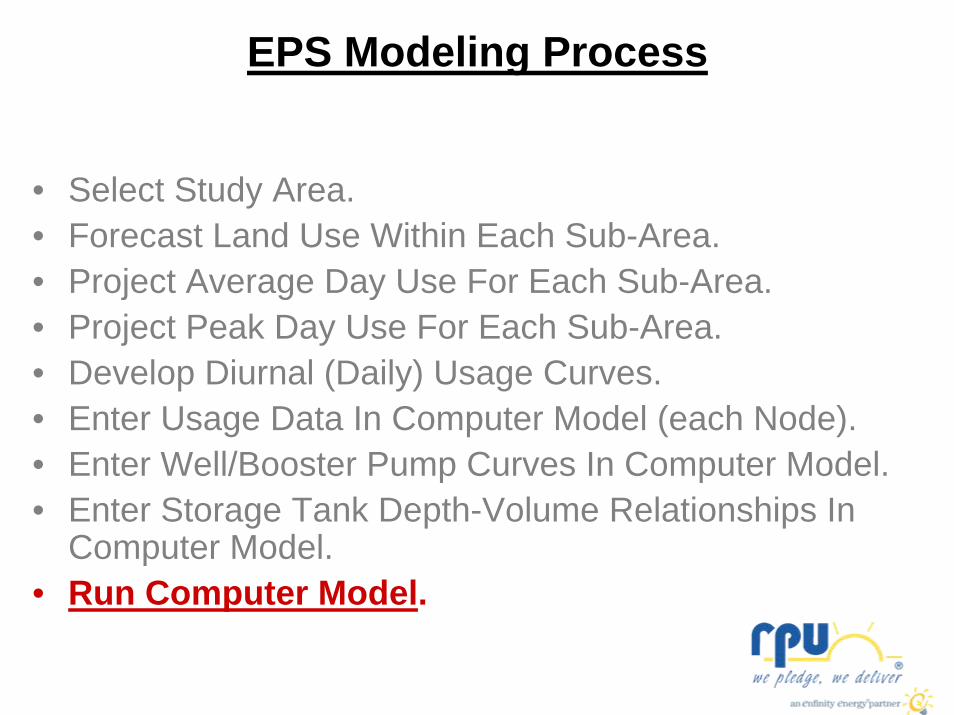
EPS Modeling Process
• Select Study Area.• Forecast Land Use Within Each Sub-Area.• Project Average Day Use For Each Sub-Area.• Project Peak Day Use For Each Sub-Area.• Develop Diurnal (Daily) Usage Curves.• Enter Usage Data In Computer Model (each Node).• Enter Well/Booster Pump Curves In Computer Model.• Enter Storage Tank Depth-Volume Relationships In
Computer Model.• Run Computer Model.
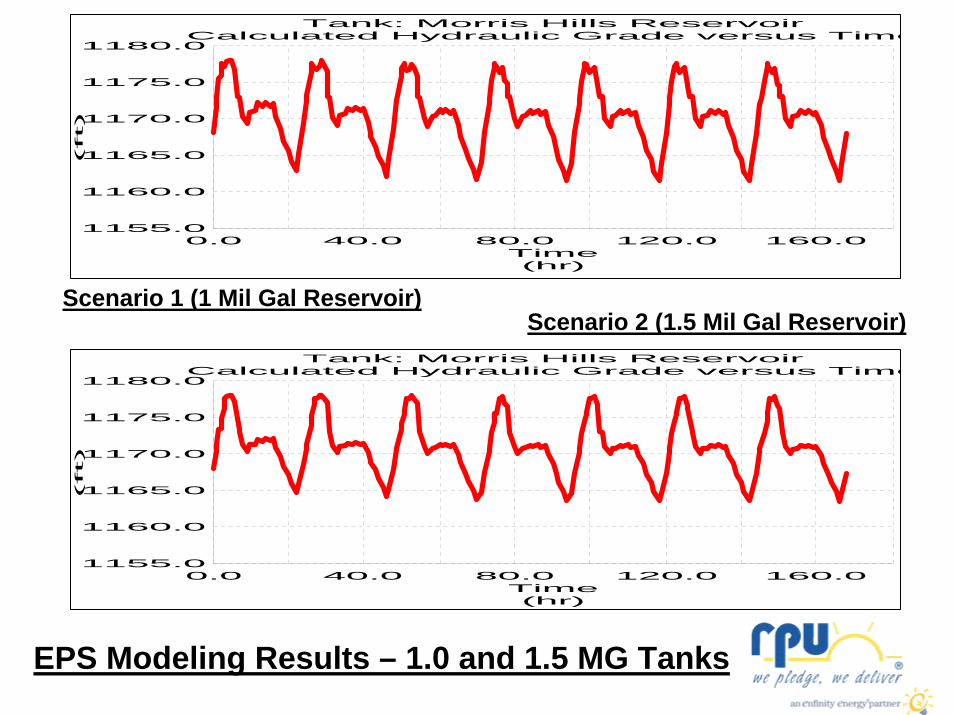
Calculated Hydraulic Grade versus TimeTank: Morris Hills Reservoir
Time(hr)
(ft)
1155.0
1160.0
1165.0
1170.0
1175.0
1180.0
0.0 40.0 80.0 120.0 160.0
Scenario 1 (1 Mil Gal Reservoir)Scenario 2 (1.5 Mil Gal Reservoir)
Calculated Hydraulic Grade versus TimeTank: Morris Hills Reservoir
Time(hr)
(ft)
1155.0
1160.0
1165.0
1170.0
1175.0
1180.0
0.0 40.0 80.0 120.0 160.0
EPS Modeling Results – 1.0 and 1.5 MG Tanks
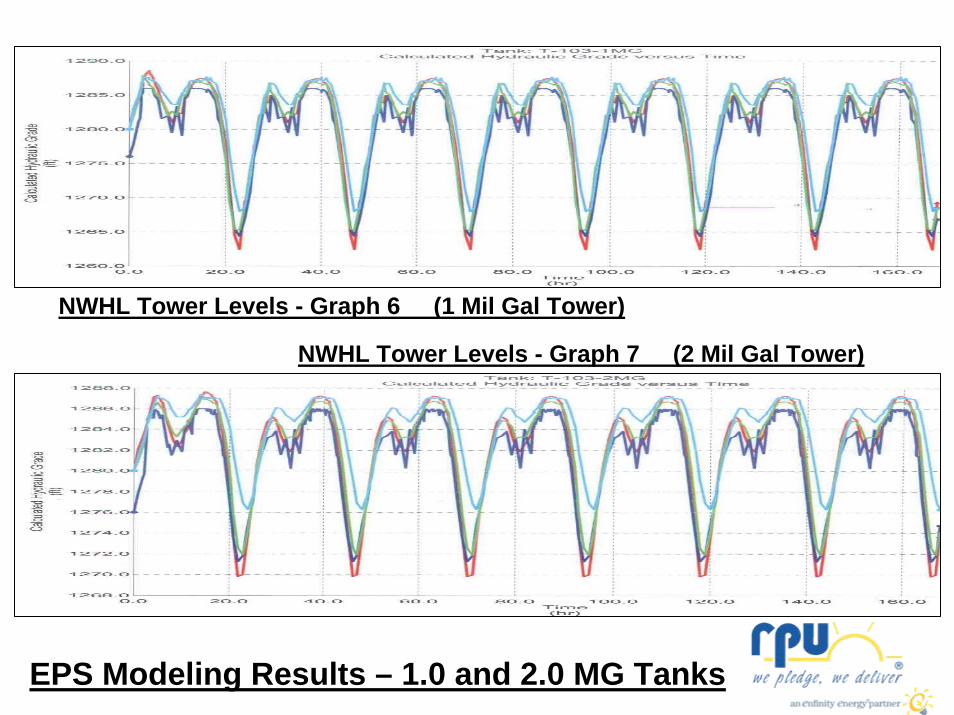
NWHL Tower Levels - Graph 6 (1 Mil Gal Tower)
NWHL Tower Levels - Graph 7 (2 Mil Gal Tower)
EPS Modeling Results – 1.0 and 2.0 MG Tanks
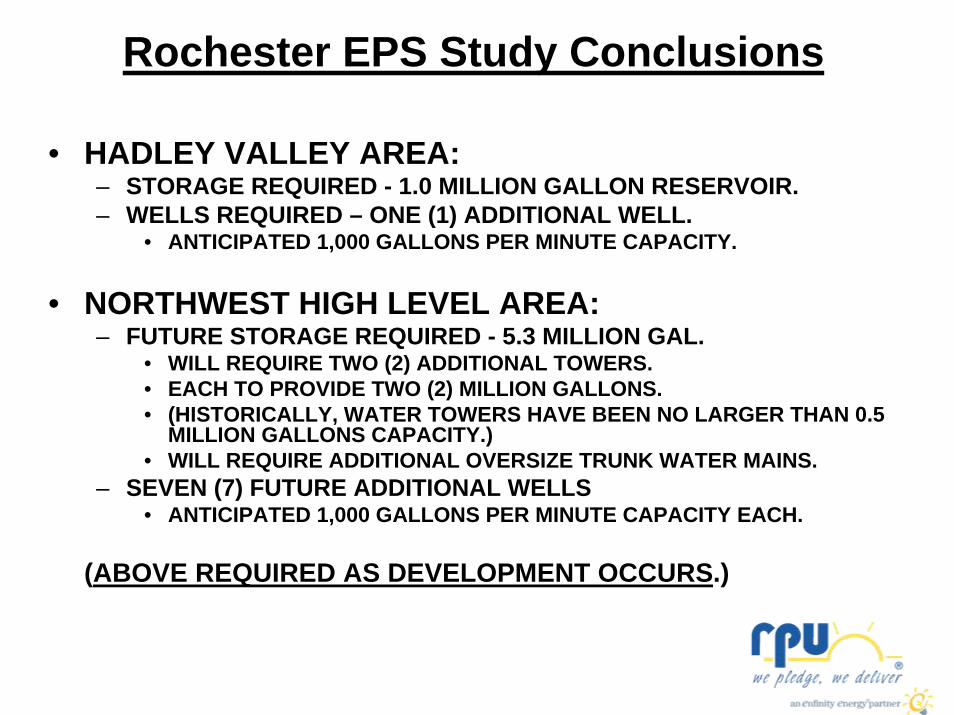
Rochester EPS Study Conclusions
• HADLEY VALLEY AREA:– STORAGE REQUIRED - 1.0 MILLION GALLON RESERVOIR.– WELLS REQUIRED – ONE (1) ADDITIONAL WELL.
• ANTICIPATED 1,000 GALLONS PER MINUTE CAPACITY.
• NORTHWEST HIGH LEVEL AREA:– FUTURE STORAGE REQUIRED - 5.3 MILLION GAL.
• WILL REQUIRE TWO (2) ADDITIONAL TOWERS.• EACH TO PROVIDE TWO (2) MILLION GALLONS.• (HISTORICALLY, WATER TOWERS HAVE BEEN NO LARGER THAN 0.5
MILLION GALLONS CAPACITY.)• WILL REQUIRE ADDITIONAL OVERSIZE TRUNK WATER MAINS.
– SEVEN (7) FUTURE ADDITIONAL WELLS• ANTICIPATED 1,000 GALLONS PER MINUTE CAPACITY EACH.
(ABOVE REQUIRED AS DEVELOPMENT OCCURS.)
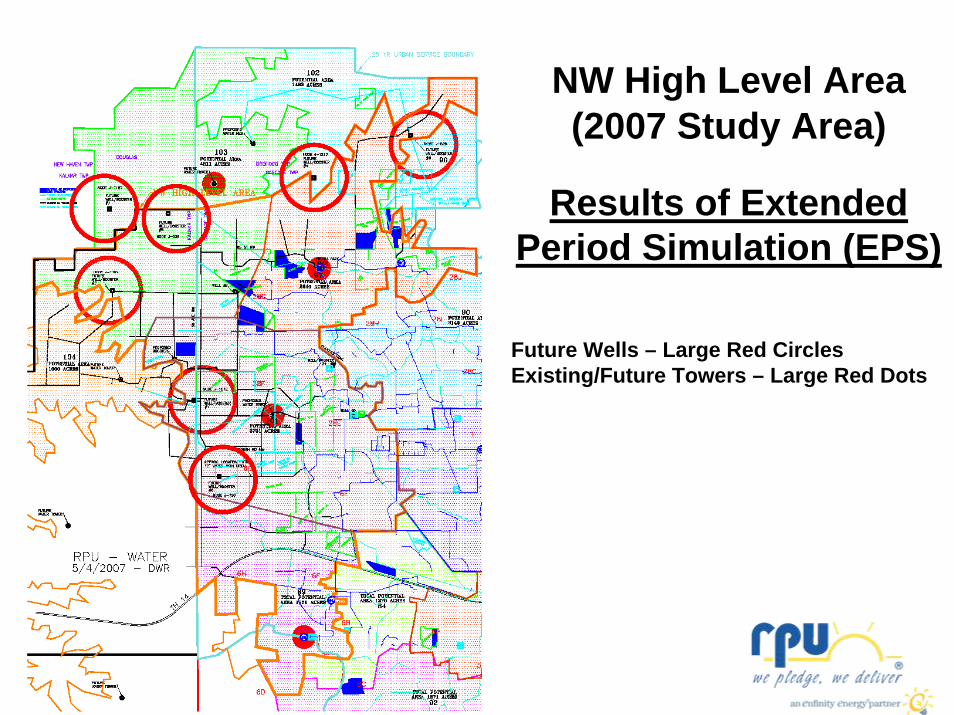
NW High Level Area(2007 Study Area)
Results of Extended Period Simulation (EPS)
Future Wells – Large Red CirclesExisting/Future Towers – Large Red Dots
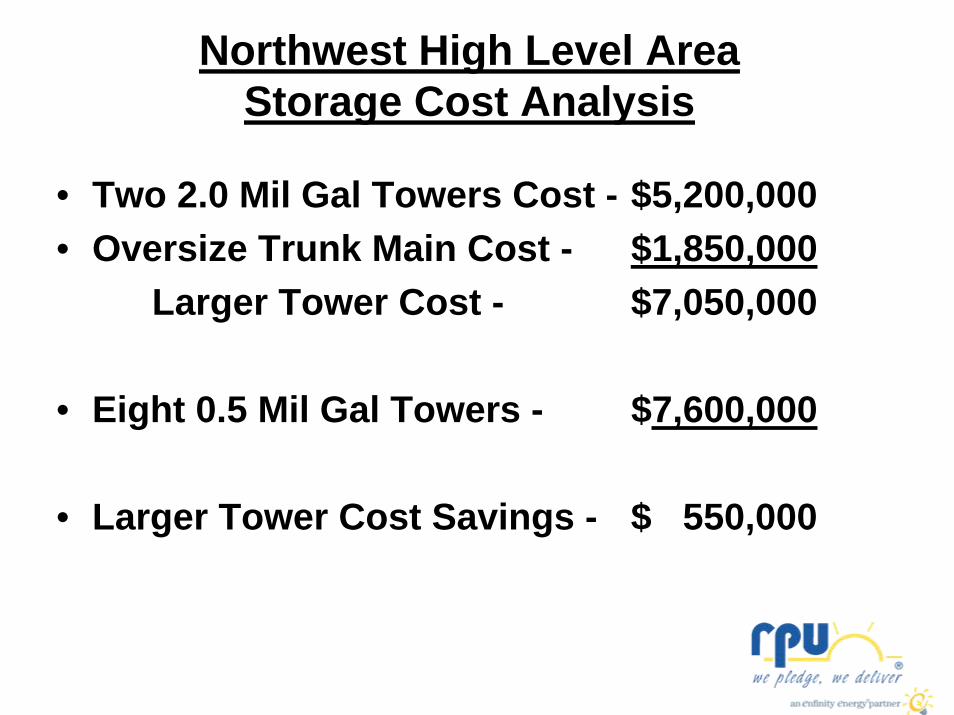
Northwest High Level AreaStorage Cost Analysis
• Two 2.0 Mil Gal Towers Cost - $5,200,000• Oversize Trunk Main Cost - $1,850,000
Larger Tower Cost - $7,050,000
• Eight 0.5 Mil Gal Towers - $7,600,000
• Larger Tower Cost Savings - $ 550,000
Computer Simulation Results (EPS)St. Bridget & Airport Areas
September, 2007

`
`
`
`
``
` `
``
`
`
`
` `
`
`
`
``
``
5
5
5
`
`
`
`
``
¤
¤
¤¤
¤
¤
¤
¤
¤
¤
¤
¤
¤
¤
¤
¤
¤
¤
`5
`
¤̀
`
`
5
504
05
38
37
8020
12
73
99
98
97
94
92
91
90
89
88
87
86
85
84
83
8281
95
96
74 75
36
35
23
16
03
02
01
17
32
30
13
28
22
34
2415
27
21
72
33
19
1826
25
11
29
31
70
71
04T
Water System
Pressure Zones
Rochester, MNNORTH
CENTRAL
SOUTH
NW HL
MAIN LEVEL
NE HL
AIRPORT HL
BAIHLY HL
GOLDENHILL HL
SE HL
WILLOW HL
ARNOLDS HL
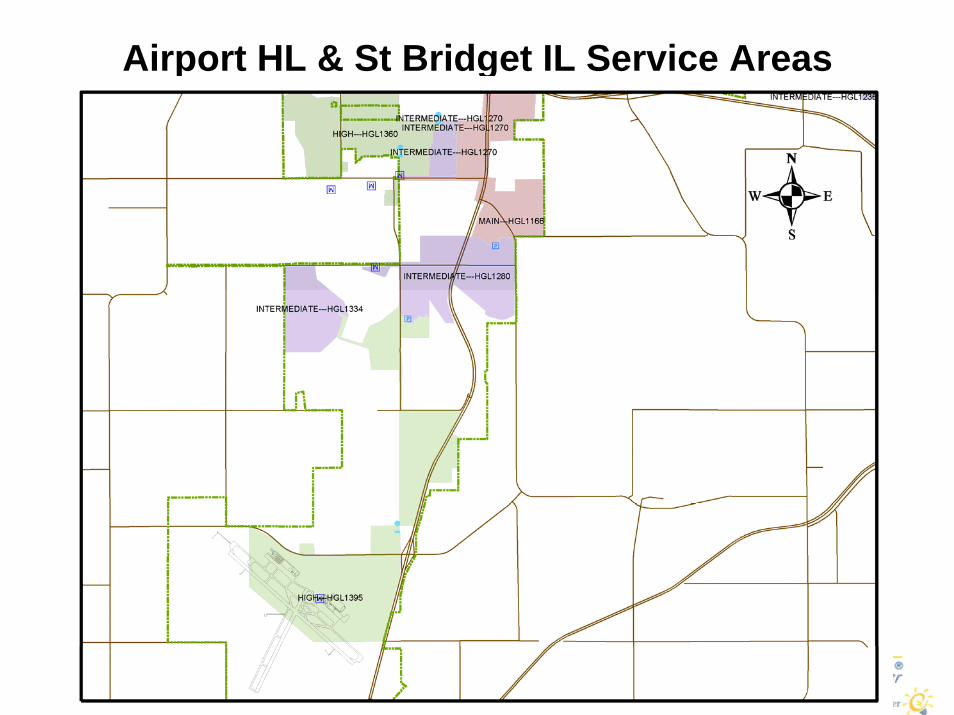
Airport HL & St Bridget IL Service Areas
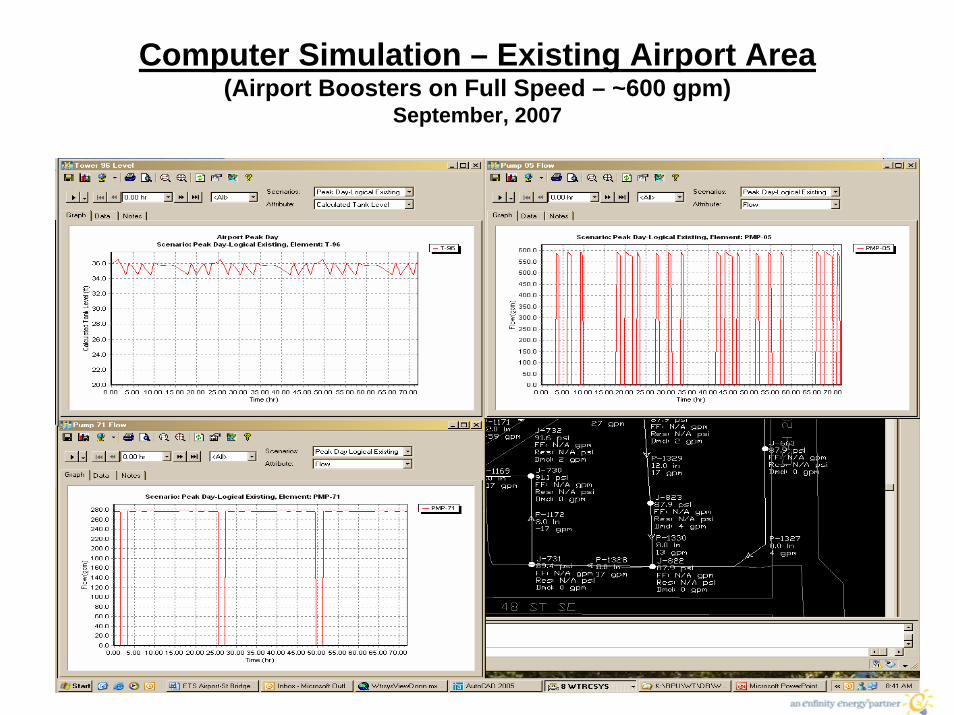
Computer Simulation – Existing Airport Area (Airport Boosters on Full Speed – ~600 gpm)
September, 2007
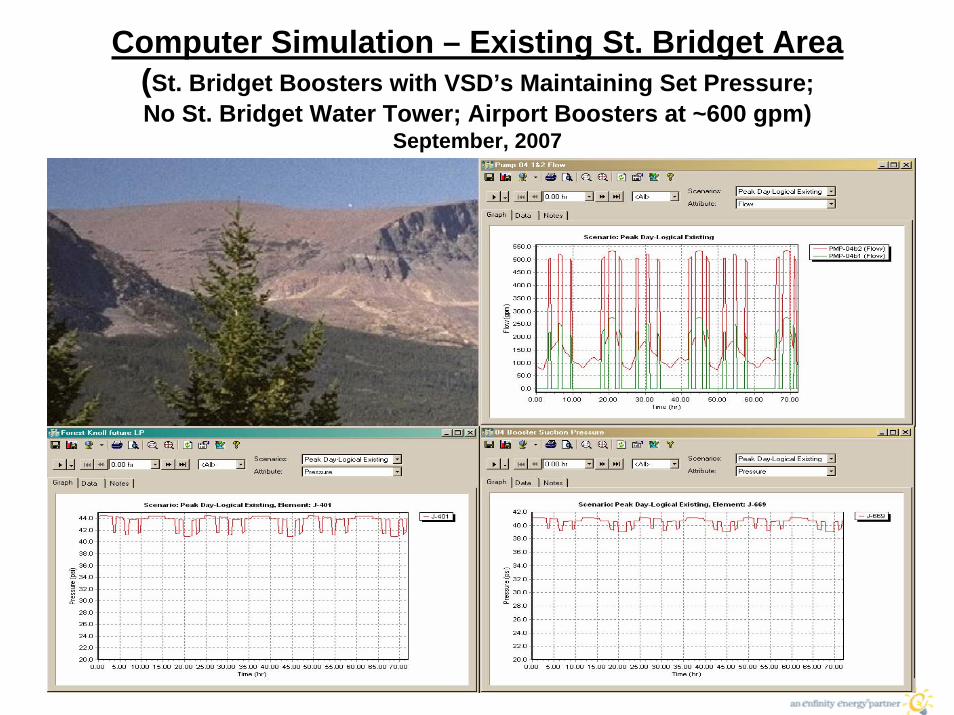
Computer Simulation – Existing St. Bridget Area (St. Bridget Boosters with VSD’s Maintaining Set Pressure;No St. Bridget Water Tower; Airport Boosters at ~600 gpm)
September, 2007
Now we can do “What If” Scenarios!
• For example, what happens if we reduce Airport Booster Pumping Rate from ~600 gpm to ~300 gpm?
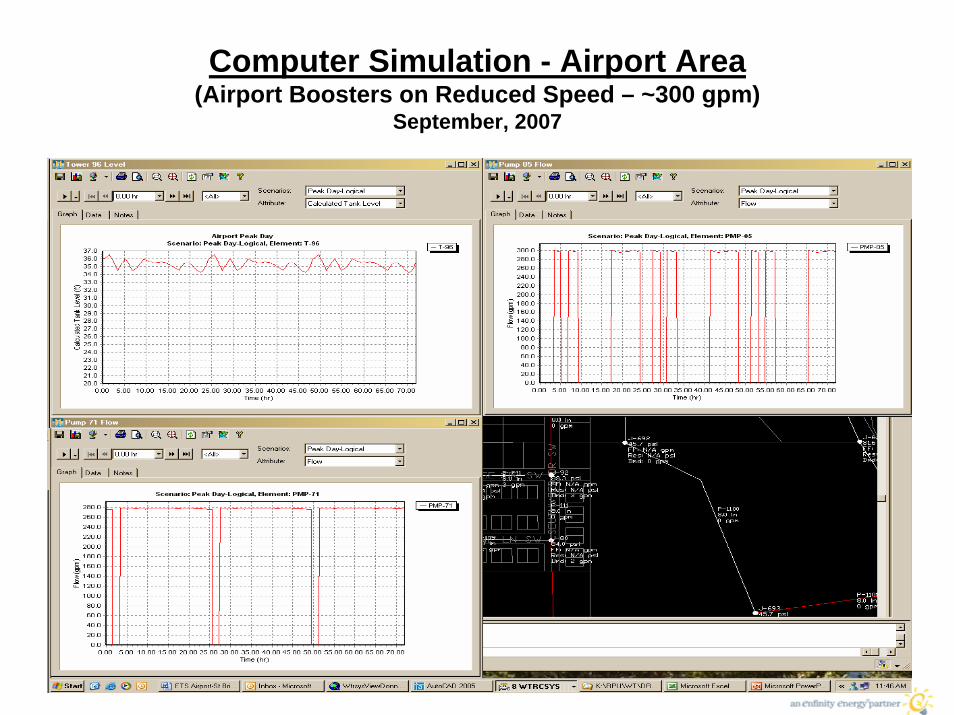
Computer Simulation - Airport Area(Airport Boosters on Reduced Speed – ~300 gpm)
September, 2007
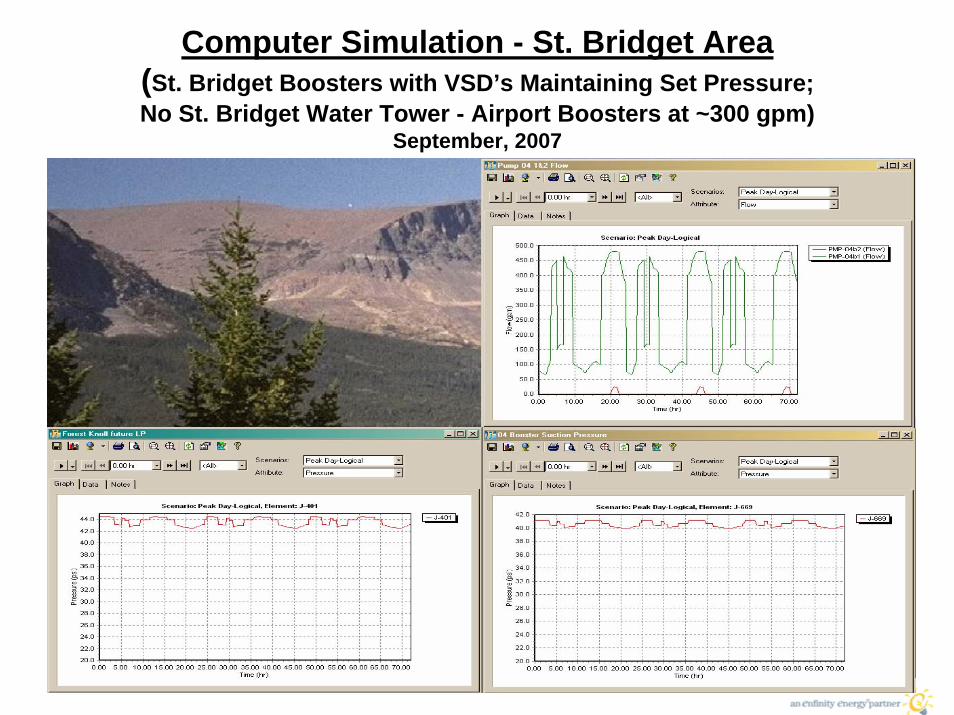
Computer Simulation - St. Bridget Area(St. Bridget Boosters with VSD’s Maintaining Set Pressure;No St. Bridget Water Tower - Airport Boosters at ~300 gpm)
September, 2007
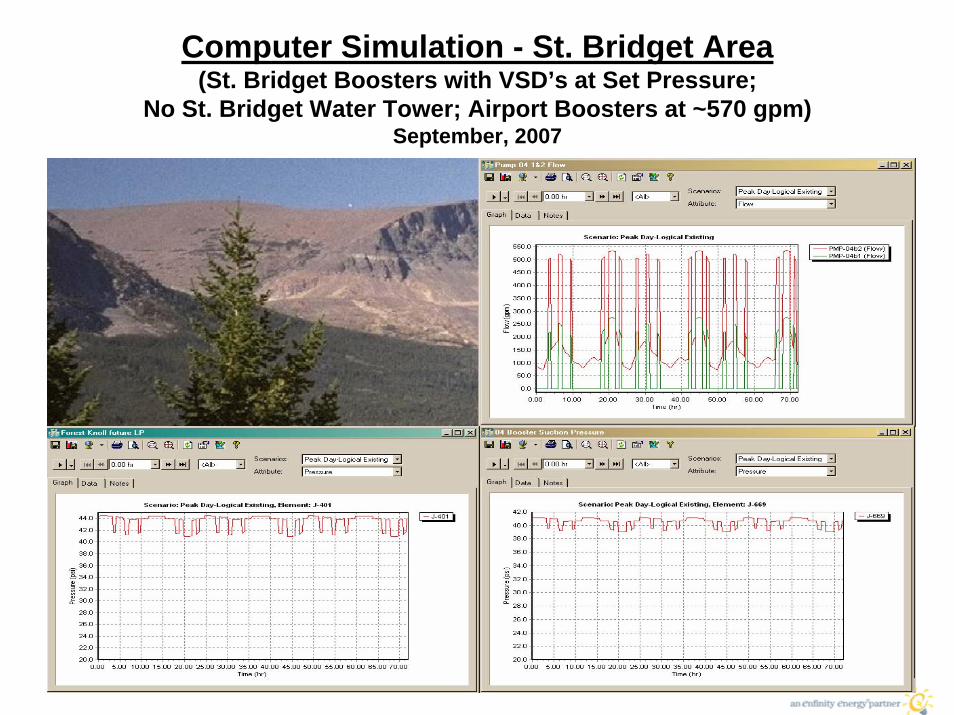
Computer Simulation - St. Bridget Area (St. Bridget Boosters with VSD’s at Set Pressure;
No St. Bridget Water Tower; Airport Boosters at ~570 gpm)September, 2007
We can do additional “What If” Scenarios!
• For example, what happens if we add a water tower to the St. Bridget Area?
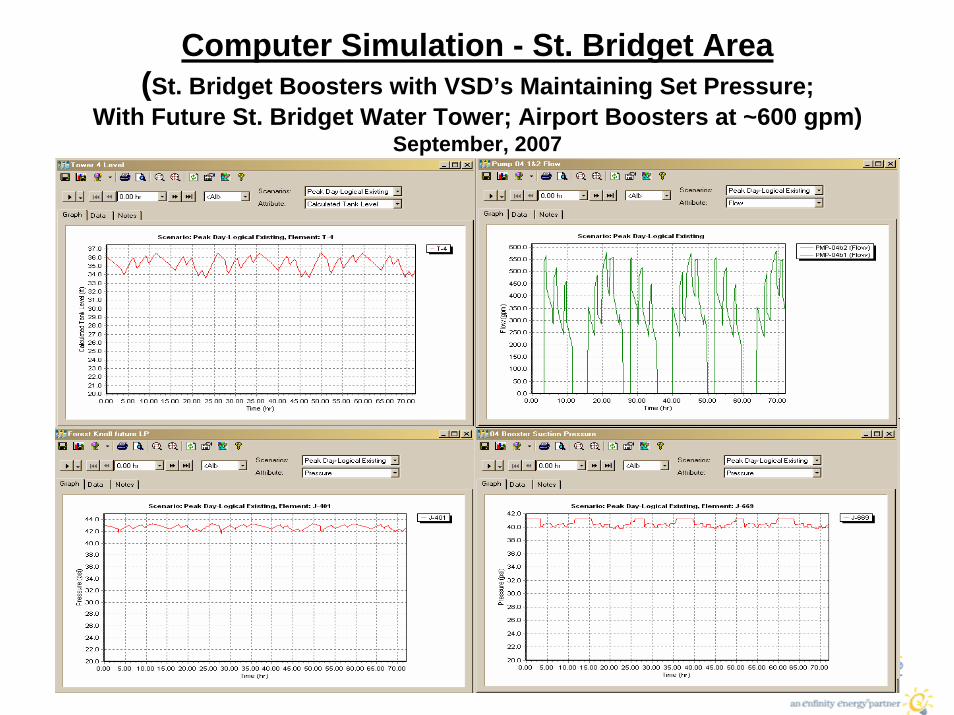
Computer Simulation - St. Bridget Area (St. Bridget Boosters with VSD’s Maintaining Set Pressure;
With Future St. Bridget Water Tower; Airport Boosters at ~600 gpm)September, 2007
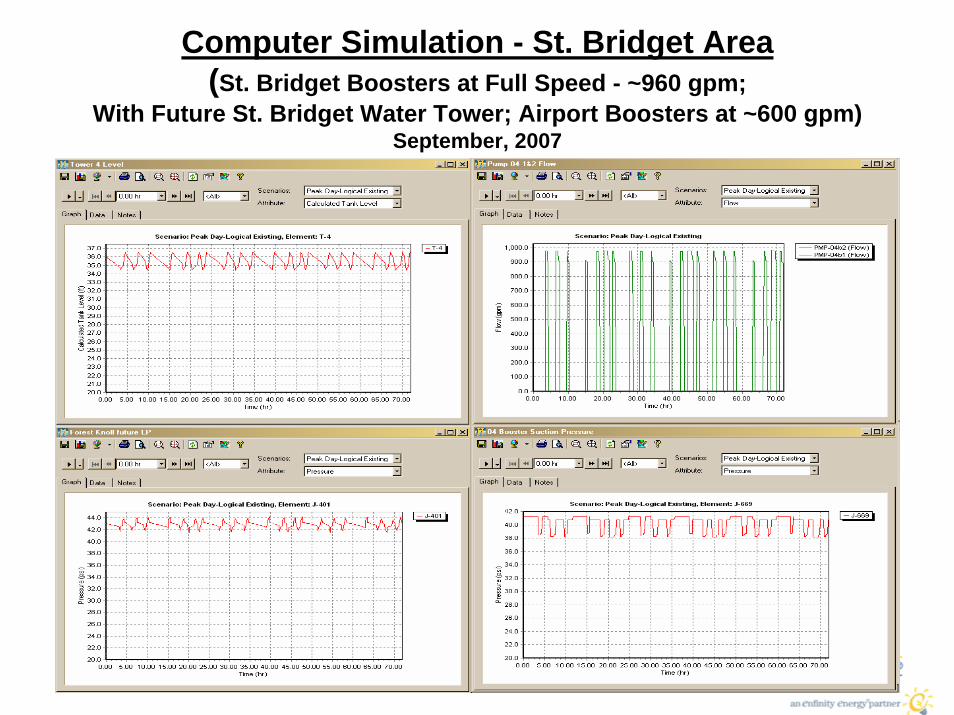
Computer Simulation - St. Bridget Area(St. Bridget Boosters at Full Speed - ~960 gpm;
With Future St. Bridget Water Tower; Airport Boosters at ~600 gpm)September, 2007
Reference Material Credits
• “Water Distribution Design and Modeling featuring WaterCAD” - Three-day Haestad Methods, Inc.,Workshop Attended by Donn Richardson, 5/10-12/2004.)
• “Computer Modeling of Water Distribution Systems”, AWWA Manual M32, 2005.
• “Quantitative Results of EPS Model Calibrations with a Comparison to Industry Guidelines” Journal AWWA 98:11, 11/2006.
• “Guidelines for Hydraulic Modeling in the Distribution System”, AWWA Annual Conference Sunday Workshop, 6/24/07.

Questions/Comments/Concerns?
The End
For a copy of our presentation, go to:www.rpu.org/environment/water_quality/
Doug Rovang, Senior Civil Engineer, [email protected] Richardson, Design Projects Coordinator (Water),
Rochester Public UtilitiesRochester, Minnesota
Appropriate EPS Modeling PeriodConsecutive Peak Day Occurance
• AWWA Manual M32 says as appropriate.• Examined Past 10 Years Data to See Successive
Days of High Demands.• Results Shown on Next Slide.• What Does it Mean?
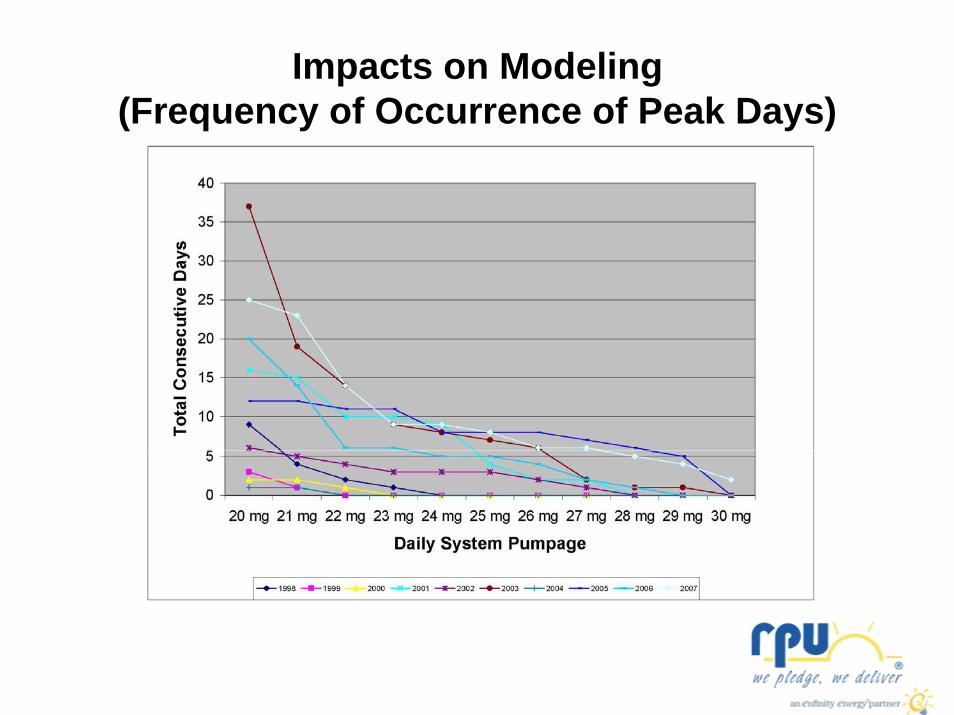
Impacts on Modeling(Frequency of Occurrence of Peak Days)
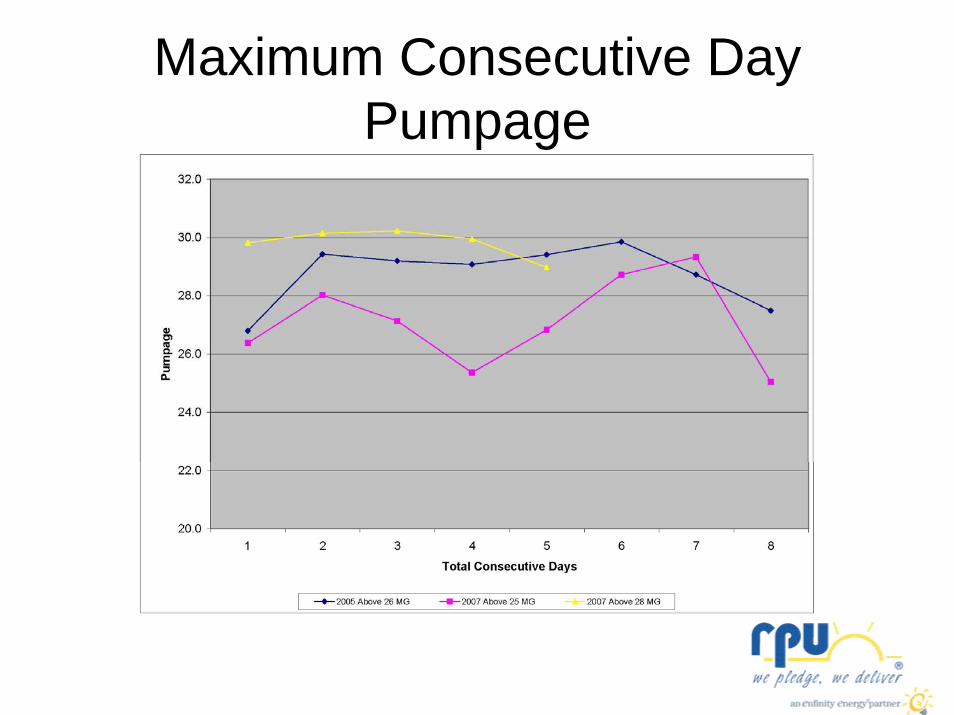
Maximum Consecutive Day Pumpage
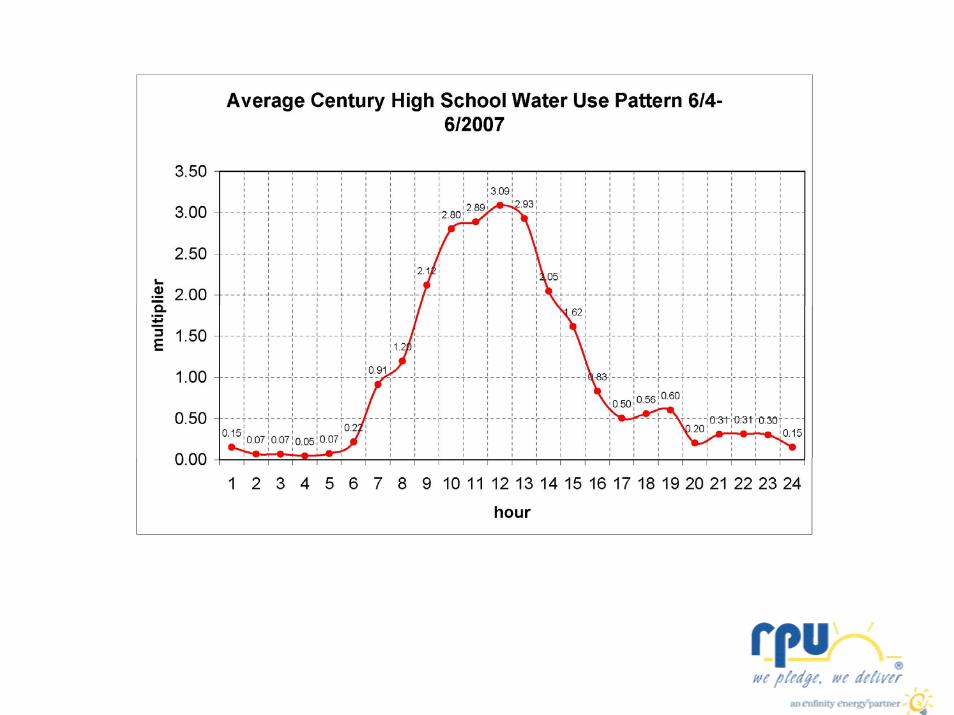
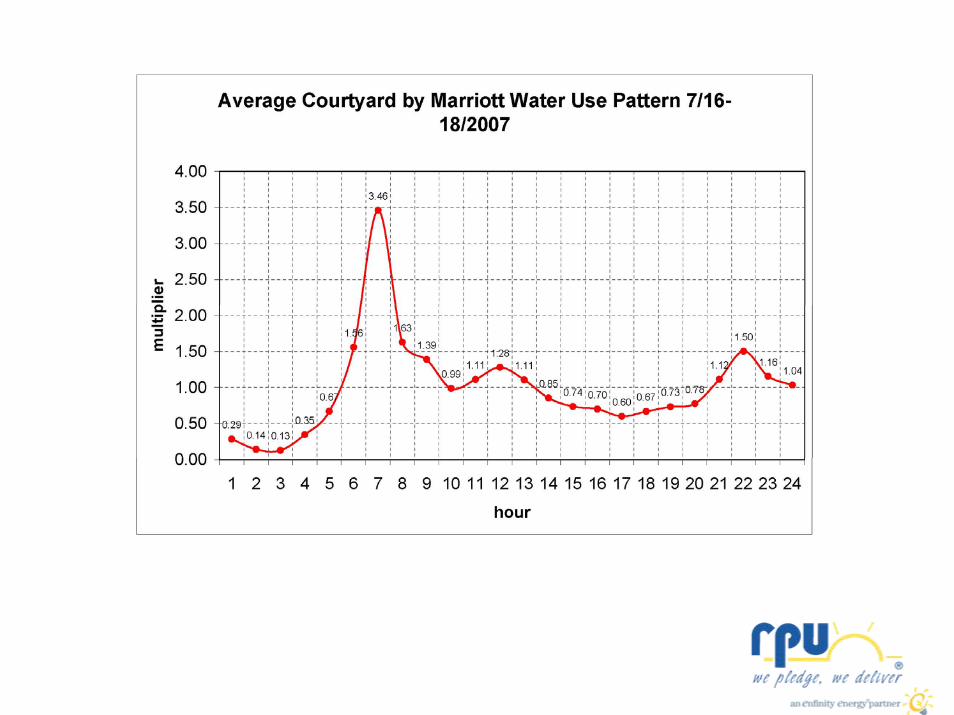
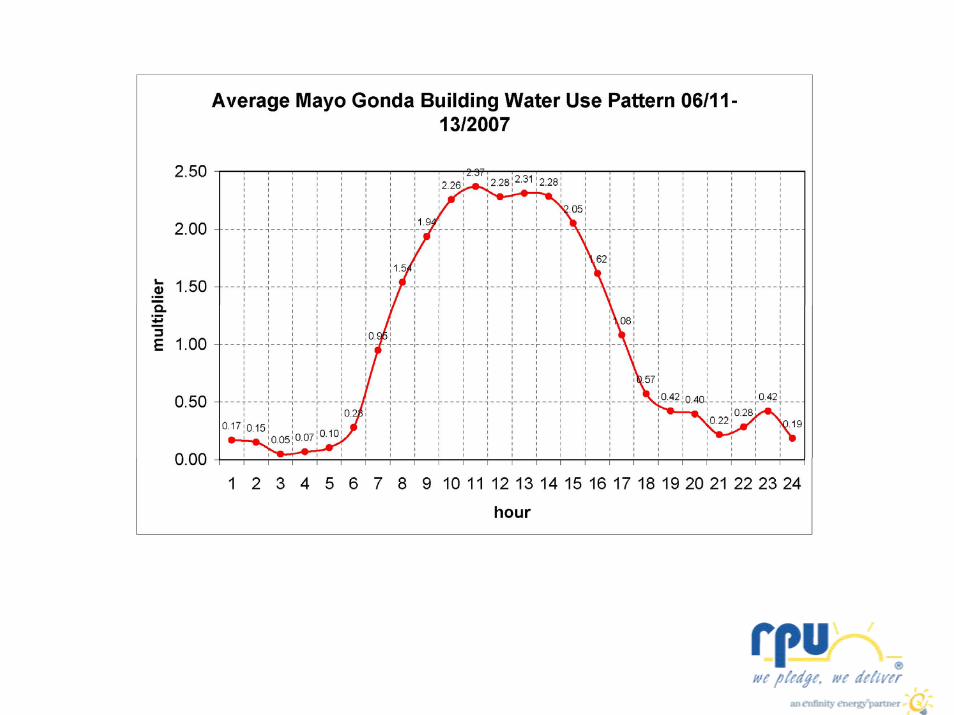
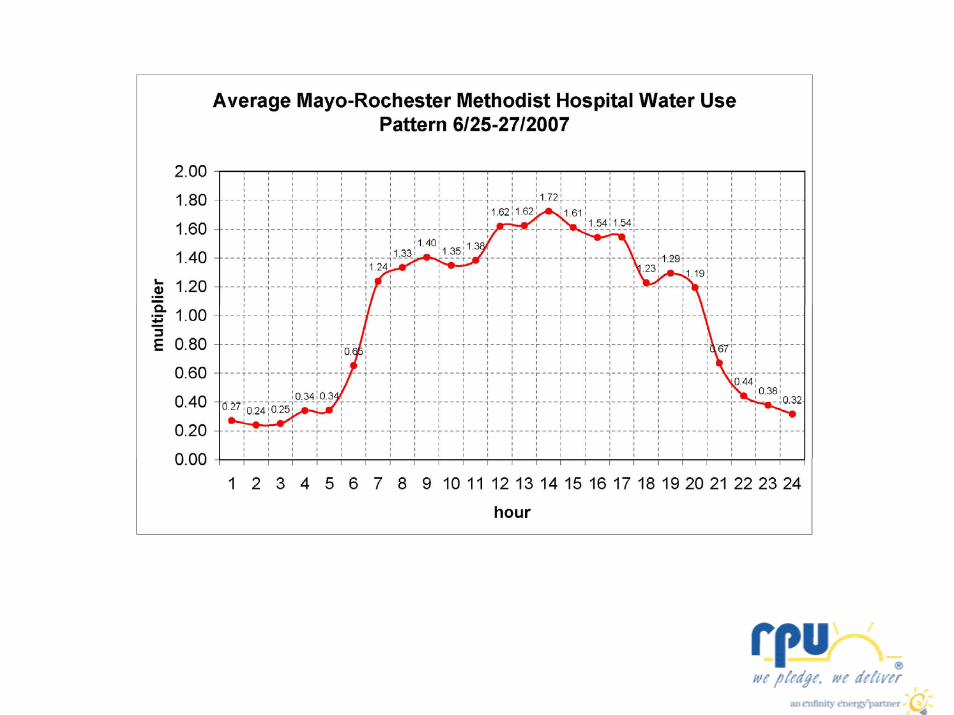
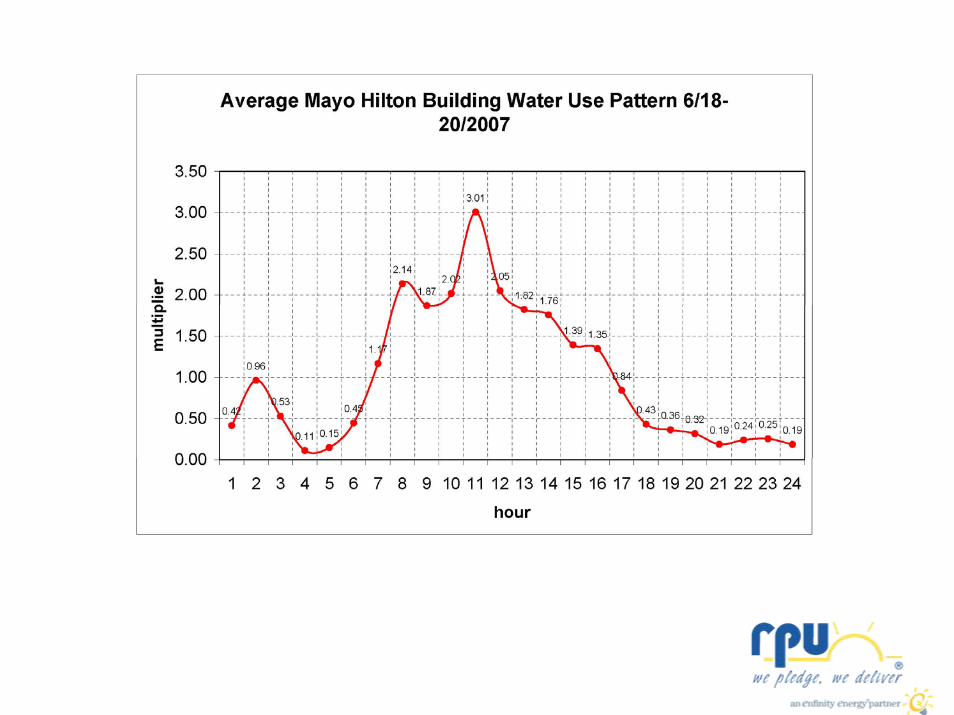
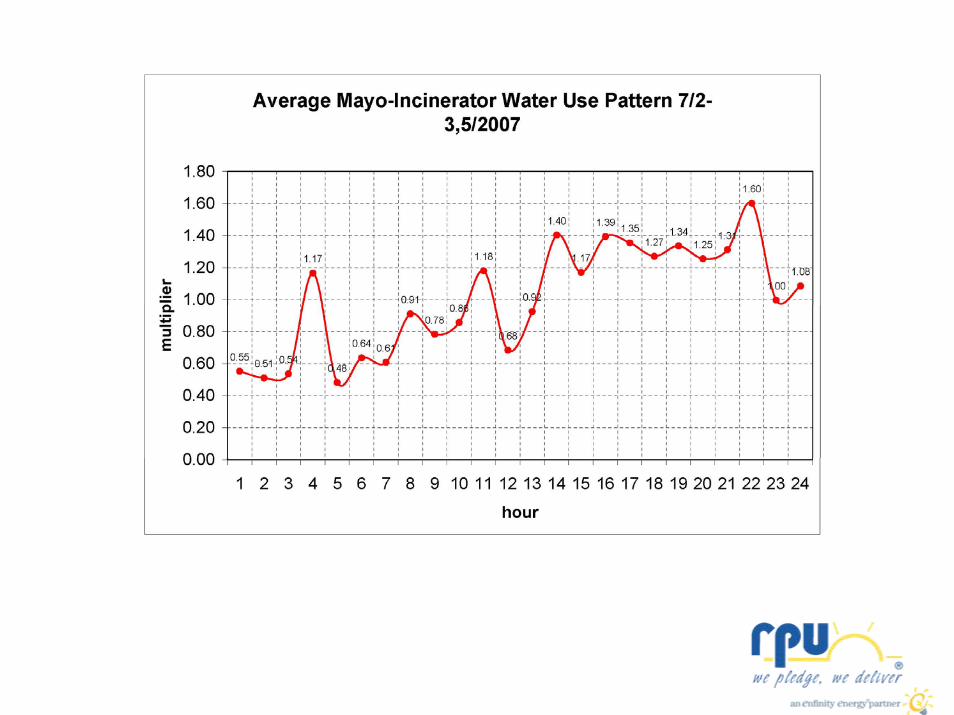
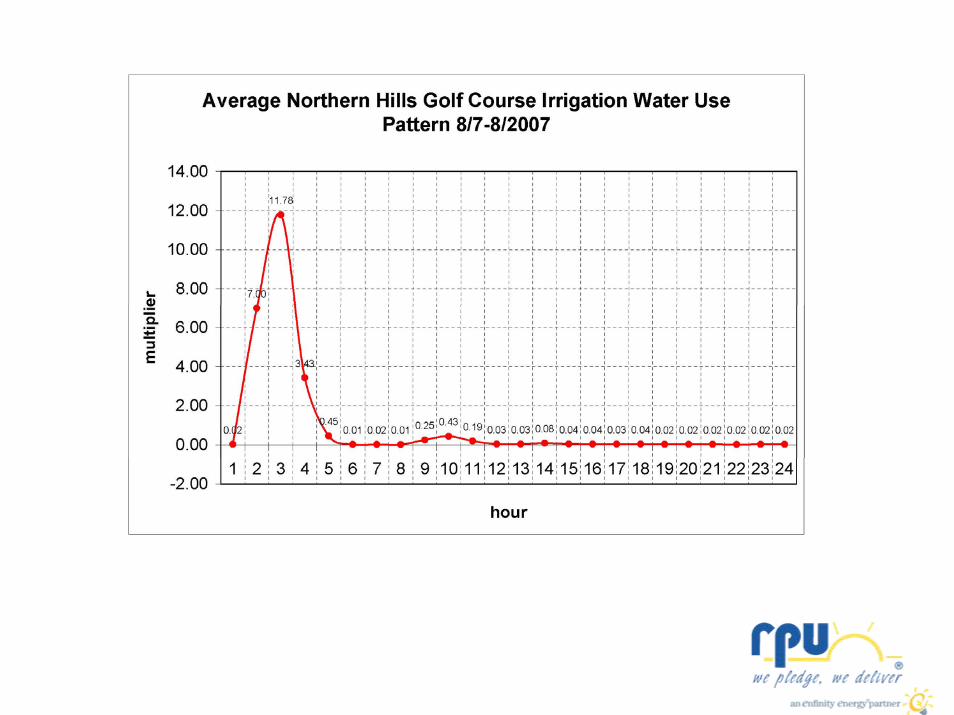
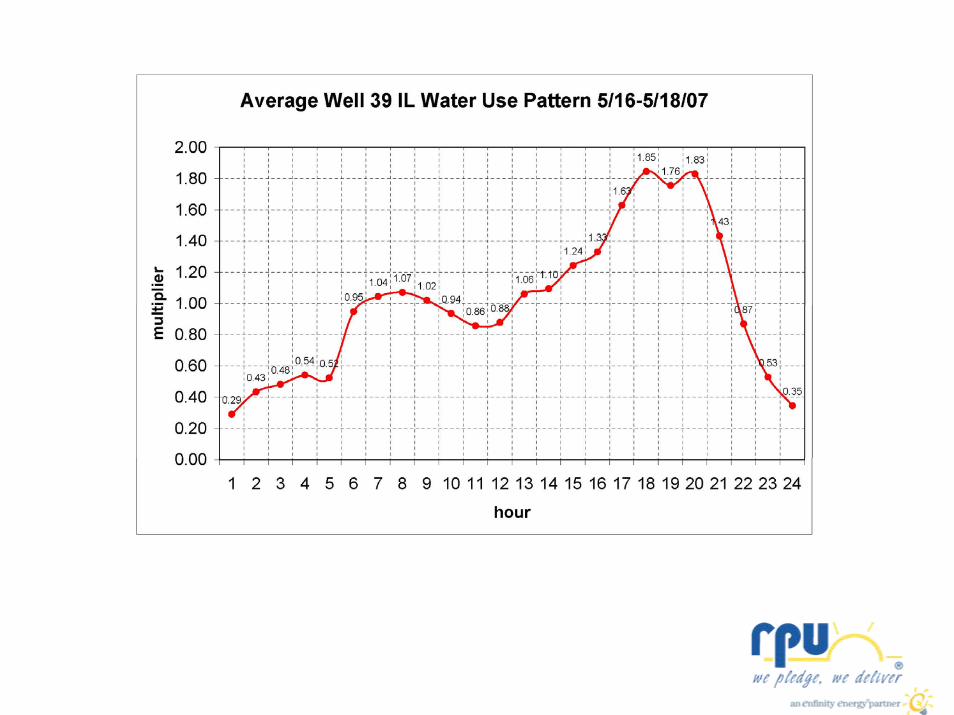
Individual Non-Residential Water Customer Diurnal Demand Study - 2007