Preload Index: Pulmonary Artery Occlusion Pressure Versus ... arteria polmonare.pdf · Preload...
9
Preload Index: Pulmonary Artery Occlusion Pressure Versus Intrathoracic Blood Volume Monitoring During Lung Transplantation Giorgio Della Rocca, Gabriella M. Costa, Cecilia Coccia, Livia Pompei, Pierangelo Di Marco, and Paolo Pietropaoli Istituto di Anestesiologia e Rianimazione, University of Rome “La Sapienza,” Azienda Ospedaliera Policlinico Umberto I, Rome, Italy In this study, during lung transplantation, we analyzed a conventional preload index, the pulmonary artery oc- clusion pressure (PAOP), and a new preload index, the intrathoracic blood volume index (ITBVI), derived from the single-indicator transpulmonary dilution technique (PiCCO System), with respect to stroke vol- ume index (SVIpa). We also evaluated the relationships between changes () in ITBVI and PAOP and SVIpa during lung transplantation. The reproducibility and precision of all cardiac index measurements obtained with the transpulmonary single-indicator dilution tech- nique (CIart) and with the pulmonary artery thermodi- lution technique (CIpa) were also determined. Mea- surements were made in 50 patients monitored with a pulmonary artery catheter and with a PiCCO System at six stages throughout the study. Changes in the vari- ables were calculated by subtracting the first from the second measurement ( 1 ) and so on ( 1 to 5 ). The lin- ear correlation between ITBVI and SVIpa was signifi- cant (r 2 0.41; P 0.0001), whereas PAOP poorly corre- lated with SVIpa (r 2 0.01). Changes in ITBVI correlated with changes in SVIpa ( 1 , r 2 0.30; 2 , r 2 0.57; 4 ,r 2 0.26; and 5 , r 2 0.67), whereas PAOP failed. The mean bias between CIart and CIpa was 0.15 l · min 1 ·m 2 (1.37). In conclusion, ITBVI is a valid in- dicator of cardiac preload and may be superior to PAOP in patients undergoing lung transplantation. (Anesth Analg 2002;95:835–43) C ardiovascular measurements are often used during anesthesia for lung transplantation (1). Cardiac index (CIpa) is typically measured with the pulmonary artery catheter (PAC) that also al- lows determination of stroke volume index (SVIpa), central venous pressure (CVP), pulmonary artery (PA) and PA occlusion pressure (PAOP). Some stud- ies show that filling pressures that are assumed to reflect circulating blood volume and cardiac preload have limited usefulness for guiding volume therapy (2– 8). During anesthesia for lung transplantation, the mechanical ventilation and the open chest sur- gery may modify the PAOP with cardiac preload misinterpretation. Currently a newly available sys- tem, the PiCCO System (Pulsion Medical System, Munich, Germany), based on the transpulmonary indicator dilution (TPID) technique with the single indicator, provides intermittent CIpa (CIart) assess- ment, continuous CI measurements by pulse con- tour analysis, and an estimation of the intrathoracic blood volume (ITBV) index (ITBVI), which is a valu- able index of cardiac preload and a more sensitive indicator of intravascular volume than PAOP (3– 8). There is no information on the use of the TPID technique and its derived variables in patients un- dergoing noncardiac thoracic surgery and lung transplantation. Our hypothesis testing is needed because preload monitoring and fluid and drug management are particularly difficult during lung transplantation procedures when using a conven- tional pressure index of preload (PAOP). This study was designed to evaluate the relation- ship between pressure (PAOP), derived from PAC, and the volume (ITBVI) preload variable, derived from the PiCCO System, with respect to SVIpa. The study also evaluated the relationships between the changes () in ITBVI and PAOP and SVIpa during lung transplantation. The reproducibility and precision of all CIart and CIpa were also evaluated. Accepted for publication June 13, 2002. Address correspondence and reprint requests to Giorgio Della Rocca, MD, C.so Trieste 169/A, 00198 Rome, Italy. Address e-mail to [email protected]. DOI: 10.1213/01.ANE.0000027868.56666.A9 ©2002 by the International Anesthesia Research Society 0003-2999/02 Anesth Analg 2002;95:835–43 835
Transcript of Preload Index: Pulmonary Artery Occlusion Pressure Versus ... arteria polmonare.pdf · Preload...
Preload Index: Pulmonary Artery Occlusion Pressure VersusIntrathoracic Blood Volume Monitoring DuringLung TransplantationGiorgio Della Rocca, Gabriella M. Costa, Cecilia Coccia, Livia Pompei,Pierangelo Di Marco, and Paolo Pietropaoli
Istituto di Anestesiologia e Rianimazione, University of Rome “La Sapienza,” Azienda Ospedaliera Policlinico Umberto I,Rome, Italy
In this study, during lung transplantation, we analyzeda conventional preload index, the pulmonary artery oc-clusion pressure (PAOP), and a new preload index, theintrathoracic blood volume index (ITBVI), derivedfrom the single-indicator transpulmonary dilutiontechnique (PiCCO System), with respect to stroke vol-ume index (SVIpa). We also evaluated the relationshipsbetween changes (�) in ITBVI and PAOP and �SVIpaduring lung transplantation. The reproducibility andprecision of all cardiac index measurements obtainedwith the transpulmonary single-indicator dilution tech-nique (CIart) and with the pulmonary artery thermodi-lution technique (CIpa) were also determined. Mea-surements were made in 50 patients monitored with a
pulmonary artery catheter and with a PiCCO System atsix stages throughout the study. Changes in the vari-ables were calculated by subtracting the first from thesecond measurement (�1) and so on (�1 to �5). The lin-ear correlation between ITBVI and SVIpa was signifi-cant (r2�0.41; P � 0.0001), whereas PAOP poorly corre-lated with SVIpa (r2 � �0.01). Changes in ITBVIcorrelated with changes in SVIpa (�1, r2 � 0.30; �2, r2 �0.57; �4, r2 � 0.26; and �5, r2 � 0.67), whereas PAOPfailed. The mean bias between CIart and CIpa was 0.15l · min�1 · m�2 (1.37). In conclusion, ITBVI is a valid in-dicator of cardiac preload and may be superior to PAOPin patients undergoing lung transplantation.
(Anesth Analg 2002;95:835–43)
C ardiovascular measurements are often usedduring anesthesia for lung transplantation (1).Cardiac index (CIpa) is typically measured with
the pulmonary artery catheter (PAC) that also al-lows determination of stroke volume index (SVIpa),central venous pressure (CVP), pulmonary artery(PA) and PA occlusion pressure (PAOP). Some stud-ies show that filling pressures that are assumed toreflect circulating blood volume and cardiac preloadhave limited usefulness for guiding volume therapy(2– 8). During anesthesia for lung transplantation,the mechanical ventilation and the open chest sur-gery may modify the PAOP with cardiac preloadmisinterpretation. Currently a newly available sys-tem, the PiCCO System (Pulsion Medical System,Munich, Germany), based on the transpulmonaryindicator dilution (TPID) technique with the single
indicator, provides intermittent CIpa (CIart) assess-ment, continuous CI measurements by pulse con-tour analysis, and an estimation of the intrathoracicblood volume (ITBV) index (ITBVI), which is a valu-able index of cardiac preload and a more sensitiveindicator of intravascular volume than PAOP (3– 8).There is no information on the use of the TPIDtechnique and its derived variables in patients un-dergoing noncardiac thoracic surgery and lungtransplantation. Our hypothesis testing is neededbecause preload monitoring and fluid and drugmanagement are particularly difficult during lungtransplantation procedures when using a conven-tional pressure index of preload (PAOP).
This study was designed to evaluate the relation-ship between pressure (PAOP), derived from PAC,and the volume (ITBVI) preload variable, derivedfrom the PiCCO System, with respect to SVIpa.The study also evaluated the relationships betweenthe changes (�) in ITBVI and PAOP and �SVIpaduring lung transplantation. The reproducibilityand precision of all CIart and CIpa were alsoevaluated.
Accepted for publication June 13, 2002.Address correspondence and reprint requests to Giorgio Della
Rocca, MD, C.so Trieste 169/A, 00198 Rome, Italy. Address e-mailto [email protected].
DOI: 10.1213/01.ANE.0000027868.56666.A9
©2002 by the International Anesthesia Research Society0003-2999/02 Anesth Analg 2002;95:835–43 835
MethodsPatients
We obtained approval from the Ethics Committeeand written informed consent from 56 patients priorto single- (SLT, n � 14) or double-lung transplanta-tion (DLT, n � 42). Patients were monitored with alead II/V5 electrocardiogram and a pulse oximeter,and we placed a radial artery catheter to measuresystemic arterial blood pressure (MAP) (PCMSpaceLabs, Inc. Redmond, WA). A central venouscatheter (trilumen) and a modified 7.5F PAC via anintroducer (8.5F; Baxter Edwards Laboratories, Ir-vine, CA) were placed into the right internal jugularvein with the Seldinger technique and connected tothe Vigilance system (Baxter Edwards Laboratories)to obtain CIpa, CVP, PAOP, mean pulmonary arte-rial pressure, body temperature, continuous cardiacoutput, and mixed venous oxygen saturation. A 4Fthermistor-tipped catheter (Pulsiocath PV2014L;Pulsion Medical System, Munich, Germany) wasplaced via a 5F introducer (Adam Spence EuropeLtd., Abbeytown, Boyle, CR, Ireland) through theright femoral artery, with the tip in the abdominalaorta, and connected to the PiCCO System (Version4.1; Pulsion Medical System) for monitoring of ar-terial pressure, CIart, ITBVI (n.v. 800 –1000 mL/m2),and extravascular lung water index (n.v. 4 –7 mL/kg) (2). In all patients an epidural catheter wasplaced (T4-9 space) before anesthesia induction forpostoperative pain relief.
Anesthesia and Mechanical Ventilation
After preoxygenation by face mask, anesthesia wasinduced with propofol (0.5 mg/kg) or midazolam(0.04–0.07 mg/kg). Muscle relaxation was achievedwith atracurium besylate (0.4–0.6 mg/kg), cisatra-curium besylate (0.15 mg/kg), or vecuronium bro-mide (0.1–0.2 mg/kg). Analgesia was obtained withalfentanil (7–10 �g/kg) or fentanyl (0.7–1 �g/kg). Af-ter the induction of anesthesia, an appropriately sizedendobronchial tube was placed (Left Broncho-Cath;Mallinckrodt, Athione, Ireland). Intermittent positivepressure ventilation was performed with a volumetricventilator (Servo Ventilator 900D; Siemens Elema,Solna Sweden). End-tidal CO2 and expiratory gases(Tyco, Nellcor N1000; Puritan Bennett, Pleasanton,CA) were monitored. Ventilation was adjusted toavoid gas trapping and dynamic hyperinflation with atidal volume of 500–700 mL and a respiratory rate of12–14 breaths/min with a short inspiratory time andmaximal expiratory time, maintaining peak inflationpressures �40–50 cm H2O, with a fraction of inspiredoxygen of 1.0. A positive end-expiratory pressure(PEEP) of 5 cm H2O was applied only after graftreperfusion. To reduce volotrauma and barotrauma, a
permissive hypercapnia technique was used (Paco250–80 mm Hg), and only at the end of the surgicalprocedure was Paco2 reduced to close to a normalvalue. Anesthesia was maintained with isoflurane (0.5%)or sevoflurane (0.5%) and a continuous remifentanil in-fusion (0.1–0.5 �g · kg�1 · min�1) supplemented, if nec-essary by alfentanil (7 �g/kg) or fentanyl (0.7 �g/kg).Body temperature was controlled to avoid hypothermiawith a warming blanket (Gaymar Meditherm, OrchardPark, NY) and warm IV fluids (HOT LINE®; SIMS Med-ical System, Graseby Ltd., UK). SLT and DLT procedureswere performed, respectively, in the lateral decubitusand supine positions.
Cardiopulmonary Monitoring
CIpa measurements were performed by manual injec-tion of 10 mL of saline solution, at room temperature,into the superior vena cava through the atrial port.Three consecutive boluses were injected without re-gard to the phase of the respiratory cycle, over a 2-minperiod. To avoid variation between operators, the in-jection was always performed by the same person. Incases where there was a �10% discrepancy in the CImeasurements, then the measurement was repeatedfive times, and the lowest and highest results werediscarded.
All data were obtained while patients were mechan-ically ventilated. The PAC was palpated before PAstapling to ensure that the catheter was not in the PAof the operative lung, and, if necessary, the PA cath-eter was withdrawn and refloated to the nonoperativelung. The zero references for the supine and lateralpositions were, respectively, the midaxilla and theright midsternal lines.
PiCCO Monitoring
The CIart and the volumetric variables were obtainedthrough the TPID technique. The mean of threesubsequent CIart measurements was used. Thesemeasurements were performed by injection of15 mL of cold saline solution, at a temperature�8°C, via the distal port of the central venous cath-eter placed in the right internal jugular vein withsubsequent detection by the thermistor embeddedinto the wall of the arterial catheter. CIart was cal-culated with the Stewart-Hamilton principle fromthe thermodilution curves (9). ITBVI and extravas-cular lung water index were calculated by the meantransit time (MTt) approach, as has been describedelsewhere (10).
The PiCCO, which uses only one (cold) indicator,calculates the MTt and the exponential downslopetime (DSt) of the thermodilution curve. The result ofthe product of COart and MTt is the intrathoracicthermal volume (ITTV), whereas the product of theCOart and the DSt is the pulmonary thermal volume
836 CARDIOVASCULAR ANESTHESIA DELLA ROCCA ET AL. ANESTH ANALGPRELOAD INDEX DURING LUNG TRANSPLANTATION 2002;95:835–43
(PTV). The difference between ITTV and PTV is theglobal end-diastolic volume (GEDV):
GEDV � ITTV � PTV (mL)
or
GEDV � COart � �MTt � DSt) (mL) ,
which correlates closely with ITBV in experimentalstudies. By using a structural regression analysis, themathematical relationship between GEDV and ITBVhas been analyzed in a large population. This regres-sion is used to estimate ITBV from GEDV:
ITBV � a � GEDV � b.
where a and b are two predefined coefficients (respec-tively, 1.16 and 86 mL/m2).
Hemodynamic Targets and Clinical Intervetions
In all patients, lactated Ringer’s solution (5 mL · kg�1 · h�1)was infused as baseline volume replacement. Hydroxy-ethyl starch solution 6% (MW 200/0.5) in 150-mLincreasing doses was infused until the volume target(ITBVI between 800 and 1000 mL/m2) was achieved.When fluid challenge failed to obtain a CIpa of �3L/min, increasing doses of dobutamine (5–10�g · kg�1 · min�1) were administered. In case of hypo-tension (MAP �60 mm Hg), norepinephrine (0.02–3�g · kg�1 · min�1) or ephedrine (5- to 10-mg boluses)was administered. IV prostaglandin E1 (20–100ng · kg�1 · min�1) associated with inhaled nitric oxide(10–40 ppm) as a pulmonary vasodilator was adminis-tered before or soon after PA clamping. Furosemide(0.3–0.5 mg/kg) and mannitol 18% (0.3 g/kg) were used,when necessary, to obtain a mean urine output of�1 mL · kg�1 · h�1.
Twenty percent human albumin (50 mL) was ad-ministered according to hypoalbuminemia (2.0 g/dL).Fresh frozen plasma was given if the INR exceeded1.5. Packed red blood cells were transfused to main-tain a hemoglobin value of �9 g/dL. Intraoperativeblood loss was recorded by measurement of bloodvolume in suction devices (cell saver).
Experimental Procedure
After the induction of anesthesia and achievement ofstable cardiovascular conditions, baseline values of he-modynamic data and intra- and extravascular thoracicvolumes were measured. All volumetric and pressure-derived variables were indexed to body-surface area toimprove interindividual comparisons. Volumetric andhemodynamic measurements were then obtained at sixstages in supine position during DLT:
1. MV: after the induction of anesthesia, with pa-tients mechanically ventilated.
2. CL1: during implantation of the first lung withone-lung ventilation and one-lung perfusionwith the contralateral PA cross-clamped.
3. REP1: after reperfusion of the first lung withdouble-lung ventilation and double-lung per-fusion.
4. CL2: during implantation of the second lungwith one-lung ventilation and one-lung perfu-sion of the transplanted lung, with the contralat-eral PA cross-clamped.
5. REP2: after reperfusion of the second lung withdouble-lung ventilation and double-lung per-fusion.
6. FIN: at the end of surgery.
The four stages during SLT were
1. MV: after the induction of anesthesia, with pa-tients mechanically ventilated in the supineposition.
2. CL1: during implantation of the lung with one-lung ventilation and one-lung perfusion with thecontralateral PA cross-clamped, in the lateral de-cubitus position.
3. REP1: after graft reperfusion with double-lungventilation and double-lung perfusion in the lat-eral decubitus position.
4. FIN: at the end of surgery in the supine position.
Because we performed each set of measurementsin a steady-state period—i.e., at least 15 min after achange in dosage of catecholamines, anesthetic in-fusion rate, or ventilator settings—it can be assumedthat relevant changes of myocardial inotropic statusor afterload did not occur during the study period.As a consequence, changes of stroke volume mustdepend on changes of cardiac preload, according tothe Frank-Starling law. Therefore, linear regressionanalysis was applied between changes of preload-dependent left ventricular SVIpa and the corre-sponding, presumably preload-indicating, variablesPAOP and ITBVI.
Statistical Analysis
All results are expressed as mean and sd unless indi-cated otherwise. All hemodynamic and volumetricdata obtained were analyzed with analysis of variancefor repeated measurements and paired Student’st-tests with Bonferroni’s post hoc test.
The correlations between the variables, as well ascorrelations between the changes (�) in these vari-ables, were studied with linear regression analysis.Changes in the variables were calculated by subtract-ing the first from the second measurement (�1 � CL1� MV), the second from the third (�2 � REP1 � CL1),the third from the fourth (�3 � CL2 � REP1), thefourth from the fifth (�4 � REP2 � CL2), and, finally,
ANESTH ANALG CARDIOVASCULAR ANESTHESIA DELLA ROCCA ET AL. 8372002;95:835–43 PRELOAD INDEX DURING LUNG TRANSPLANTATION
the fifth from the sixth (�5 � FIN � CL2). The rela-tionships between the two different preload variables(PAOP and ITBVI) and the SVIpa were also analyzedat each stage by linear regression.
CIart measurements are required for the calculationof the ITBVI. To verify the reliability and reproduc-ibility of CIart, all simultaneous measurements ofCIpa and CIart were compared. Agreement betweenCI measurements obtained by PAC and PiCCO sys-tem was analyzed by using the method suggestedby Bland and Altman (11). Bias between the meth-ods was calculated as the mean difference betweenCIart and CIpa. The upper and the lower limits ofagreement were calculated as bias � 2 sd and de-fined the range containing 95% of the differencesbetween the methods. The precision of the bias anal-ysis and limits of agreement were assessed with 95%confidence intervals.
All statistical analysis was computed by SAS (SASInstitute, Cary, NC) software (for Windows PC,
Version 6.01). Statistical significance was consideredto be at P � 0.05.
ResultsFifty-six consecutive patients (28 men and 28 women)receiving 42 DLTs (19 men and 23 women) and 14SLTs (9 men and 5 women) were enrolled in the study.Six DLT patients who required cardiopulmonary by-pass were excluded. Diseases leading to transplanta-tion were cystic fibrosis (36 DLT), bronchiectasis (3DLT), emphysema (7: 1 DLT and 6 SLT), fibrosis (7: 1DLT and 6 SLT), and obliterant bronchiolitis (redo) (3:1 DLT and 2 SLT). The mean age was 27.2 (9) yr and51.79 (9) yr, respectively, for DLT and SLT. The meananesthesia time was 617 (111) min for DLT and 436(124) min for SLT. Hemodynamic and volumetric dataare reported in Table 1.
Linear regression analysis revealed a significantcorrelation between ITBVI and SVIpa (r2 � 0.41,
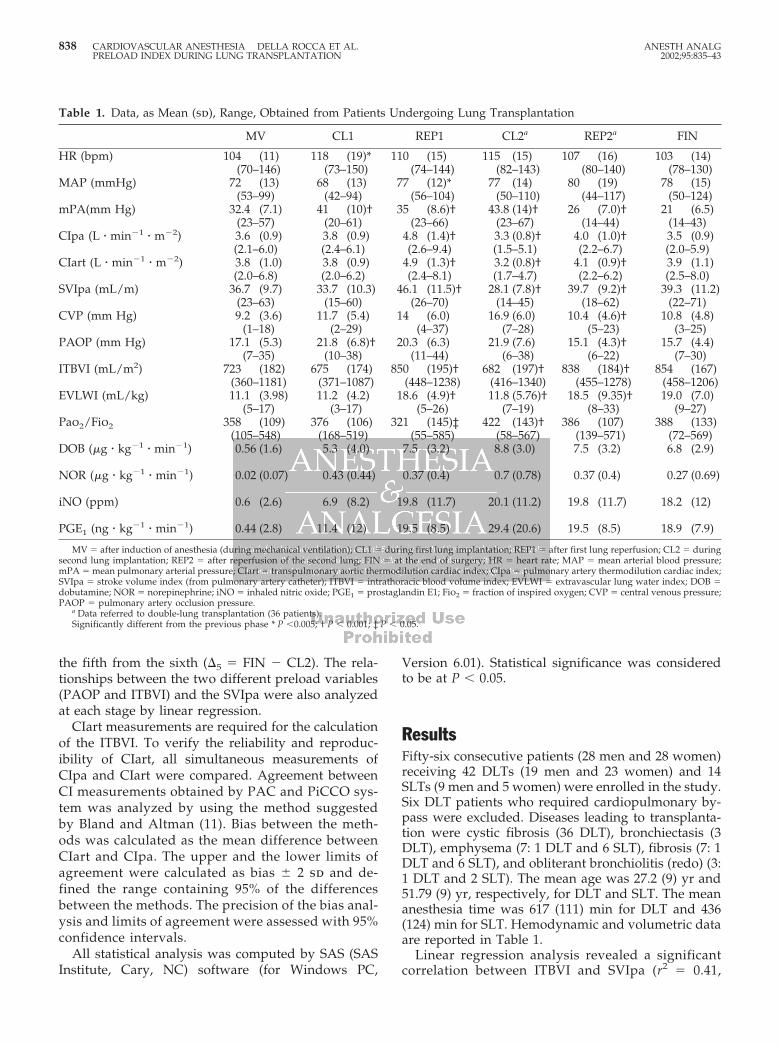
Table 1. Data, as Mean (sd), Range, Obtained from Patients Undergoing Lung Transplantation
MV CL1 REP1 CL2a REP2a FIN
HR (bpm) 104 (11) 118 (19)* 110 (15) 115 (15) 107 (16) 103 (14)(70–146) (73–150) (74–144) (82–143) (80–140) (78–130)
MAP (mmHg) 72 (13) 68 (13) 77 (12)* 77 (14) 80 (19) 78 (15)(53–99) (42–94) (56–104) (50–110) (44–117) (50–124)
mPA(mm Hg) 32.4 (7.1) 41 (10)† 35 (8.6)† 43.8 (14)† 26 (7.0)† 21 (6.5)(23–57) (20–61) (23–66) (23–67) (14–44) (14–43)
CIpa (L � min�1 � m�2) 3.6 (0.9) 3.8 (0.9) 4.8 (1.4)† 3.3 (0.8)† 4.0 (1.0)† 3.5 (0.9)(2.1–6.0) (2.4–6.1) (2.6–9.4) (1.5–5.1) (2.2–6.7) (2.0–5.9)
CIart (L � min�1 � m�2) 3.8 (1.0) 3.8 (0.9) 4.9 (1.3)† 3.2 (0.8)† 4.1 (0.9)† 3.9 (1.1)(2.0–6.8) (2.0–6.2) (2.4–8.1) (1.7–4.7) (2.2–6.2) (2.5–8.0)
SVIpa (mL/m) 36.7 (9.7) 33.7 (10.3) 46.1 (11.5)† 28.1 (7.8)† 39.7 (9.2)† 39.3 (11.2)(23–63) (15–60) (26–70) (14–45) (18–62) (22–71)
CVP (mm Hg) 9.2 (3.6) 11.7 (5.4) 14 (6.0) 16.9 (6.0) 10.4 (4.6)† 10.8 (4.8)(1–18) (2–29) (4–37) (7–28) (5–23) (3–25)
PAOP (mm Hg) 17.1 (5.3) 21.8 (6.8)† 20.3 (6.3) 21.9 (7.6) 15.1 (4.3)† 15.7 (4.4)(7–35) (10–38) (11–44) (6–38) (6–22) (7–30)
ITBVI (mL/m2) 723 (182) 675 (174) 850 (195)† 682 (197)† 838 (184)† 854 (167)(360–1181) (371–1087) (448–1238) (416–1340) (455–1278) (458–1206)
EVLWI (mL/kg) 11.1 (3.98) 11.2 (4.2) 18.6 (4.9)† 11.8 (5.76)† 18.5 (9.35)† 19.0 (7.0)(5–17) (3–17) (5–26) (7–19) (8–33) (9–27)
Pao2/Fio2 358 (109) 376 (106) 321 (145)‡ 422 (143)† 386 (107) 388 (133)(105–548) (168–519) (55–585) (58–567) (139–571) (72–569)
DOB (�g � kg�1 � min�1) 0.56 (1.6) 5.3 (4.0) 7.5 (3.2) 8.8 (3.0) 7.5 (3.2) 6.8 (2.9)
NOR (�g � kg�1 � min�1) 0.02 (0.07) 0.43 (0.44) 0.37 (0.4) 0.7 (0.78) 0.37 (0.4) 0.27 (0.69)
iNO (ppm) 0.6 (2.6) 6.9 (8.2) 19.8 (11.7) 20.1 (11.2) 19.8 (11.7) 18.2 (12)
PGE1 (ng � kg�1 � min�1) 0.44 (2.8) 11.4 (12) 19.5 (8.5) 29.4 (20.6) 19.5 (8.5) 18.9 (7.9)
MV � after induction of anesthesia (during mechanical ventilation); CL1 � during first lung implantation; REP1 � after first lung reperfusion; CL2 � duringsecond lung implantation; REP2 � after reperfusion of the second lung; FIN � at the end of surgery; HR � heart rate; MAP � mean arterial blood pressure;mPA � mean pulmonary arterial pressure; CIart � transpulmonary aortic thermodilution cardiac index; CIpa � pulmonary artery thermodilution cardiac index;SVIpa � stroke volume index (from pulmonary artery catheter); ITBVI � intrathoracic blood volume index; EVLWI � extravascular lung water index; DOB �dobutamine; NOR � norepinephrine; iNO � inhaled nitric oxide; PGE1 � prostaglandin E1; Fio2 � fraction of inspired oxygen; CVP � central venous pressure;PAOP � pulmonary artery occlusion pressure.
a Data referred to double-lung transplantation (36 patients).Significantly different from the previous phase * P �0.005; † P � 0.001; ‡ P � 0.05.
838 CARDIOVASCULAR ANESTHESIA DELLA ROCCA ET AL. ANESTH ANALGPRELOAD INDEX DURING LUNG TRANSPLANTATION 2002;95:835–43
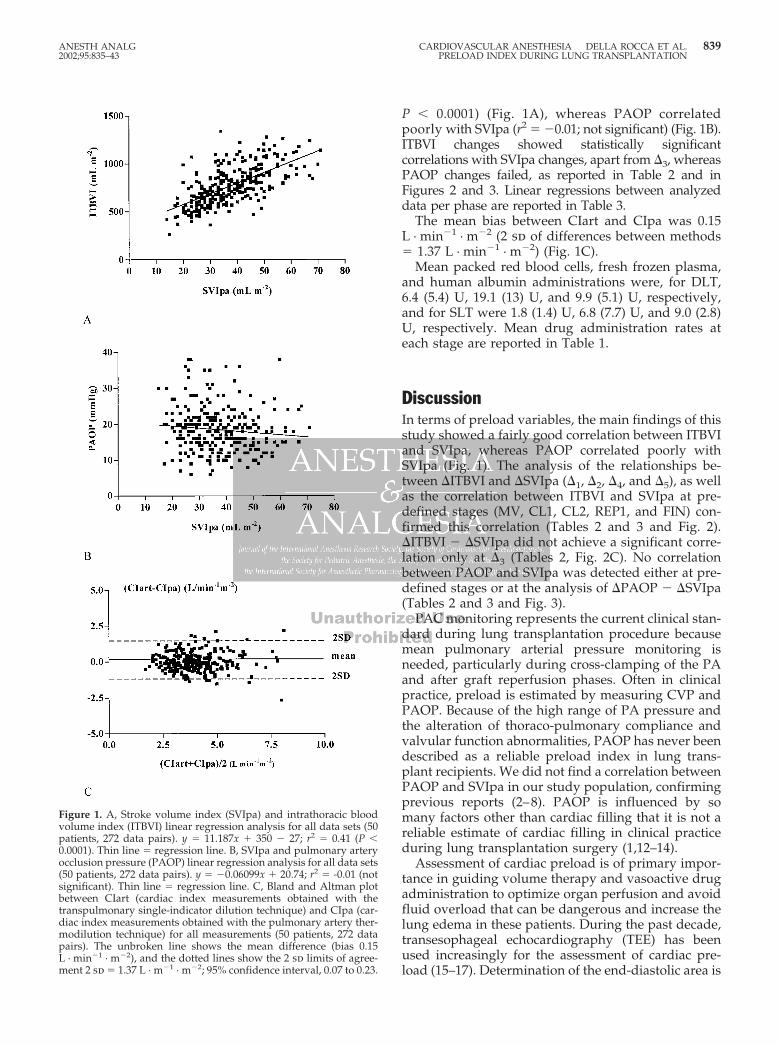
P � 0.0001) (Fig. 1A), whereas PAOP correlatedpoorly with SVIpa (r2 � �0.01; not significant) (Fig. 1B).ITBVI changes showed statistically significantcorrelations with SVIpa changes, apart from �3, whereasPAOP changes failed, as reported in Table 2 and inFigures 2 and 3. Linear regressions between analyzeddata per phase are reported in Table 3.
The mean bias between CIart and CIpa was 0.15L · min�1 · m�2 (2 sd of differences between methods� 1.37 L · min�1 · m�2) (Fig. 1C).
Mean packed red blood cells, fresh frozen plasma,and human albumin administrations were, for DLT,6.4 (5.4) U, 19.1 (13) U, and 9.9 (5.1) U, respectively,and for SLT were 1.8 (1.4) U, 6.8 (7.7) U, and 9.0 (2.8)U, respectively. Mean drug administration rates ateach stage are reported in Table 1.
DiscussionIn terms of preload variables, the main findings of thisstudy showed a fairly good correlation between ITBVIand SVIpa, whereas PAOP correlated poorly withSVIpa (Fig. 1). The analysis of the relationships be-tween �ITBVI and �SVIpa (�1, �2, �4, and �5), as wellas the correlation between ITBVI and SVIpa at pre-defined stages (MV, CL1, CL2, REP1, and FIN) con-firmed this correlation (Tables 2 and 3 and Fig. 2).�ITBVI � �SVIpa did not achieve a significant corre-lation only at �3 (Tables 2, Fig. 2C). No correlationbetween PAOP and SVIpa was detected either at pre-defined stages or at the analysis of �PAOP � �SVIpa(Tables 2 and 3 and Fig. 3).
PAC monitoring represents the current clinical stan-dard during lung transplantation procedure becausemean pulmonary arterial pressure monitoring isneeded, particularly during cross-clamping of the PAand after graft reperfusion phases. Often in clinicalpractice, preload is estimated by measuring CVP andPAOP. Because of the high range of PA pressure andthe alteration of thoraco-pulmonary compliance andvalvular function abnormalities, PAOP has never beendescribed as a reliable preload index in lung trans-plant recipients. We did not find a correlation betweenPAOP and SVIpa in our study population, confirmingprevious reports (2–8). PAOP is influenced by somany factors other than cardiac filling that it is not areliable estimate of cardiac filling in clinical practiceduring lung transplantation surgery (1,12–14).
Assessment of cardiac preload is of primary impor-tance in guiding volume therapy and vasoactive drugadministration to optimize organ perfusion and avoidfluid overload that can be dangerous and increase thelung edema in these patients. During the past decade,transesophageal echocardiography (TEE) has beenused increasingly for the assessment of cardiac pre-load (15–17). Determination of the end-diastolic area is
Figure 1. A, Stroke volume index (SVIpa) and intrathoracic bloodvolume index (ITBVI) linear regression analysis for all data sets (50patients, 272 data pairs). y � 11.187x � 350 � 27; r2 � 0.41 (P �0.0001). Thin line � regression line. B, SVIpa and pulmonary arteryocclusion pressure (PAOP) linear regression analysis for all data sets(50 patients, 272 data pairs). y � �0.06099x � 20.74; r2 � -0.01 (notsignificant). Thin line � regression line. C, Bland and Altman plotbetween CIart (cardiac index measurements obtained with thetranspulmonary single-indicator dilution technique) and CIpa (car-diac index measurements obtained with the pulmonary artery ther-modilution technique) for all measurements (50 patients, 272 datapairs). The unbroken line shows the mean difference (bias 0.15L · min�1 · m�2), and the dotted lines show the 2 sd limits of agree-ment 2 sd � 1.37 L · m�1 · m�2; 95% confidence interval, 0.07 to 0.23.
ANESTH ANALG CARDIOVASCULAR ANESTHESIA DELLA ROCCA ET AL. 8392002;95:835–43 PRELOAD INDEX DURING LUNG TRANSPLANTATION
a measure of left ventricular filling and correlates wellwith changes in SVI during volume therapy or gradedblood withdrawal in different studies (17,18). TEE hasbecome a common component of the perioperativecare of surgical patients for many anesthesiologists.Standards for training are not yet universal, and doc-umentation patterns still fall short of practice guide-lines (19). Currently, only 52% of anesthesiologistsperform intraoperative TEE examinations at their in-stitution, while 72% of Society of Cardiovascular An-esthesiologists (SCA) members who worked in an in-stitution where the TEE was used during surgeryreported that they personally used TEE during theiranesthetic care (19). The dependence on operator ex-perience and the high cost limits its application intoclinical practice, although routine use of TEE monitor-ing during lung transplantation has been recom-mended (1).
Indicator dilution-derived ITBVI has been sug-gested as a sensitive indicator of cardiac preload, be-cause volume changes preferentially alter the volumein the intrathoracic compartment, which serves as theprimary reservoir for the left ventricle (2–8,15,16).There has been a lack of controlled studies that focuson the relationship between preload pressure (PAOP)and volume (ITBVI) data and SVIpa during lungtransplantation surgery. In the transplant setting, theonly study that focused on preload was performed byGodje et al. (20) with the transpulmonary thermal dyedilution technique during heart transplantation,where ITBVI changes were significantly correlatedwith changes in the SVI (r � 0.65) and CVP and PAOPdid not have a significant correlation (r � �0.23 and r� �0.06, respectively). Few articles have been pub-lished regarding single-indicator technique validationwith respect to the double-indicator method, wherethey correlated well (10,21). This is the first study
during anesthesia for lung transplantation that inves-tigated preload index as ITBVI with the single-indicator thermodilution technique.
Our results are in agreement with previous reports inother fields that showed a fairly good correlation be-tween ITBVI and SVIpa (Fig. 1) (3,5,6,8,15,16). Becausethe estimation of ITBVI by the single-indicator dilutiontechnique is partially based on cardiac output, concernshave been raised about a potential mathematical cou-pling of ITBVI and CI data, which might also haveinfluenced the observed correlation between these vari-ables in our study (22,23). McLuckie and Bihari (22),investigating the relationship between ITBVI andCI, concluded that under euvolemic conditions, in-creasing CI by increasing inotropic support does notalter ITBVI significantly, thus demonstrating that thetwo measurements are not mathematically coupled.
The limitations of the single-thermodilution tech-nique are similar to those of the double-indicator tech-nique. Volume will be overestimated in the presenceof large aortic aneurysm or catheters placed too farperipherally (i.e., in the radial or bronchial artery)because of a prolonged MTt. Furthermore, intracar-diac shunts may limit the use of this technique.
The investigation of preload data was completedwith the measurements of CIart that have been vali-dated by a direct comparison to standard CIpa. Ourresults showed a close agreement between CIart andCIpa, supporting other authors’ findings (24,25). Thelevel of agreement and precision remained constantthroughout the study and also during the cross-clamping and reperfusion phases, when surgical heartmanipulation and thermal variation occurred.
In conclusion, ITBVI and PAOP comparison withrespect to SVIpa showed that ITBVI seems to be afair indicator of cardiac preload, and perhaps supe-rior to PAOP, during lung transplantation. Assess-ment of CIart is a less invasive, valid option for CI
Table 2. Coefficient of Correlation for Changes (�) of Preload Variables (ITBVI and PAOP) with SVIpa and Level ofSignificance
�1 r2 P value �2 r2 P
�ITBVI � �SVIpa 0.30 0.0002 �ITBVI � �SVIpa 0.57 0.0001�PAOP � �SVIpa 0.0001 NS �PAOP � �SVIpa 0.0001 NS
�3 r2 P value �4 r2 P value
�ITBVI � �SVIpa 0.08 NS �ITBVI � �SVIpa 0.26 0.003�PAOP � �SVIpa 0.12 NS �PAOP � �SVIpa 0.04 NS
�5 r2 P value
�ITBVI � �SVIpa 0.67 0.0001�PAOP � �SVIpa �0.063 NS
NS � not significant; ITBVI � intrathoracic blood volume index; PAOP � pulmonary artery occlusion pressure; SVIpa � stroke volume index (frompulmonary artery catheter).
�1 � CL1 � MV; �2 � REP1 � CL1; �3 � CL2 � REP1; �4 � REP2 � CL2; �5 � FIN � CL2.MV � after induction of anesthesia (during mechanical ventilation); CL1 � during first lung implantation; REP1 � after first lung reperfusion; CL2 � during
second lung implantation; REP2 � after reperfusion of the second lung; FIN � at the end of surgery.
840 CARDIOVASCULAR ANESTHESIA DELLA ROCCA ET AL. ANESTH ANALGPRELOAD INDEX DURING LUNG TRANSPLANTATION 2002;95:835–43
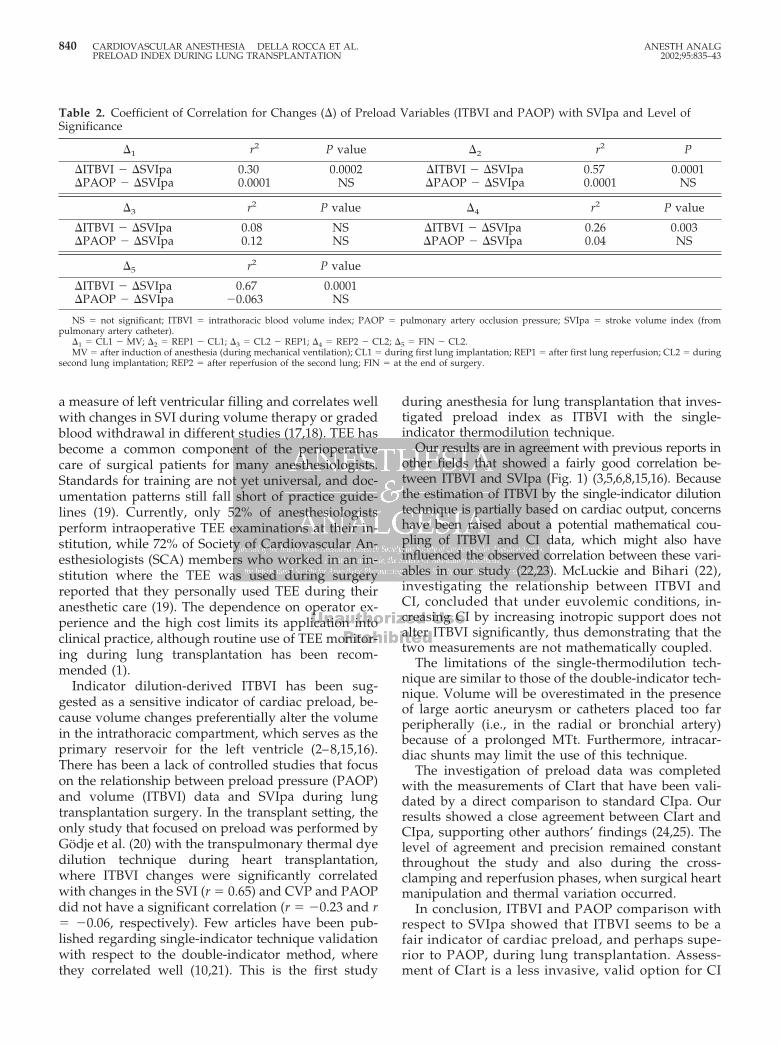
Figure 2. Linear regression analysis between stroke volume index (SVI) changes and intrathoracic blood volume index (ITBVI) changes. A,�1 (y � 11.903x � 7.8414; r2 � 0.30; P � 0.0002); B, �2 (y � 9.8614x � 62.179; r2 � 0.57; P � 0.0001); C, �3 (y � 4.8777x � 63.016; r2 � 0.08;not significant); D, �4 (y � 11.862x � 47.207; r2 � 0.26; P � 0.0031); and E, �5 (y � 12.856x � 3.8556; r2�0.67; P � 0.0001). Thin line �regression line.
ANESTH ANALG CARDIOVASCULAR ANESTHESIA DELLA ROCCA ET AL. 8412002;95:835–43 PRELOAD INDEX DURING LUNG TRANSPLANTATION
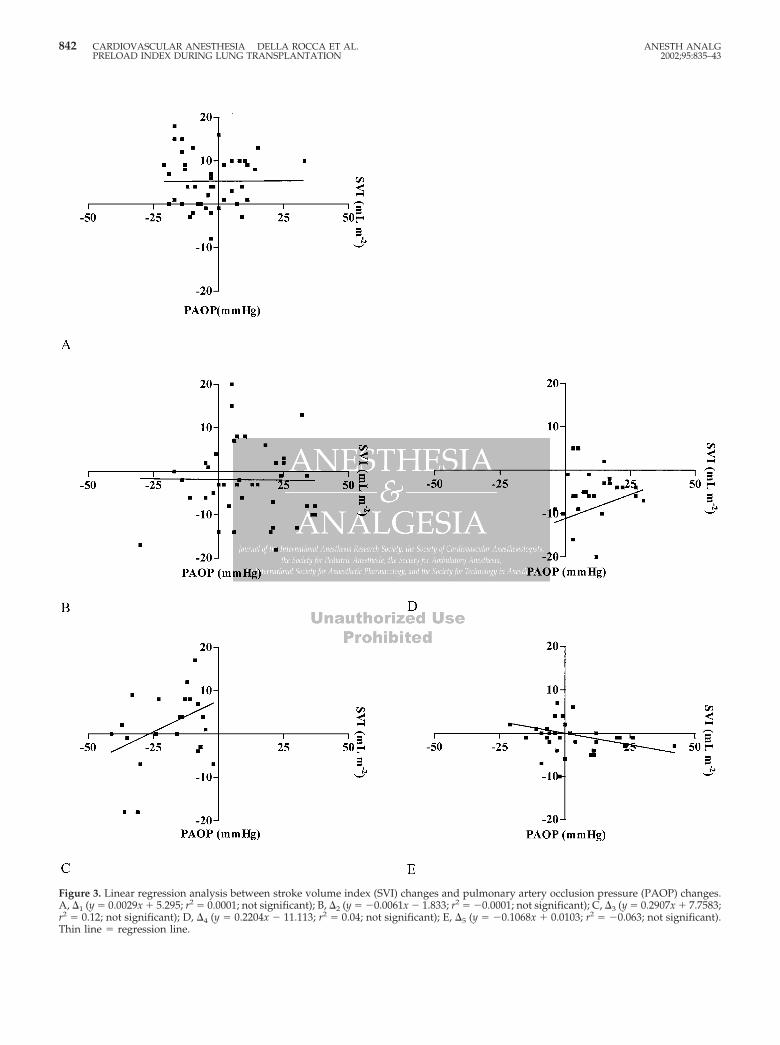
Figure 3. Linear regression analysis between stroke volume index (SVI) changes and pulmonary artery occlusion pressure (PAOP) changes.A, �1 (y � 0.0029x � 5.295; r2 � 0.0001; not significant); B, �2 (y � �0.0061x � 1.833; r2 � �0.0001; not significant); C, �3 (y � 0.2907x � 7.7583;r2 � 0.12; not significant); D, �4 (y � 0.2204x � 11.113; r2 � 0.04; not significant); E, �5 (y � �0.1068x � 0.0103; r2 � �0.063; not significant).Thin line � regression line.
842 CARDIOVASCULAR ANESTHESIA DELLA ROCCA ET AL. ANESTH ANALGPRELOAD INDEX DURING LUNG TRANSPLANTATION 2002;95:835–43
monitoring compared with PAC. Although PAC ishelpful during lung transplantation to monitor PApressure, we conclude that the PiCCO System is auseful tool to provide more information on effectiveintravascular volume status.
References1. Singh H, Bossard RF. Perioperative anaesthetic consideration
for patients undergoing lung transplantation. Can J Anaesth1997;44:284–99.
2. Lichtwarck-Aschoff M, Zeravick J, Pfeiffer UJ. Intrathoracicblood volume accurately reflects circulatory volume status incritically ill patients with mechanical ventilation. Intensive CareMed 1992;18:142–7.
3. Hoeft A, Schorn B, Weiland A, et al. Bedside assessment ofintravascular volume status in patients undergoing coronarybypass surgery. Anesthesiology 1994;81:76–86.
4. Godje O, Peyerl M, Seebauer T, et al. Central venous pressure,pulmonary capillary wedge pressure and intrathoracic bloodvolumes as preload indicators in cardiac surgery patients. EurJ Cardiothorac Surg 1998;18:533–9.
5. Sakka SG, Bredle DL, Reinhart K, Meier-Hellmann A. Compar-ison between intrathoracic blood volume and cardiac fillingpressures in the early phase of hemodynamic instability ofpatients with sepsis or septic shock. J Crit Care 1999;14:78–83.
6. Bindels AJ, van der Hoeven JG, Graafland AD, et al. Relation-ships between volume and pressure measurements and strokevolume in critically ill patients. Crit Care 2000;4:193–9.
7. Holm C, Melcer B, Hobrand F, et al. Intrathoracic blood volumeas an end-point in resuscitation of the severely burned: anobservational study of 24 patients. J Trauma 2000;48:728–34.
8. Weisenack C, Prasser C, Keyl C, Rodig G. Assessment of in-trathoracic blood volume as an indicator of cardiac preload:single transpulmonary thermodilution technique versus assess-ment of preload parameters derived from a pulmonary arterycatheter. J Cardiothorac Vasc Anesth 2001;15:584–8.
9. Weyland A, Buhre W, Hoeft A, et al. Application of transpul-monary double indicator dilution method for post-operativeassessment of cardiac index, pulmonary vascular resistance in-dex, and extra vascular lung water in children undergoing totalcavo-pulmonary anastomosis: preliminary results in six pa-tients. J Cardiothorac Vasc Anesth 1994;8:636–41.
10. Sakka SG, Ruhl CC, Pfeiffer UJ, et al. Assessment of cardiacpreload and extravascular lung water by single transpulmonarythermodilution. Intensive Care Med 2000;26:180–7.
11. Bland JM, Altman DG. Statistical methods for assessing agree-ment between two methods of clinical measurements. Lancet1986;1:307–10.
12. Gershan JA. Effects of positive end-expiratory pressure on pul-monary capillary wedge pressure. Heart Lung 1983;12:143–8.
13. Zarins CK, Virgilio RW, Smith DE, Peters RM. The effects ofvascular volume on positive end-expiratory pressure inducedcardiac output depression and wedge-left atrial pressure dis-crepancy. J Surg Res 1977;23:348–60.
14. Wittnich C, Trudel J, Zidulka A, Chiu RC-J. Misleading “pul-monary wedge pressure” after pneumonectomy: its impor-tance in postoperative fluid therapy. Ann Thorac Surg 1986;42:192– 6.
15. Hinder F, Poelaert JI, Schmidt C, et al. Assessment of cardio-vascular volume status by transoesophageal echocardiographyand dye dilution during cardiac surgery. Eur J Anaesthesiol1998;15:633–40.
16. Buhre W, Buhre K, Kazmaier S, et al. Assessment of cardiacpreload by indicator dilution and transesophageal echocardiog-raphy. Eur J Anaesthesiol 2001;18:662–7.
17. Tousignant CP, Walsh F, Mazer CD. The use of TEE for preloadassessment in critically ill patients. Anesth Analg 2000;90:351–5.
18. Swenson JD, Harkin C, Pace NL, et al. Transesophagealechocardiography: an objective tool in defining maximum ven-tricular response to intravenous fluid therapy. Anesth Analg1996;83:1149–53.
19. Morewood GH, Gallagher ME, Gaughan JP, Conlay LA. Currentpractice patterns for adult perioperative transesophageal echo-cardiography in the United States. Anesthesiology 2001;95:1507–12.
20. Godje O, Seebauer T, Peyerl M, et al. Hemodynamic monitoringby double-indicator dilution technique in patients after ortho-topic heart transplantation. Chest 2000;118:775–81.
21. Buhre W, Bendyk K, Weyland A, et al. Assessment of intratho-racic blood volume: thermo-dye dilution technique vs singlethermodilution technique. Anaesthesist 1998;47:51–3.
22. McLuckie A, Bihari D. Investigating the relationship betweenintrathoracic blood volume index and cardiac index. IntensiveCare Med 2000;26:1376–8.
23. Buhre W, Kazmaier S, Sonntag H, Weyland A. Changes incardiac output and intrathoracic blood volume: a mathematicalcoupling of data? Acta Anaesthesiol Scand 2001;45:863–7.
24. Sakka SG, Reinhart K, Meier Hellmann A. Comparison of pul-monary artery and arterial thermodilution cardiac output incritically ill patients. Intensive Care Med 1999;25:843–6.
25. Godje O, Hoeke K, Lichtwarck-Aschoff M, et al. Continuouscardiac output by femoral arterial thermodilution calibratedpulse contour analysis: comparison with pulmonary arterialthermodilution. Crit Care Med 1999;27:2407–12.
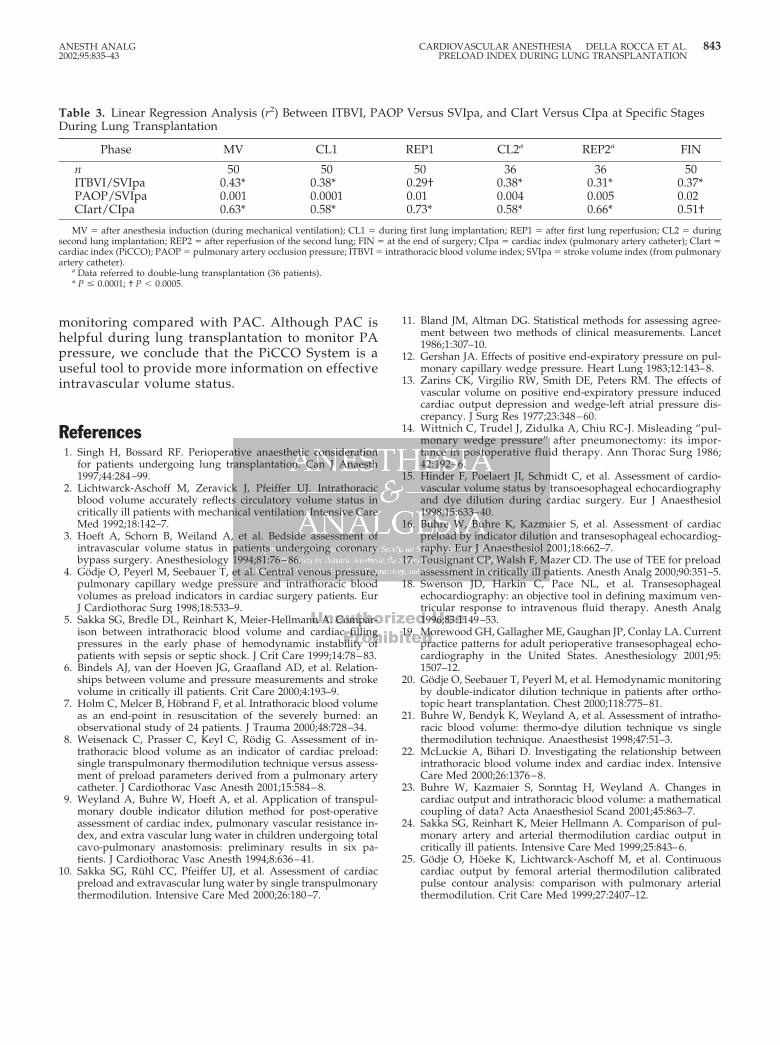
Table 3. Linear Regression Analysis (r2) Between ITBVI, PAOP Versus SVIpa, and CIart Versus CIpa at Specific StagesDuring Lung Transplantation
Phase MV CL1 REP1 CL2a REP2a FIN
n 50 50 50 36 36 50ITBVI/SVIpa 0.43* 0.38* 0.29† 0.38* 0.31* 0.37*PAOP/SVIpa 0.001 0.0001 0.01 0.004 0.005 0.02CIart/CIpa 0.63* 0.58* 0.73* 0.58* 0.66* 0.51†
MV � after anesthesia induction (during mechanical ventilation); CL1 � during first lung implantation; REP1 � after first lung reperfusion; CL2 � duringsecond lung implantation; REP2 � after reperfusion of the second lung; FIN � at the end of surgery; CIpa � cardiac index (pulmonary artery catheter); CIart �cardiac index (PiCCO); PAOP � pulmonary artery occlusion pressure; ITBVI � intrathoracic blood volume index; SVIpa � stroke volume index (from pulmonaryartery catheter).
a Data referred to double-lung transplantation (36 patients).* P � 0.0001; † P � 0.0005.
ANESTH ANALG CARDIOVASCULAR ANESTHESIA DELLA ROCCA ET AL. 8432002;95:835–43 PRELOAD INDEX DURING LUNG TRANSPLANTATION